

Sample Category Title
USD/CHF Weekly Outlook
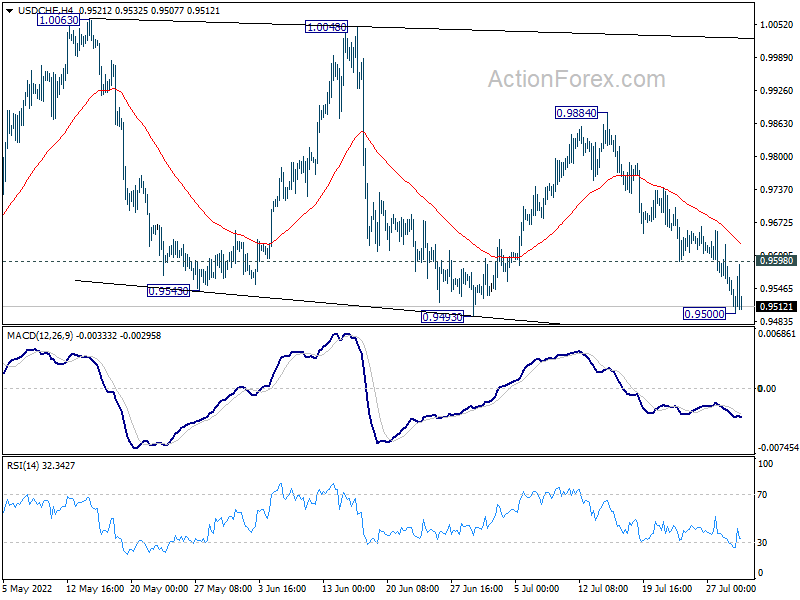
USD/CHF dropped further to as low as 0.9500 last week. Further fall cannot be ruled out. But price actions from 1.0063 high are still viewed as a consolidation pattern. Hence, strong support should be seen from 0.9471 resistance turned support to bring rebound. On the upside, above 0.9598 minor resistance will turn bias back to the upside for recovery towards 55 day EMA (now at 0.9663) and above. However, sustained break of 0.9471 will carry larger bearish implication and target 0.9193 support next.
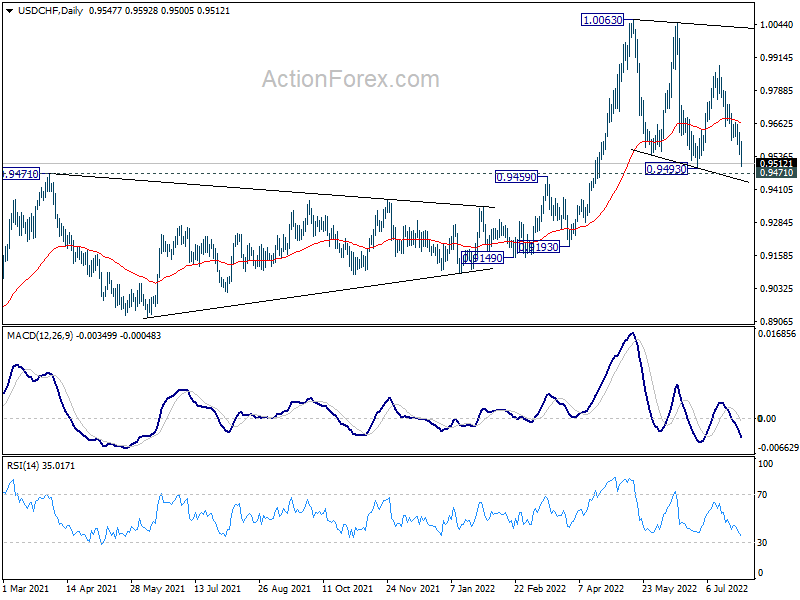
In the bigger picture, medium term up trend from 0.8756 (2021 low) is still in progress. On resumption, next target is 1.0342 (2016 high). Sustained break there will resume long term up trend from 0.7065 (2011 low). This will remain the favored case as long as 0.9471 resistance turned support holds. However, firm break of 0.9471 will raise the chance that such up trend is over.
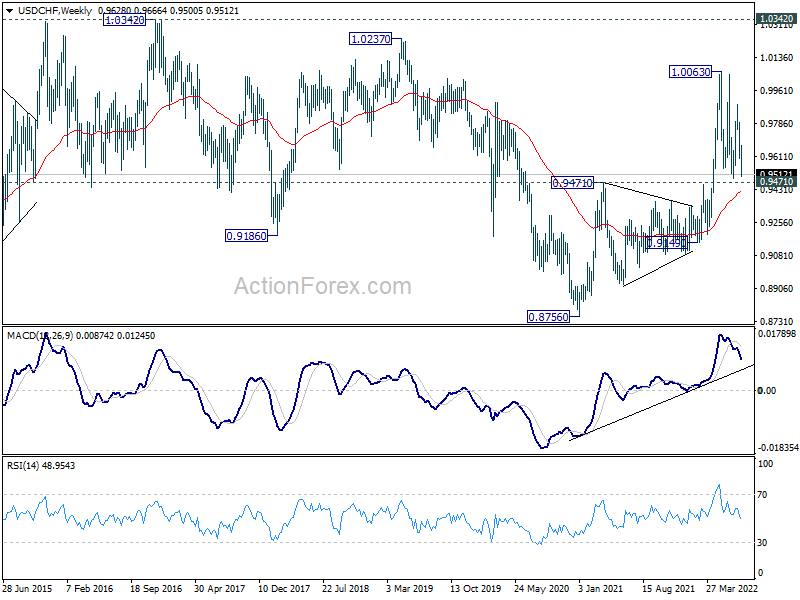
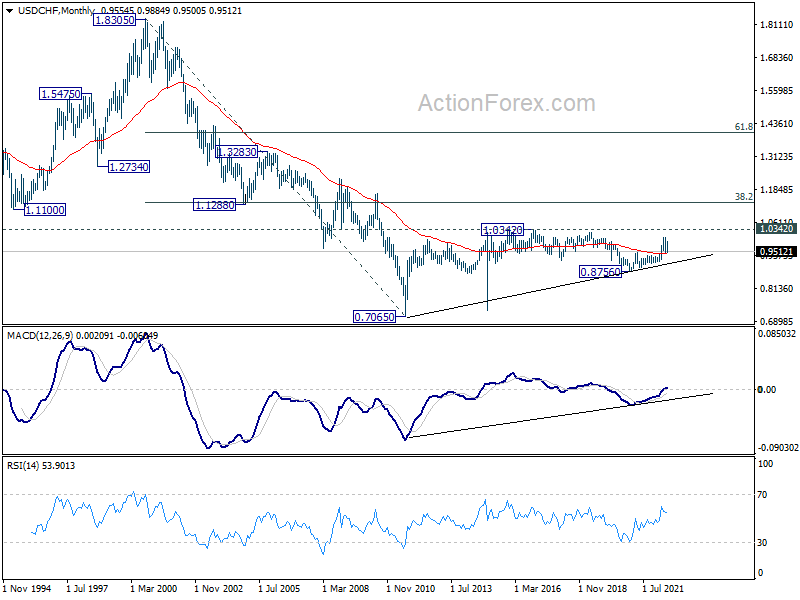
In the long term picture, current development argues that the correction from 1.0342 (2016 high) has completed at 0.8756 (2020 low) already. Rise from 0.7065 (2011 low) might be ready to resume. Firm break of 1.0342 will confirm and target 38.2% retracement of 1.8305 (2000 high) to 0.7065 at 1.1359. However, sustained break of 0.9471 resistance turned support will argue that long term sideway trading from 1.0342 is still extending.
AUD/USD Weekly Outlook
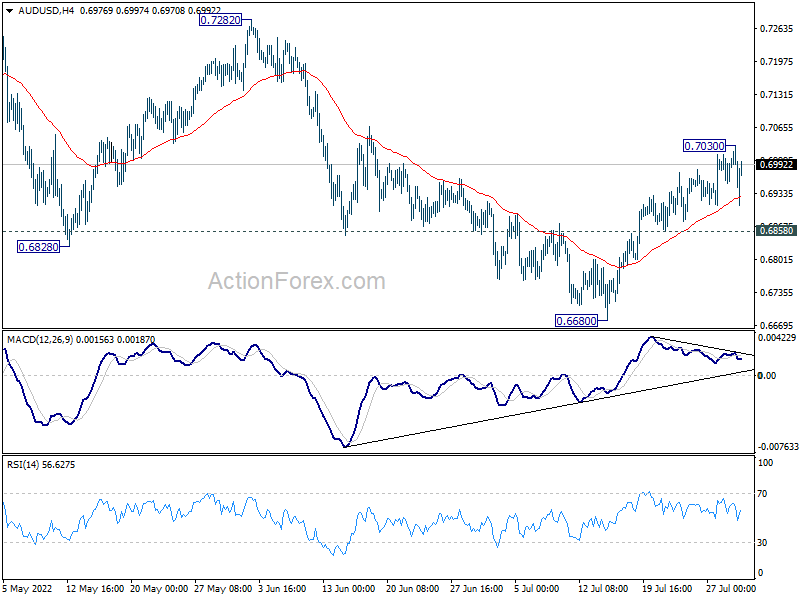
AUD/USD's rebound form 0.6680 short term bottom extended higher last week. As a temporary top was formed at 0.7030, initial bias is turned neutral first. On the upside, break of 0.7030 will resume the rebound to 0.7282 key resistance next. On the downside, however, break of 0.6858 minor support will argue that the rebound from 0.6910 is over. Intraday bias will then be back on the downside for retesting 0.6680 low.
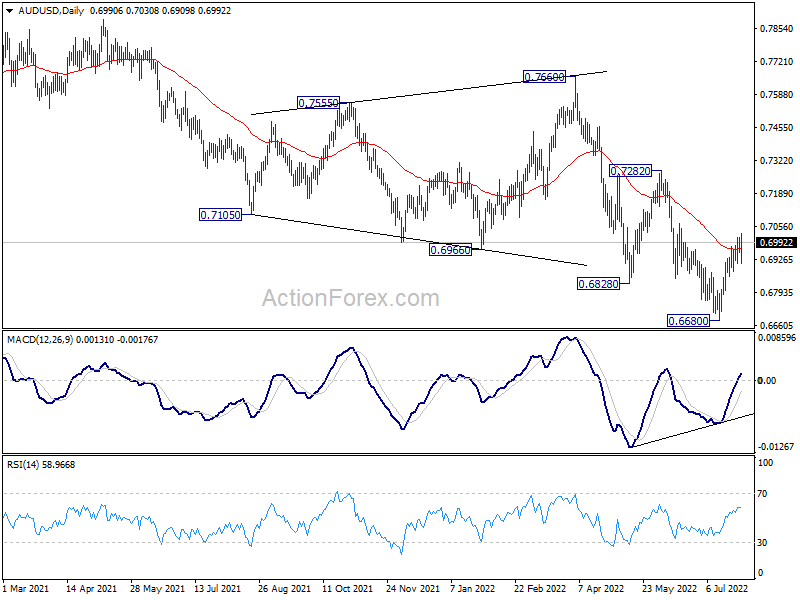
In the bigger picture, price actions from 0.8006 (2021 high) could still be a corrective pattern to rise from 0.5506 (2020 low). But current downside acceleration, as seen in weekly MACD), is raising the chance that it's a bearish impulsive move. In either case, outlook will remain bearish as long as 0.7282 resistance holds. Next target is 61.8% retracement of 0.5506 to 0.8006 at 0.6461.
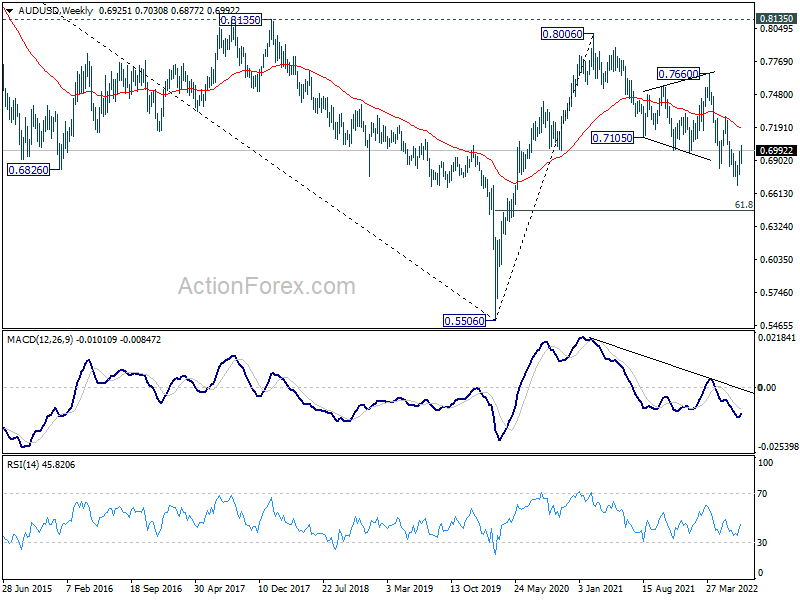
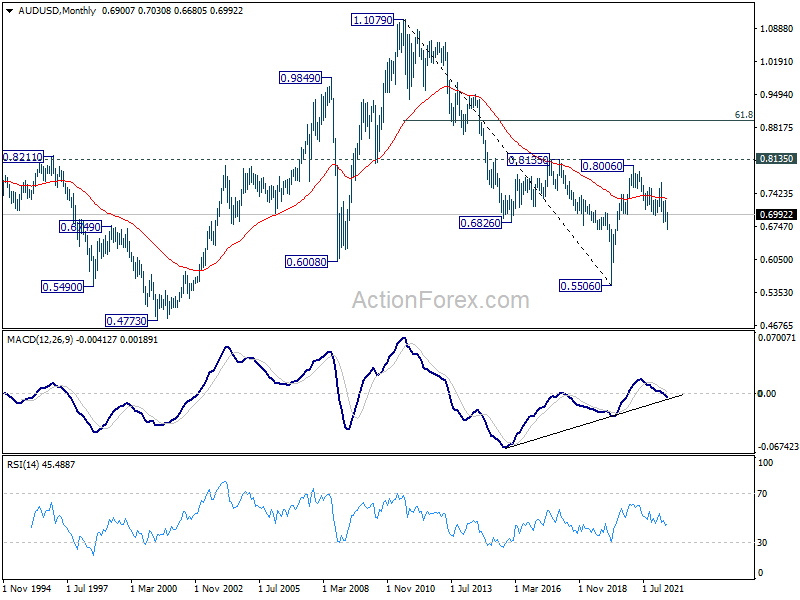
In the long term picture, rejection by 0.8135 resistance suggests that the long term down trend from 1.1079 (2011 high) is not ready to reverse. Yet, the structure of the fall from 0.8006 still argues that it's a corrective move. Hence, break of 0.5506 low is not envisaged for now. The long term outlook stays neutral first, and will be reassessed later after the fall from 0.8006 completes.
USD/CAD Weekly Outlook
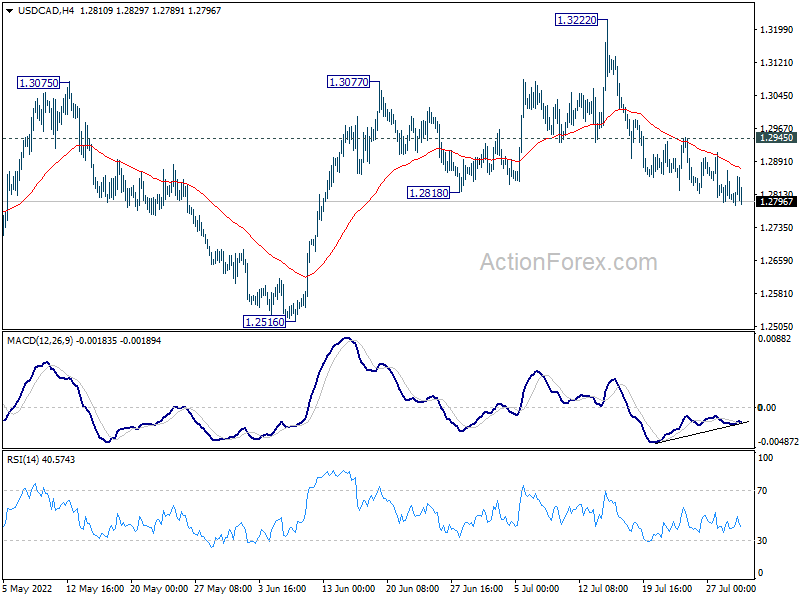
USD/CAD's decline from 1.3222 continued last week and broke through 1.2818 support. Initial bias stays on the downside this week for 1.2516 key support. On the upside, above 1.2945 minor resistance will revive near term bullishness, and turn bias back to the upside for retesting 1.3222 instead.
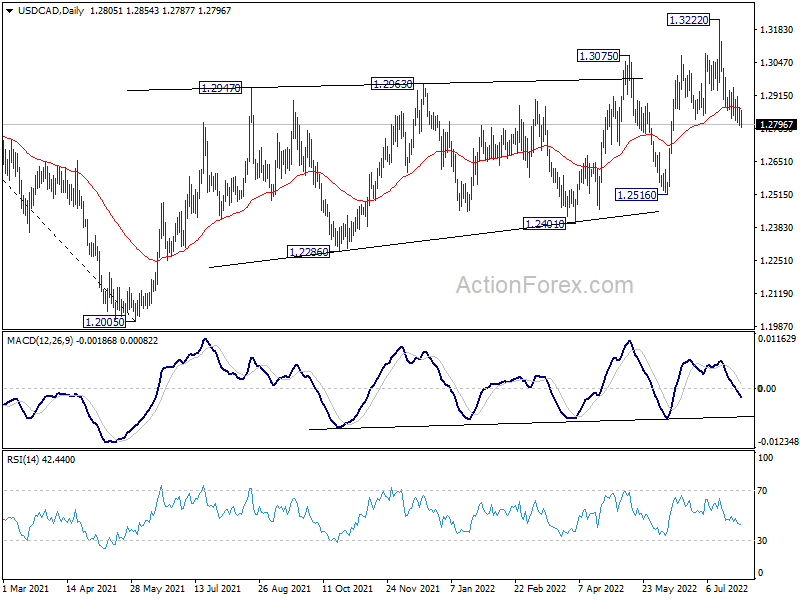
In the bigger picture, down trend from 1.4667 (2020 high) should have completed at 1.2005, after defending 1.2061 long term cluster support. Rise from there should target 61.8% retracement of 1.4667 to 1.2005 (2021 low) at 1.3650. This will remain the favored case now as long as 1.2516 support holds.
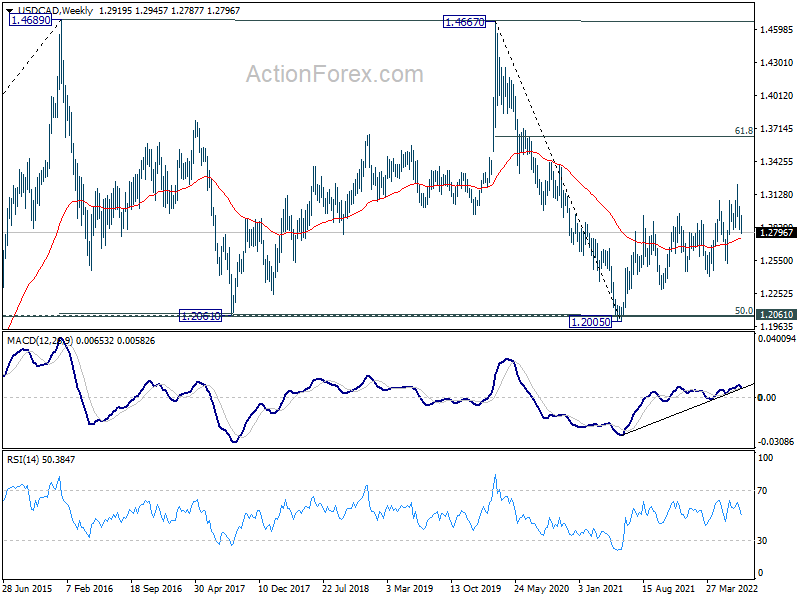
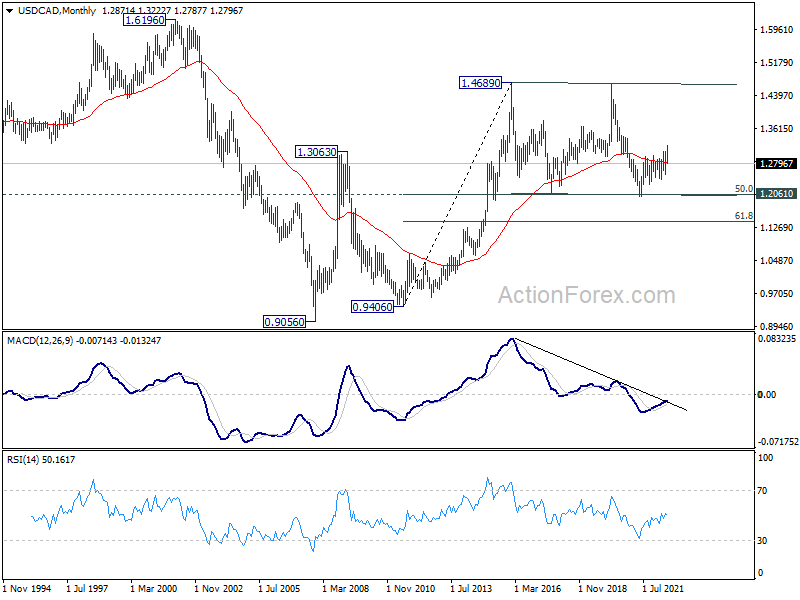
In the longer term picture, price actions from 1.4689 (2016 high) are seen as a consolidation pattern only. That is, up trend from 0.9506 (2007 low) is still expected to resume at a later stage. This will remain the favored case as long as 1.2061 support holds, which is close to 50% retracement of 0.9406 to 1.4689 at 1.2048.
GBP/JPY Weekly Outlook
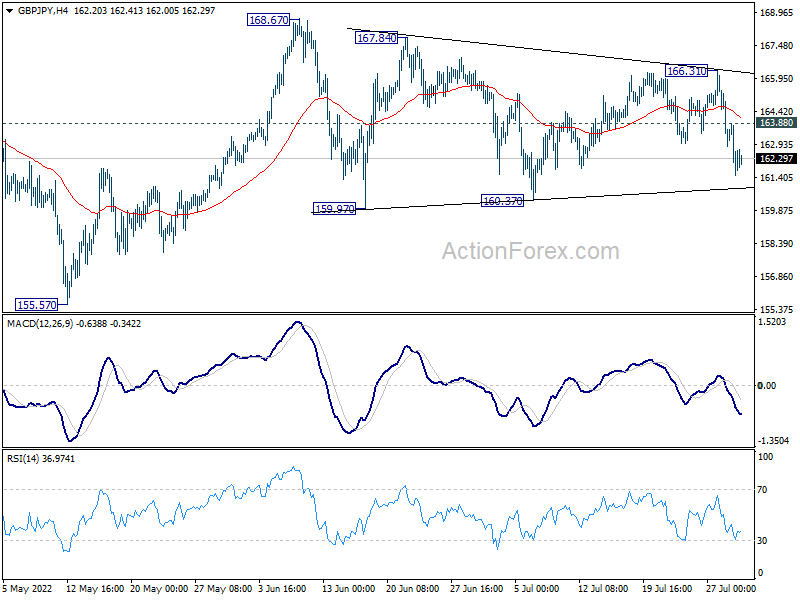
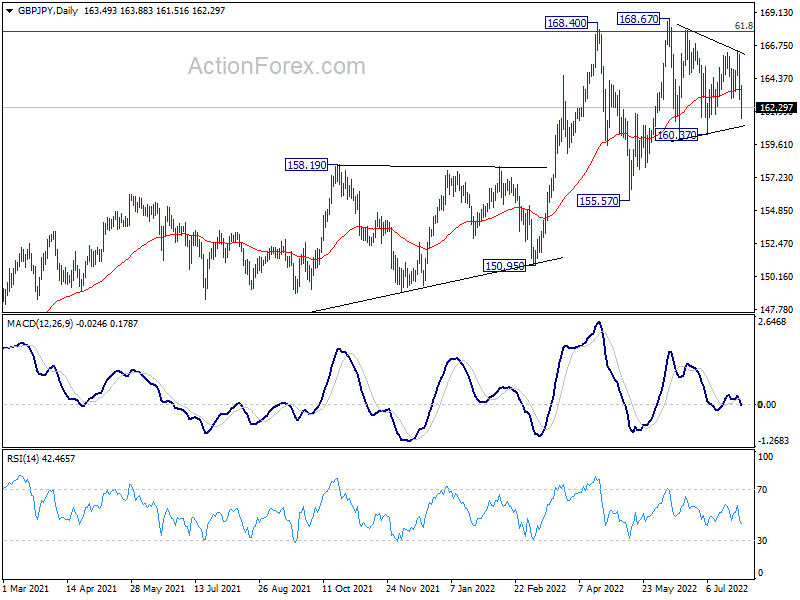
Range trading continued in GBP/JPY last week, with decline from 166.31 as another falling leg. Initial bias stays on the downside this week for 160.37 support. Decisive break there will argue that deeper fall is underway towards 155.57 support next. On the upside, though, break of 163.88 minor resistance will turn intraday bias neutral again first.
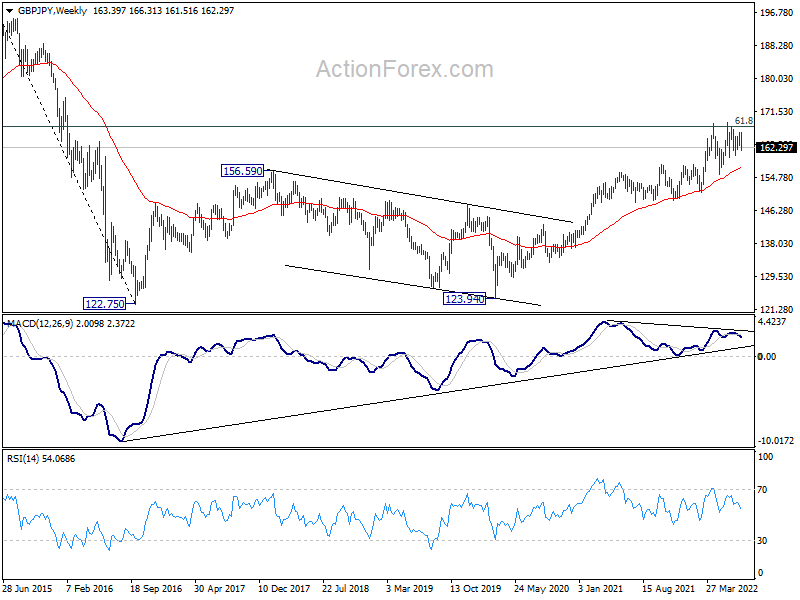
In the bigger picture, up trend from 123.94 (2020 low) is still in progress. Sustained break of 61.8% retracement of 195.86 (2015 high) to 122.75 (2016 low) at 167.93 will be a long term bullish signal, and could pave the way back to 195.86 high. This will now remain the favored case as long as 155.57 support holds, even in case of deep pull back.
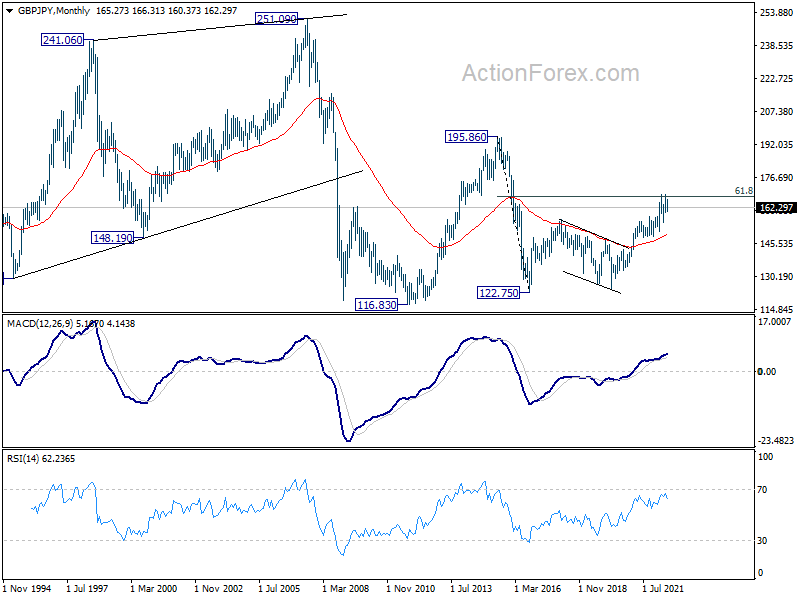
In the longer term picture, rise from 122.75 could be the third leg the the pattern from 116.83 (2011 low). Further rise will remain in favor as long as 55 month EMA (now at 149.84) holds. Sustained break of 61.8% retracement of 195.86 to 122.75 at 167.93. will pave the way to 195.86 (2015 high).
EUR/JPY Weekly Outlook
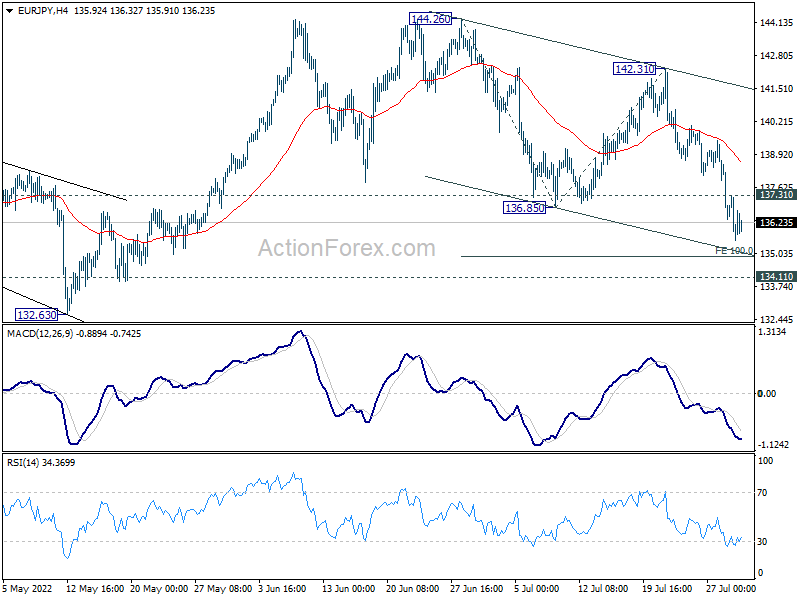
EUR/JPY's fall form 144.26 resumed last week and hit as low as 135.53. Initial bias stays on the downside for 100% projection of 144.26 to 136.85 from 142.31 at 134.90, and possibly below. Strong support should be seen above 134.11 to complete the correction. On the upside, above 137.31 minor resistance will turn intraday bias neutral first.
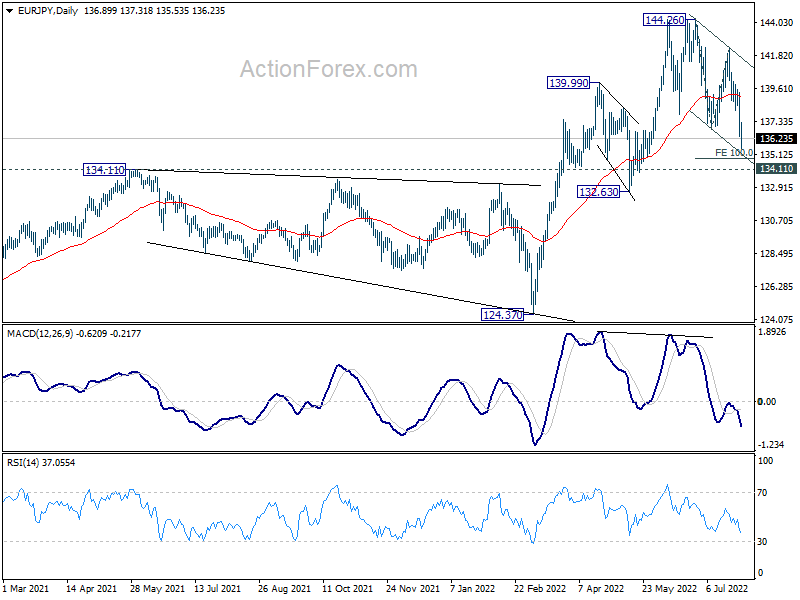
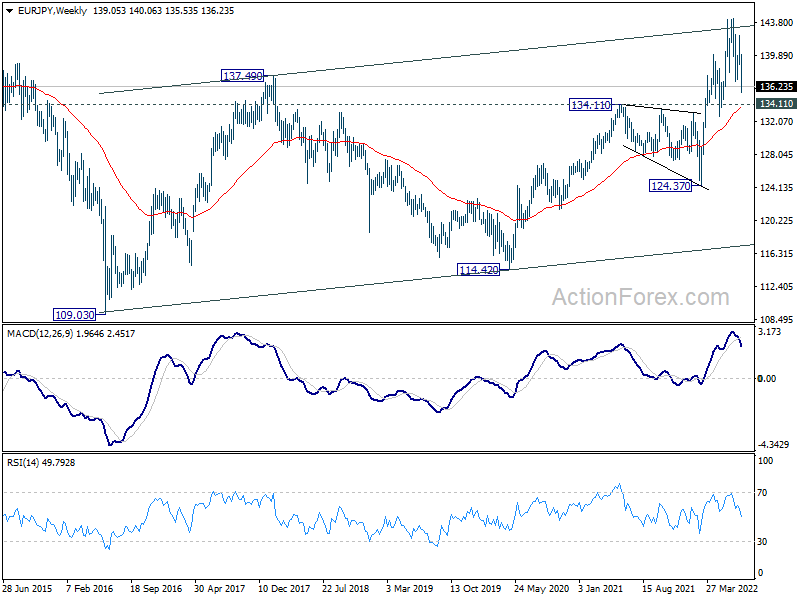
In the bigger picture, up trend from 114.42 (2020 low) is seen as the third leg of the pattern from 109.30 (2016 low). Further rally is in favor as long as 134.11 resistance turned support holds, even in case of deep pull back. Next target is 149.76 (2015 high). However, sustained break of 134.11 will be a sign of medium term bearish reversal and turn focus to 124.37 support for confirmation.
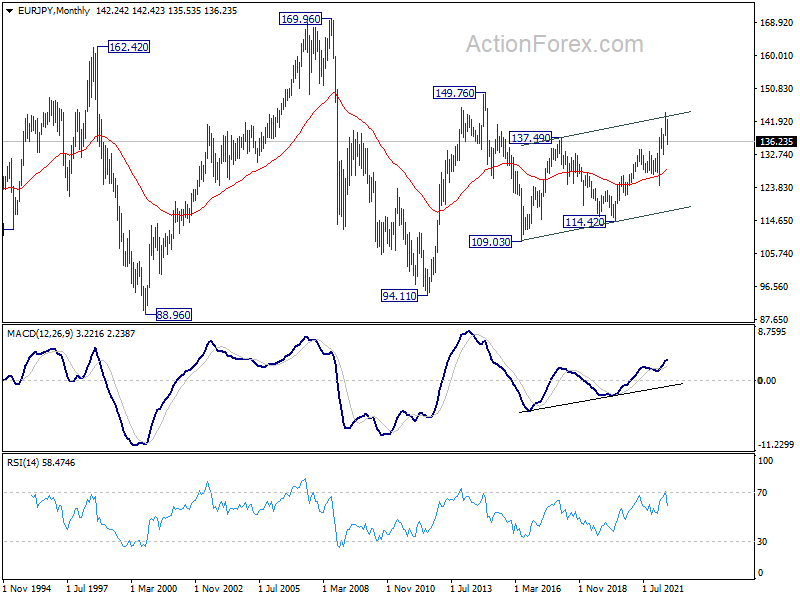
In the long term picture, up trend from 94.11 (2012 low) is seen as in the third leg. Further rally would be seen to 149.76 resistance (2014 high) and above. This will remain the favored case as long as 55 month EMA (now at 128.55) holds.
EUR/GBP Weekly Outlook
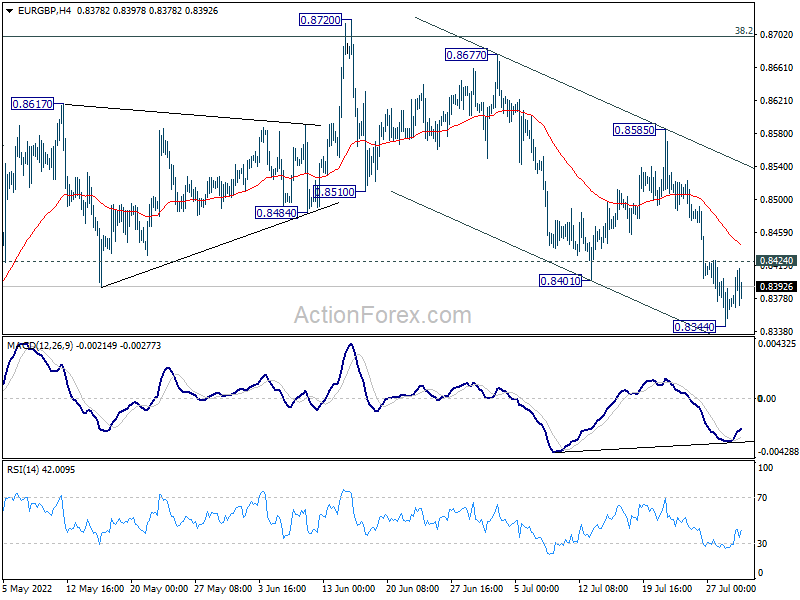
EUR/GBP's fall from 0.8720 resumed last week and dropped to as low as 0.8344. But a temporary low was formed and initial bias is neutral this week for some consolidations. Further decline is expected as long as 0.8585 resistance holds. Below 0.8344 will resume the decline for retesting 0.8201 low.
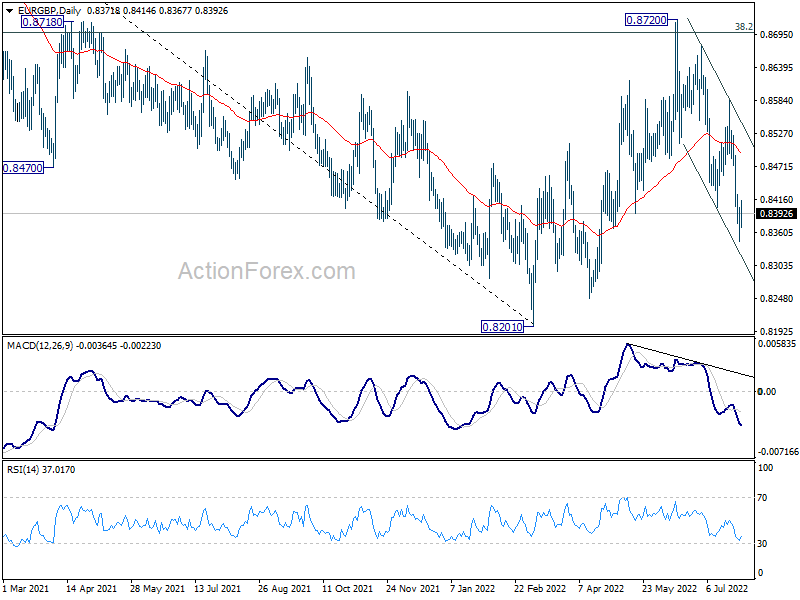
In the bigger picture, current development suggests rejection by 38.2% retracement of 0.9499 to 0.8201 at 0.8697. Medium term term bearishness is maintained. Break of 0.8201 will resume larger down trend from 0.9499 (2020 high). Nevertheless, sustained break of 0.8697 will affirm the case that rise from 0.8201 is a medium term up trend itself.
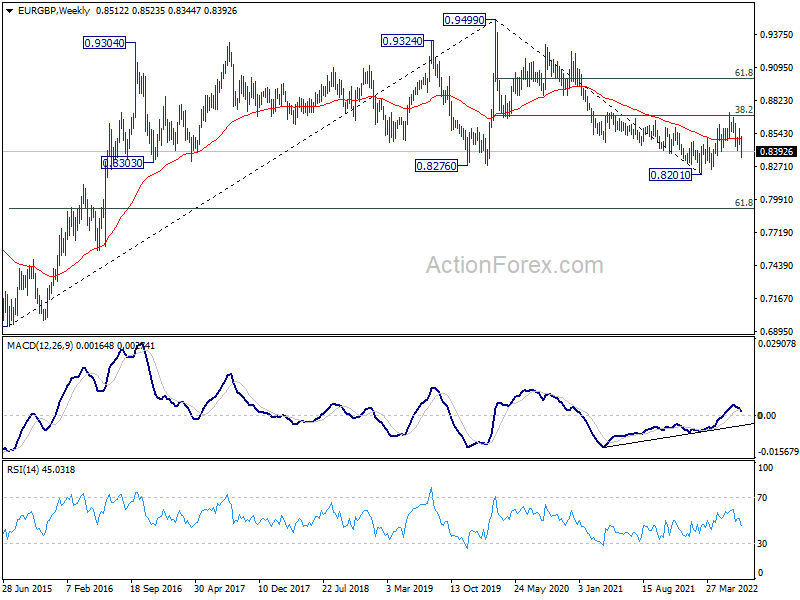
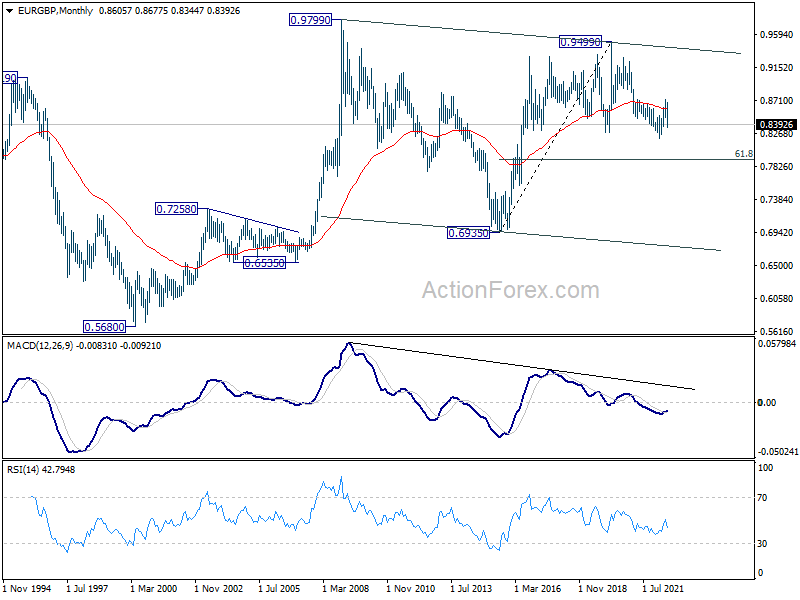
In the long term picture, the lack of medium term downside momentum suggests that fall from 0.9499 (2020 high) is merely a correction to rise from 0.6935 (2015 high). In case of another fall, downside should be contained by 61.8% retracement of 0.6935 to 0.9499 at 0.7917 to bring rebound. Sustained trading above 55 month EMA (now at 0.8604) will indicate that the correction has completed and bring retest of 0.9499.
EUR/AUD Weekly Outlook
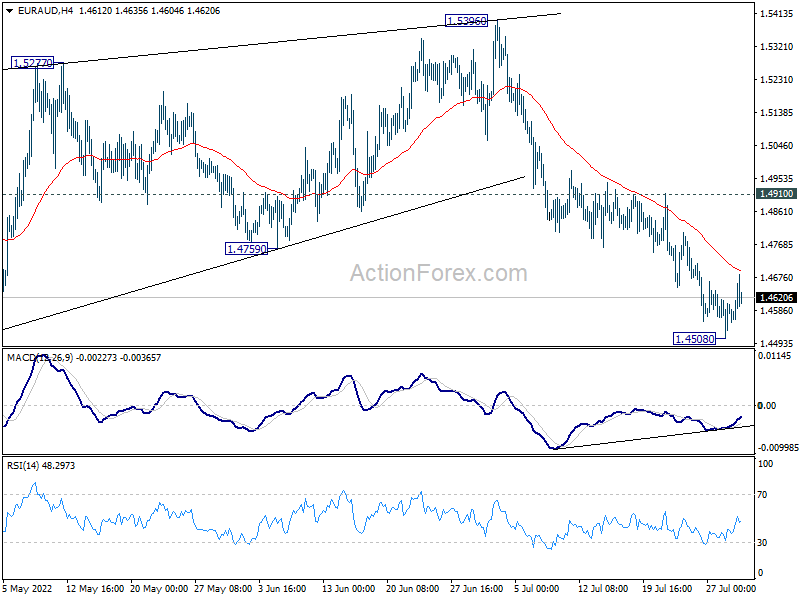
EUR/AUD dropped further to 1.4508 last week but recovered since then. A short term bottom is probably in place on bullish convergence condition in 4 hour MACD. Initial bias is mildly on the upside for recovery. But upside should be limited below 1.4910 resistance to bring another fall. Break of 1.4508 will target a test on 1.4318 low.
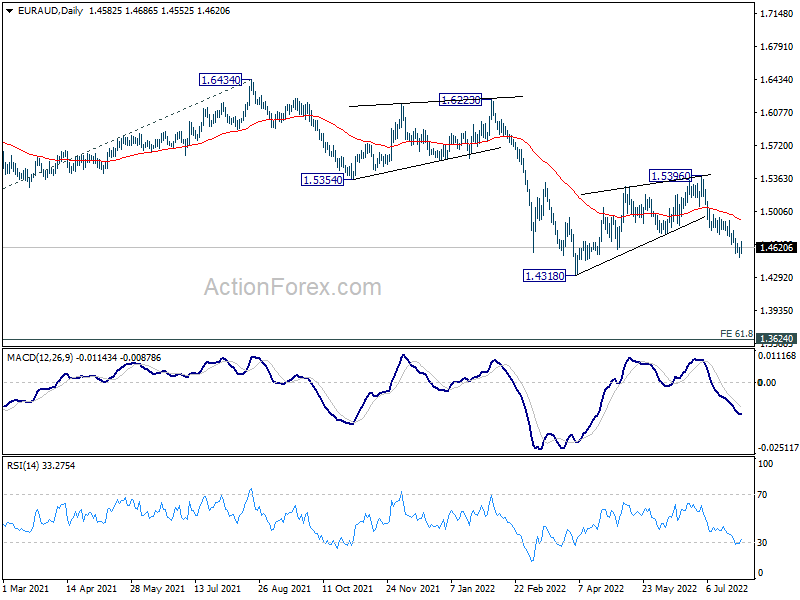
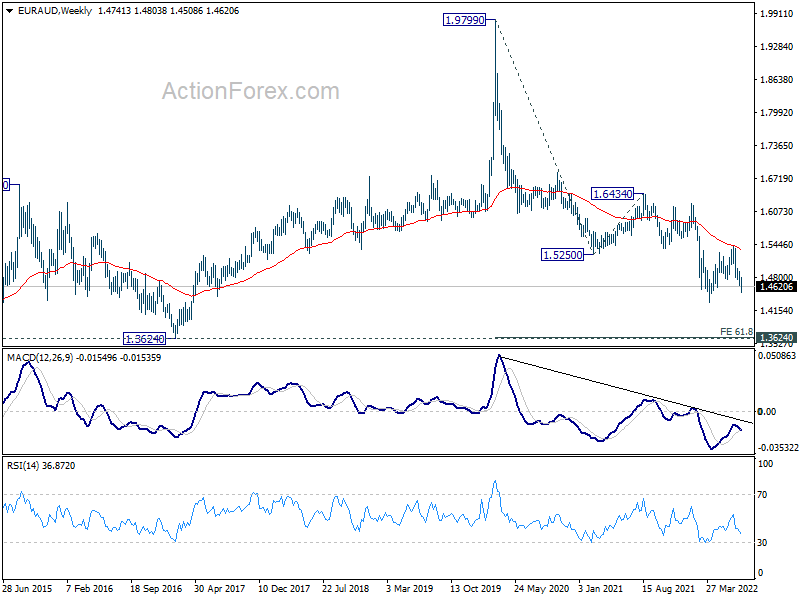
In the bigger picture, rejection by 1.5354 support turned resistance, as well as 55 week EMA (now at 1.5378), maintain medium term bearishness. That is, larger down trend from 1.9799 is not completed yet. Break of 1.4318 low will target 61.8% projection of 1.9799 to 1.5250 from 1.6434 at 1.3623, which is close to 1.3624 long term support (2017 low). This will remain the favored case now as long as 1.5396 resistance holds.
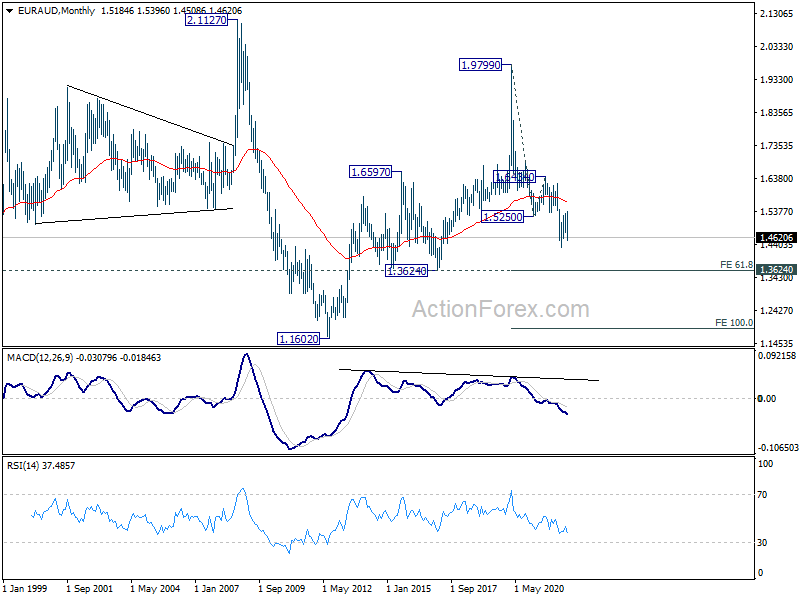
In the longer term picture, fall from 1.9799 (2020 high) is seen as the third leg of the pattern from 2.1127 (2008 high). Deeper fall should be seen to 1.3624 support. Decisive break there would pave the way back to 1.1602 (2012 low). This will remain the favored case as long as 55 month EMA (now at 1.5656) holds.
EUR/CHF Weekly Outlook
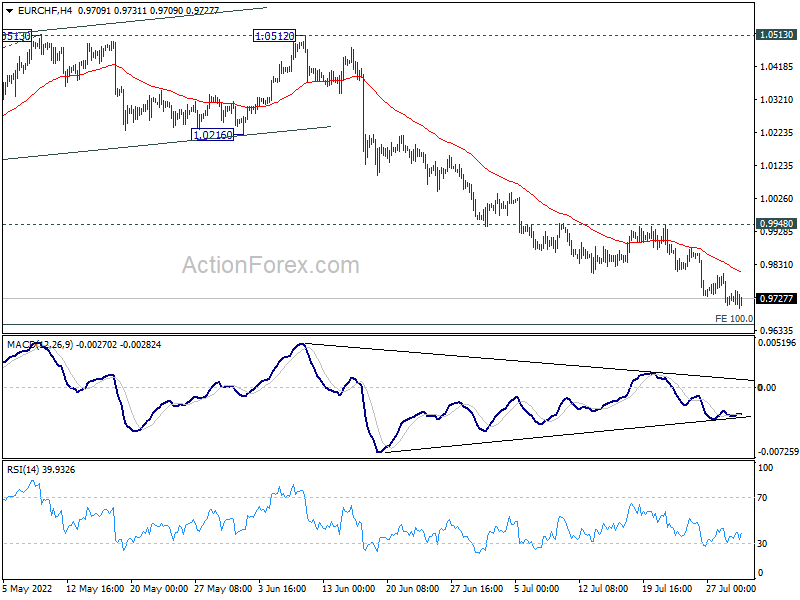
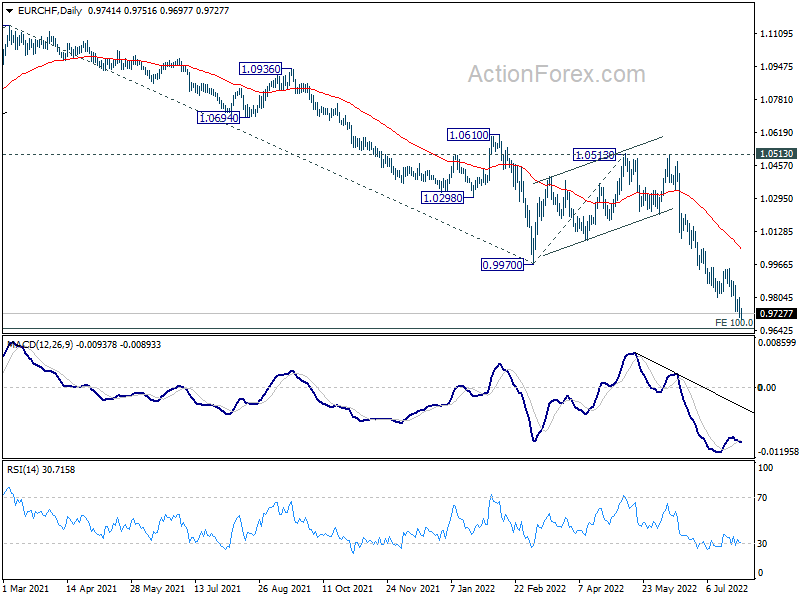
EUR/CHF's down trend resumed last week and hit as low as 0.9697. Initial bias stays on the downside this week for 0.9650 long term projection level. Some support might be seen there to bring rebound. But break of 0.9948 resistance is needed to indicate short term bottoming. Otherwise, outlook will stay bearish Firm break of 0.9650 will target 100% projection of 1.1149 to 0.9970 from 1.0513 at 0.9334.
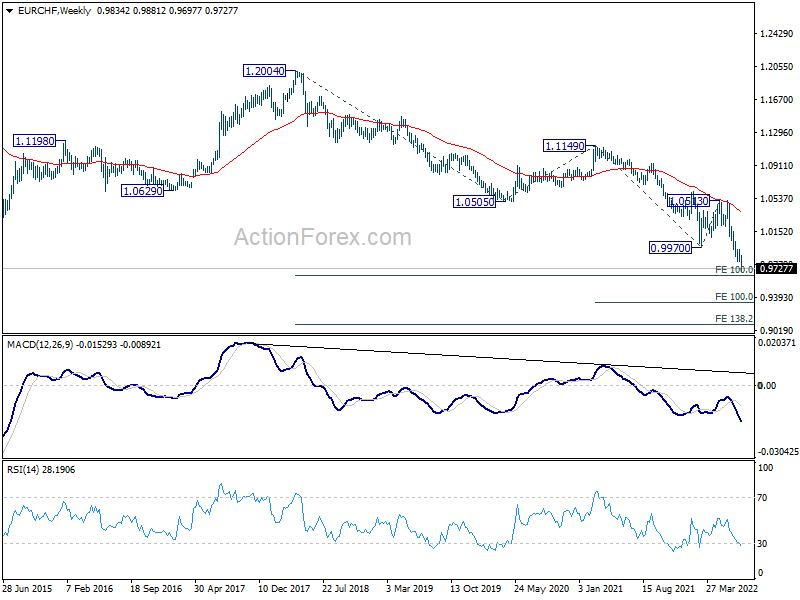
In the bigger picture, long term down trend from 1.2004 (2018 high) is expected to target 100% projection of 1.2004 to 1.0505 to 1.1149 at 0.9650. Firm break there will target 138.2% projection at 0.9033. On the upside, break of 1.0513 resistance is needed to indicate medium term bottoming. Otherwise, outlook will stay bearish in case of strong rebound.
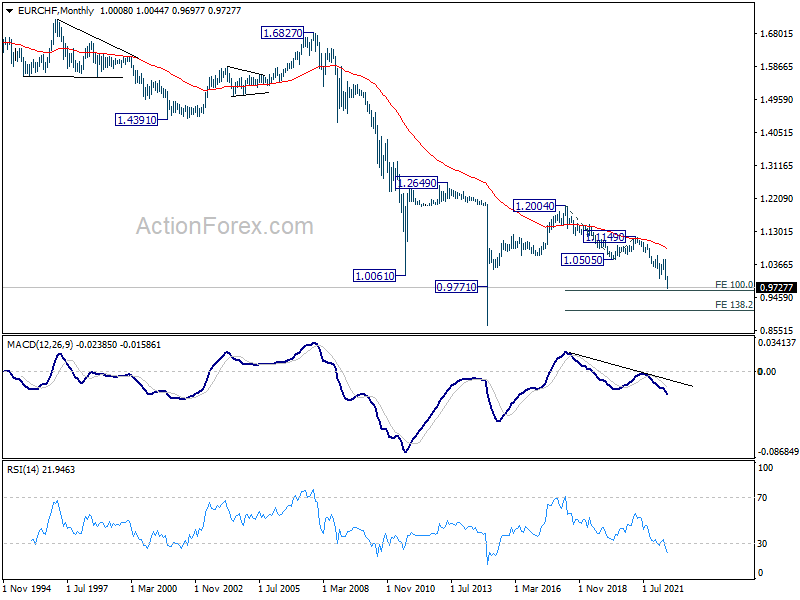
In the long term picture, capped below 55 month EMA, EUR/CHF is seen as extending the multi-decade down trend. There is no prospect of a bullish reversal until some sustained trading above the 55 month EMA (now at 1.0808).
Yen Overwhelmed Dollar on Falling Benchmark Yields
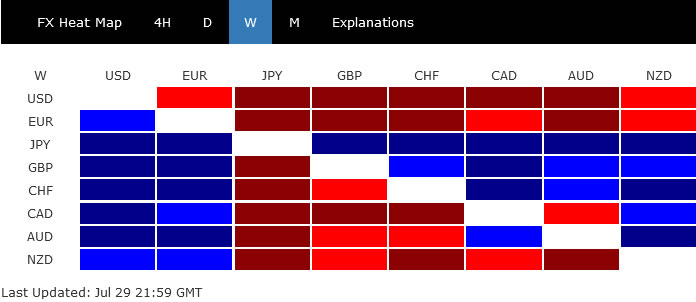
Dollar ended broadly lower last week, as the worst performer, as hammered by the events of FOMC meeting and GDP release. In short, Fed chair has signalled slower tightening pace ahead and the message was reinforced by another quarterly GDP contraction print. Whether the US was already in recession or not, Fed is turning from an auto-pilot mode to a data-dependent mode, after interest rate reached neutral range.
Euro hasn't been able to capitalize on Dollar's selloff, and ended as the second worst. Europe has it own problem of continuing war in Ukraine, inflation, and additional threat of Russia gas supply crunch. Yen was the winner responding to fall of major global benchmark yield. Sterling and Swiss Franc were the next strongest, as supported by buying against Euro. Commodity currencies were mixed, as partly supported by risk-on sentiment.
Market expecting Fed to slow tightening pace
Fed delivered another 75bps rate hike to bring the federal funds rate to 2.25-250% last week, which should now be in neutral range. Chair Jerome Powell then indicate that "as the stance of monetary policy tightens further, it likely will become appropriate to slow the pace of increases while we assess how our cumulative policy adjustments are affecting the economy and inflation."
Just a day later, US GDP data showed the second consecutive quarter of contraction, at -0.9% annualized in Q2. There were debates on whether the US economy was already in recession, as a number of other data remained strong, including jobs. But the figure did affirm that case for, at least, slowing down the tightening pace as rates will be entering into restrictive zone.
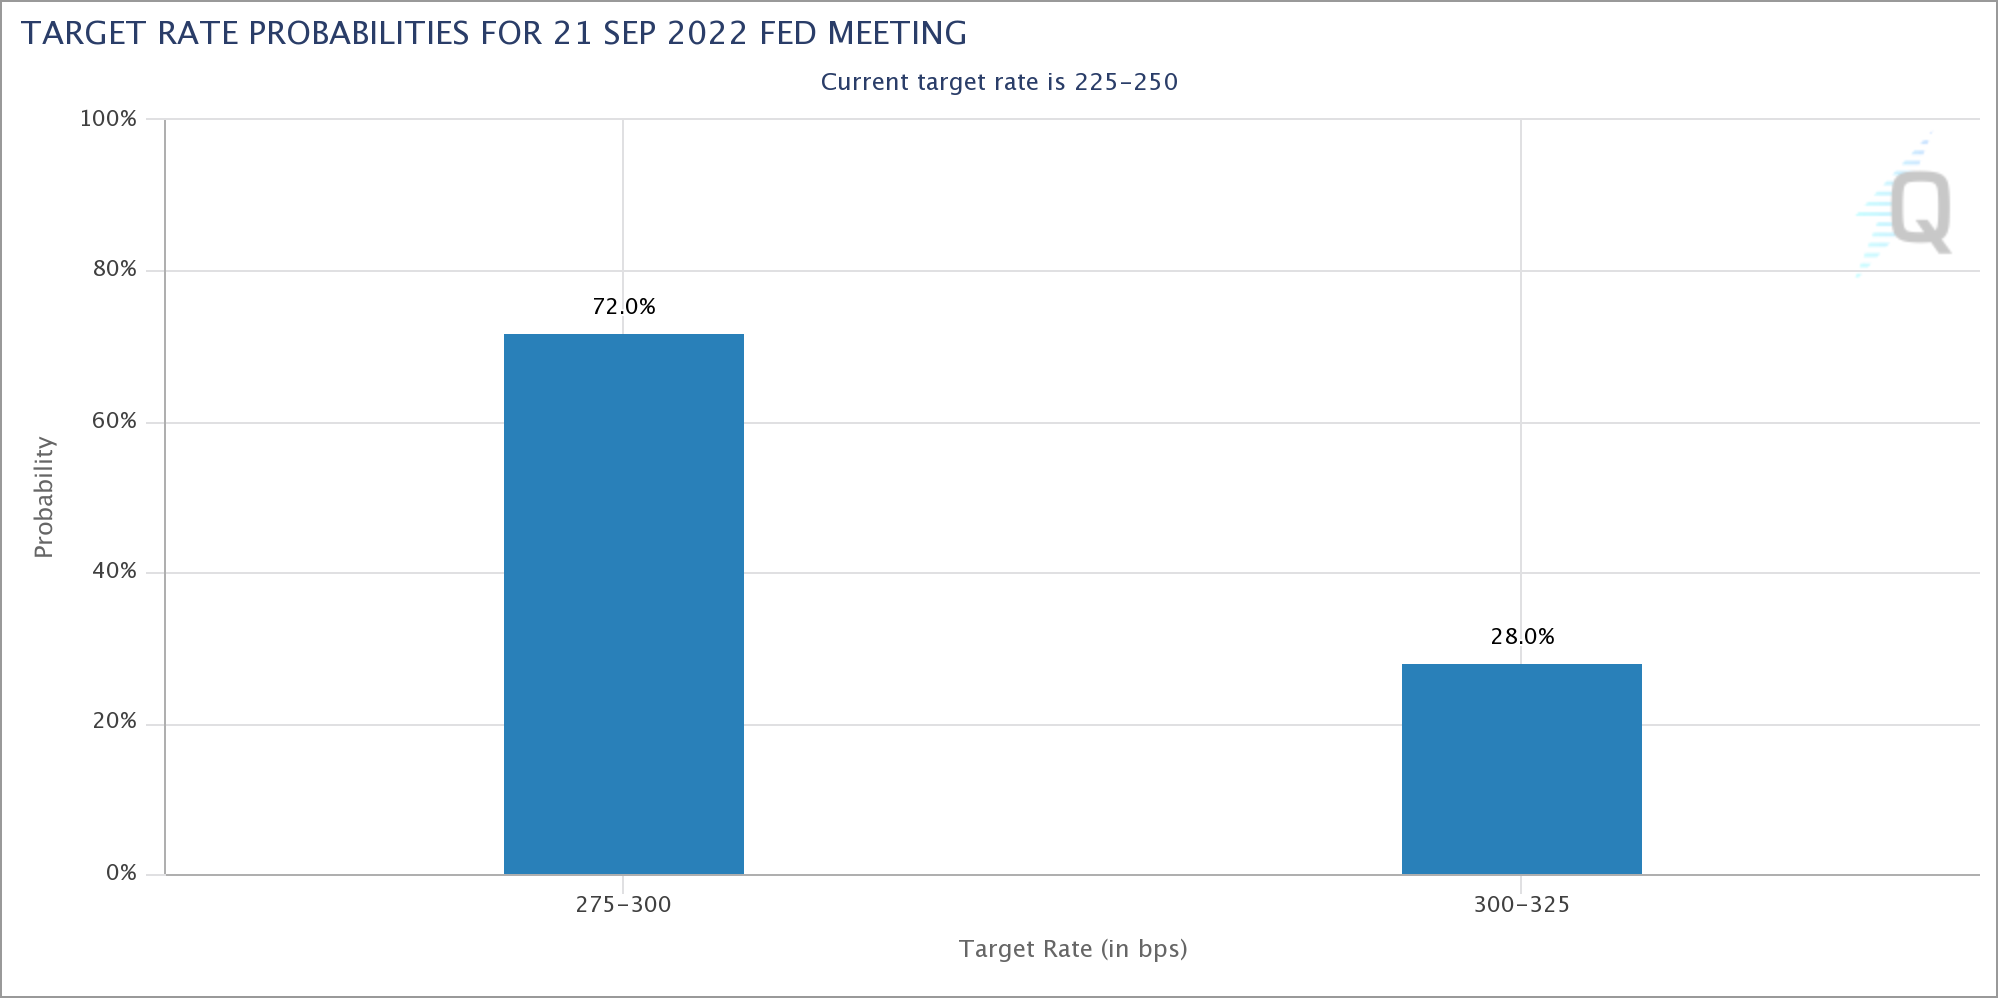
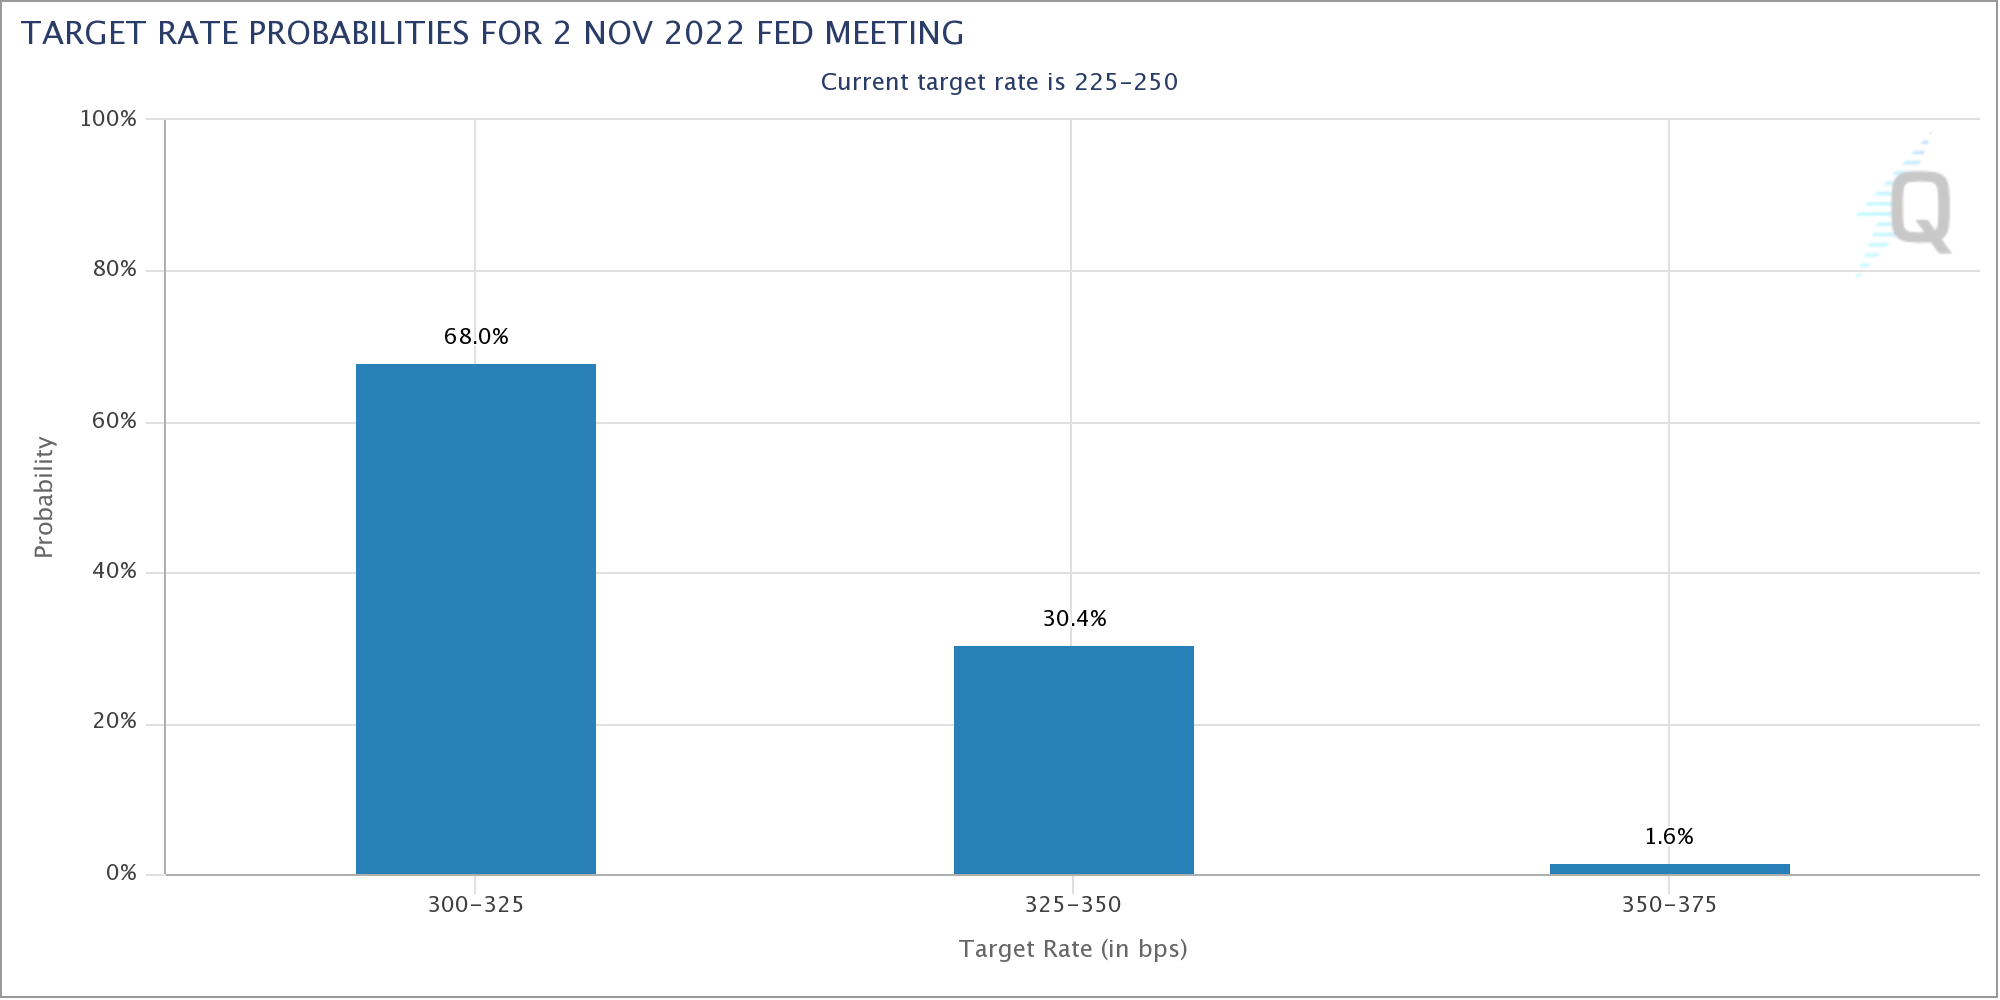
Markets are now pricing in 72% chance of a 50bps hike at the September FOMC meeting, and 68% chance of another 25bps hike in November.
S&P 500 now facing critical resistance zone after strong rebound
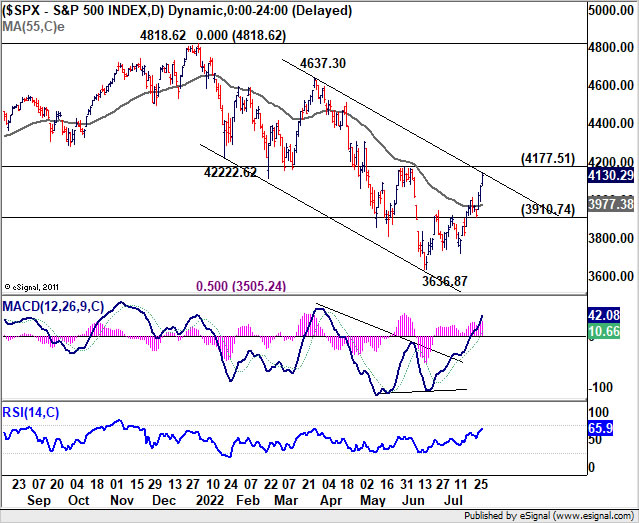
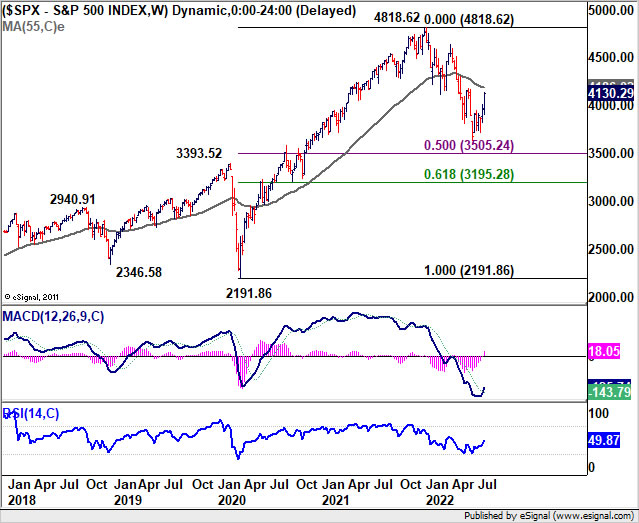
Stocks responded positive to both the FOMC and GDP events. S&P 500 extended the rebound from 3636.87 and closed strongly at 4130.29. The development affirms the case that correction from 4818.62 high is already complete at 3636.87. But SPX still needs to overcome and important resistance at around current level.
The cluster resistance zone include channel resistance at around 4142, 4177.51 resistance, and 55 week EMA at 4186.02. Sustained break of these levels will add more credence to this bullish case, and should set the stage for further rally back towards 4818.62 high, probably by the end of the year. In any case, further rise is in favor now as long as 3910.74 support holds, in case of retreat.
US 10-year yield to target 2.41 next as correction extends
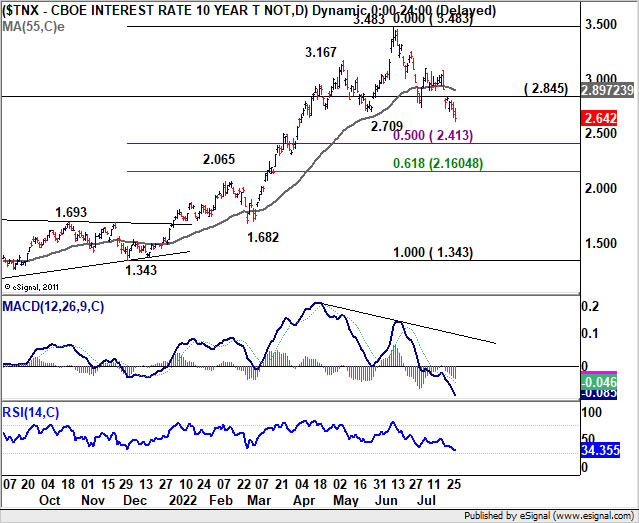
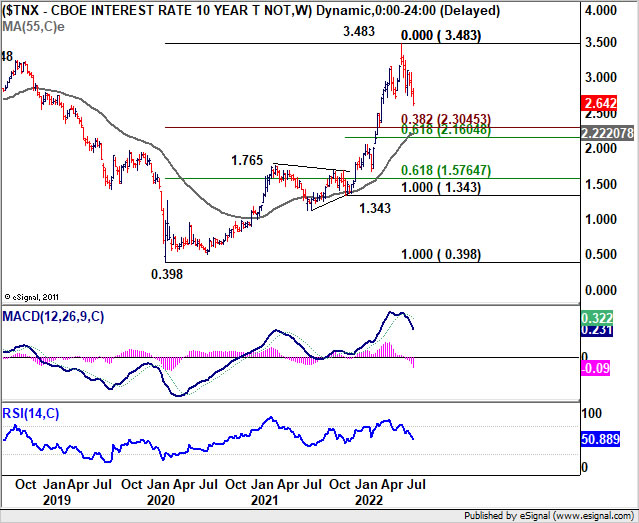
US treasury yields fell notably last week. 10-year yield even broke through key structural support at 2.709. It's clearly in correction to the whole up trend from 1.343. Deeper fall should be seen as long as 2.845 resistance holds, to 50% retracement of 1.343 to 3.483 at 2.413 and possibly below. The correction might extend to 55 week EMA (now at 2.222) before completion.
Dollar index to face important support at 55 day EMA
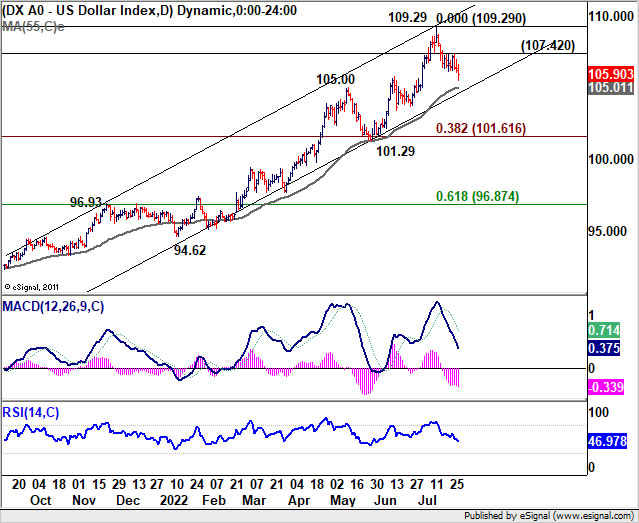
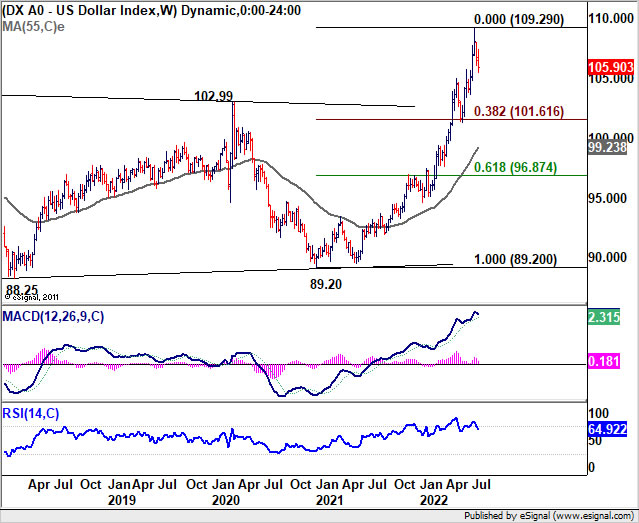
As a result of falling yield and risk-on sentiment, as well as expectation of slower Fed tightening, Dollar ended the week broadly lower. Dollar index's correction from 109.29 extended lower last week and further decline is expected as long as 107.42 resistance holds, to 55 day EMA (now at 105.01).
It's still a bit early to declare that DXY is already in a medium term correction. Rebound from 55 day EMA would keep outlook bullish for another rally through 109.29 sooner rather than later.
However, sustained break of 55 day EMA will raise the chance that it's already correcting the up trend from 89.20. In that case, deeper decline would be seen to 38.2% retracement of 89.20 to 109.29 at 101.61, which is close to 101.29 structural support, before completing the correction. That could happen is the stock rally and yield decline gather more momentum.
Outlook of AUD/JPY and CAD/JPY not too bearish yet despite Yen rally
Yen clearly reacted more to falling major benchmark yield then to risk-on sentiment. Germany 10-year yield closed down at 0.814, comparing to 1.937 high made just back on June 16. UK 10-year yield also closed down at 1.861, comparing to 2.738 high, also made on June 16. Japan 10-year yield was also down at 0.183, but the yield gaps had clearly narrowed.
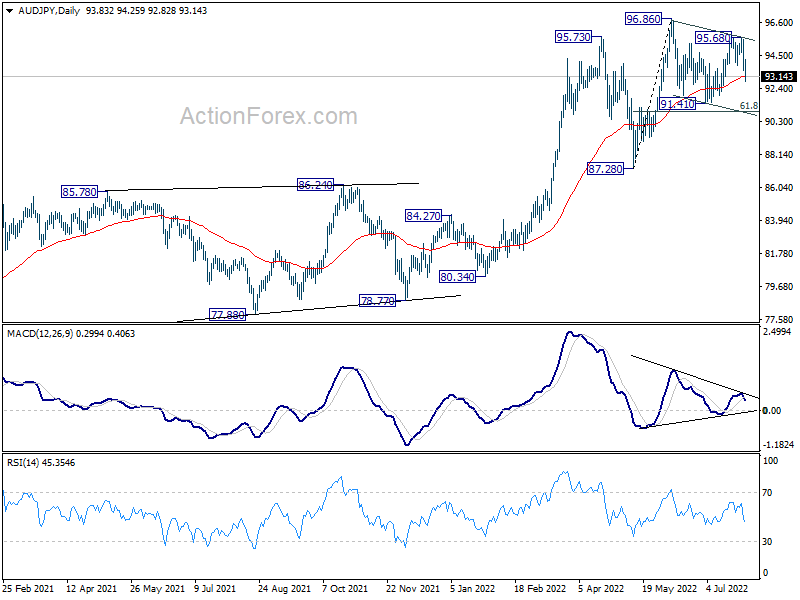
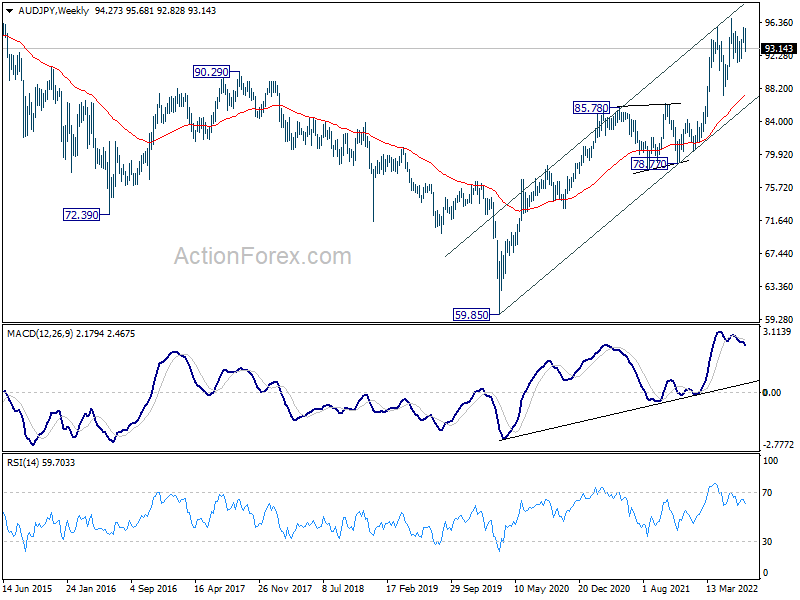
But Yen's strength was relatively less apparent against commodity currencies. AUD/JPY's price actions from 96.86 could still be considered a corrective pattern to rise from 87.28 only, instead of the larger up trend from 78.77. While deeper fall could be seen to 91.41 support, strong support might be seen from 61.8% retracement of 87.28 to 96.86 at 90.93 to bring rebound. That would keep favor on the less bearish case. Nevertheless, sustained break of 90.93 will open up deeper decline to 55 week EMA (now at 87.36), which is close to 87.28 support.
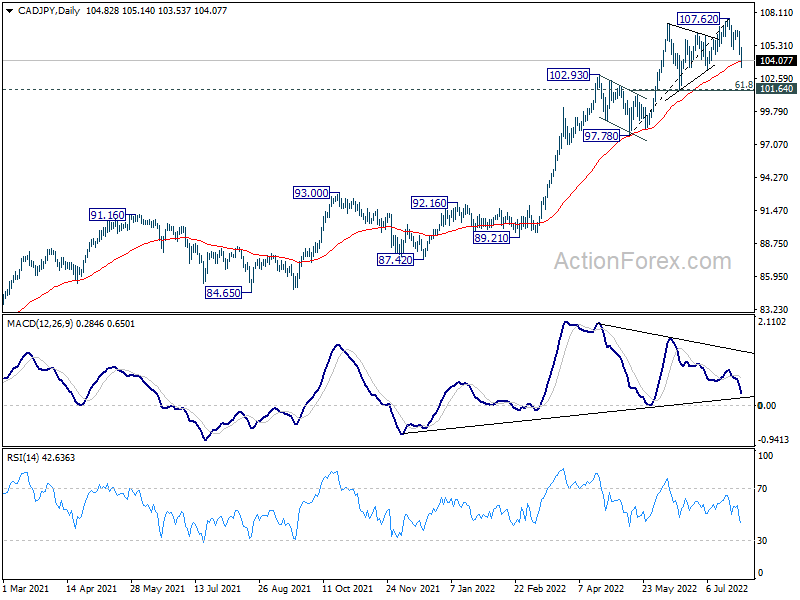
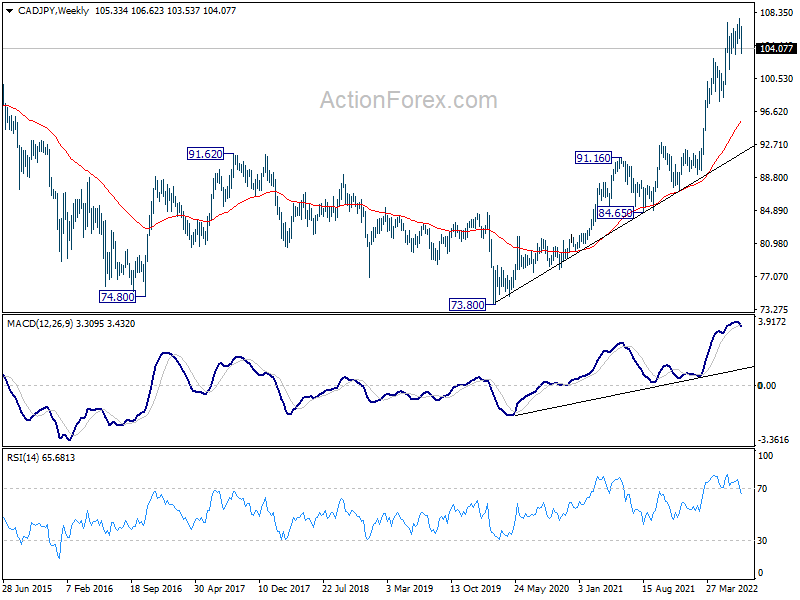
CAD/JPY could also still be seen as in a near term correction only, as long as 101.64 cluster support holds (61.8% retracement of 97.78 to 107.62 at 101.53). However, sustained break there will argue that it's already correcting the whole up trend from 84.65. In this case, deeper decline could be seen through 97.78 support.
USD/JPY Weekly Outlook
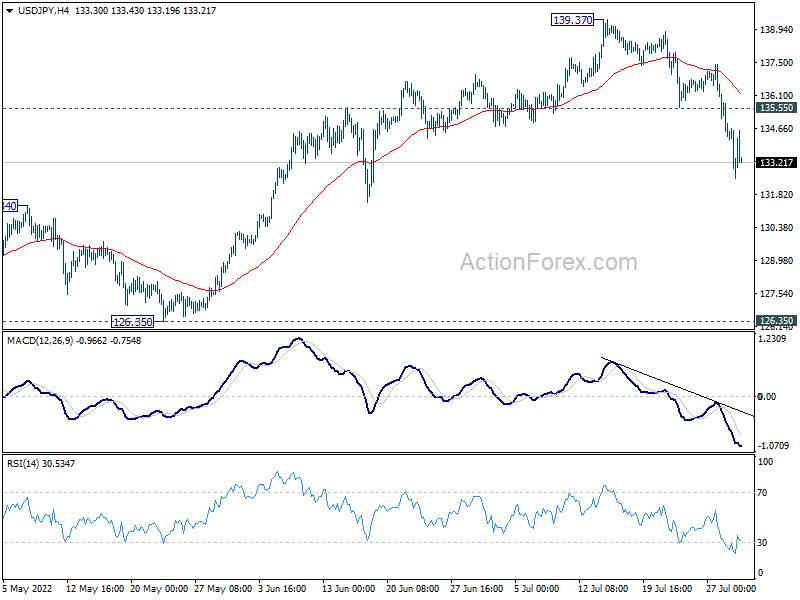
USD/JPY's decline from 139.37 accelerated lower last week. The development suggest that a medium term was already formed on bearish divergence condition in daily MACD. Initial bias stays on the downside this week for 131.34 resistance turned and below. But strong support is expected above 126.35 to contain downside, at least on first attempt, to bring rebound. On the upside, firm break of 135.55 will bring stronger rise back to retest 139.37 high instead.
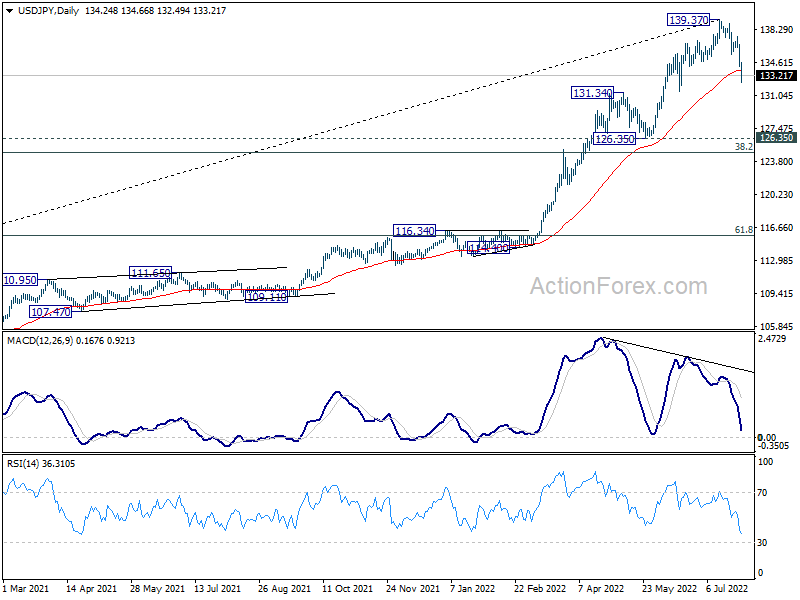
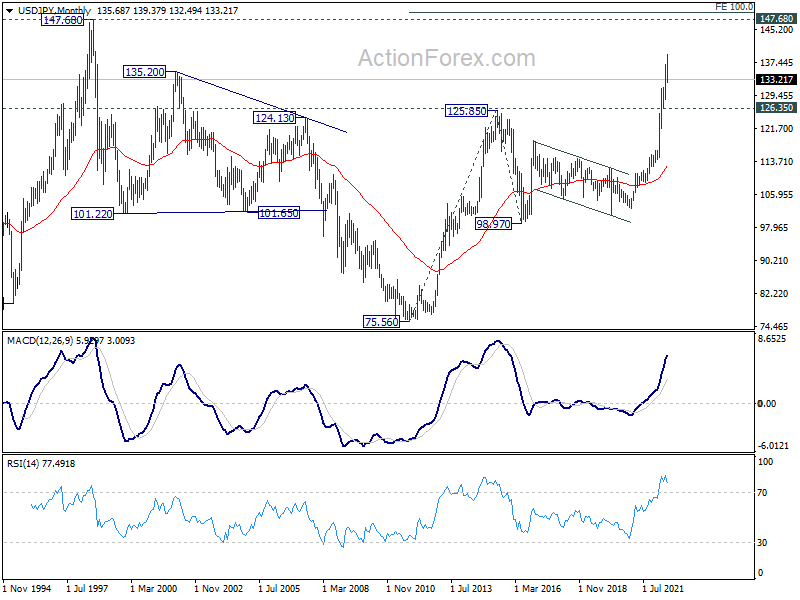
In the bigger picture, a medium term top should be in place at 139.37, on bearish divergence condition in daily MACD. Fall from there could be correcting whole up trend from 101.18 (2020 low). While deeper decline cannot be ruled out, outlook will stays bullish as long as 55 week EMA (now at 121.84) holds. Long term up trend is expected to resume through 139.37 at a later stage, after the correction finishes.
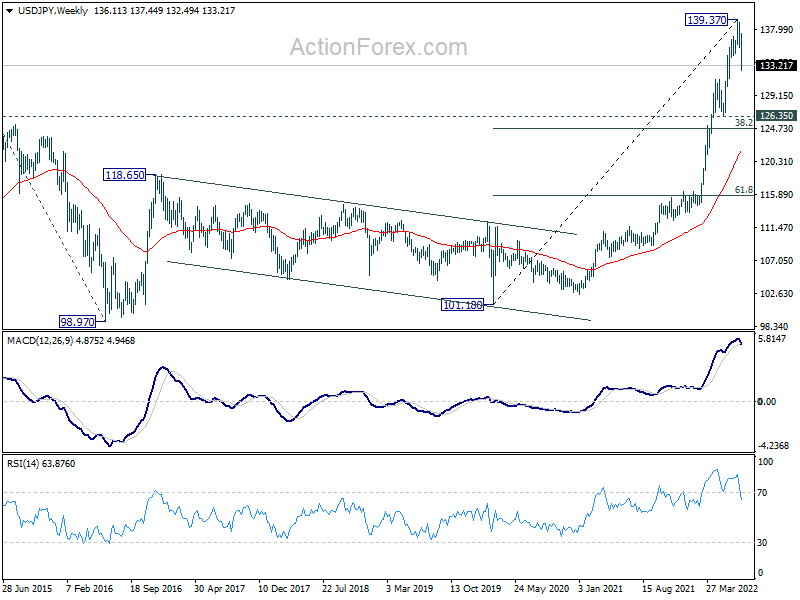
In the long term picture, rise 101.18 is seen as part of the up trend from 75.56 (2011 low). Further rally is expected to 100% projection of 75.56 (2011 low) to 125.85 (2015 high) from 98.97 at 149.26, which is close to 147.68 (1998 high). This will remain the favored case as long as 55 week EMA holds.
Summary 8/1 – 8/5
Monday, Aug 1, 2022
[php_everywhere instance="1"]
Tuesday, Aug 2, 2022
[php_everywhere instance="2"]
Wednesday, Aug 3, 2022
[php_everywhere instance="3"]
Thursday, Aug 4, 2022
[php_everywhere instance="4"]
Friday, Aug 5, 2022
[php_everywhere instance="5"]