

Sample Category Title
Canada’s Economy Stalls in May, Points to a Slight Expansion in June
The Canadian economy recorded no growth in May, beating Statistics Canada's flash estimate for a contraction of 0.2% month-over-month (m/m). The flash estimate for June showed a mild return to growth of 0.1% m/m.
May's results showed output expanding in 14 of the 20 industries. The goods-producing sector contracted 1.0%, while the service-producing sector rose 0.4%.
On the goods side, construction (-1.6% m/m) and manufacturing (-1.7% m/m) led the declines. The mining, quarrying and oil and gas sectors, pulled back marginally (-0.1% m/m) after strong growth of 3.1% the month prior.
Demand for in-person services continues to increase. The arts, entertainment, and recreation sector expanded 2.7% m/m, as it continues its climb back to pre-pandemic levels. Transportation and warehousing also expanded robustly (+1.9% m/m), with air transportation rising 14.1% in May.
Key Implications
With no growth in May and the +0.1% m/m print for June, tracking for second quarter GDP growth is now 4.6% (annualized). This is slightly better than the 4.4% we anticipated earlier in the year in contrast to the declines observed stateside. However, in a sign that demand growth is responding to inflation and rising interest rates, momentum is slowing, with May and June showing little growth.
Slowing growth shouldn't deter the Bank of Canada (BoC) from continuing with its rate hiking cycle. Interest rate hikes were supposed to slow growth and intermittent contractions were always a possibility. As inflation remains well above target and the economy continues to operate in excess demand we expect the BoC to continue raising rates until they get to 3.25%.
US: Personal Income Up, But Real Spending Disappoints
Personal income rose 0.6% month-on-month (m/m) in June, one tick above the consensus estimate and matching May's pace. The gain was led by employee compensation of employees (+0.4% m/m) and proprietors' income (+1.4% m/m).
However, with inflation running hot – the PCE deflator rose 1.0% m/m in June – real disposable income fell 0.3% m/m.
Nominal personal spending gained momentum in June, rising 1.1% m/m after a smaller 0.3% m/m in May, beating the consensus estimate (+0.9% m/m). However, given high inflation, spending in real terms was up a modest 0.1% m/m, after dropping 0.3% in May.
- Real goods spending rose 0.1% m/m in June, as outlays on durable goods (+0.9% m/m) gained some ground after a steep decline in May. Real spending on nondurables continued to decline (-0.4% m/m).
- Somewhat disappointing, services spending grew by only 0.1% m/m in real terms. Looking at spending that has been sensitive to swings in the pandemic, food services (+0.3% m/m) and accommodation (+3.2% m/m) made gains, but spending on transportation services (-1.1% m/m) and recreation (-0.4% m/m) were disappointing.
The Fed's preferred measure of inflation, the core PCE deflator, which strips out food and energy prices, accelerated in June, rising 0.6% m/m. That was slightly above consensus, and took the year-ago measure to 4.8%. That is somewhat below the 5%+ pace earlier in 2022, but well above the Fed's comfort zone.
The personal saving rate continued to decline, reaching 5.1% in June. Its pre-pandemic average was 7.5%, which implies that consumers are continuing to draw down their cushion of "excess" savings built up during the pandemic's restrictions.
Key Implications
While it is positive that real consumer spending gained ground after falling in May, it is hard to view this report as anything other than disappointing. June's modest gain sets up the third quarter for another soft showing in consumer spending. We are currently tracking around a 1% annualized gain, below our June forecast expectation for 2%.
The biggest disappointment has come in high-contact services spending, which we had been counting on the release of pent up demand in these areas to drive decent consumer spending growth. After a couple of months of weakness in these areas, it seems consumers may be being forced to economize on these discretionary measures as inflation bites into real incomes.
USD/JPY Mid-Day Outlook
Daily Pivots: (S1) 133.42; (P) 135.02; (R1) 135.84; More...
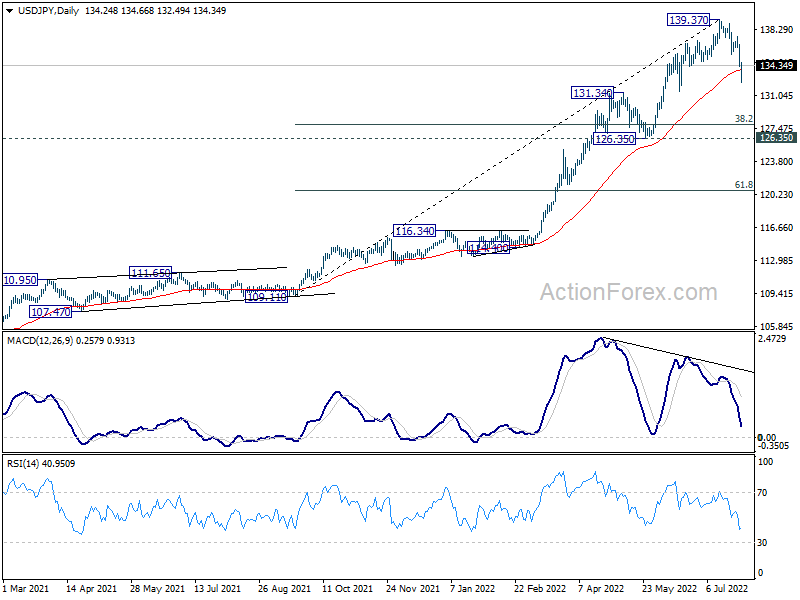
Further decline is expected in USD/JPY as long as 135.55 minor resistance holds. Fall from 139.37 is seen as correcting the medium term up trend. Further fall would be seen to 131.34 resistance turned support and below. But strong support is expected above 126.35 to contain downside, at least on first attempt, to bring rebound. On the upside, firm break of 135.55 will bring stronger rise back to retest 139.37 high instead.
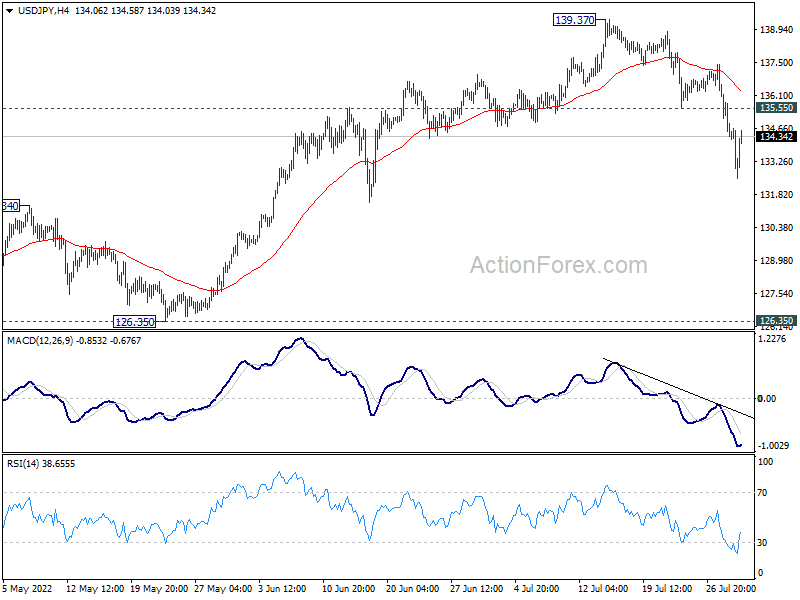
In the bigger picture, current rally is seen as part of the long term up trend from 75.56 (2011 low). Next target is 100% projection of 75.56 (2011 low) to 125.85 (2015 high) from 98.97 at 149.26, which is close to 147.68 (1998 high). This will remain the favored case as long as 126.35 support holds.
USD/CHF Mid-Day Outlook
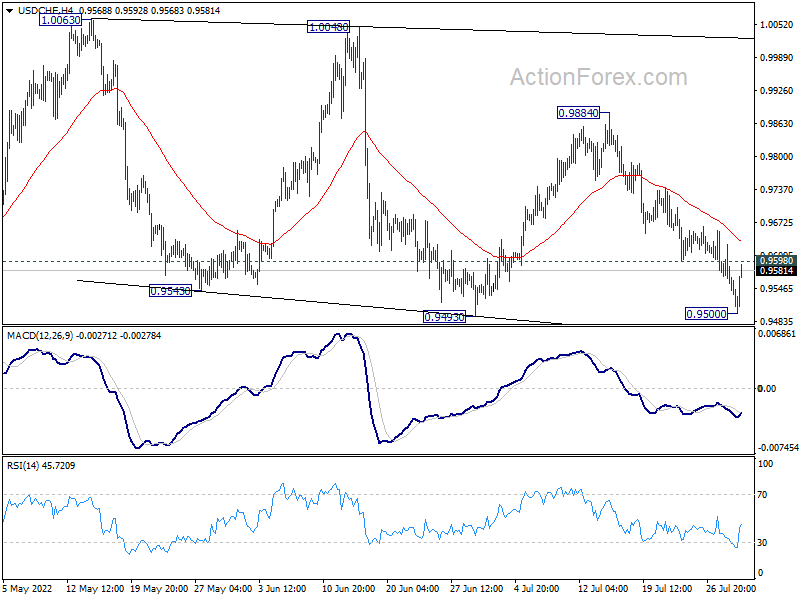
Daily Pivots: (S1) 0.9519; (P) 0.9575; (R1) 0.9606; More...
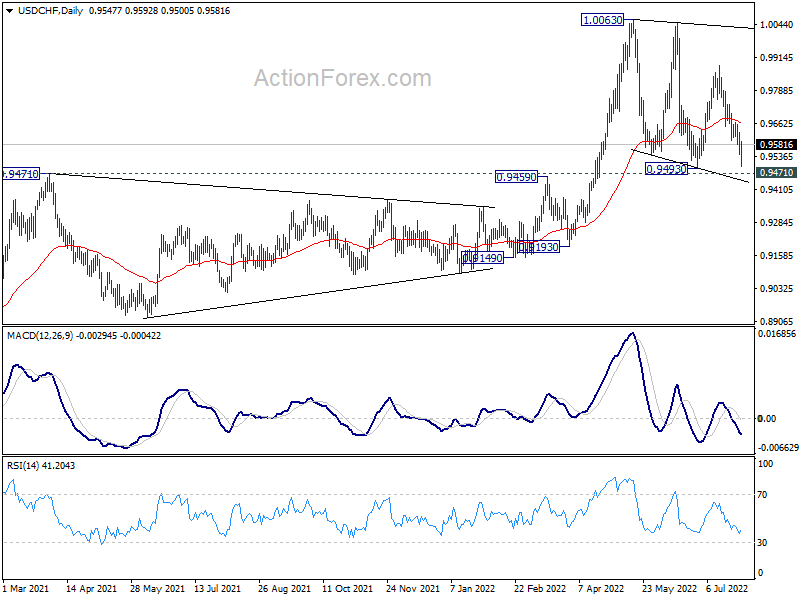
Intraday bias in USD/CHF is turned neutral with current recovery. Another fall cannot be ruled out. but price actions from 1.0063 high are still viewed as a consolidation pattern. Hence, Strong support should be seen from 0.9471 resistance turned support to bring rebound. On the upside, above 0.9598 minor resistance will turn bias back to the upside for recovery towards 55 day EMA (now at 0.9663) and above. However, sustained break of 0.9471 will carry larger bearish implication and target 0.9193 support next.
In the bigger picture, medium term up trend from 0.8756 (2021 low) is still in progress. On resumption, next target is 1.0342 (2016 high). Sustained break there will resume long term up trend from 0.7065 (2011 low). This will remain the favored case as long as 0.9471 resistance turned support holds. However, firm break of 0.9471 will raise the chance that such up trend is over.
GBP/USD Mid-Day Outlook
Daily Pivots: (S1) 1.2124; (P) 1.2158; (R1) 1.2212; More...
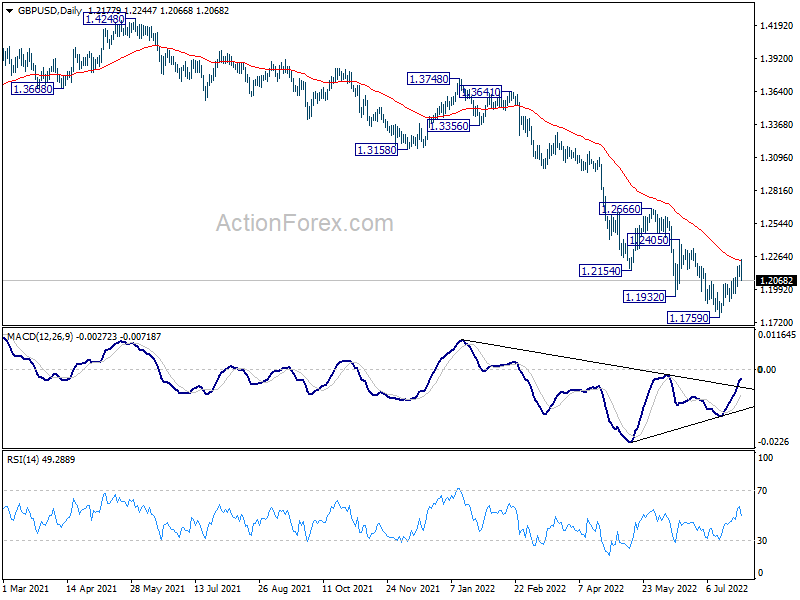
Intraday bias in GBP/USD is turned neutral first with current retreat. On the upside, break of 1.2244 will resume the rebound from 1.1759 for 1.2405 resistance. Firm break there will target 1.2666 key resistance next. On the downside, break of 1.2019 minor support will turn bias back to the downside for retesting 1.1759 low instead.
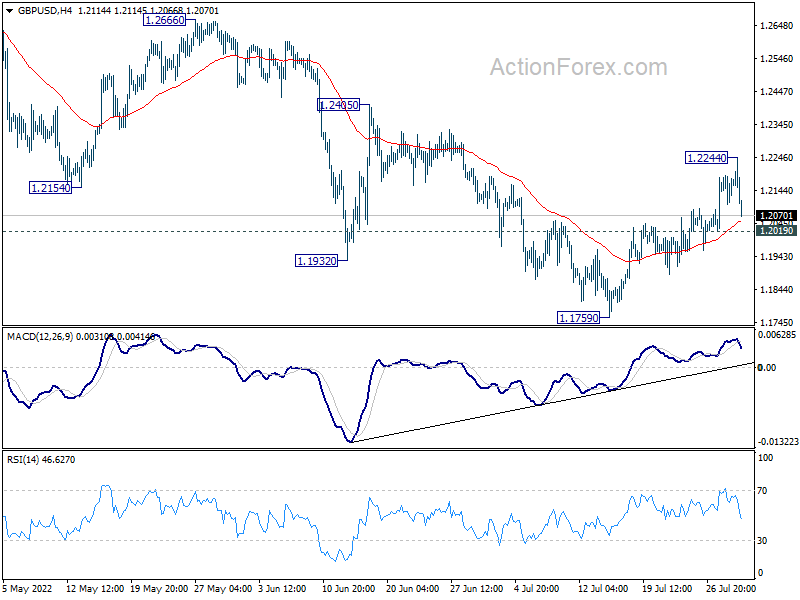
In the bigger picture, fall from 1.4248 (2018 high) could be a leg inside the pattern from 1.1409 (2020 low), or resuming the longer term down trend. Deeper decline is expected as long as 1.2666 resistance holds. Next target is 1.1409 low. However, firm break of 1.2666 will bring stronger rise back to 55 week EMA (now at 1.2986).
EUR/USD Mid-Day Outlook
Daily Pivots: (S1) 1.0129; (P) 1.0182; (R1) 1.0249; More...
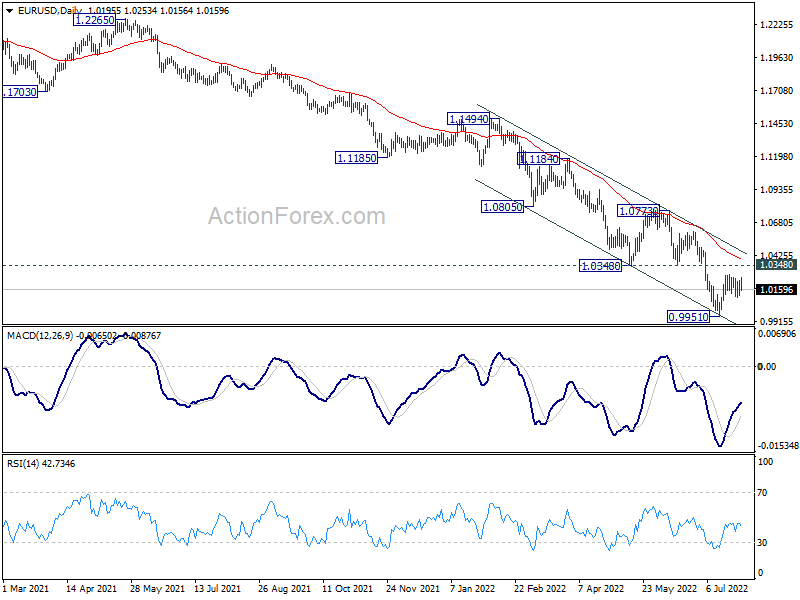
Intraday bias in EUR/USD remains neutral and outlook is unchanged. On the upside, above 1.0277 minor resistance will target 1.0348 resistance first. Break there will target channel resistance at 1.0469. on the downside, break of 1.0095 minor support will bring retest of 0.9951 low instead.
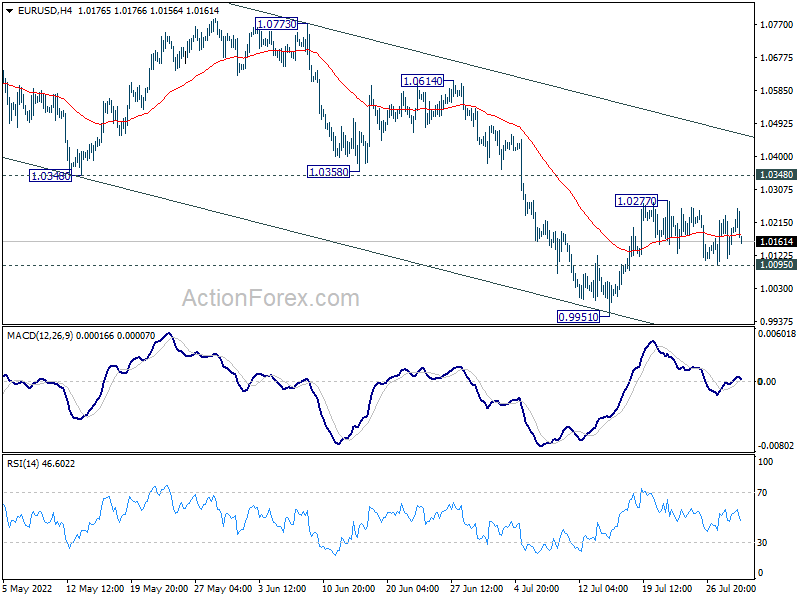
In the bigger picture, down trend from 1.6039 (2008 high) is still in progress. Next target is 100% projection of 1.3993 to 1.0339 from 1.2348 at 0.8694. In any case, outlook will stay bearish as long as 1.0773 resistance holds, in case of strong rebound.
Dollar Recovering after Strong PCE Inflation, But Still The Worst Performer
Dollar is recovering in early US session, follow another print of strong consumer inflation. 10-year yield is also back above 2.7% handle. Still, the greenback is the worst performer for the week together with Euro. Yen is retreating mildly but stays the strongest one for the week, followed by Sterling. Commodity currencies are mixed, slightly on the soft side.
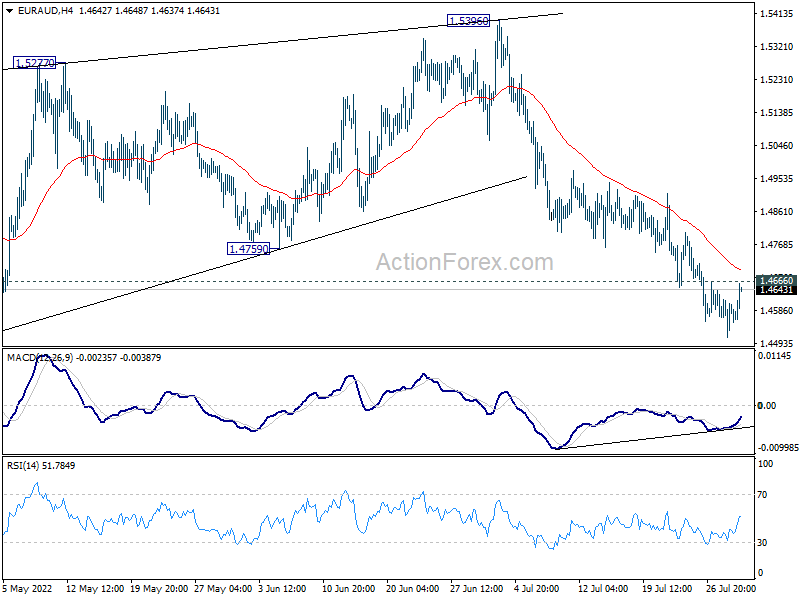
Technically, while Euro is still week, it appears to be stabilizing in some crosses. Break of 0.8424 minor resistance in EUR/GBP, 1.4666 minor resistance in EUR/AUD, and 137.31 minor resistance in EUR/JPY, will argue that the selling climax is already over for the near term.
In Europe, at the time of writing, FTSE is up 0.59%. DAX is up 1.12%. CAC is up 1.65%. Germany 10-year yield is up 0.059 at 0.892. Earlier in Asia, Nikkei dropped -0.05%. Hong Kong HSI dropped -2.26%. China Shanghai SSE dropped -0.89%. Singapore Strait Times dropped -0.28%. Japan 10-year JGB yield dropped -0.0256 to 0.183.
US PCE inflation rose to 6.8% yoy, core CPI rose to 4.8% yoy
US personal spending rose 0.6% mom or USD 133.5B in June, above expectation of 0.5% mom. Personal spending rose 1.1% mom or USD 181.1B, above expectation of 0.9% mom. The rise in spending reflected USD 94.9B increase in goods and USD 86.2B in services.
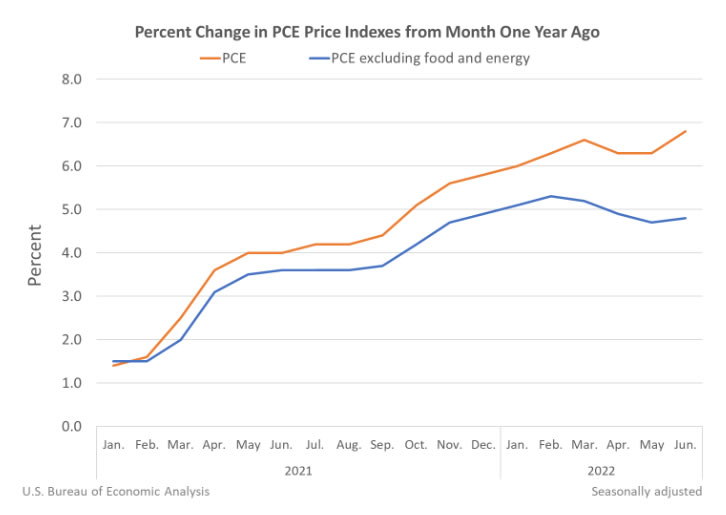
Headline PCE price index accelerated from 6.3% yoy to 6.8% yoy, above expectation of 6.7% yoy. That's also the highest level since January 1982. Core PCE price index also rose from 4.7% yoy to 4.8% yoy, above expectation of 4.7% yoy.
Canada GDP unchanged in May, grew 0.1% mom in Jun
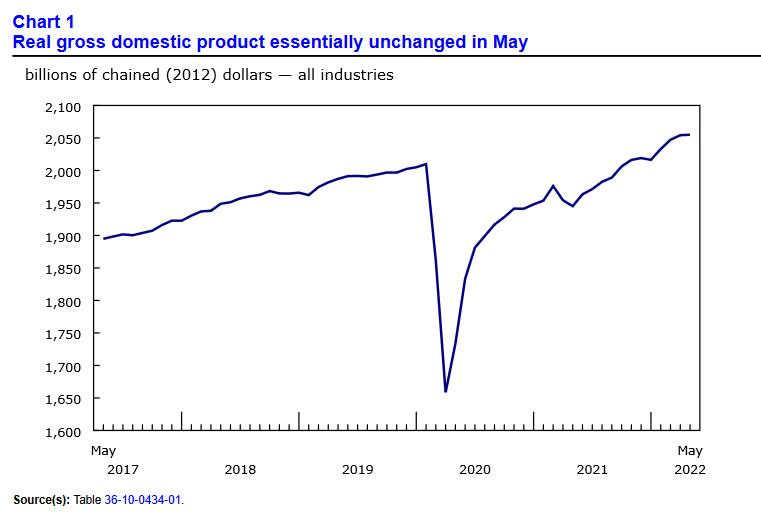
Canada GDP was essentially unchanged in May, better than expectation of -0.2% mom contraction. Services-producing industries rose grew 0.4% mom while goods-producing industries contracted -1.0%. 14 of 20 industrial sectors increased.
Advance information indicates that GDP grew 0.1% mom in June, as output was up in the construction, manufacturing, and accommodation and food services sectors. Also, GDP grew 1.1% qoq in Q2.
Eurozone GDP grew 0.7% qoq in Q2, EU up 0.6% qoq
Eurozone GDP grew 0.7% qoq in Q2, well above expectation of 0.1% qoq. Comparing with same quarter of last year, GDP grew 4.0% yoy.
EU GDP grew 0.6% qoq, 4.0% yoy. Among the Member States for which data are available for the second quarter 2022, Sweden (+1.4%) recorded the highest increase compared to the previous quarter, followed by Spain (+1.1%) and Italy (+1.0%). Declines were recorded in Latvia (-1.4%), in Lithuania (-0.4%) and in Portugal (-0.2%). The year on year growth rates were positive for all countries.
Eurozone CPI rose to record 8.9% yoy, core CPI rose to 4% yoy
Eurozone CPI rose from 8.6% yoy to 8.9% yoy in July, above expectation of 8.7% yoy. That's also another record high. CPI core (all-items ex energy, food, alcohol & tobacco) rose from 3.7% yoy to 4.0% yoy, above expectation of 3.8% yoy.
Looking at the main components inflation, energy is expected to have the highest annual rate in July (39.7%, compared with 42.0% in June), followed by food, alcohol & tobacco (9.8%, compared with 8.9% in June), non-energy industrial goods (4.5%, compared with 4.3% in June) and services (3.7%, compared with 3.4% in June).
Swiss KOF dropped to 90.1, economy to develop sluggishly in Autumn
Swiss KOF Economic Barometer dropped sharply from 95.2 to 90.1 in July, well below expectation of 95.2. That's also the third decline in a row, with the value below its long-term average by almost 10 pts. KOF said the Swiss economy is likely to "develop sluggishly in autumn".
KOF said: "The retreat in July is led by the bundle of indicators for manufacturing. But the outlook is also much less favourable than before in accommodation and food service activities, other services, and financial and insurance services. The negative tendency is also evident in the bundle of indicators for private consumption in general. The decline is dampened somewhat by the indicators for construction and foreign demand."
BoJ opinions: Appropriate to encourage wage increases through monetary easing
In the Summary of Opinions at BoJ's July 20 and 21 meeting, it's noted that, "Bank should support financing, mainly of firms, and maintain stability in financial markets, and should not hesitate to take additional easing measures if necessary." Additionally, it is "appropriate for the Bank to maintain the current forward guidance for the policy rates."
"While Japan's economy is on its way to recovery from the pandemic, it has been under downward pressure due to an outflow of income from Japan caused by high commodity prices," one member noted. "In this situation, it is appropriate that the Bank encourage wage increases through monetary easing, aiming to achieve the price stability target in a sustainable and stable manner".
Japan industrial production rose record 8.9% mom in Jun, recovery to continue
Japan industrial production rose strongly by 8.9% mom in June, well above expectation of 3.7% mom. That's also the biggest monthly rise since data become available in 2013. Car production jumped 14.0% mom thanks to easing of lockdowns in Shanghai of China. Manufacturers surveyed by the Ministry of Economy, Trade and Industry (METI) expected output to extend its recovery by 3.8% in July and 6.0% in August.
Also released, retail sales rose 1.5% yoy in June, below expectation of 2.8% yoy. Unemployment rate was unchanged at 2.6% in June. Housing starts dropped -2.2% yoy in June, versus expectation of -1.2% yoy. Consumer confidence dropped from 32.1 to 30.2 in July, below expectation of 33.0. Tokyo CPI core accelerated from 2.1% yoy to 2.3% yoy in July, above expectation of 2.2% yoy.
EUR/USD Mid-Day Outlook
Daily Pivots: (S1) 1.0129; (P) 1.0182; (R1) 1.0249; More...
Intraday bias in EUR/USD remains neutral and outlook is unchanged. On the upside, above 1.0277 minor resistance will target 1.0348 resistance first. Break there will target channel resistance at 1.0469. on the downside, break of 1.0095 minor support will bring retest of 0.9951 low instead.
In the bigger picture, down trend from 1.6039 (2008 high) is still in progress. Next target is 100% projection of 1.3993 to 1.0339 from 1.2348 at 0.8694. In any case, outlook will stay bearish as long as 1.0773 resistance holds, in case of strong rebound.
Economic Indicators Update
| GMT | Ccy | Events | Actual | Forecast | Previous | Revised |
|---|---|---|---|---|---|---|
| 23:30 | JPY | Tokyo CPI Core Y/Y Jul | 2.30% | 2.20% | 2.10% | |
| 23:50 | JPY | BoJ Summary of Opinions | ||||
| 23:30 | JPY | Unemployment Rate Jun | 2.60% | 2.50% | 2.60% | |
| 23:50 | JPY | Industrial Production M/M Jun P | 8.90% | 3.70% | -7.50% | |
| 23:50 | JPY | Retail Trade Y/Y Jun | 1.50% | 2.80% | 3.60% | 3.70% |
| 01:30 | AUD | Private Sector Credit M/M Jun | 0.90% | 0.80% | 0.80% | |
| 01:30 | AUD | PPI Q/Q Q2 | 1.40% | 0.80% | 1.60% | |
| 01:30 | AUD | PPI Y/Y Q2 | 5.60% | 3.80% | 4.90% | |
| 05:00 | JPY | Housing Starts Y/Y Jun | -2.20% | -1.20% | -4.30% | |
| 05:00 | JPY | Consumer Confidence Index Jul | 30.2 | 33 | 32.1 | |
| 05:30 | EUR | France Consumer Spending M/M Jun | 0.20% | -1.00% | 0.70% | 0.40% |
| 05:30 | EUR | France GDP Q/Q Q2 P | 0.50% | 0.20% | -0.20% | |
| 06:00 | EUR | Germany Import Price Index M/M Jun | 1.00% | 0.80% | 0.90% | |
| 06:30 | CHF | Real Retail Sales Y/Y Jun | 1.20% | 1.40% | -1.60% | -1.30% |
| 07:00 | CHF | KOF Leading Indicator Jul | 90.1 | 95.2 | 96.9 | 95.2 |
| 07:55 | EUR | Germany Unemployment Rate Jul | 5.40% | 5.30% | 5.30% | |
| 07:55 | EUR | Germany Unemployment Change Jul | 48K | 15K | 133K | |
| 08:00 | EUR | Germany GDP Q/Q Q2 P | 0.00% | 0.10% | 0.20% | |
| 08:00 | EUR | Italy GDP Q/Q Q2 P | 1.00% | 0.30% | 0.10% | |
| 08:30 | GBP | Mortgage Approvals Jun | 64K | 64K | 66K | |
| 08:30 | GBP | M4 Money Supply M/M Jun | -0.30% | 0.70% | 0.50% | |
| 09:00 | EUR | Eurozone GDP Q/Q Q2 P | 0.70% | 0.10% | 0.60% | |
| 09:00 | EUR | Eurozone CPI Y/Y Jul P | 8.90% | 8.70% | 8.60% | |
| 09:00 | EUR | Eurozone CPI Core Y/Y Jul P | 4.00% | 3.80% | 3.70% | |
| 12:30 | CAD | GDP M/M May | 0.00% | -0.20% | 0.30% | |
| 12:30 | USD | Personal Income M/M Jun | 0.60% | 0.50% | 0.50% | 0.60% |
| 12:30 | USD | Personal Spending Jun | 1.10% | 0.90% | 0.20% | 0.30% |
| 12:30 | USD | PCE Price Index M/M Jun | 1.00% | 0.50% | 0.60% | |
| 12:30 | USD | PCE Price Index Y/Y Jun | 6.80% | 6.70% | 6.30% | |
| 12:30 | USD | PCE Core Price Index M/M Jun | 0.60% | 0.50% | 0.30% | |
| 12:30 | USD | PCE Core Price Index Y/Y Jun | 4.80% | 4.70% | 4.70% | |
| 12:30 | USD | Employment Cost Index Q2 | 1.30% | 1.20% | 1.40% | |
| 13:45 | USD | Chicago PMI Jul | 56 | 56 | ||
| 14:00 | USD | Michigan Consumer Sentiment Index Jul F | 51.1 | 51.1 |
Canada GDP unchanged in May, grew 0.1% mom in Jun
Canada GDP was essentially unchanged in May, better than expectation of -0.2% mom contraction. Services-producing industries rose grew 0.4% mom while goods-producing industries contracted -1.0%. 14 of 20 industrial sectors increased.
Advance information indicates that GDP grew 0.1% mom in June, as output was up in the construction, manufacturing, and accommodation and food services sectors. Also, GDP grew 1.1% qoq in Q2.
US PCE inflation rose to 6.8% yoy, core CPI rose to 4.8% yoy
US personal spending rose 0.6% mom or USD 133.5B in June, above expectation of 0.5% mom. Personal spending rose 1.1% mom or USD 181.1B, above expectation of 0.9% mom. The rise in spending reflected USD 94.9B increase in goods and USD 86.2B in services.
Headline PCE price index accelerated from 6.3% yoy to 6.8% yoy, above expectation of 6.7% yoy. That's also the highest level since January 1982. Core PCE price index also rose from 4.7% yoy to 4.8% yoy, above expectation of 4.7% yoy.
Chinese PMIs and Potential Signs of Recovery
Overnight, reports surfaced that the Chinese government was "backing away" from its growth target for this year. The media pointed to a recent Communist Party planning meeting in which the target wasn't mentioned. Remember that the NPC earlier set the growth target at 5.5%, one of the lowest in decades. This also comes after disappointing Q2 preliminary GDP figures.
But the question is whether a downgraded outlook simply is taking into account the effects of what has already happened, or there is worry of another downturn. Covid cases have been rising around the world, with Japan recording a record number of new cases.
Broader implications
Most economies have assumed covid will continue in the background, while China insists on a zero-covid policy. Given the difficulties in predicting how the Chinese government might react to case numbers, it makes it harder to predict how the economy will develop. And investors are loath to commit money when they don't know whether there will be rolling lockdowns in the near future.
For countries that supply China, the situation is concerning. But, despite factory shutdowns, Chinese imports of raw materials have remained consistent. Inventories have actually fallen, suggesting demand for commodities could remain stable for the remainder of the year. Consumer demand, however, has been suffering, and could contribute to an export disconnect between Australia and New Zealand. Meanwhile, Japanese exporters benefit from lower yen.
Turning to the data
PMIs have returned to expansion territory following the lifting of lockdowns. As a leading indicator, it could be a sign that the economic situation is improving. This is a crucial time for Chinese manufacturers as they work to meet higher demand expected ahead of the holiday season. The consensus among analysts is that Chinese firms will report improving optimism this month.
A minor difference between the official (NBS) and private (Caixin) survey is expected. This could be explained by the official measure covering mostly larger, state-run companies which are less exposed to the housing market. Caixin covers smaller businesses that are more export oriented and could reflect general concern for slowing global economic growth.
What to look out for
Official NBS Manufacturing PMI is forecast to improve slightly to 50.4 from 50.2 in June. Though it is so close to the mid-level that a miss of just a few decimals could put it back into contraction and worry the market. NBS Non-Manufacturing PMI is forecast to improve further to 55.6 from 54.7 prior.
Private Caixin Manufacturing PMI comes out on Monday and is expected to slip a couple decimal points to 51.5 from 51.7 prior. That implies staying solidly in expansion. Caixin Services PMI comes out on Wednesday and is forecast to also expand to 55.2 from 54.5 prior.