Sample Category Title
EUR/USD Pair Started a Recovery Above $1.0180
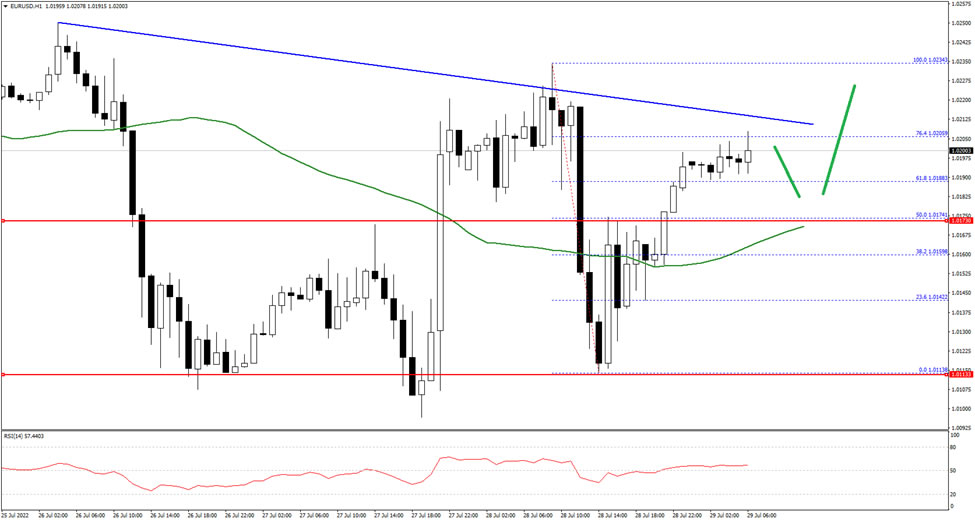
The Euro started a fresh recovery wave above the 1.0150 zone against the US Dollar. The EUR/USD pair climbed above the 1.0180 resistance but it faced sellers.
The pair faced sellers near the 1.0200 zone and is currently consolidating. However, the pair has settled above the 1.0180 level and the 50 hourly simple moving average. An immediate resistance on the upside is near 1.0210 and a connecting bearish trend line on the hourly chart.
On the upside, the first major resistance is near the 1.0235 level. A break above the 1.0210 and 1.0235 resistance levels could start a decent recovery wave. In the stated case, it could even surpass 1.0265 on FXOpen.
If not, the pair might drop below 1.0180. The next key support is near 1.0150, below the pair could decline towards the 1.0120 level in the near term. Any more losses might send the pair towards the 1.0080 level.
USDJPY Turns to a Correction; How Deep Can It Go?
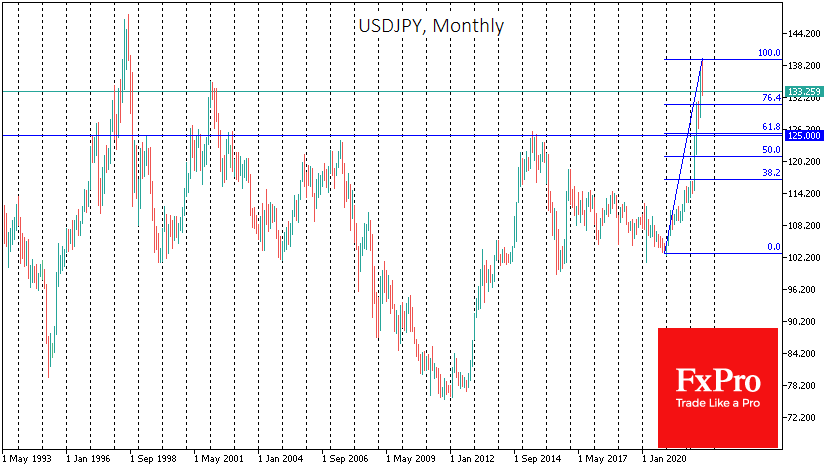
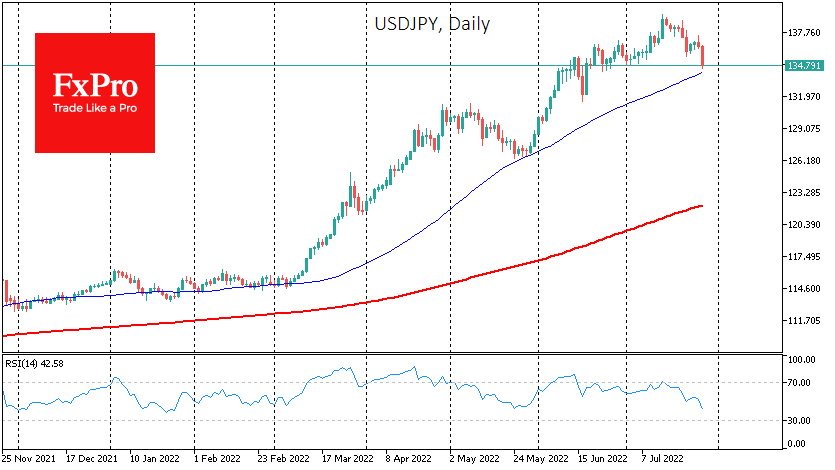
The Japanese yen has gained 3.4% against the dollar in less than 48 hours, recovering to 132.7 from a month and a half ago. Before that, from early March to mid-July, USDJPY soared by more than 20% on diverging monetary policy from the Fed and BoJ.
However, the markets have recently started to speculate that the Fed will soon return to a rate cut in a year’s time. Against this background, the yields of American 10-year bonds are falling, narrowing the spread between them and the same Japanese securities. However, we must note that the currency market was one month late with its reaction, changing the USDJPY trend one month after the reversal in U.S. 10-year bonds.
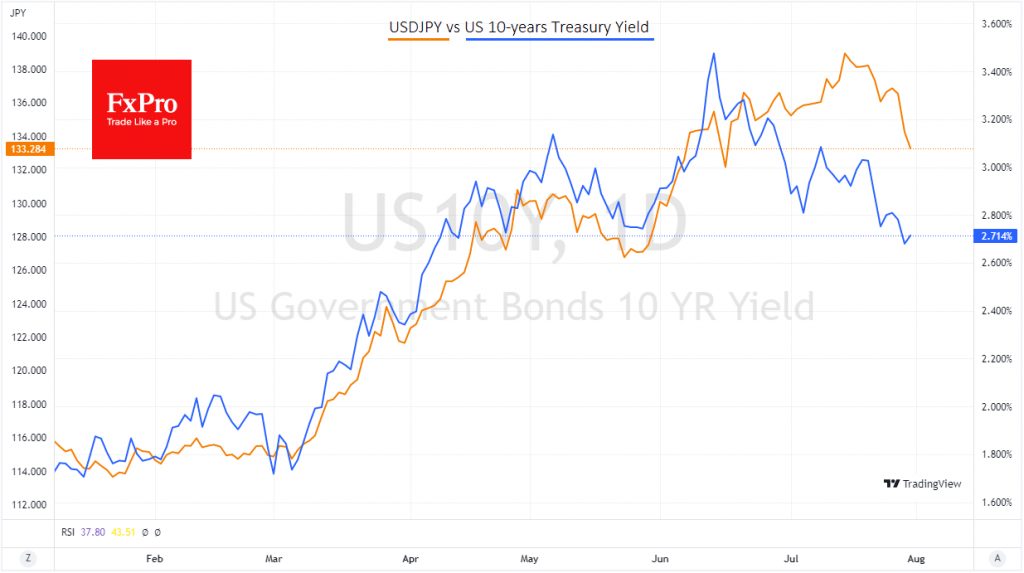
The sell-off in USDJPY intensified after the Fed meeting, although the trend in other currency pairs is not as evident. Most likely, USDJPY has moved into the correction phase of the last movement and has not yet exhausted its downside potential.
The first line of defence of the uptrend in the form of the 50-day moving average has an onslaught on Friday morning. Now the focus for the short-term traders is the pair’s ability to hold on to the 76.4% Fibonacci retracement line from the March-July rally, which passes at 133 – near the current price.
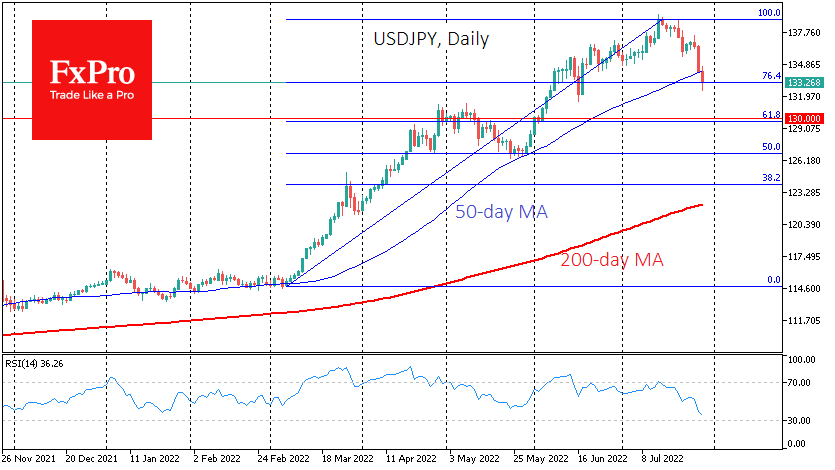
However, it would not be surprising if the correction extends to 130, the more significant 61.8% Fibonacci retracement line of that rally and the psychologically important round number, where the April-May rally had already stopped for a breather.
Suppose the August lull in the currency market turns into a correction. In that case, the USDJPY might well slide to 125, which is the next major round level, the area of cyclical peaks for most of the last 20 years and 61.8% of the Fibonacci retracement of the pair’s momentum from the beginning of 2021.
GBPJPY Drops Sharply Erasing Recent Advance
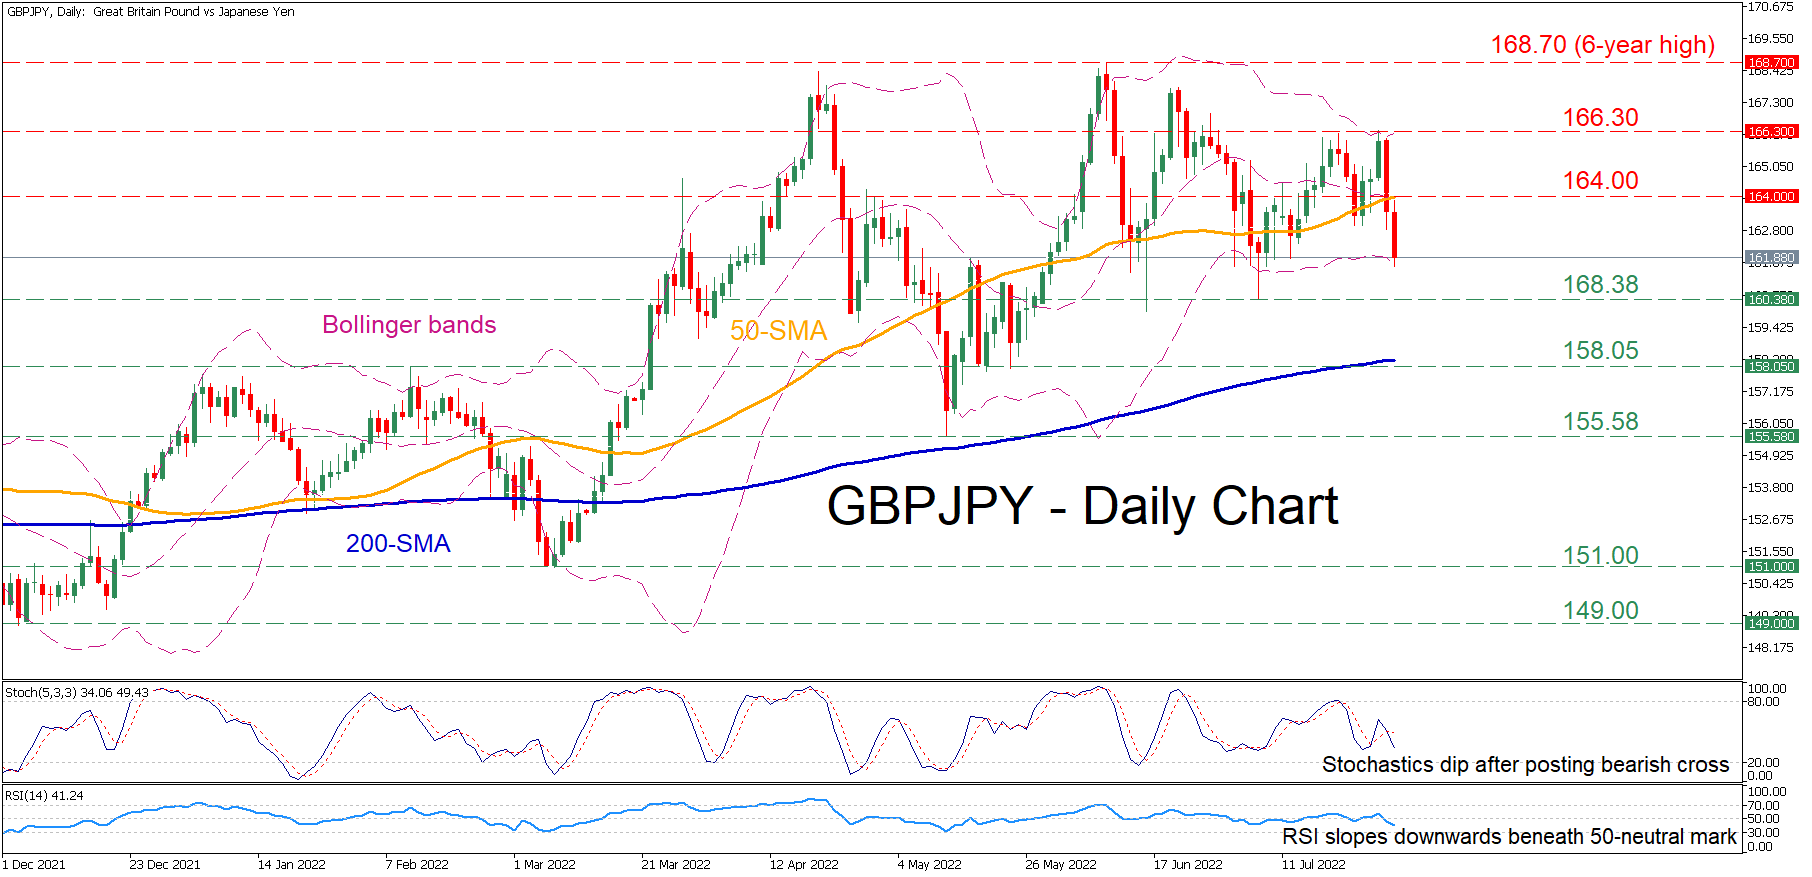
GBPJPY had been slowly gaining ground in the past three weeks, trading above its 50-day simple moving average (SMA) and recording continuous higher highs. However, in the past two sessions the pair has come under significant downside pressure, with its slump coming to a halt for now at the lower Bollinger band.
The momentum indicators are reflecting a negative near-term tone. Specifically, the stochastic oscillator is falling after posting a bearish cross, while the RSI is descending steeply below its 50-neutral mark.
Should selling interest intensify further, the recent low of 168.38 could provide initial support. If that floor collapses, the bears might aim for the 158.05 barrier before the May low of 155.58 appears on the radar. Any further price declines could then stall at the March low of 151.00.
On the flipside, if buyers re-emerge and push the price higher, the 50-day SMA, currently at 164.00, could act as immediate resistance. Piercing thought that zone, the price could ascend to challenge the 166.30 region. An upside violation of the latter may open the door for the 6-year high of 168.70.
Overall, GBPJPY’s short-term picture seems to be deteriorating but it has not turned bearish yet. Nevertheless, a clear jump above the 50-day SMA could signal the resumption of the pair’s latest rebound.
Eurozone CPI rose to record 8.9% yoy, core CPI rose to 4% yoy
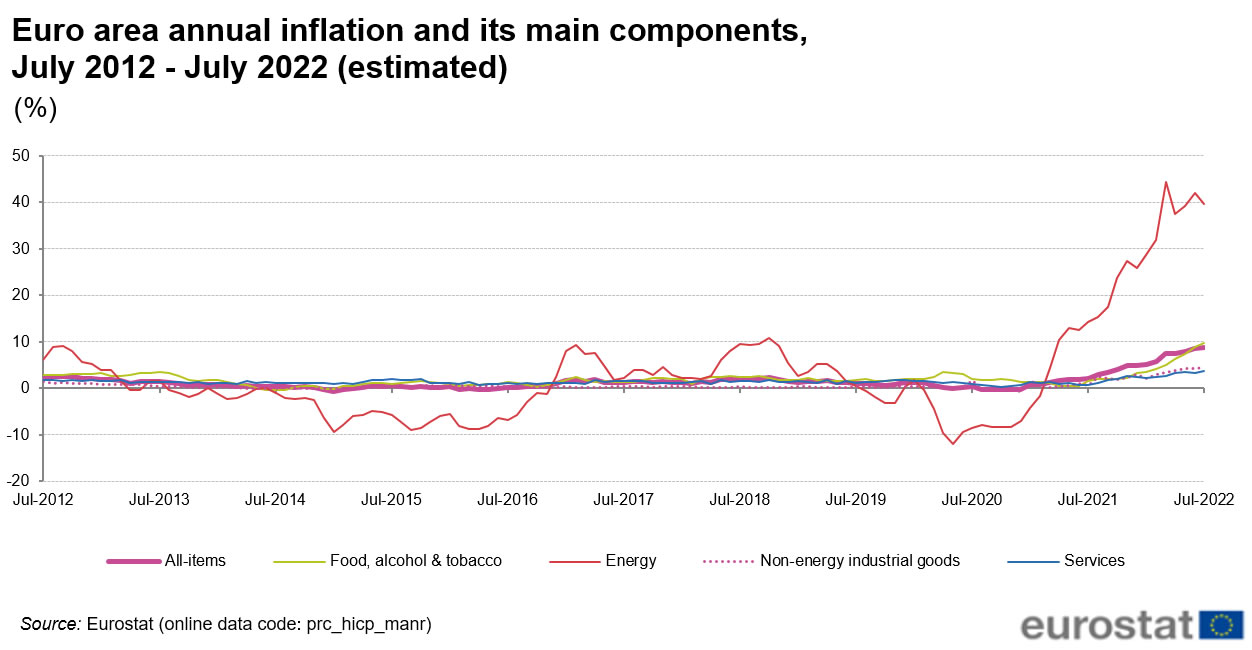
Eurozone CPI rose from 8.6% yoy to 8.9% yoy in July, above expectation of 8.7% yoy. That's also another record high. CPI core (all-items ex energy, food, alcohol & tobacco) rose from 3.7% yoy to 4.0% yoy, above expectation of 3.8% yoy.
Looking at the main components inflation, energy is expected to have the highest annual rate in July (39.7%, compared with 42.0% in June), followed by food, alcohol & tobacco (9.8%, compared with 8.9% in June), non-energy industrial goods (4.5%, compared with 4.3% in June) and services (3.7%, compared with 3.4% in June).
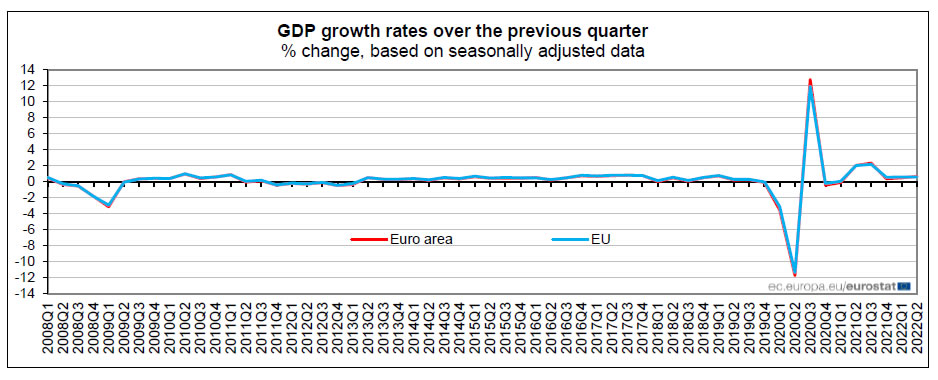
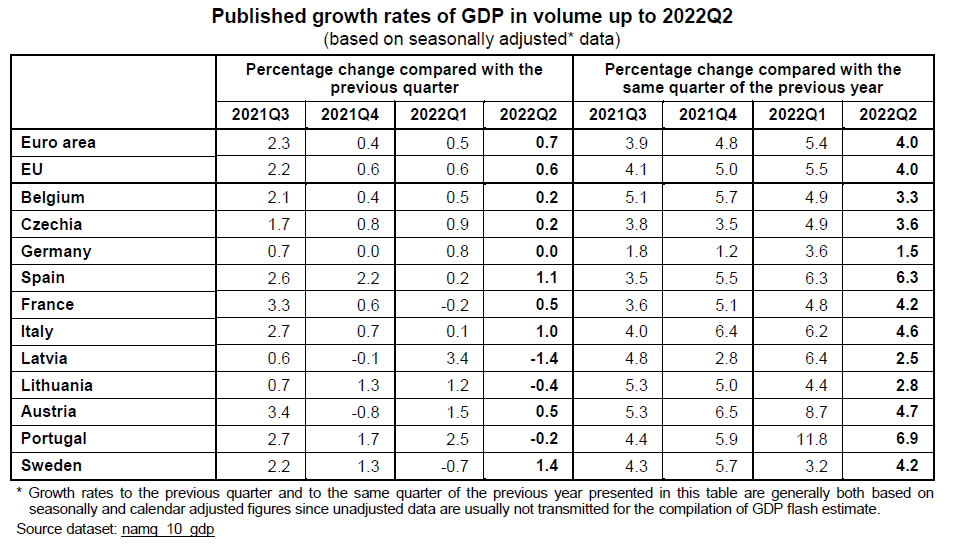
Eurozone GDP grew 0.7% qoq in Q2, EU up 0.6% qoq
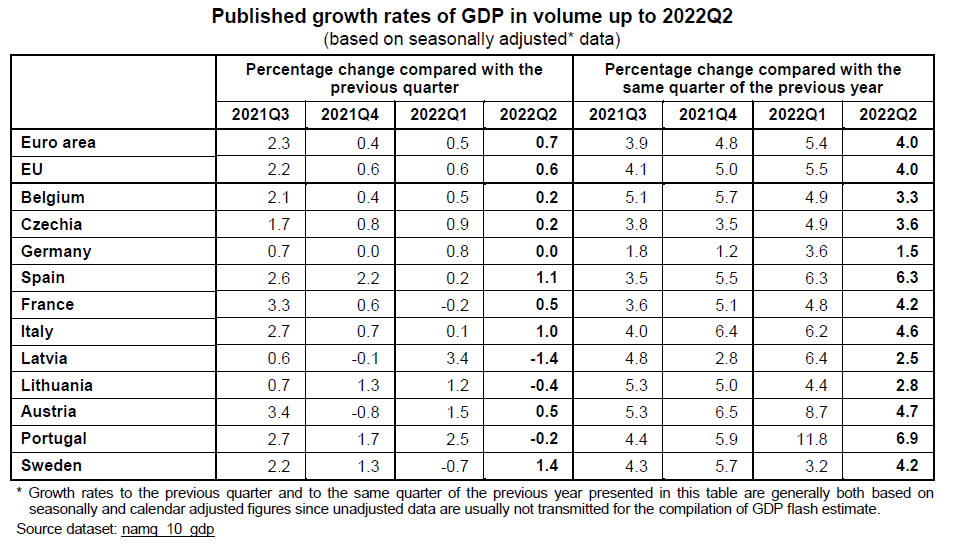
Eurozone GDP grew 0.7% qoq in Q2, well above expectation of 0.1% qoq. Comparing with same quarter of last year, GDP grew 4.0% yoy.
EU GDP grew 0.6% qoq, 4.0% yoy. Among the Member States for which data are available for the second quarter 2022, Sweden (+1.4%) recorded the highest increase compared to the previous quarter, followed by Spain (+1.1%) and Italy (+1.0%). Declines were recorded in Latvia (-1.4%), in Lithuania (-0.4%) and in Portugal (-0.2%). The year on year growth rates were positive for all countries.
Bitcoin Climbing Out of the Pit But Not Yet Ready to Fly
Bitcoin closed Thursday near $24,000, retesting that area after a failed attempt to climb higher in the middle of last week. The first cryptocurrency has added 3.8% over 24 hours, about as much as it has gained in the past seven days. Ethereum has added 4.8% in 24 hours, to $1720. Altcoins from the top 10 gained between 3.8% (BNB) and 10% (Solana).
The total capitalisation of the crypto market, according to CoinMarketCap, rose by 3.8% to $1.1 trillion overnight.
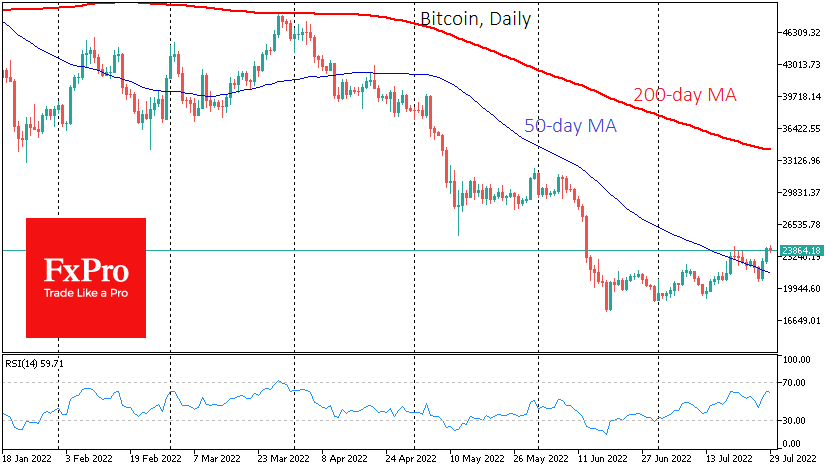
Bitcoin has closed above its 50-day moving average for two days. Closing the week above 22,700 would be a telling return to territory above the 200-week moving average.
Such a technical disposition could inspire retail buyers. Other factors are at work for institutionalists, notably a recovery in demand for risky assets and a pullback of the dollar from multi-year highs.
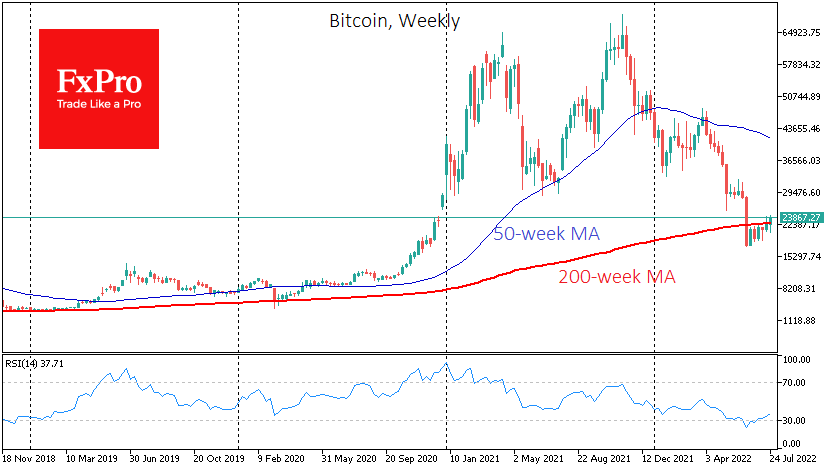
However, the longer-term and whole picture is working against the buyers. As long as we see tightening monetary and economic conditions, the crypto market has to move against the tide. In addition, Guggenheim Partners’ widely held view remains that the industry has not yet been “cleared” of distressed participants. Crypto will be in trouble long-term because of regulatory pressure and a lack of strong institutional support.
According to the IMF, the cryptocurrency market will fall if the economy went into recession. Preliminary US GDP data released on Thursday confirmed the start of a technical recession in the country.
The UK has suggested that cryptocurrencies be treated as a new property type, making it much easier to protect investors in this instrument.
A Tricky First Reaction to the Fed. It Gets Worse from Here
The Fed raised the rate by 75 points as expected by most, but this caused a relief rally in risk-sensitive assets. Powell also expressed his willingness to increase the rate further. Nor did he rule out further abnormal steps if the data demanded it.
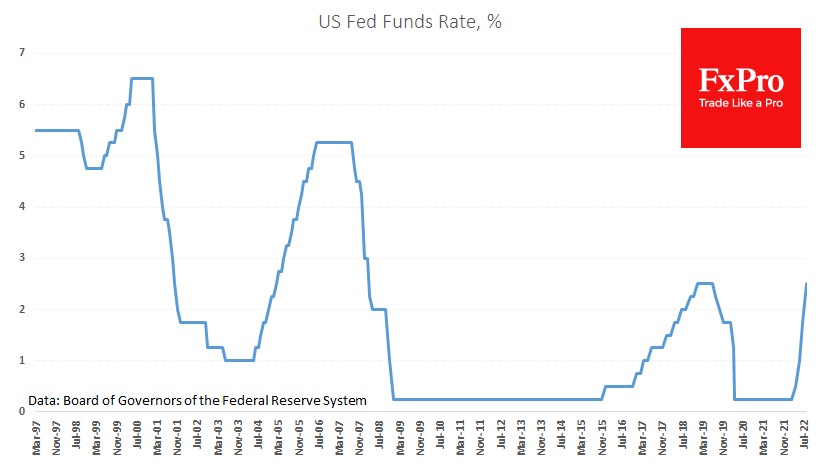
Looking at the market reaction, one would think that the rate was cut, or at least promised not to raise it soon: S&P500 is up more than 2.2%, crypto market capitalization is up almost 9%, silver added 4.5%, gold 1.5%.
The market tried to play the “buy rumours, sell facts” game. On top of that, there was a more than 25% chance of an immediate 100-point rise. The market balancing act gave the impression that yesterday’s Fed move brought positive. But several signs make it doubtful that the latest rally lasts.
On Thursday, dollar buyers returned to the currency market, but the decline in the USDJPY to lows has been even more remarkable since the start of July. This indicates that big capital is not too keen to celebrate the interest rate hike and is carefully selling risky assets.
It’s also worth remembering that the Fed is holding the most aggressive rate hike in 40 years, tightening financing conditions. Already this has resulted in a housing market disaster, with sales volumes dropping by around 20% from last year’s levels.
The US economy has had a more challenging time with slower rate increases since the global financial crisis. The latest, most drastic tightening has occurred in recent months, and the transmission period between rate changes and the effects on the economy takes half a year at the earliest.
So the new figures of a second consecutive quarter of GDP contraction in the USA are only the first echoes of the impact on the economy in the coming months. Accordingly, consumers and companies will also feel worse, affecting global risk appetite.
USDCAD Moves South with Weak Momentum; Immediate Support at 200-Day SMA
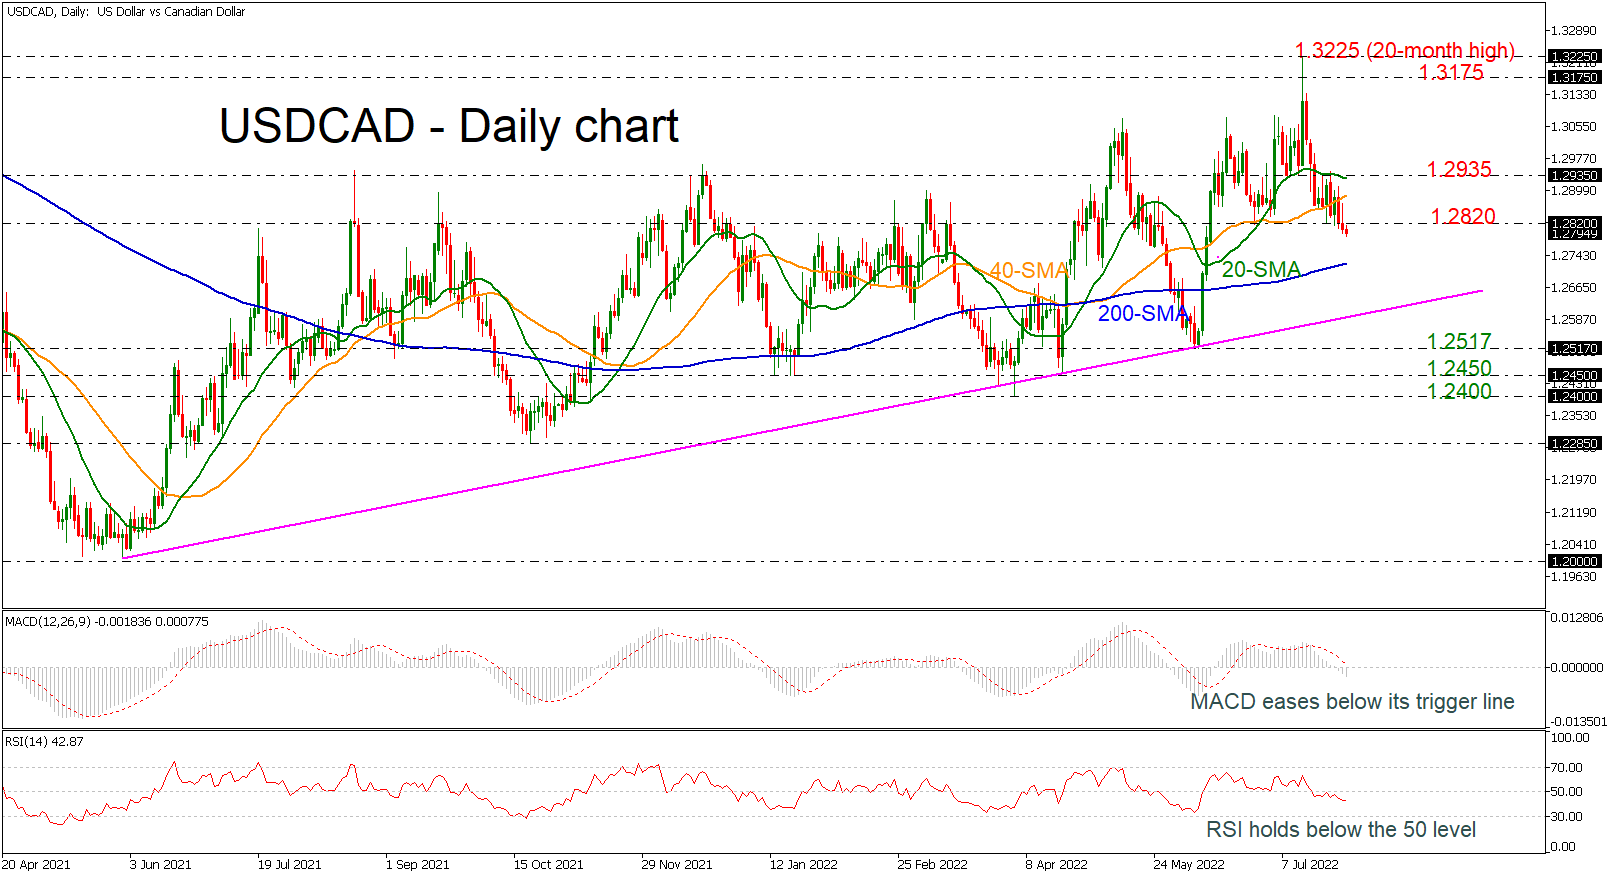
USDCAD is easing with weak momentum below the short-term simple moving averages (SMAs) but is still above the long-term ascending trend line.
According to the technical indicators, the MACD is losing ground below its trigger and zero lines, while the RSI failed several times to surpass above the neutral threshold of 50 and is now pointing downwards. In trend indicators, the 20- and 40-day SMAs are getting closer to posting a bearish crossover if the price continues the negative movement.
Should selling forces strengthen, the 200-day SMA at 1.2720 will be a strong support level for the bulls, while the uptrend line around 1.2600 may keep the bias on the positive side. Penetrating the aforementioned levels, the 1.2517 barrier could next provide some footing ahead of the 1.2400-1.2450 area.
Alternatively, a close above the 1.2820 barrier and the short-term SMAs will brighten the broader outlook again, pushing the price towards the 1.2935 level and even higher until the 1.3175 resistance. Beyond that, the rally may gear up to the 20-month high of 1.3225.
In brief, USDCAD is facing a weakening bearish bias, where a drop below the 200-day SMA and the diagonal line is expected to enhance selling interest.
GBP/JPY Daily Outlook
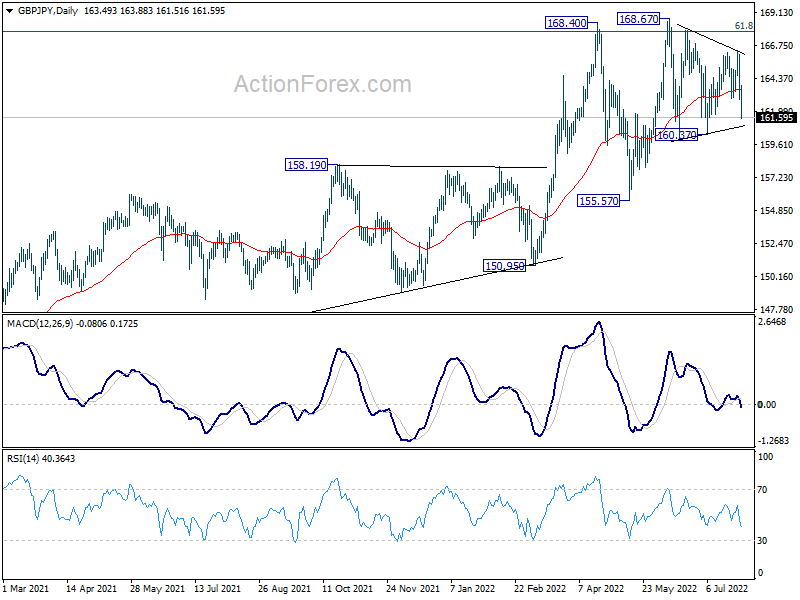
Daily Pivots: (S1) 162.20; (P) 164.16; (R1) 165.45; More...
GBP/JPY's steep decline suggests that corrective pattern from 168.67 has started another falling leg. Intraday bias is back on the downside for 160.37 support first. Decisive break there will argue that deeper fall is underway towards 155.57 support next. On the upside, though, break of 163.88 minor resistance will turn intraday bias neutral again first.
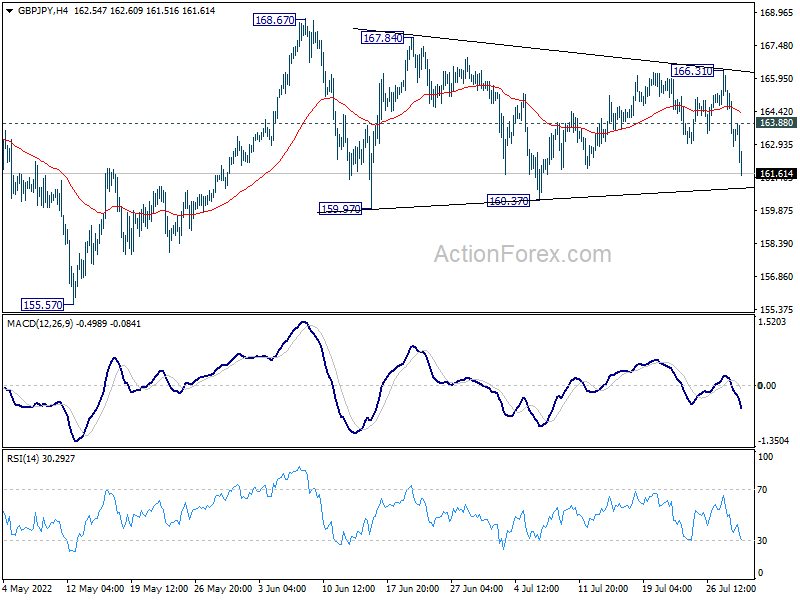
In the bigger picture, up trend from 123.94 (2020 low) is still in progress. Sustained break of 61.8% retracement of 195.86 (2015 high) to 122.75 (2016 low) at 167.93 will be a long term bullish signal, and could pave the way back to 195.86 high. This will now remain the favored case as long as 155.57 support holds, even in case of deep pull back.
EUR/JPY Daily Outlook
Daily Pivots: (S1) 135.73; (P) 137.54; (R1) 138.69; More....
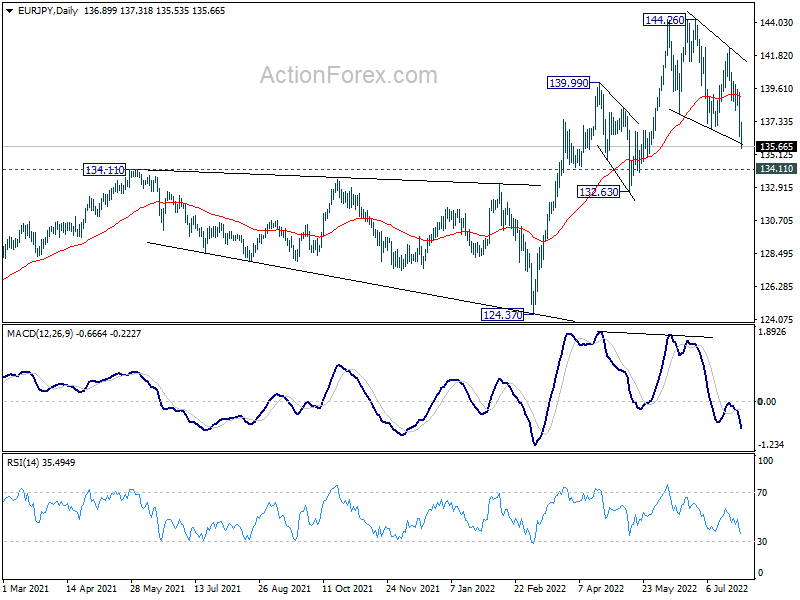
EUR/JPY's decline continues today and hits as low as 135.53 so far. Intraday bias remains on the downside for deeper fall to 134.11 medium term support next. At this point, price actions from 144.26 are still viewed as a corrective pattern only. Strong support should be seen above 134.11 to complete the correction. On the upside, above 137.31 minor resistance will turn intraday bias neutral first.
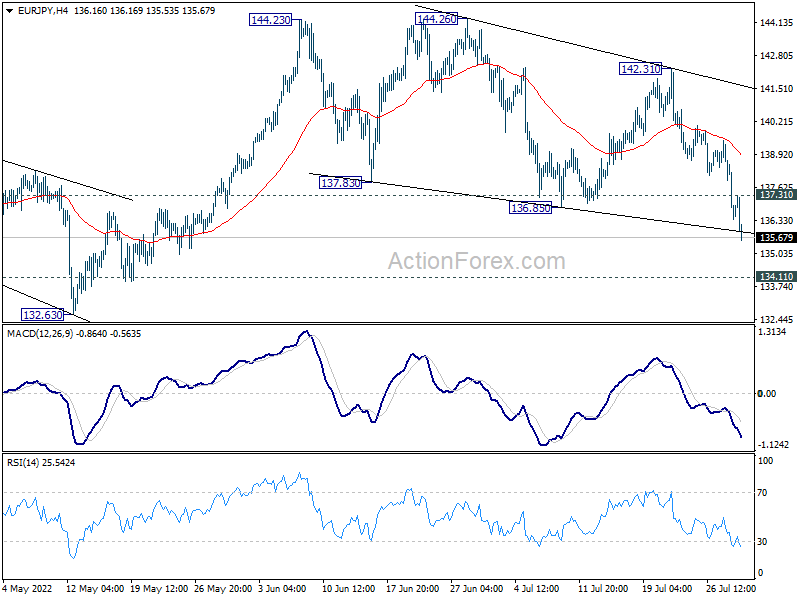
In the bigger picture, up trend from 114.42 (2020 low) is seen as the third leg of the pattern from 109.30 (2016 low). Further rally is in favor as long as 134.11 resistance turned support holds, even in case of deep pull back. Next target is 149.76 (2015 high). However, sustained break of 134.11 will be a sign of medium term bearish reversal and turn focus to 124.37 support for confirmation.