Sample Category Title
Japan industrial production rose record 8.9% mom in Jun, recovery to continue
Japan industrial production rose strongly by 8.9% mom in June, well above expectation of 3.7% mom. That's also the biggest monthly rise since data become available in 2013. Car production jumped 14.0% mom thanks to easing of lockdowns in Shanghai of China. Manufacturers surveyed by the Ministry of Economy, Trade and Industry (METI) expected output to extend its recovery by 3.8% in July and 6.0% in August.
Also released, retail sales rose 1.5% yoy in June, below expectation of 2.8% yoy. Unemployment rate was unchanged at 2.6% in June. Housing starts dropped -2.2% yoy in June, versus expectation of -1.2% yoy. Consumer confidence dropped from 32.1 to 30.2 in July, below expectation of 33.0.
BoJ opinions: Appropriate to encourage wage increases through monetary easing
In the Summary of Opinions at BoJ's July 20 and 21 meeting, it's noted that, "Bank should support financing, mainly of firms, and maintain stability in financial markets, and should not hesitate to take additional easing measures if necessary." Additionally, it is "appropriate for the Bank to maintain the current forward guidance for the policy rates."
"While Japan's economy is on its way to recovery from the pandemic, it has been under downward pressure due to an outflow of income from Japan caused by high commodity prices," one member noted. "In this situation, it is appropriate that the Bank encourage wage increases through monetary easing, aiming to achieve the price stability target in a sustainable and stable manner".
Technical Outlook and Review
DXY:
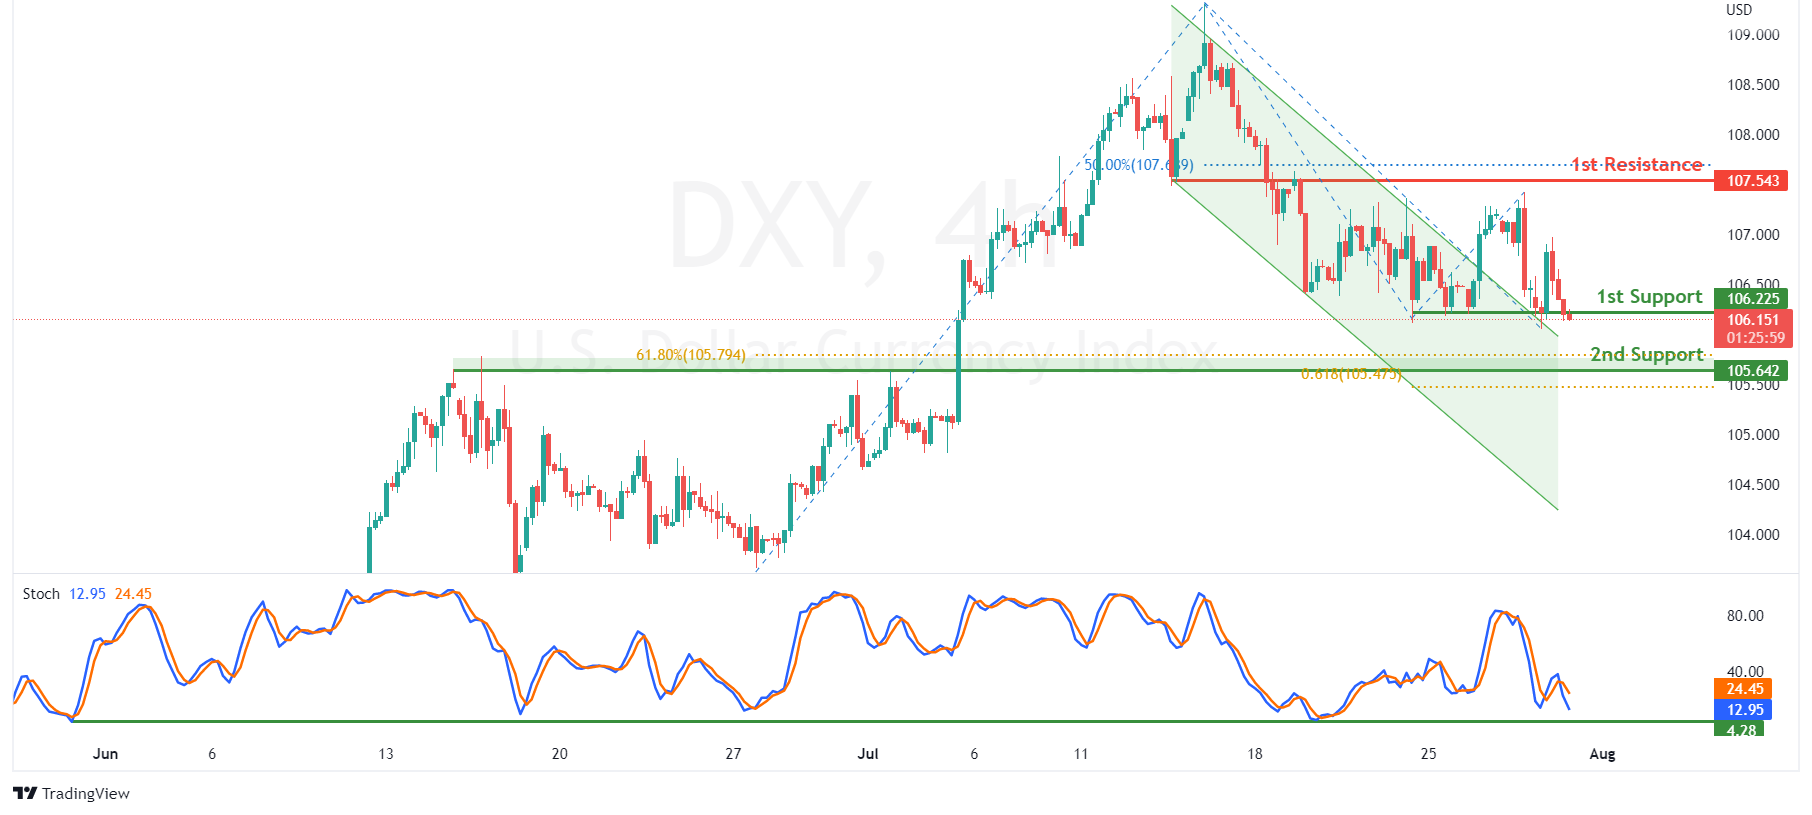
On the H4, with prices breaking out of the descending channel and expected to bounce off the stochastic support, we have a bullish bias that prices will drop and rise from the 1st support at 106.065 where the swing low support is to the 1st resistance at 106.988 where the pullback resistance and 23.6% fibonacci retracement are. Alternatively, price could break 1st support structure and head to 2nd support at 105.642 where the overlap support, 61.8% fibonacci retracement and 61.8% fibonacci projection are.
Areas of consideration:
- H4 time frame, 1st resistance at 106.988
- H4 time frame, 1st support at 106.065
XAU/USD (GOLD):
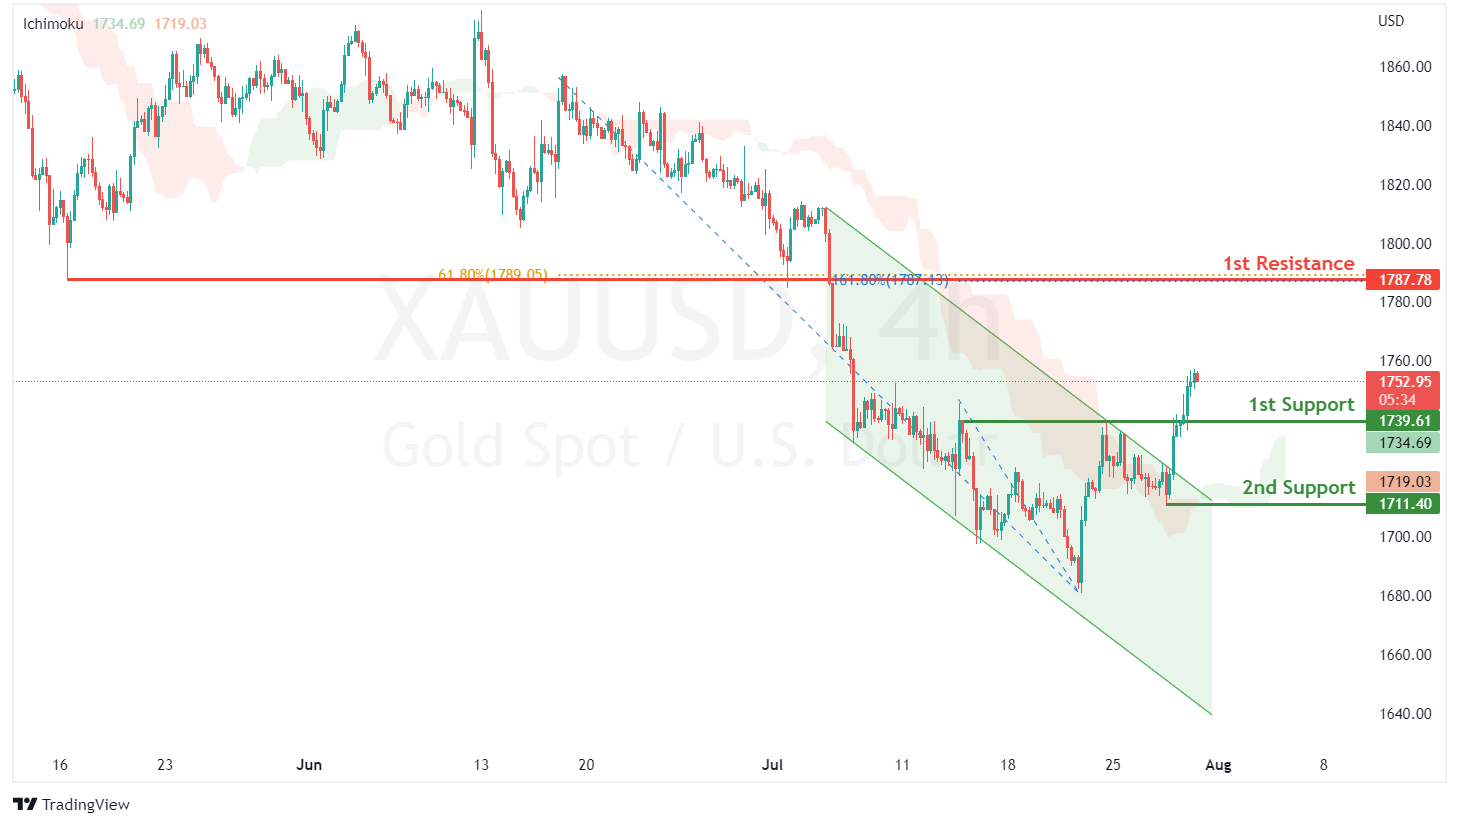
On the H4, with prices breaking out of a descending channel and moving above the ichimoku indicator, we have a bullish bias that price will drop and rise from the 1st support at 1739.61 where the overlap support is to 1st resistance at 1787.78 in line with pullback resistance, 161.8% fibonacci extension and 61.8% fibonacci retracement. Alternatively, prices could break 1st support and drop to 2nd support at 1711.40 where the swing low support is.
Areas of consideration:
- H4 time frame, 1st Resistance at 1787.78
- H4 time frame, 1st Support at 1739.61
GBP/USD:
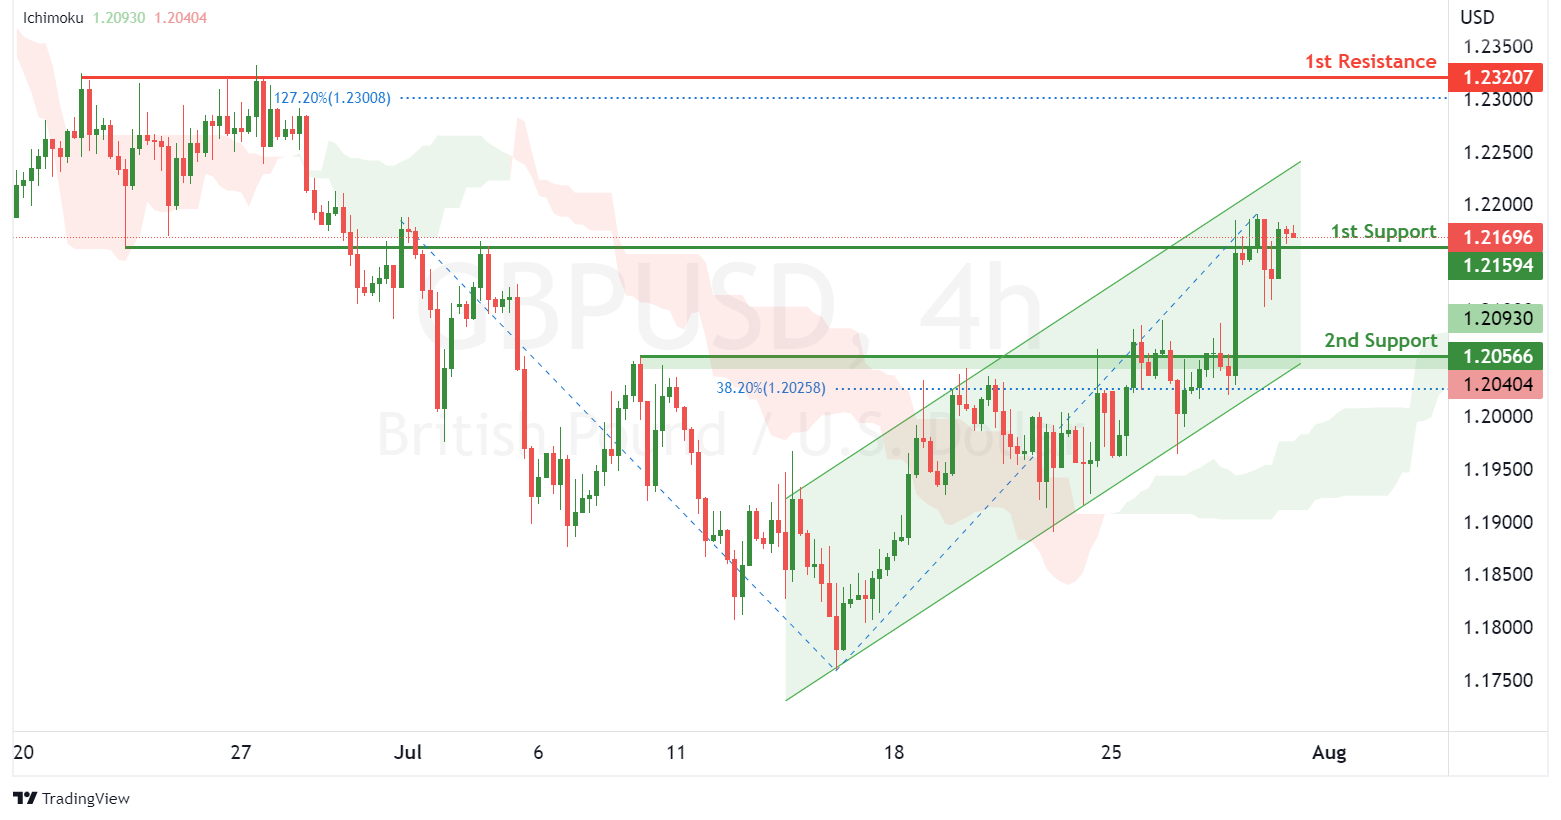
On the H4, with prices moving within an ascending channel and above the ichimoku indicator, we have a bullish bias that price will rise from the 1st support at 1.21594 where the pullback support is to the 1st resistance at 1.23207 where the swing high resistance and 127.2% fibonacci extension are. Alternatively, price could break 1st support and drop to 2nd support at 1.20566 where the pullback support and 38.2% fibonacci retracement are.
Areas of consideration:
- H4 1st resistance at 1.23207
- H4 1st support at 1.21594
USD/CHF:
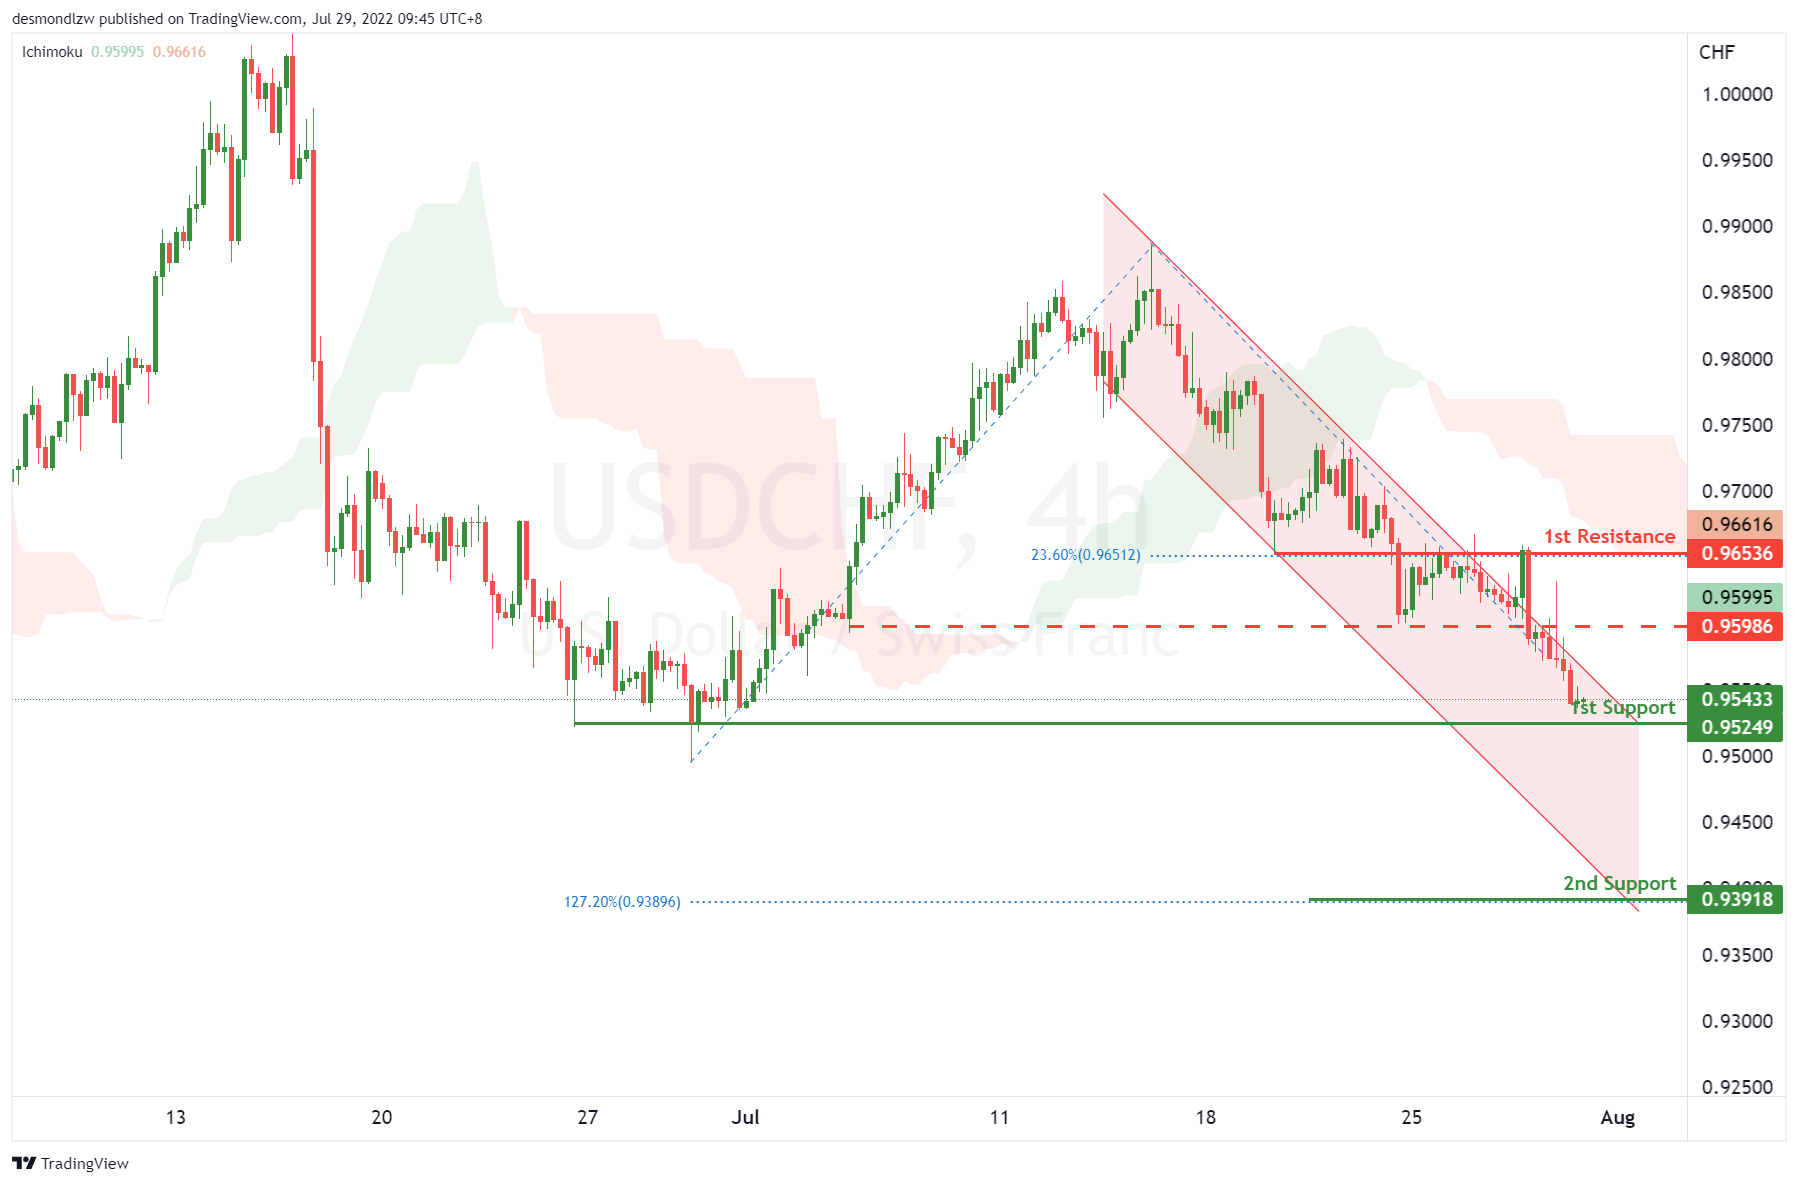
On the H4, with price moving along the descending channel, we have a bearish bias that price might drop from our 1st support at 0.95716, which is in line with 78.6% fibonacci retracement to the the 2nd support at 0.94953, which is in line with the swing low. Alternatively, price may bounce off from the 1st support and head for 1st resistance at 0.96536 where the 23.6% fibonacci retracement is. Take note the price of 0.97332 could be the 2nd resistance.
Areas of consideration
- 1st support level at 0.95716
- 2nd support level at 0.94953
EUR/USD :
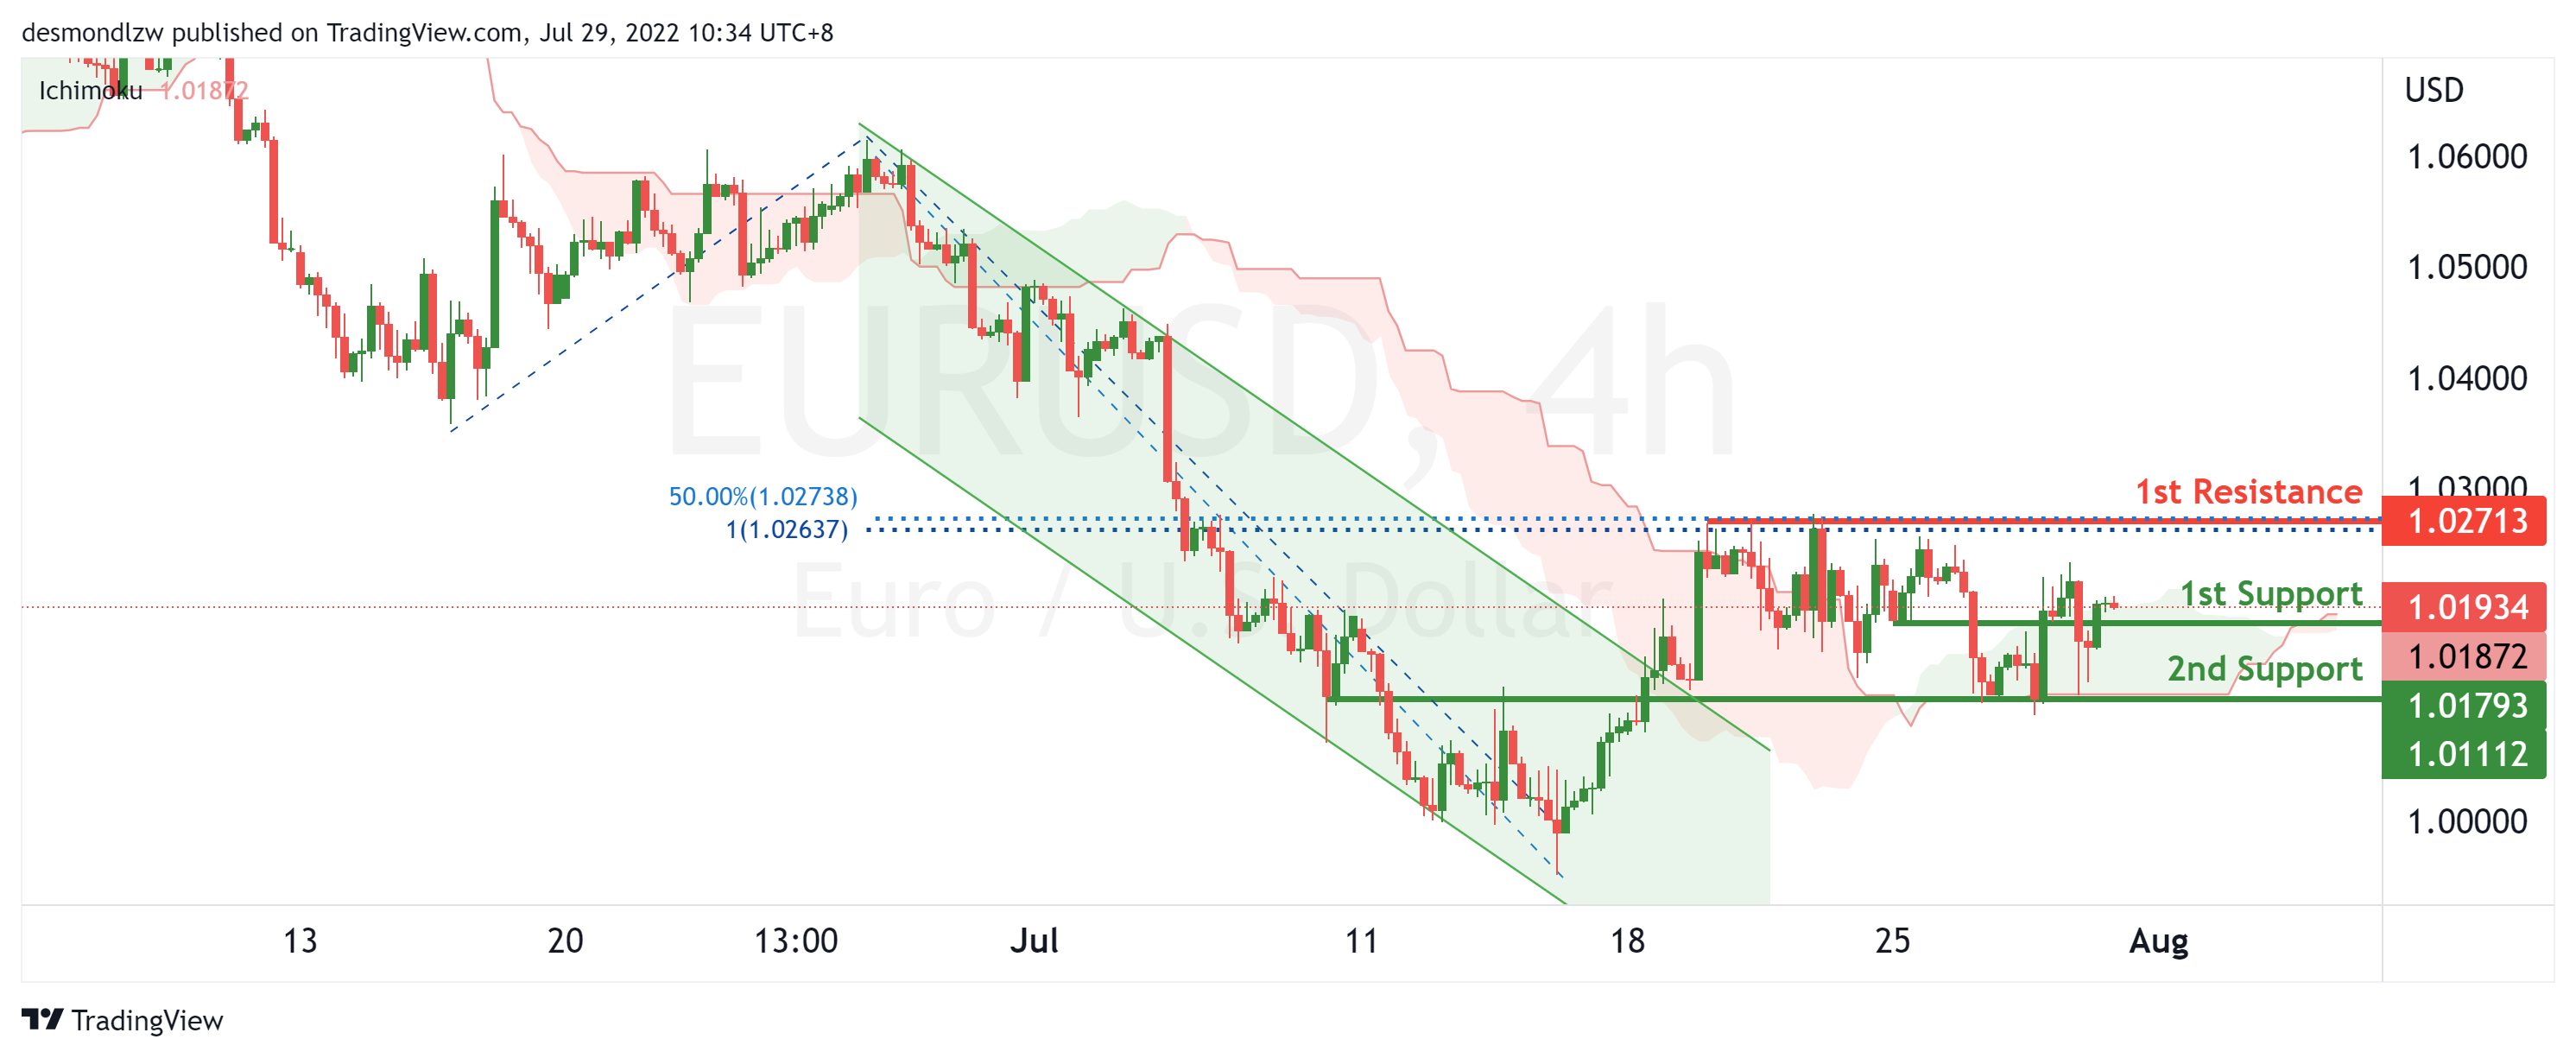
On the H4, with price bouncing off the ichimoku cloud and breaking out of the descending trend channel, we have a bullish bias that price will rise from the 1st support at 1.01782 at the pullback support to the 1st resistance at 1.02025 at the swing high in line with the 50% fibonacci retracement and 100% fibonacci projection . Alternatively, price may reverse off the 1st support and drop to the 2nd support at 1.01112 at the overlap support and swing low.
Areas of consideration :
- H4 1st resistance at 1.02025
- H4 1st support at 1.01782
USD/JPY:
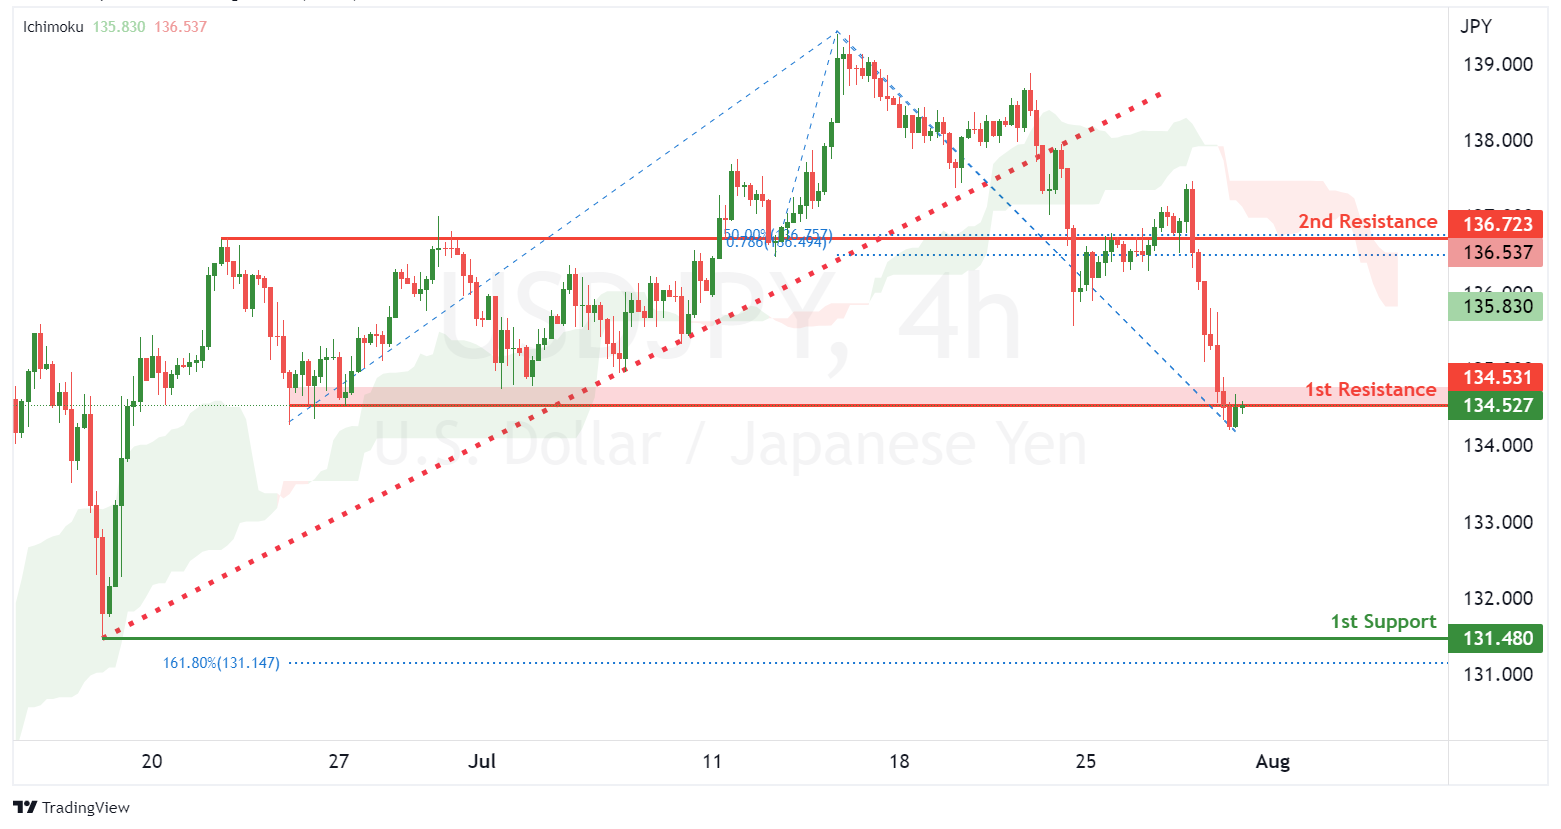
On the H4, with price broken out of the ascending trendline and moving below the ichimoku indicator, we have a bearish bias that price will drop to our 1st support at 134.258 where the pullback support, 100% fibonacci projection and -61.8% fibonacci expansion are. Once there is downside confirmation of price breaking 1st support, we would expect bearish momentum to carry price to 2nd support at 131.480 where the swing low support and 161.8% fibonacci extension are. Alternatively, price could head for 1st resistance at 136.723 where the overlap resistance, 50% fibonacci retracement and 78.6% fibonacci projection are.
Areas of consideration:
- H4 time frame, 1st resistance at 136.723
- H4 time frame, 1st support at 134.258
AUD/USD:
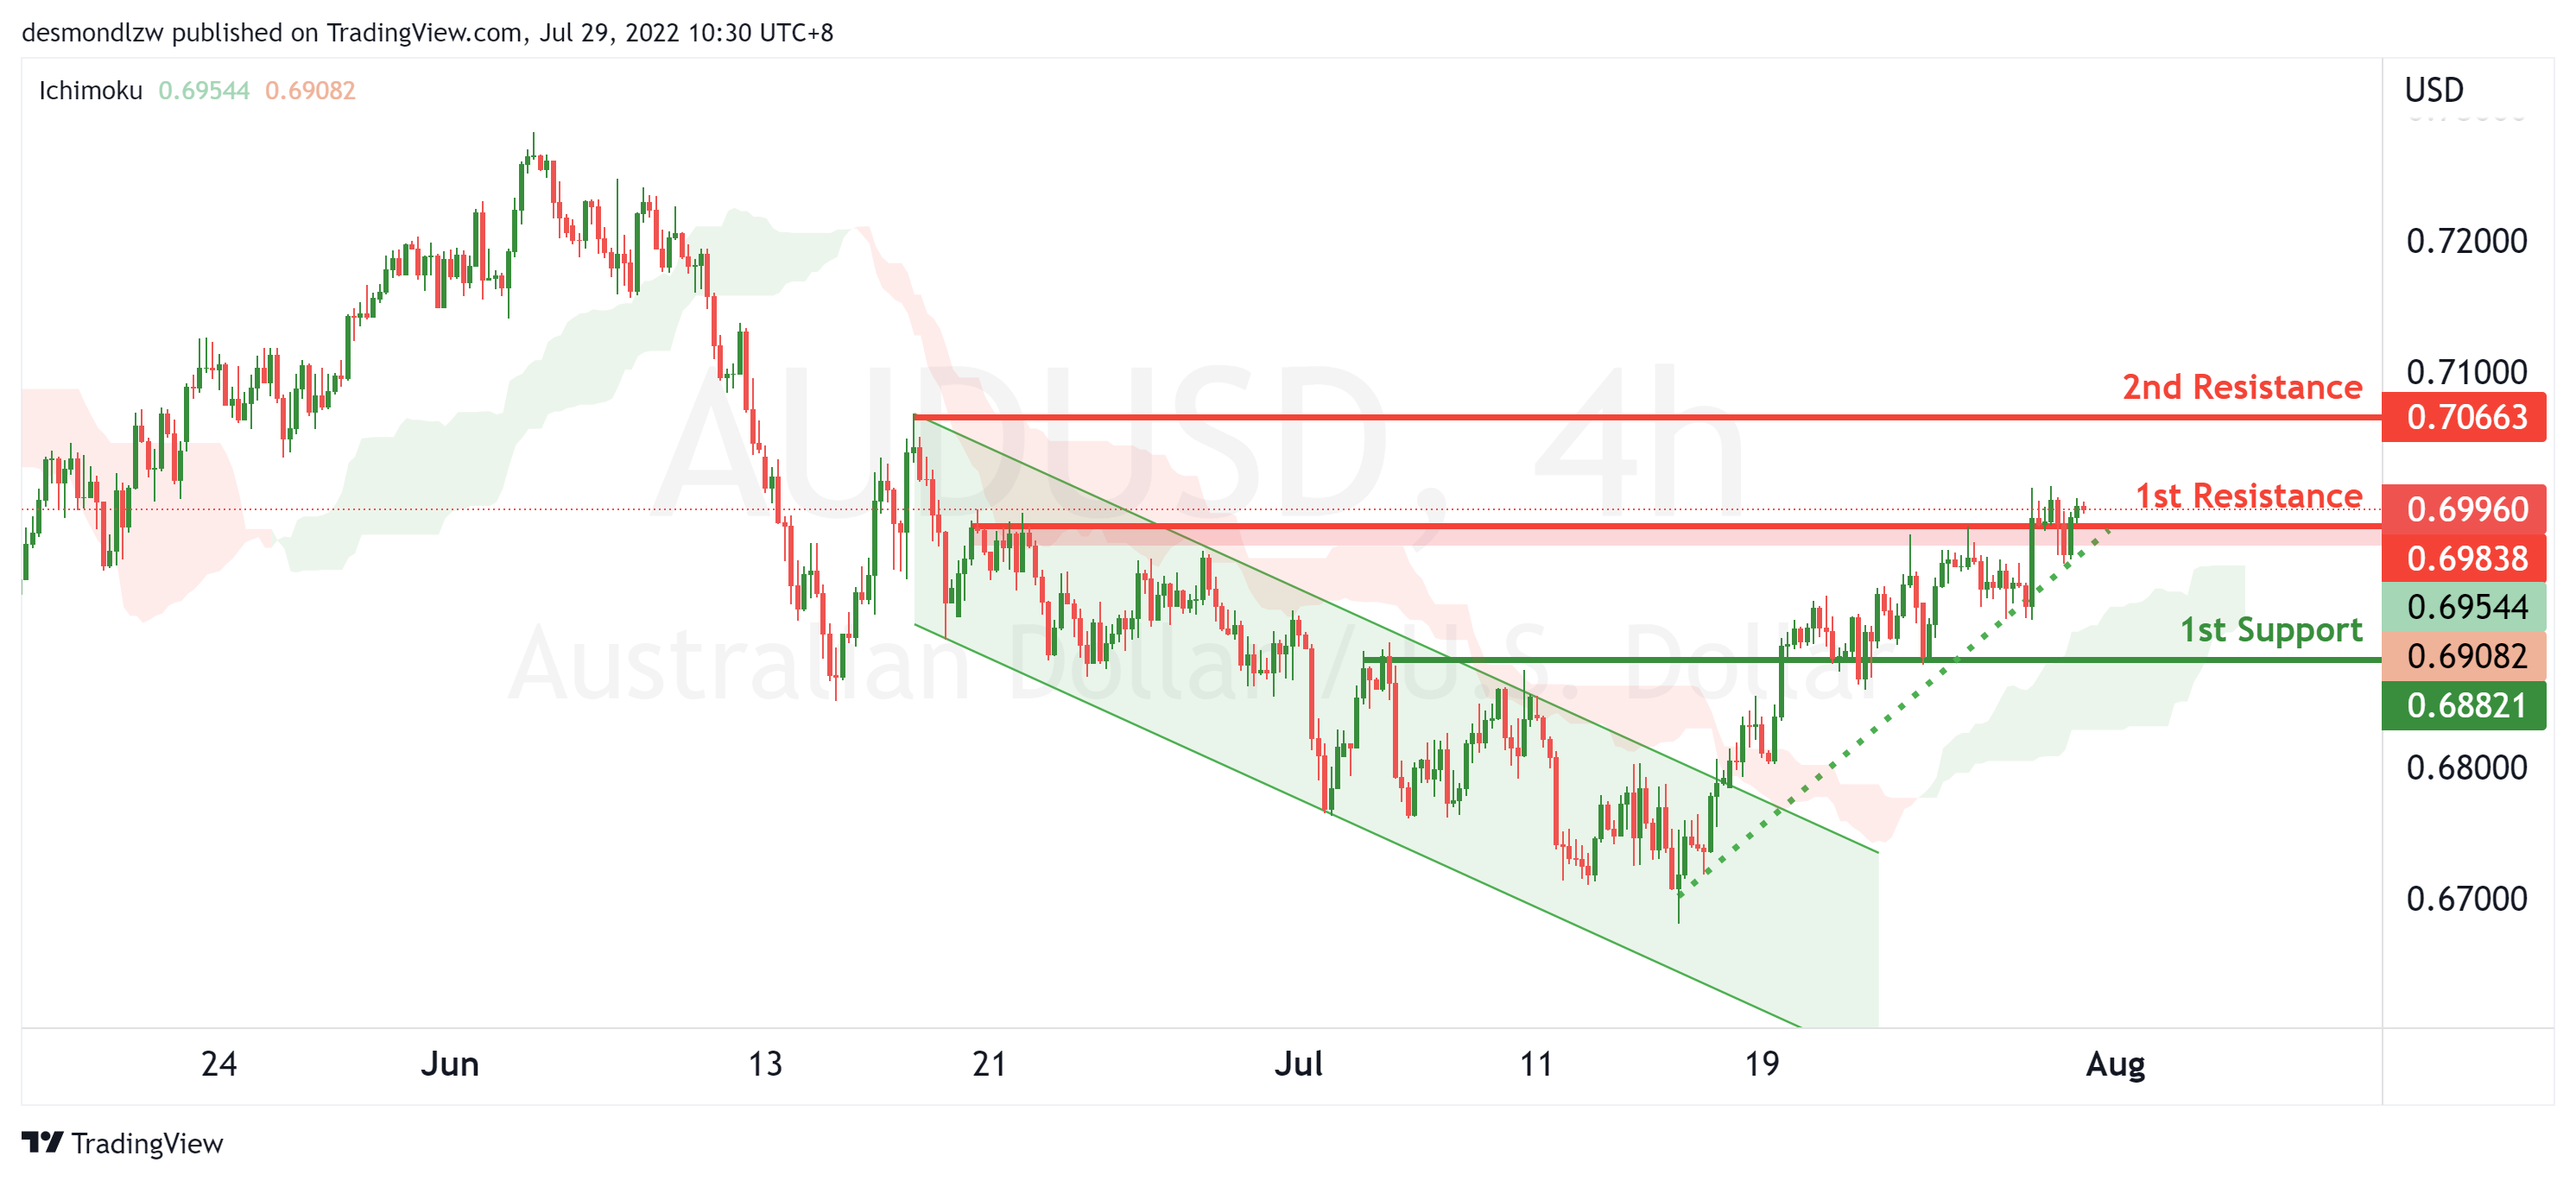
On the H4, with price moving above the ichimoku cloud and breaking out of the descending trend channel and moving in an ascending support, we have a bullish bias that price will rise from the 1st resistance at 0.69838 at the overlap resistance to the 2nd resistance at 0.70663 at the swing high. Alternatively, price may reverse off 1st resistance and drop to the 1st support at 0.68021 at the overlap support.
Areas of consideration:
- H4 1st resistance at 0.69838
- H4 1st support at 0.68021
NZD/USD:
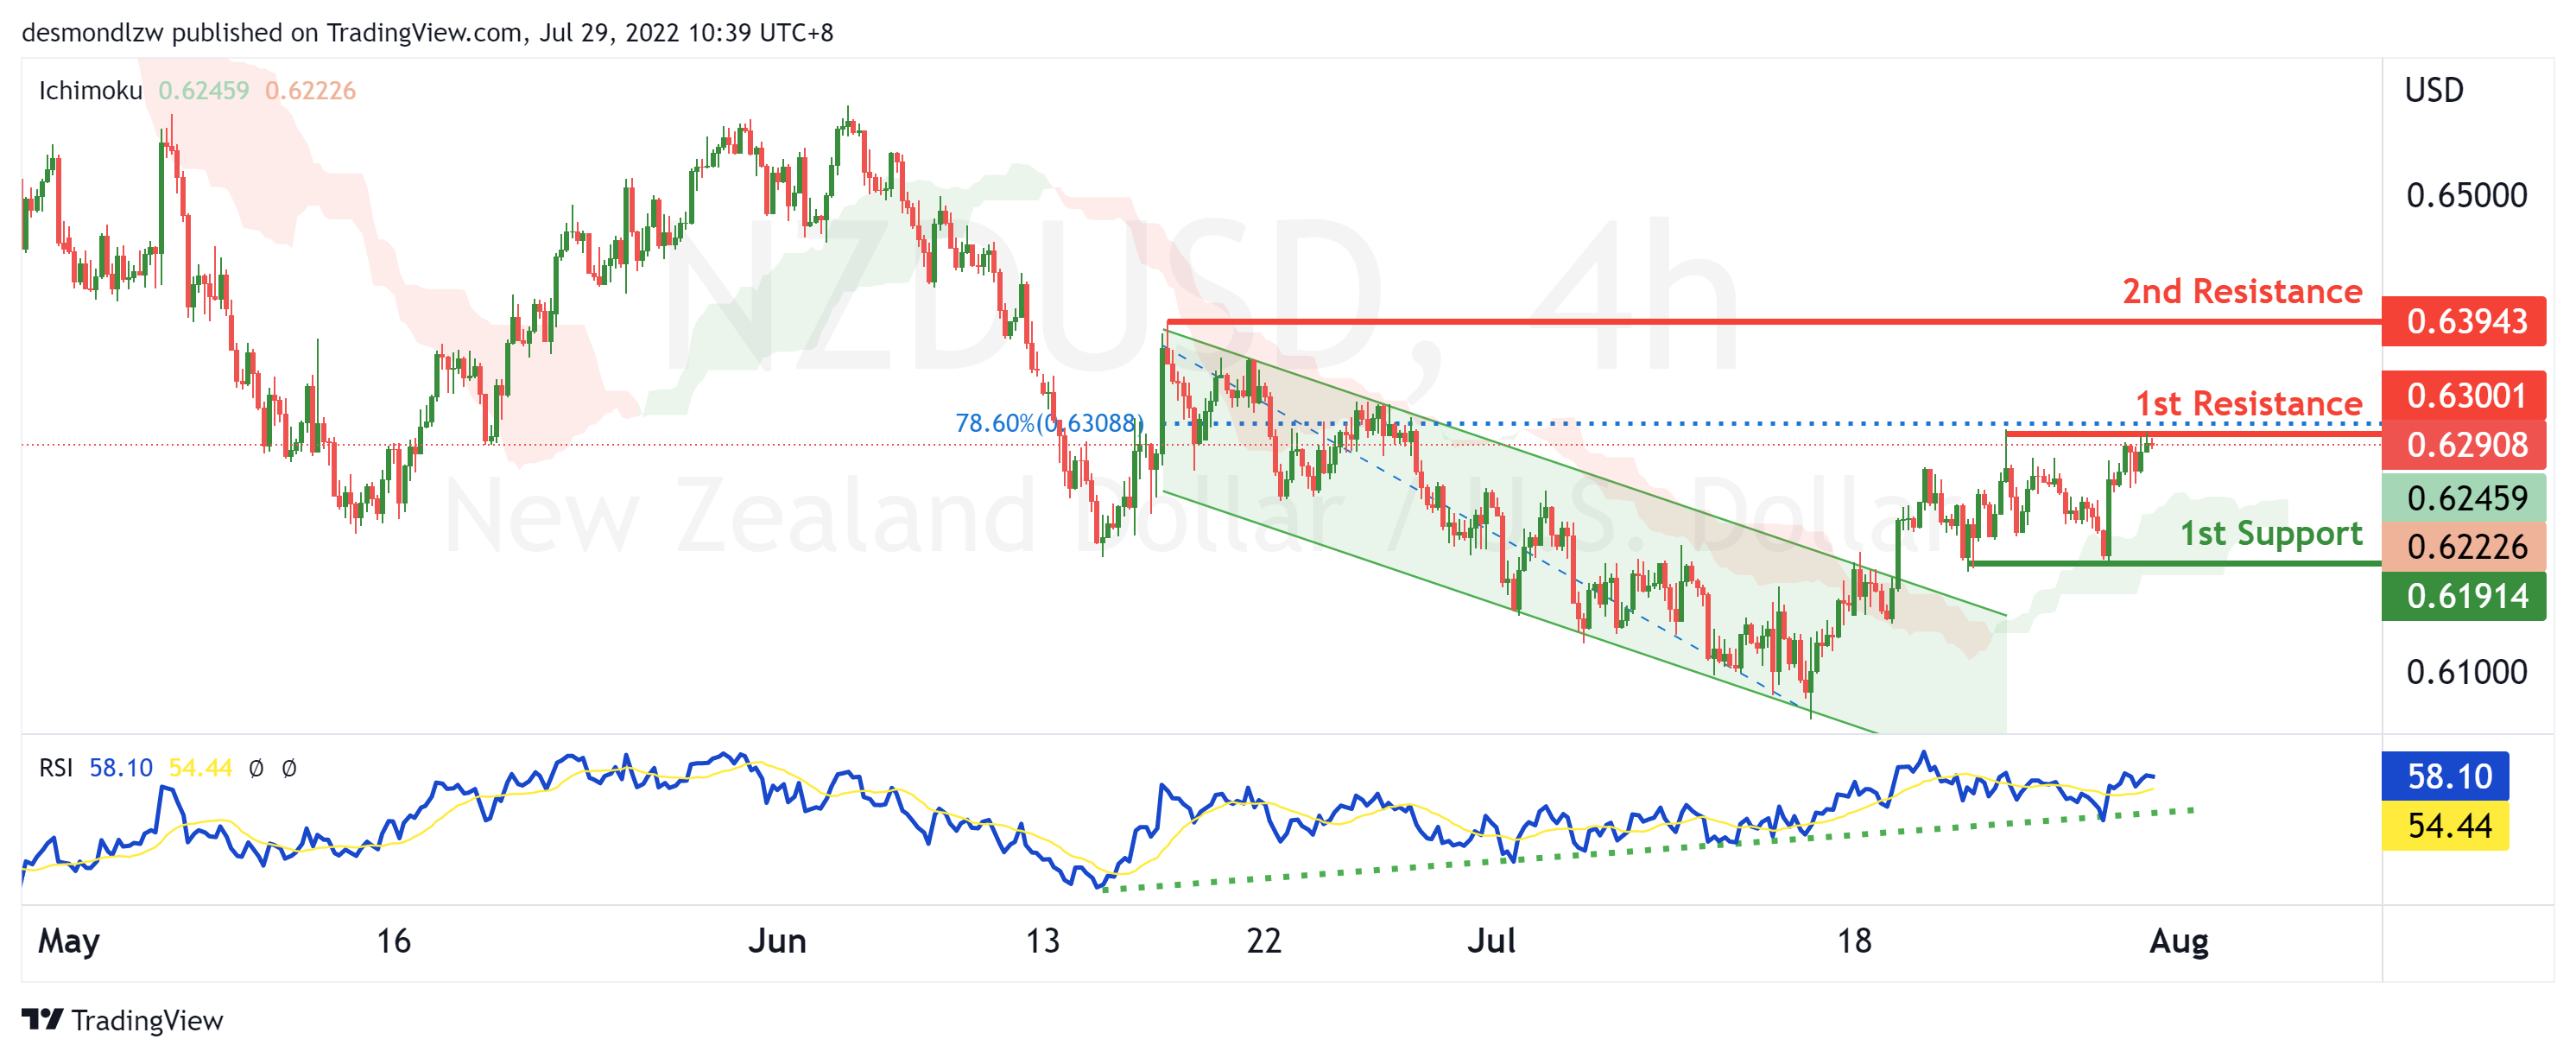
On the H4, with price breaking the descending trend channel, RSI showing an ascending trendline and moving above the ichimoku cloud, we have a bullish bias that price will rise from the 1st resistance at 0.63001 at the pullback swing high in line with the 78.6% fibonacci retracement to the 2nd resistance at 0.63943 at the swing high. Alternatively, price may reverse off the 1st resistance and drop to the 2nd support at 0.61354 at the multiple swing lows.
Areas of consideration:
- H4 time frame, 1st support at 0.62073
- H4 time frame, 1st resistance at 0.63001
USD/CAD:
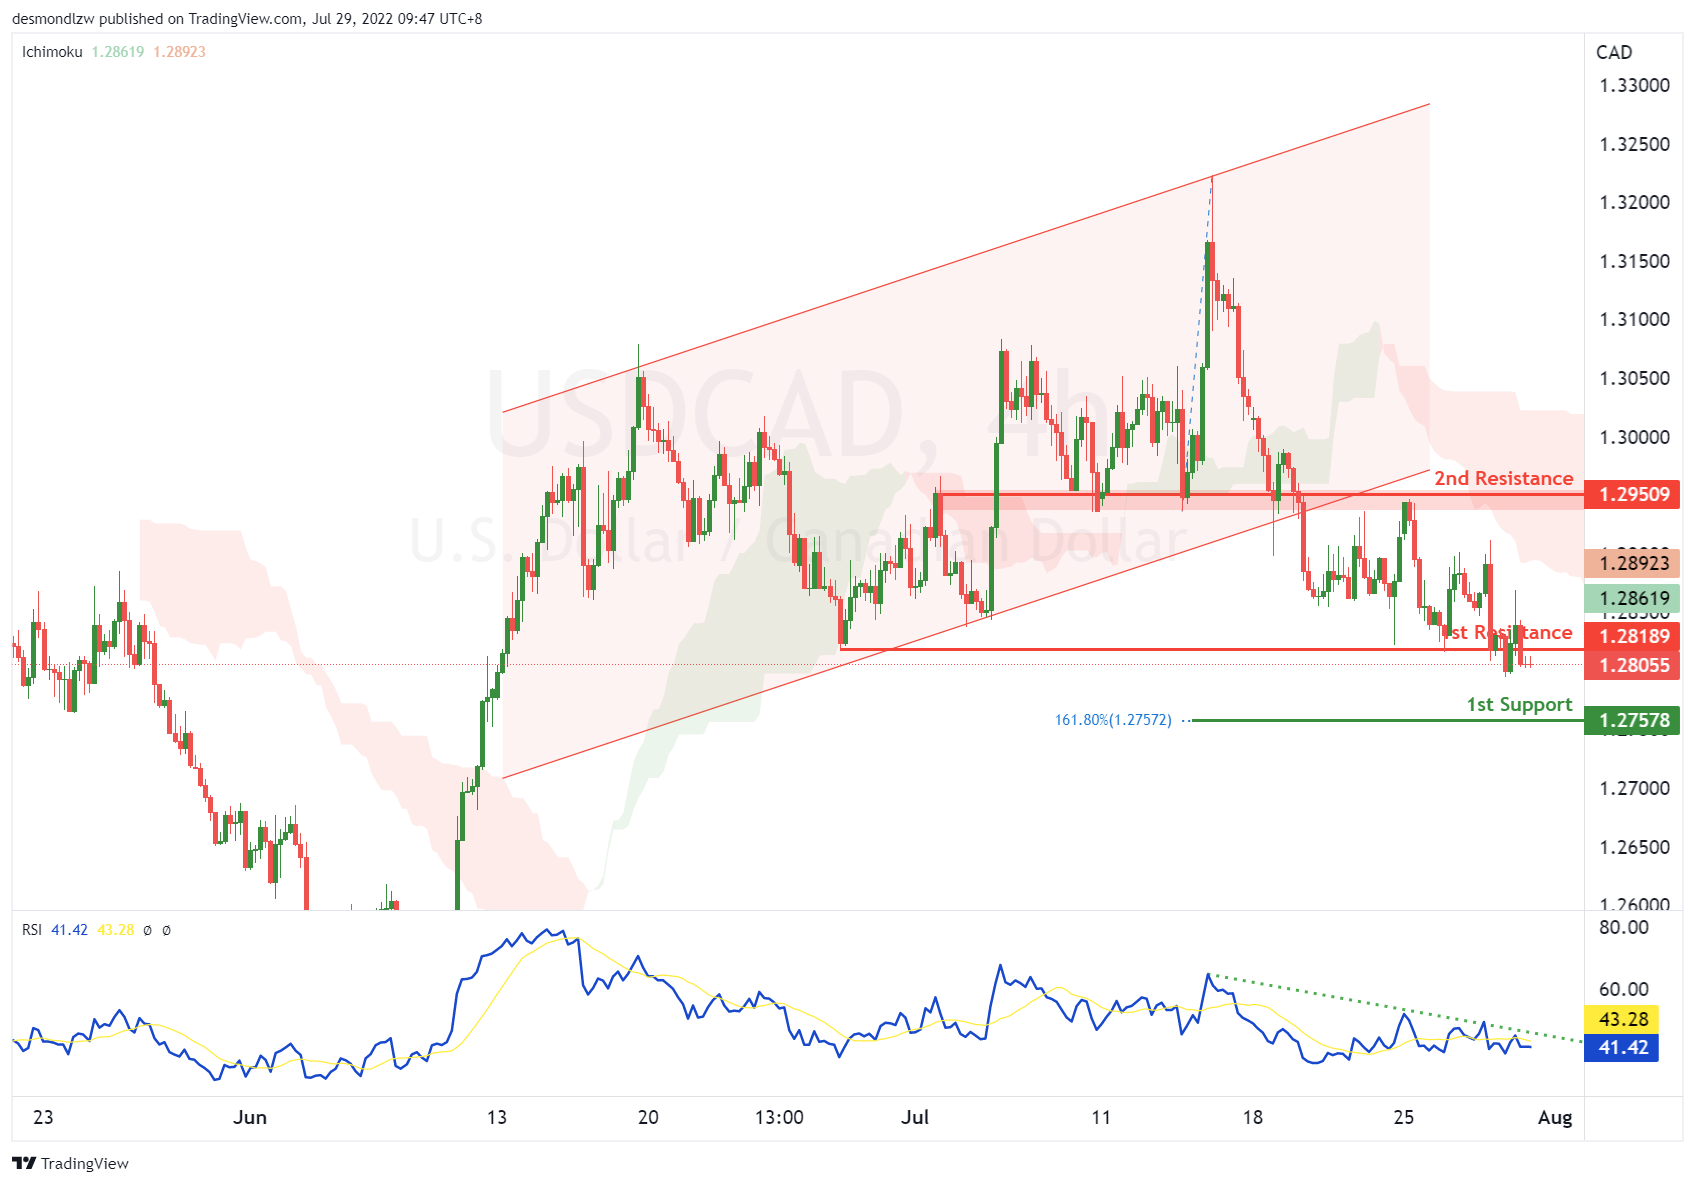
On the H4, with the price breaking the ascending channel, we have a bearish bias that the price may drop from our 1st support at 1.28145, which is in line with swing lows to our 2nd support at 1.27578, which is in line with the 161.8% fibonacci extension. Alternatively, the price may rise to the 1st resistance at 1.29509, which is in line with the overlap resistance.
Areas of consideration:
- H4 time frame, 1st support at 1.28145
- H4 time frame, 2nd support at 1.27578
OIL:
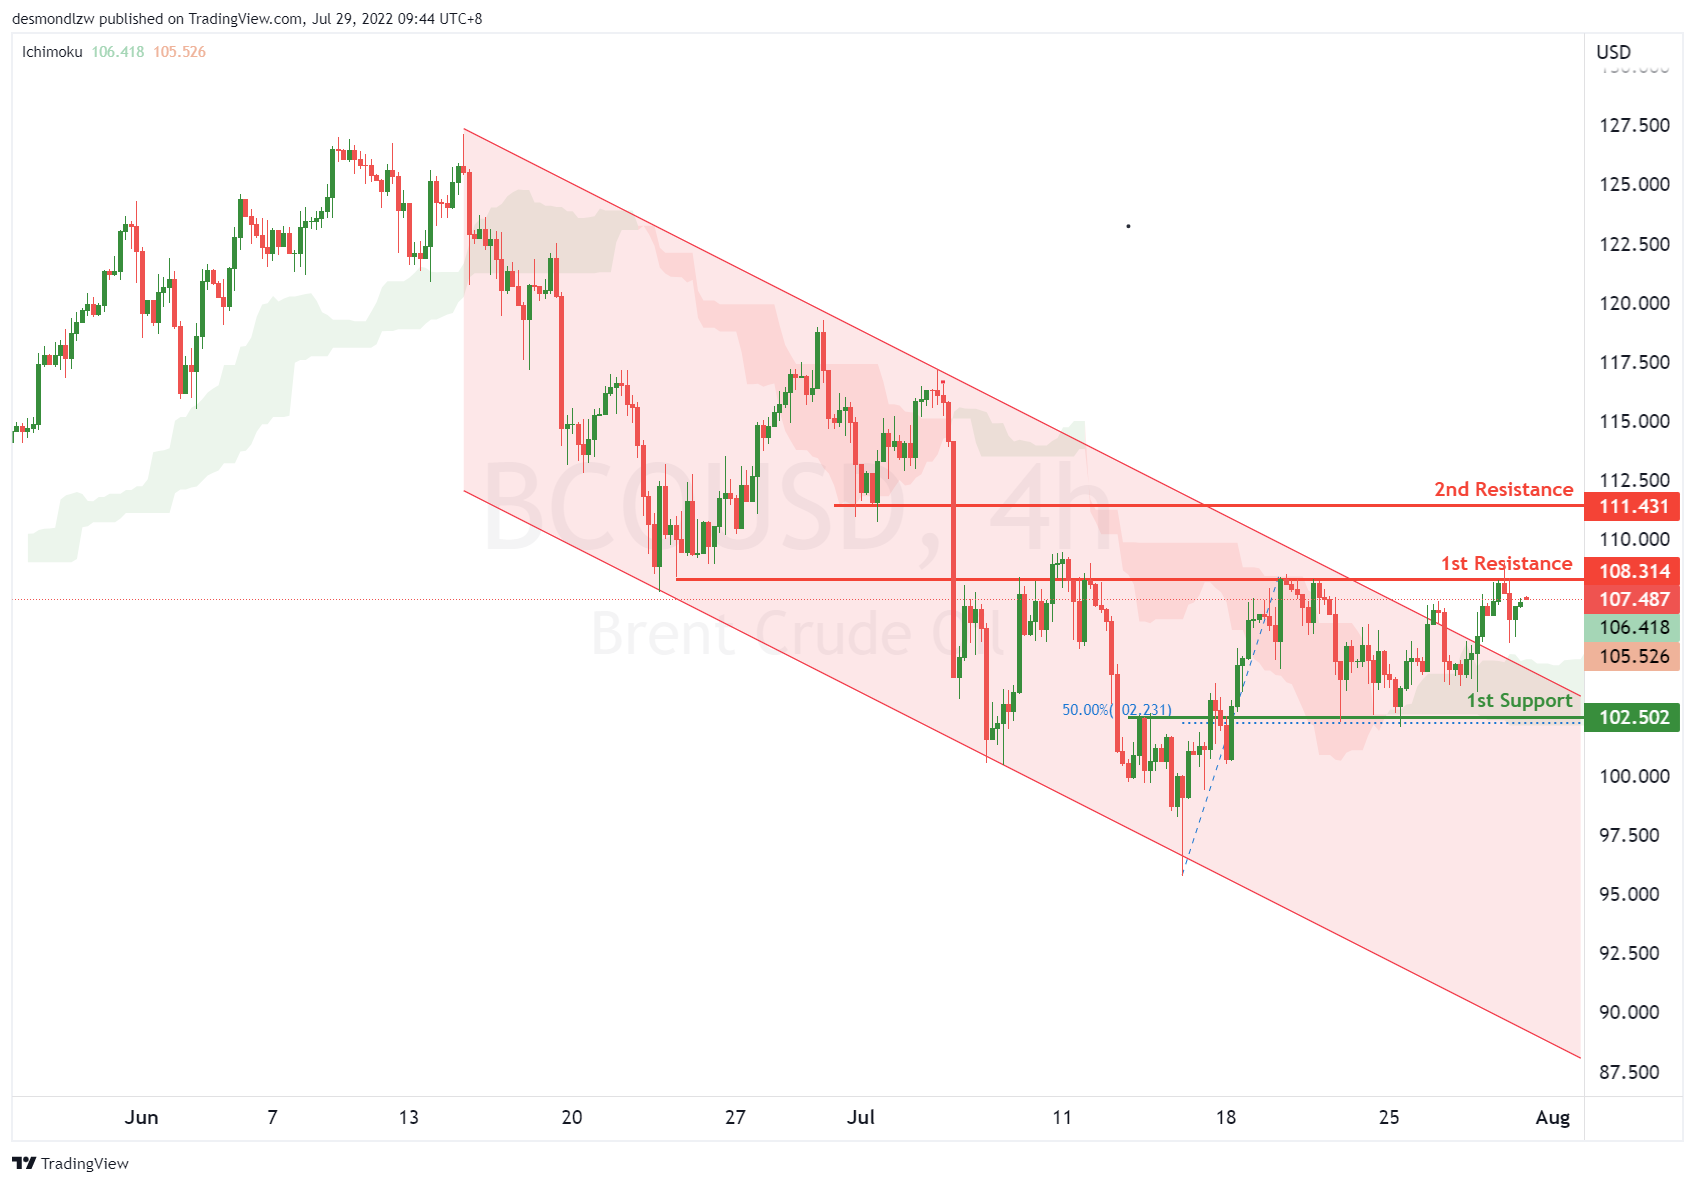
On the H4, with price breaking the bearish channel and moving above ichimoku indicator, we have a bearish bias that price might rise from our 1st resistance at 108.527, which is in line with the overlap resistance to our 2nd resistance at 112.133, which is in line with -27.2% fibonacci expansion. Alternatively, the price may drop to 1st support at 102.353, which is in line with pullback resistance and 50% fibonacci retracement.
Areas of consideration:
- H4 time frame, 1st resistance of 108.527
- H4 time frame, 2nd resistance of 112.133
Dow Jones Industrial Average:
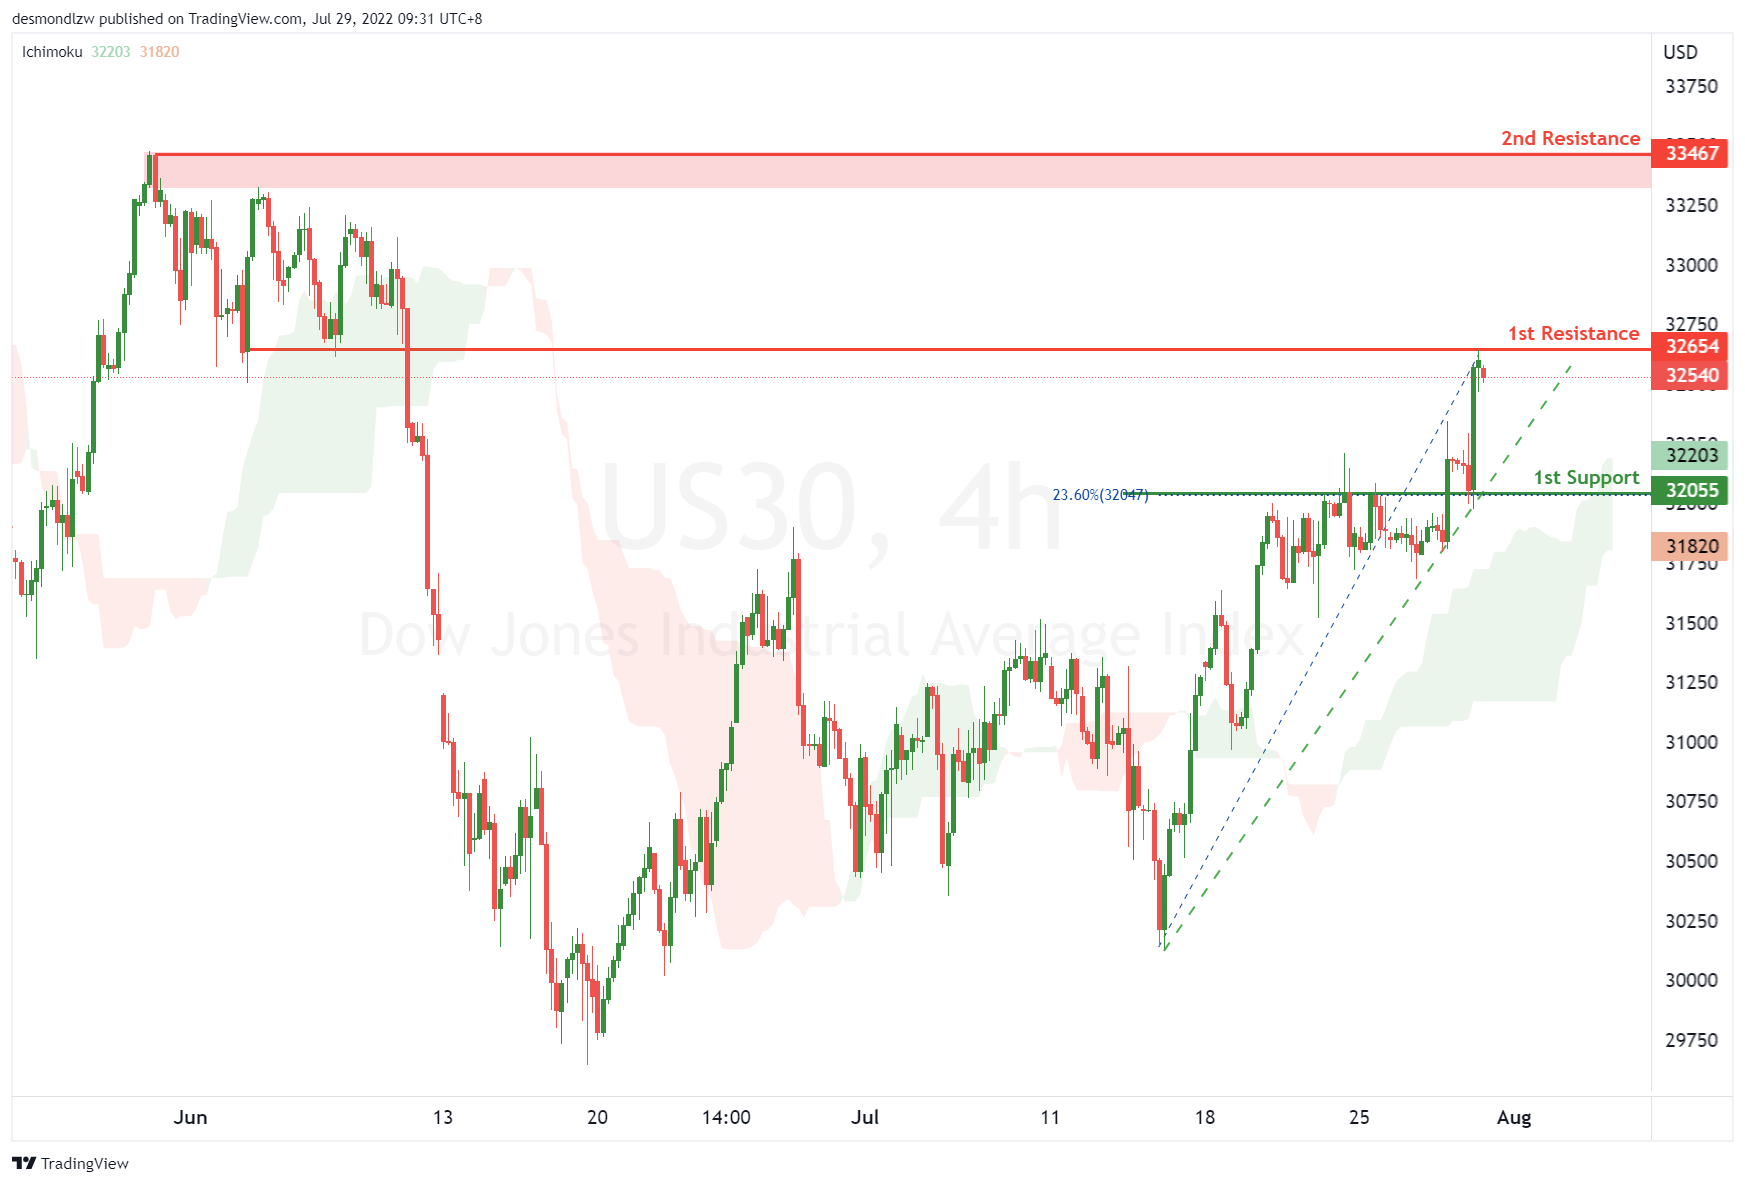
On the H4, with price moving with a bearish channel and having a bullish break, we have a bullish bias that price might rise from our 1st resistance at 32226, which is in line with the swing highs to our 2nd resistance at 32767, which is in line with overlap resistance. Alternatively, price may reverse off the 1st resistance and drop to the 1st support at 31525, which is in line with the overlap support and 38.2% fibonacci retracement, if the price keeps going down, it may drop to our 2nd support at 30978, which is in line with 61.8% fibonacci retracement. Take note the price is fluctuating currently and testing the support of 31682.
Areas of consideration:
- H4 time frame, 1st resistance of 32226
- H4 time frame, 2nd resistance at 32767
Cliff Notes: FOMC Pivot Their Guidance as the US Economy Stagnates
Key insights from the week that was.
The past week has been notable for a global resurgence in risk appetite despite a run of data pointing to deteriorating US economic growth. Principally this is because the softer tone of US data and the FOMC’s recognition of it implies a receding risk of rate hikes in excess of those already priced.
Having delivered a second-consecutive 75bp fed funds rate hike to a mid-point of 2.375%, Chair Powell showed a greater degree of comfort over the outlook for inflation in the July press conference. In part this stems from 2.375% being within the 2-3% interest rate range the FOMC believe to be neutral for their economy. However, the greater comfort vis a vis inflation is also a consequence of building apprehension over the outlook for growth. Notably, the press conference also made clear that the FOMC wish to undertake “just the right amount of tightening” to bring about below-trend growth, “not make a mistake” by creating the pre-conditions for recession – as defined by the NBER.
After the July FOMC meeting, Q2 was confirmed as a second consecutive quarter of contraction for GDP, giving further weight to the nascent concerns of Chair Powell and the Committee. Importantly, whereas the weakness in Q1 was principally due to net exports and inventories, in Q2 a marked deterioration in domestic final demand was seen – annualised growth falling from +2.1% in Q1 to -0.1% in Q2. Pricing for the FOMC fell further as a result to now be broadly in line with our own view – a 50bp hike in September followed by only two 25bp hikes come November and December.
Arguably risks to this view are also transitioning from being biased up to skewed down. The most likely catalyst to cement such a change is the weakness recently seen in household survey employment – flat over the three months to June – becoming apparent in nonfarm payrolls and hourly earnings. Along with persistent weakness in domestic demand, a material weakening in these labour market variables would begin to fit the definition of an NBER recession and warrant greater caution be taken with policy. August 5 and September 2, the next two release dates for the US employment report, therefore loom as critical dates in the run to the September FOMC meeting.
Regardless of how the US rate hike cycle concludes in 2022, come 2023 we believe the policy debate will shift to the timing and scale of rate cuts as US economic growth languishes below trend and inflation pressures recede. We are more cautious on the timing of policy easing than the market, holding that it won’t begin until late-2023; however, we expect the easing to be material in scale, in the order of 125bps by end-2024.
Australian equities and our dollar have benefitted from this week’s recalibration of US economic risks. This is despite domestic data releases which pointed to a modest softening in consumer demand in May/June and a sharp decline in real household disposable income through Q2.
Australia’s retail sales posted a soft gain of 0.2% in June, rounding out a 3.2% lift for Q2 after a similarly strong 2.9% increase in Q1. The COVID-19 reopening and normalisation of spending patterns is a key factor here, although strong price inflation over this year has also supported nominal sales. Solid momentum should sustain in the near-term, but come late-2022 and into 2023, the RBA’s aggressive tightening cycle is expected to see an abrupt slowing in household spending. For full detail on the Australian consumer, see the latest edition of Westpac’s Red Book.
The Q2 CPI report also made clear that household incomes have been, and will continue to be, hit by historic inflation, headline and trimmed mean inflation coming in as expected at 1.8% and 1.5%. At 6.1%yr and 4.9%yr, annual inflation to June is a multiple of aggregate wage growth across the economy, the latest estimate for the wage price index being 2.4%yr at March. The largest contributor to the headline CPI result was housing costs (0.6ppts), driven higher by a lack of supply of inputs and labour and, at the margin, the unwinding of the benefit provided to households by the Government’s HomeBuilder grants in recent years.
Supply also impacted the cost of transport, household contents, apparel and food in the quarter and over the year; although for fresh food, the primary catalyst was east coast flooding rather than global supply chain and geopolitical concerns. Ahead, we continue to expect the pressure on households from inflation to persist, with annual headline inflation forecast to trend higher through H2 2022 to a peak around 7%yr in December and thereafter to take all of 2023 to come back near the top of the RBA’s target range.
Chief Economist Bill Evans discussed the implications of Australian inflation for the RBA outlook and the economy following the Q2 CPI release. In short, inflation’s Q2 result and outlook support our view that the RBA will need to raise the cash rate to 3.35% by February, with 100bps of the 200bps of cumulative hikes to come in August and September. To the extent that this level of the cash rate is materially above our estimate of neutral, the cost to the economy of bringing inflation back to target will be material, with GDP growth to slow in 2023 to just 1.0%yr and the unemployment rate rising to around 5.0% late-2024, approximately 2ppts above the low we forecast for late-2022.
Oil Outlook: Bulls to Disrupt Current Stabilisation?
Oil prices had been dropping from the 14th of June yet since the 18th of July seem to show some stabilisation. Yet let’s have a look where fundamentals are currently leading oil prices. We make a start with the weekly US oil market data. On Friday the 22nd of July the Baker Hughes oil rig count for the US showed that the active number of oil rigs remained unchanged, while on Tuesday and Wednesday respectively, both the API and EIA showed considerable drawdowns of US oil inventories for the past week. The releases tended to underscore that demand levels surpassed production, thus implying a rather tight oil market in the US which could have partially at least provided some support for oil prices.
Please note that on Wednesday we had the release of the Fed’s interest rate decision, which hiked rates by 75 basis points as was widely expected, yet Fed Chairman Powell’s press conference later on created hopes for a possible slow down for the Fed’s rate hiking path, which tended to weaken the USD. It should be noted that a weaker greenback, could make oil more attractive for the rest of the world given that the commodity is largely denominated in USDs, thus possibly increasing demand and pushing oil prices higher. Yet the overall earnings season seem to have created some optimism among market participants until now which would also support expectations for a not so gloomy global economic outlook, once again supporting the notion of increased demand for oil and allowing oil’s prices to climb higher. It will be interesting to see whether economic activity in China’s manufacturing sector has expanded at a faster pace in July, with China’s manufacturing PMI figures due out on Sunday and Monday, which would also imply increased demand for oil.
It should be noted that the US seems to be currently the top oil exporter currently, hence we would like to see the production side for the commodity from this angle. US oil producers despite the willingness to increase production and capitalize on the current high prices of the commodity, seem to find obstacles in their way. The increase of oil production despite being encouraged by the US government seems to be hindered by a lack of availability of fracking equipment. Reuters reported that demand for fracking equipment is quickly outpacing supply and thus a bottleneck is being created limiting the supply of oil. Key fracking equipment suppliers, Haliburton and Liberty Oilfield Services, warned that the market is near full utilization and new frac fleet deployment may be very difficult in the current year. Should the production side suffer from a lack of oil fracking equipment we may see the expansion of oil production slowing down, thus creating further upward pressure for oil’s price.
On the international scene we would like to note two issues, both related to Russia. The first issue we note that G7 officials are nearing a possible deal to set a price capping mechanism for Russia’s oil exports, with the timeline to be by December 5th. The price is to be made public and if actually so, we may see India and China, two of the largest global oil consumers pressing hard for a lower price regarding their imports from Russia. Yet such a low price may force Russian producers to limit production, thus pushing oil prices higher. The second issue is related to the natural gas supply cuts from Russia to Europe, which has reduced supply of Russian natural gas to the area of 20% and could increase the attractiveness for oil as an alternative thus pushing oil’s price higher. It remains to be seen to what extent all these factors will be able cause a sustainable rise of oil prices.
Technical Analysis
WTI H4

WTI’s price seems to be stabilizing for now and its price action seems to remain confined between the 98.20 (R1) and the 92.60 (S1) levels. We tend to maintain our bias for a sideways motion currently and as long as the price action remains between the prementioned levels. Also note that the RSI indicator below our 4-hour chart seems to be revolving around the reading of 50, which may also imply a rather indecisive market for now. On the other hand, slight bullish tendencies seem to be present, yet for us to switch our sideways bias in favour of a bullish outlook we would require a clear breaking of the 98.20 (R1) resistance line and for the commodity’s price action to actively start aiming or even reaching the 103.00 (R2) resistance level. On the flip side, for a bearish outlook for the commodity’s price we would require a clear breaking of the 92. 60 (S1) support line that would also signal a trend reversal and for the pair to approach the 87.20 (S2) support level.
Eco Data 7/29/22
[php_everywhere instance="1"]
Euro Gets Crushed ahead of Inflation and GDP Numbers
It has been a brutal month for the euro. Business surveys already point to a recession and traders are worried Russia might cut off the gas and paralyze the economy completely. The upcoming batch of inflation and GDP data on Friday are unlikely to change this narrative. Instead, a turnaround in the euro will require either more energy supply to come online or US inflation to cool down and clip the dollar’s wings.
Energy troubles
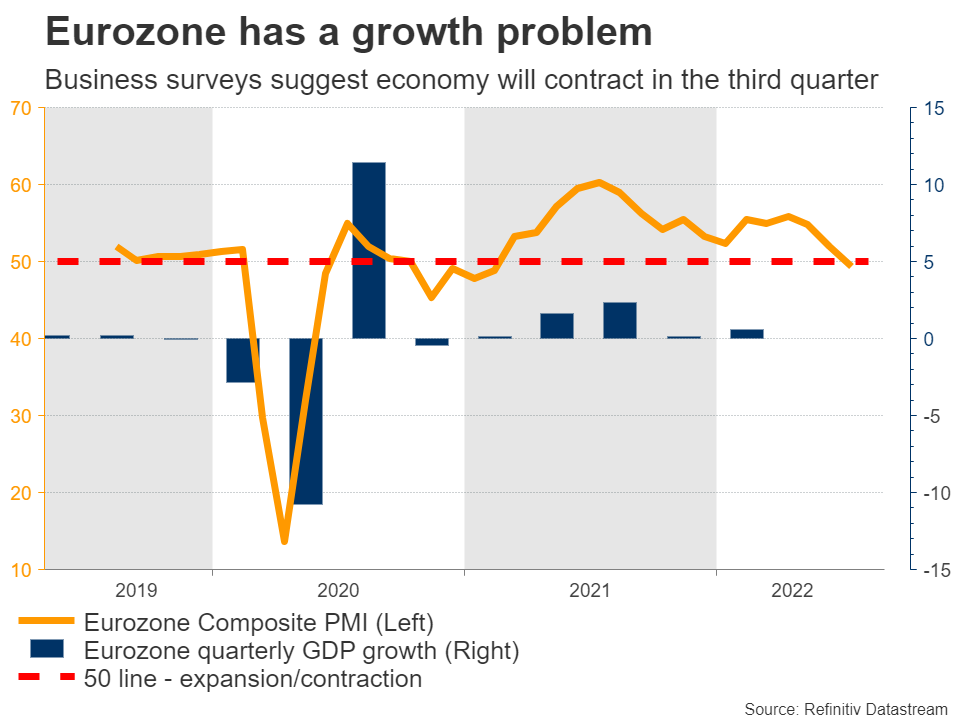
The euro’s nightmare keeps getting worse. An energy crisis has put the squeeze on consumers, who are struggling to cope with ever-rising bills and fuel costs. In fact, the Eurozone economy is already in contraction according to the latest business surveys and forward-looking indicators suggest the situation will get worse in the coming months.
Russia has essentially weaponized its gas supply - the mere threat of cutting it off has been enough to send European gas prices soaring as several countries scramble to stockpile as much as they can.
Even a forceful rate increase from the European Central Bank last week was not enough to turn the tide in the devastated euro. Traders have started to sense that Europe will be at the epicenter of any global recession, and higher borrowing costs will only add to those risks. The more aggressively the ECB tightens, the deeper the recession might be.
On top of everything, political risk is back on the table with Italy headed for early elections in September. It seems like far-right forces will be victorious, raising concerns of a sovereign debt crisis in the Eurozone's third largest-economy.
Inflation and growth
On Friday, we’ll get the latest readings on inflation and GDP growth. Inflation as measured by the CPI is expected to have held steady at 8.6% in yearly terms in July, while the core rate that strips out food and energy items is projected to have risen to 4.7% from 4.6% in the previous month.
Hence, most of the inflation Europe has encountered so far has been concentrated in energy and food. That is horrible news for consumers that have to pay the higher prices, but good news for the ECB, as it implies that inflation is not very sticky.
Meanwhile, GDP growth is expected to have slowed substantially, with the economy growing just 0.2% last quarter, from 0.6% previously. Admittedly though, this is old news. With business surveys pointing to a contraction in July, everybody knows growth was going downhill in Q2.
Euro outlook is grim
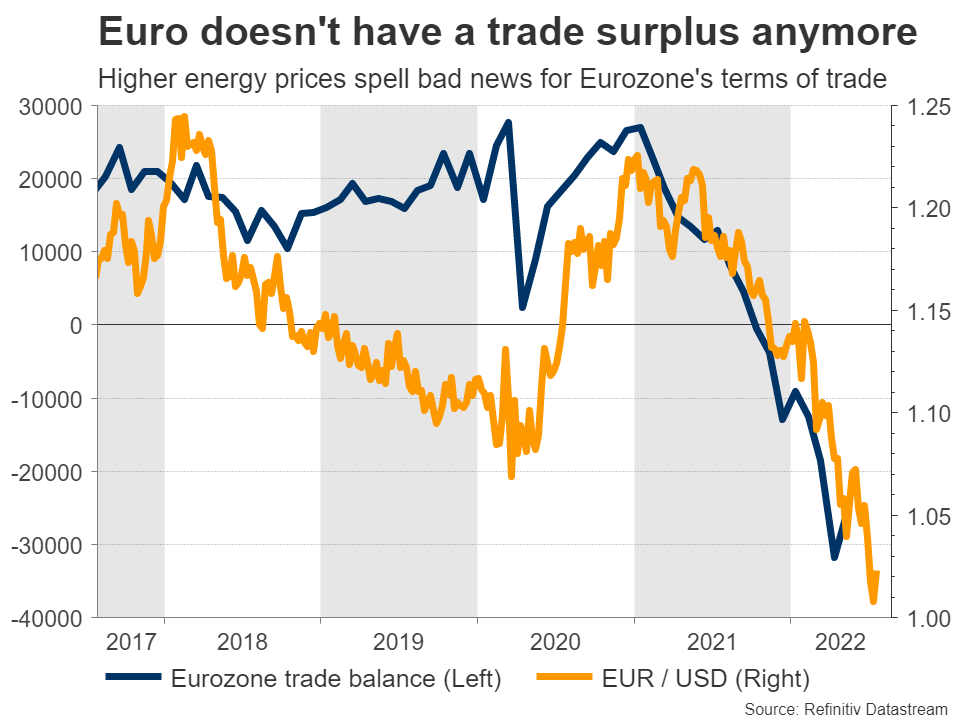
All told, the outlook for the euro remains gloomy. Even if the upcoming data is better than expected, it doesn’t change much. The ECB cannot raise rates much faster without breaking the economy, which is already losing power. And the euro has lost its biggest historical advantage - a massive trade surplus.
In these conditions, there isn’t much that can turn the situation around. The only factor that can really revive the euro would be a severe selloff in energy prices. However, this will only do the trick if prices are dropping because more supply is online, not because demand is collapsing in a recession.
In other words, we need some good news from Ukraine before the euro can stage a turnaround. Alternatively, a slowdown in US inflation that takes the wind out of the dollar might also enable a relief rally.
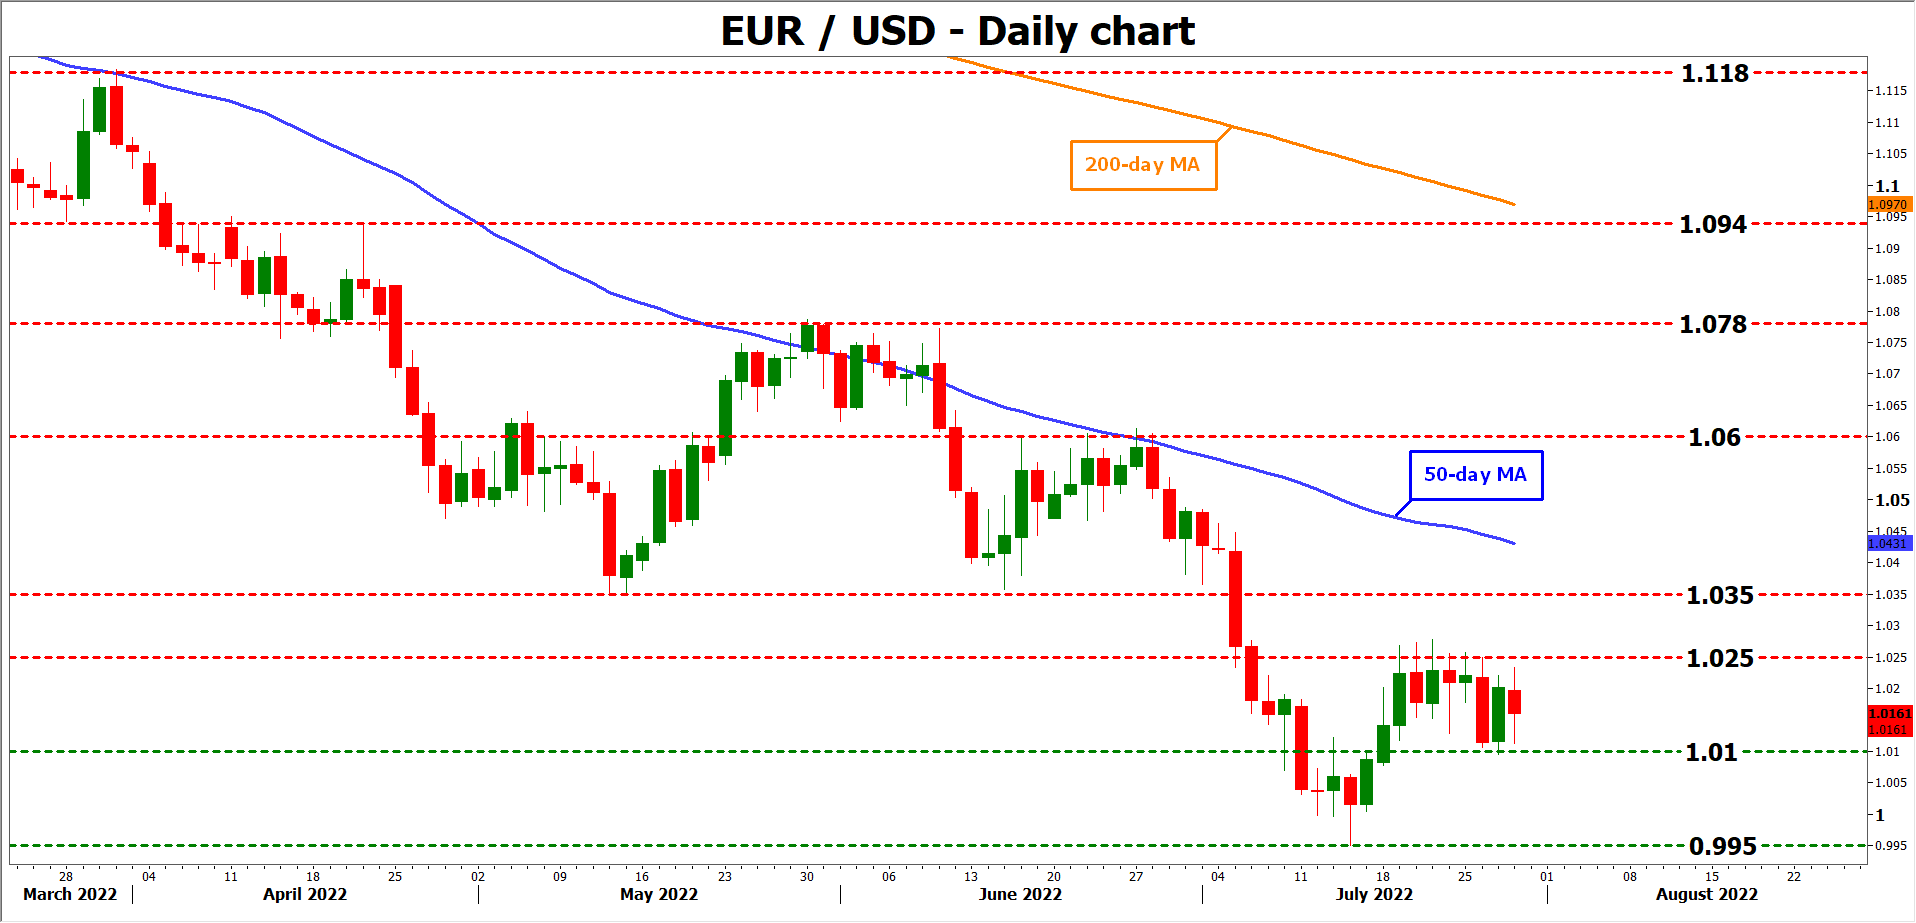
From a technical perspective though, even a relief rally towards 1.0600 in euro/dollar would not be enough to break the pair out of its downtrend - so much damage has been inflicted on the chart.
On the downside, a decisive break below the recent low of 0.9950 would signal a resumption of the trend.
Sunset Market Commentary
Markets
It was the bad-news-show today. First up: German inflation. The pre-market regional print in North Rein-Westphalia already suggested a nasty surprise and so it happened. The national number eased less than expected, from 7.6% to 7.6% in July. The harmonized figure even unexpectedly accelerated from 8.2% to 8.5%, suggesting upwards risks for the European reading tomorrow. Next: economic confidence (EC) in the euro zone. Confidence evaporated more than expected (from 103.5 to 99) to hit the lowest level since February last year. And finally: US GDP. Growth contracted -0.9% q/q annualized following the -1.6% in Q1, pushing the US in a technical recession. Private consumption decelerated, adding 0.7% to growth while net exports delivered 1.43% points thanks to a significant slowdown in imports but surging exports. Investments particularly weighed on growth (-2.73 ppts) due to depleting inventories while government consumption (-0.33 ppts) accounted for the remainder of the negative GDP reading. All this was surrounded in a post-Fed atmosphere, with markets selectively taking note of Powell’s announcement that the tightening cycle may slow down from the 75 bps hiking pace from September onwards. Especially after the GDP release, markets saw their soft interpretation validated. Core bond yields surge with Bunds, despite the inflation surprise, even outperforming Treasuries. Changes range from -18.5 bps (2y) over 10.9 bps (10y) to 5.4 bps (30y). Peripheral spreads narrow 2 to 3 bps. Greece (+3 bps) underperforms. US yields shed 15-16.3 bps in the 2y/5y segment. Money markets price in a total of 90 bps additional tightening this year and lower the expected terminal rate to just 3.2%. The 10y yield (2.67%, -11 bps) drops below the sideways trading range with the lower bound at 2.72%. Tumbling yields provide some support for equities. European stocks extended a bottoming out to trade 0.6% in the green (EuroStoxx50). US futures did the same but turned red after all shortly after the cash open.
There’s only one real beneficiary in current circumstances on FX markets. The Japanese yen shines, gaining against all G10 peers. USD/JPY drops to the lowest since early July around 134.8. EUR/JPY retraces to 136.93, testing support at the lows earlier in July. EUR/USD is a balance of weakness today which up until the GDP numbers was tilted towards the dollar. The pair hit a low at 1.011 before recovering a tad to 1.015 currently. The Swiss franc is on track for a new closing record high after the SNB reiterated that it can take monetary policy measures at any time if needed. EUR/CHF crumbles to 0.973. News Headlines
According to the flash estimate published by the National Bank of Belgium, Belgian GDP growth in Q2 slowed to 0.2 % Q/Q and 3.3% Y/Y. Growth in Q1 printed at 0.5 % Q/Q and 4.9% Y/Y. According to NBB the slowdown is widespread across the major branches of activity. Value added was down by 0.2 % in industry while in construction and the services sector, growth of activity remained positive, although slowed to 0.3 %. In a separate publication, STATBEL reported that Belgian inflation slowed marginally to 0.83% M/M and 9.62% Y/Y, compared to 0.85% and 9.65% Y/Y in June. Core inflation which doesn’t take into account energy products and unprocessed food, rose further to 5.49% Y/Y from 5.07%. Food price inflation rose sharply further to 9.24% from 8.44% Y/Y. Main price increases in July concerned airplane tickets, hotel rooms, fire insurance, meat, electricity, dairy products, domestic heating oil, the purchases of vehicles and road tax. Motor fuels, city trips, alcoholic beverages and private rents had a decreasing effect on the index.
In its new inflation report, the central bank of Turkey again upwardly revised its forecast for inflation at the end of this year to at 60.4% (from 42%). Headline inflation was 78.62% in June. The CBTR expects inflation to ease to 19.2% end next year and 8.8% at the end of 2024. The CBRT still holds a policy rate of only 14.0%. At EUR/TRY 18.27 and USD/TRY 17.93 the lira again trades within reach of the historic low levels against both major currencies.
US Economic Growth Records Second Consecutive Quarter of Contraction
Real GDP contracted by 0.9% quarter-over-quarter (annualized) in the second quarter of 2022. The reading came in below the consensus forecast, which called for a modest gain of 0.4% q/q.
Consumer spending grew by 1% – a deceleration from the 1.8% recorded in Q1. Spending on services (4.1%) accounted for all the gains, while durable (-2.6%) and non-durable (-5.5%) expenditures both declined. As a result, goods spending fell by 4.4%, and has now recorded declines in two consecutive quarters.
Non-residential business investment (-0.1%) was essentially flat on the quarter, as continued gains in intellectual property products (9.2%) were offset by declines in equipment (-2.7%) and structures (-11.7%) spending. Structures investment has now contracted for five consecutive quarters, and is down over 7% since the Q1-2021.
Residential investment (-14.0%) fell sharply in Q2, as home construction slowed and sales of new and existing homes fell by over 12% on the quarter.
Government spending (-1.9%) declined for the third consecutive quarter, on lower spending at both the federal (-3.2%) and state & local (1.2%) level. In terms of federal spending, gains in defense (2.5%) outlays were more than offset by a sharp decline in non-defense (-10.5%) spending.
Exports surged by 18% in the second quarter, with gains spread across both the exports of goods (15.6%) and services (24.2%). Imports recorded a more modest gain of 3.1% – a marked deceleration from the near 20% growth seen in each of the prior two quarters. This led to some narrowing in the trade deficit, resulting in net trade adding 1.4 percentage points (pp) to Q2 growth.
Inventory investment sharply declined in the second quarter – subtracting 2 pp from headline growth.
The core PCE deflator rose 4.4% on a q/q (annualized) basis – a noticeable deceleration from the 5.2% recorded in Q1.
Key Implications
With the advance estimate of second quarter GDP coming in negative, US economic growth has now recorded two consecutive quarters of contraction – meeting one definition of a "technical" recession. However, most economists would agree that the US economy isn't (yet) in recession. Outside of just economic growth, the National Bureau of Economic Research (NBER) looks at a whole host of other economic indicators including employment, industrial production, and real personal disposable income (less transfers) to name a few. All of these continue to point to an economy still in expansionary territory.
That being said, domestic demand has shown a clear sign of decelerating. Consumer spending continued to soften in the second quarter, while both business and residential investment outright declined. And it doesn't appear that growth prospects will be improving anytime soon. Measures of both consumer and business sentiment have turned decisively lower in recent months, ISM readings have softened, while weaker pending home sales point to further declines in home purchases in the months ahead.
In its interest rate announcement yesterday, the FOMC acknowledged the recent softening in economic data, but reiterated that more interest rate hikes will likely be required to cool inflation. With the policy rate now in the vicinity of neutral – the interest rate where monetary policy is neither accommodative nor restrictive – its entirely feasible that the we see another 100 basis points of tightening by year-end.
EUR/USD Mid-Day Outlook
Daily Pivots: (S1) 1.0124; (P) 1.0173; (R1) 1.0248; More...
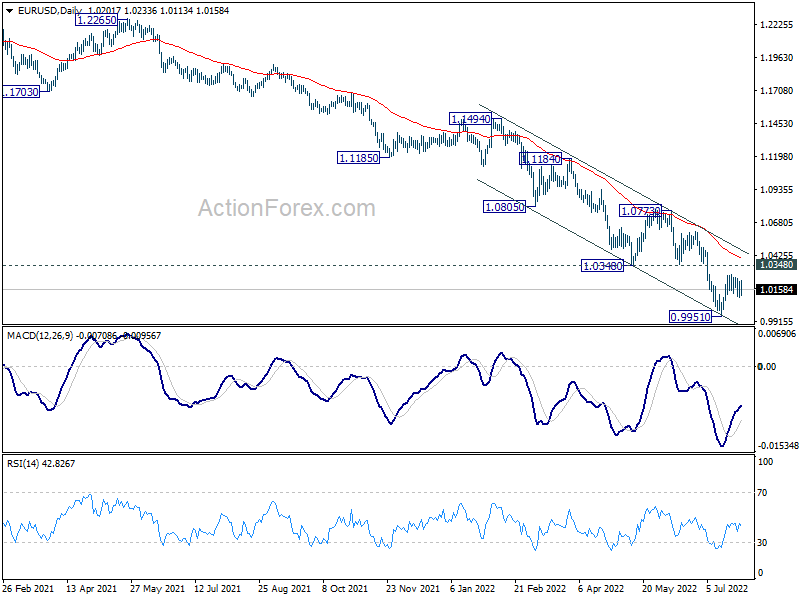
Range trading continues in EUR/USD and intraday bias remains neutral. On the upside, above 1.0277 minor resistance will target 1.0348 resistance first. Break there will target channel resistance at 1.0469. on the downside, break of 1.0095 minor support will bring retest of 0.9951 low instead.
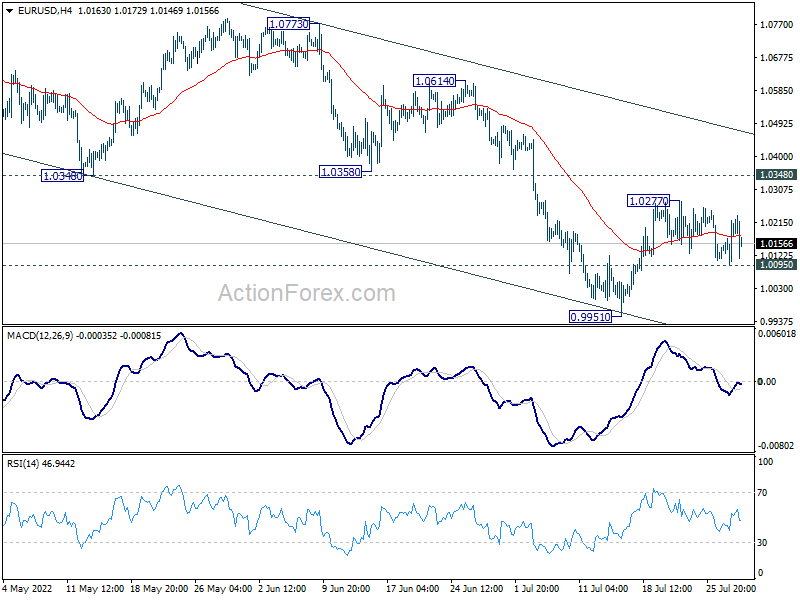
In the bigger picture, down trend from 1.6039 (2008 high) is still in progress. Next target is 100% projection of 1.3993 to 1.0339 from 1.2348 at 0.8694. In any case, outlook will stay bearish as long as 1.0773 resistance holds, in case of strong rebound.