Sample Category Title
GBPCHF Wave Analysis
- GBPCHF broke daily down channel
- Likely to rise to resistance level 1.1770
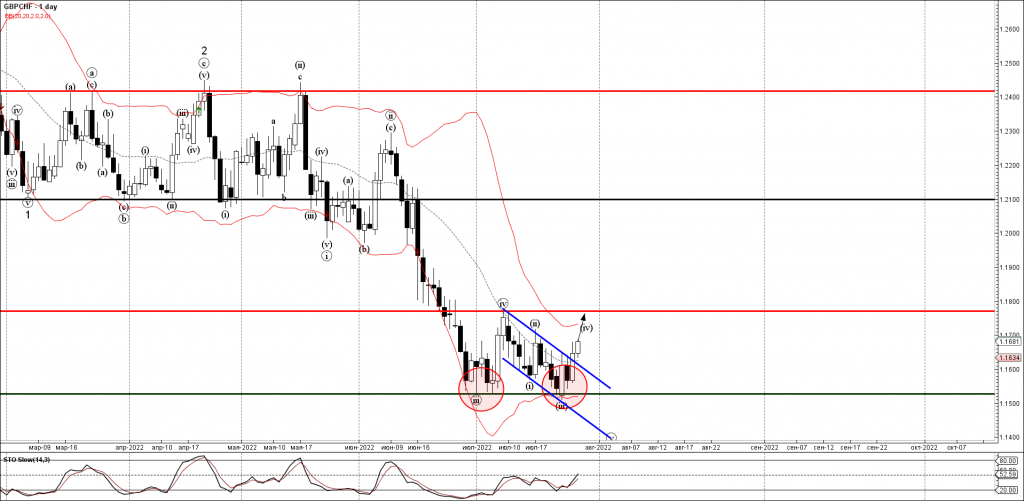
GBPCHF continues to rise after the earlier breakout of the resistance trendline of the daily down channel from the start of July – which accelerated the active correction (iv).
The breakout of the down channel follows the earlier upward reversal from the key support level 1.1530 (which has been reversing the pair from the start of July).
GBPCHF can be expected to rise further toward the next resistance level 1.1770 (top of the previous minor correction (iv)).
EUR/USD: Bearish Tone to Prevail Below Pivotal 1.0270 Fibo Barrier
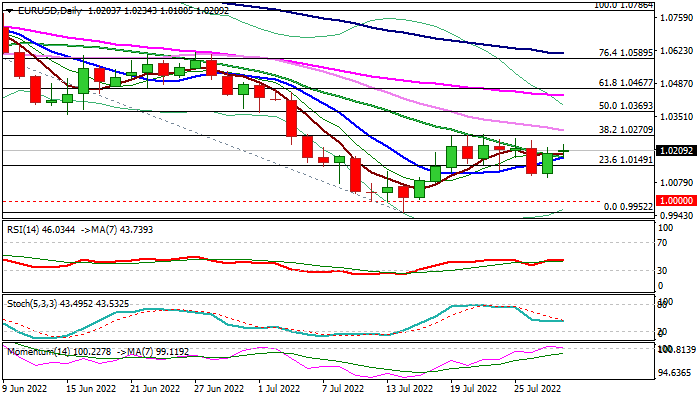
The Euro reduced speed on Thursday after post-Fed 0.83% jump and still holding below pivotal Fibo barrier at 1.0270 (38.2% of 1.0786/0.9952 descend) where bulls were trapped last week.
Support from unclear signals about the size of Fed’s rate hikes in coming policy meetings that disappointed many and deflated dollar, is likely to be short-lived.
The Euro remains very vulnerable to weak economic data from the EU and growing concerns about gas supply shortage that may limit the recovery.
Unless the action makes a clear break above 1.0270 pivot that would improve near-term structure and spark further advance, the downside is likely to remain at risk, with loss of 1.0100 zone trough (July 26/27 lows) to open way for fresh attack at parity level and retest of 20-year low at 0.9952 (July 14).
Daily studies remain bearishly aligned overall, though momentum has strengthened and probing into positive territory, but risk is expected to remain skewed to the downside as long as action holds below 1.0270.
Slightly better than expected German CPI data and hints that inflation may have peaked, with focus on US GDP data, due later today, which is expected to provide fresh signal.
Res: 1.0234; 1.0270; 1.0293; 1.0349.
Sup: 1.0185; 1.0149; 1.0096; 1.0000.
Eurozone economic sentiment dropped to 99.0 in Jul
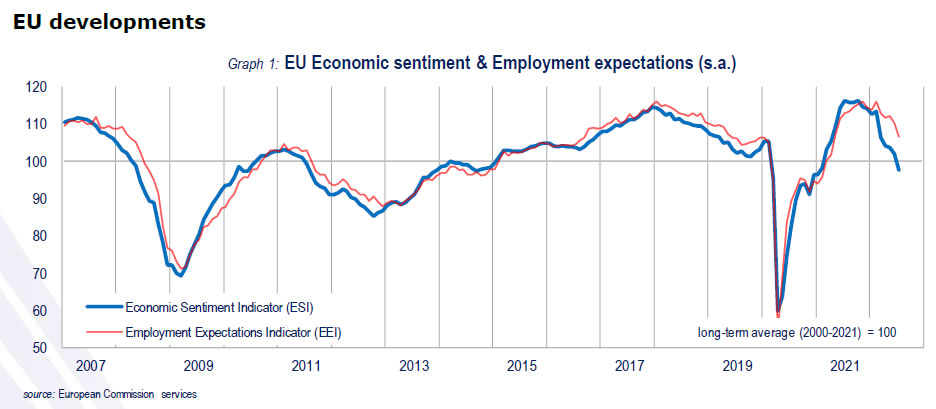
Eurozone Economic Sentiment Indicator dropped from 103.5 to 99.0 in July. Industrial confidence dropped from 7.0 to 3.5. Services confidence dropped from 104.1 to 10.7. Consumer confidence dropped from -23.8 to -27.0. Retail trade confidence dropped from -5.2 to -6.8. Construction confidence dropped from 103.5 to 99.0. Employment Expectations Indicator dropped from 110.2 to 107.0.
EU Economic Sentiment Indicator dropped from 101.8 to 97.6. Employment Expectations Indicator dropped from 110.2 to 106.6. In the EU, the drop in the ESI in July was due to significant losses in industry, services, retail trade and consumer confidence, whereas confidence in construction decreased more mildly. The ESI fell markedly in four out of the six largest EU economies, Spain (-5.0), Germany (-4.9), Italy (-3.4) and Poland (-3.2), while it remained broadly stable in France (-0.1) and the Netherlands (+0.2).
GBP/JPY Daily Outlook
Daily Pivots: (S1) 165.07; (P) 165.70; (R1) 166.75; More...
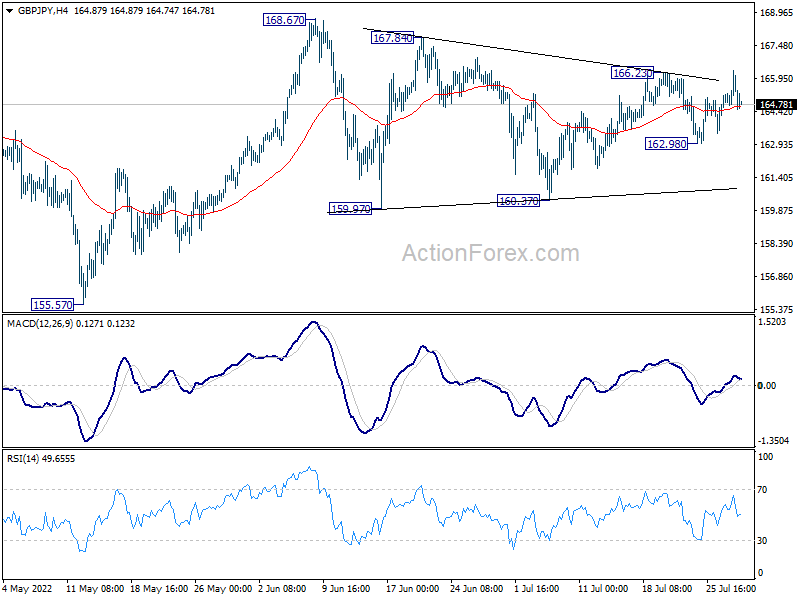
Intraday bias in GBP/JPY remains neutral and outlook is unchanged. Corrective pattern from 168.67 could still extend further. Below 162.98 minor support will target 160.37. Nevertheless, break of 166.23 will bring retest of 168.67 high instead. And, larger up trend might be ready to resume in this case.
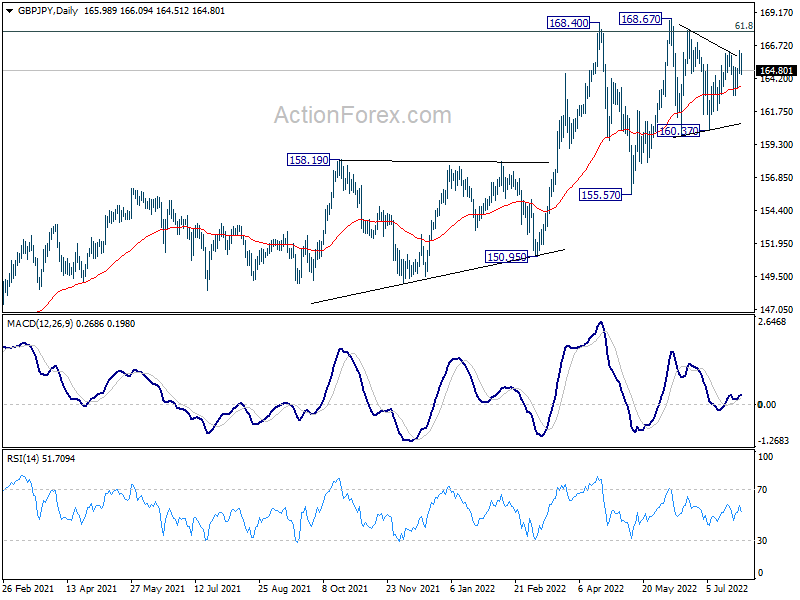
In the bigger picture, up trend from 123.94 (2020 low) is still in progress. Sustained break of 61.8% retracement of 195.86 (2015 high) to 122.75 (2016 low) at 167.93 will be a long term bullish signal, and could pave the way back to 195.86 high. This will now remain the favored case as long as 155.57 support holds, even in case of deep pull back.
EUR/JPY Daily Outlook
Daily Pivots: (S1) 138.70; (P) 139.10; (R1) 139.77; More....
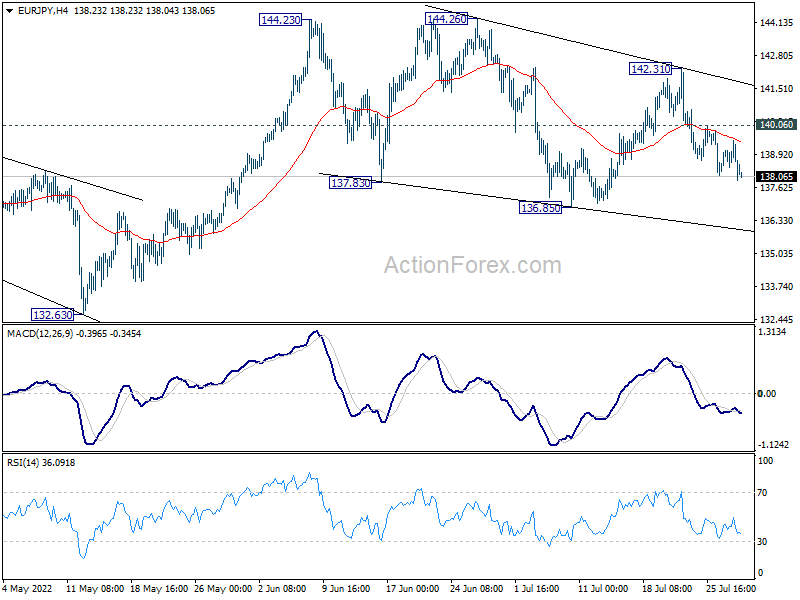
Intraday bias in EUR/JPY stays mildly on the downside. Current decline from is seen as a falling leg inside the corrective pattern from 144.23. Deeper decline would be seen to 136.85 support. On the upside, above 140.06 minor resistance will turn bias back to the upside for 142.31 resistance instead.
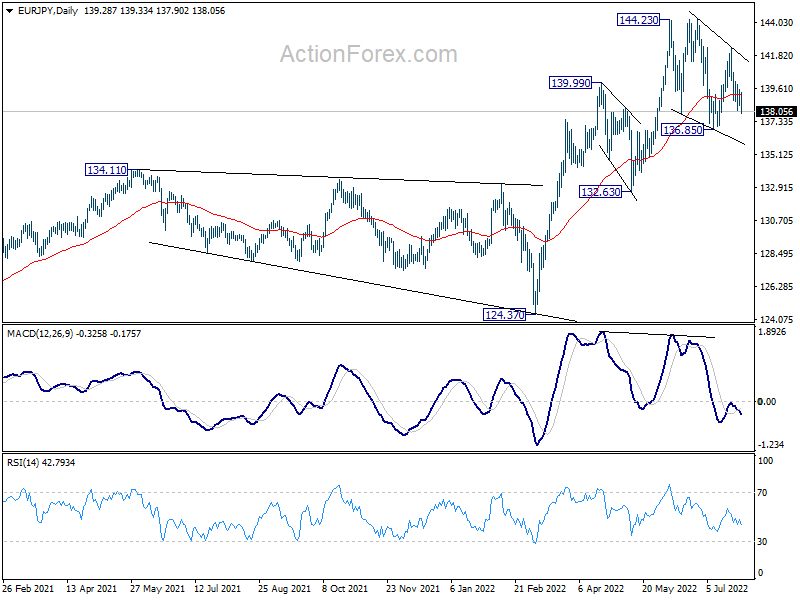
In the bigger picture, up trend from 114.42 (2020 low) is seen as the third leg of the pattern from 109.30 (2016 low). Further rally is in favor as long as 134.11 resistance turned support holds, even in case of deep pull back. Next target is 149.76 (2015 high). However, sustained break of 134.11 will be a sign of medium term bearish reversal and turn focus to 124.37 support for confirmation.
EUR/GBP Daily Outlook
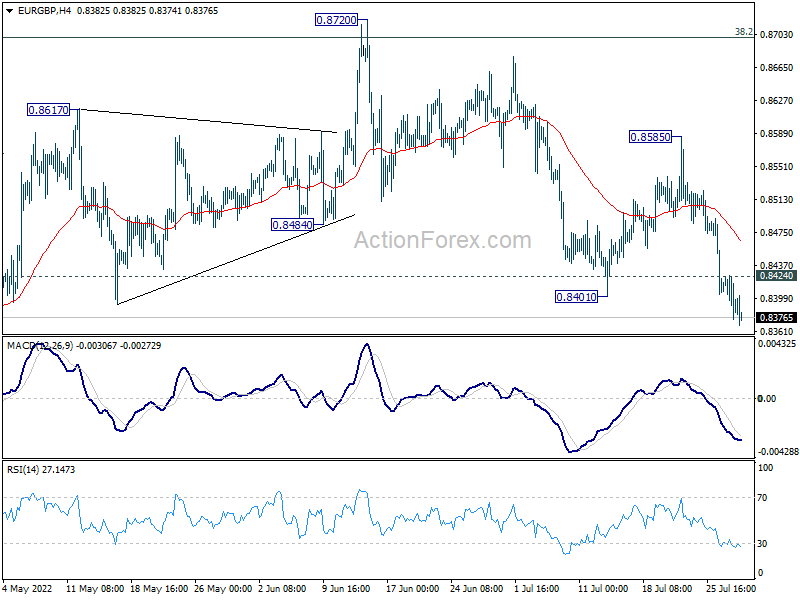
Daily Pivots: (S1) 0.8369; (P) 0.8397; (R1) 0.8419; More...
EUR/GBP's fall from 0.8720 resumed by breaking through 0.8401 support. The development also affirms the case of rejection by 0.8697 fibonacci level. Intraday bias stays on the downside for deeper fall to 0.8720 low. On the upside, above 0.8424 minor resistance will turn intraday bias neutral first. But risk will now stay on the downside as long as 0.8585 resistance holds.
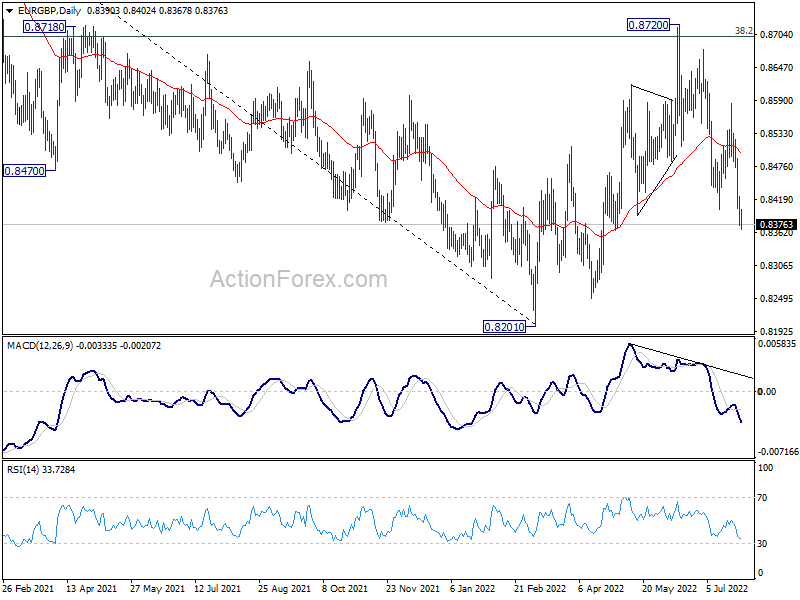
In the bigger picture, attention remains on 38.2% retracement of 0.9499 to 0.8201 at 0.8697. Sustained break there will affirm the case that rise from 0.8201 is a medium term up trend itself. Further rally would then be seen to 61.8% retracement at 0.9003. However, rejection by 0.8697 will confirm medium term bearishness for another fall through 0.8201.
EUR/AUD Daily Outlook
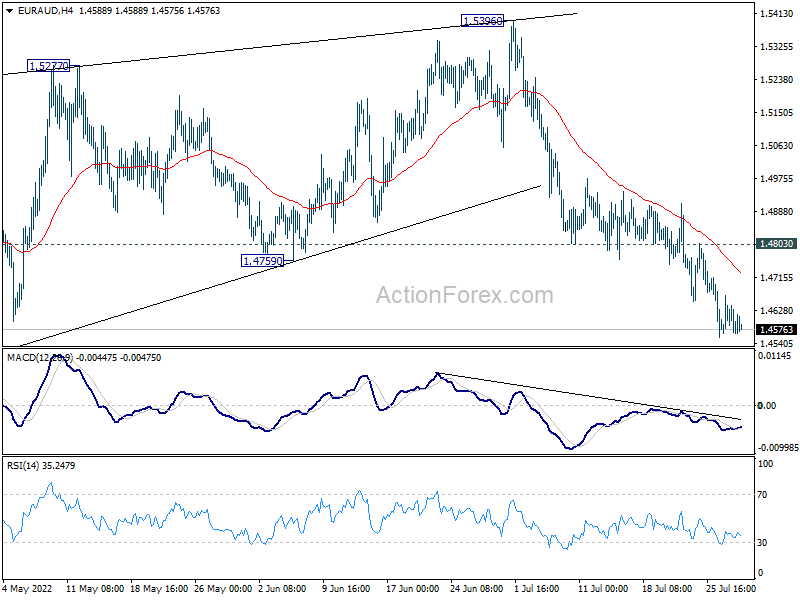
Daily Pivots: (S1) 1.4546; (P) 1.4607; (R1) 1.4644; More...
Intraday bias in EUR/AUD remains on the downside and outlook is unchanged. Fall from 1.5396 should target a test on 1.4318 low next. Decisive break there will resume larger down trend. On the upside, above 1.4803 minor resistance will turn intraday bias neutral, and bring consolidations first, before staging another decline.
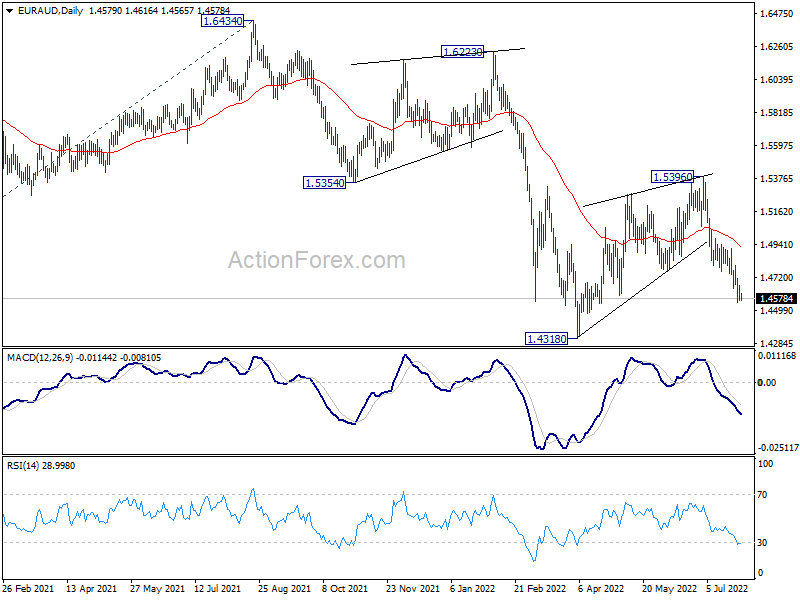
In the bigger picture, rejection by 1.5354 support turned resistance, as well as 55 week EMA (now at 1.5378), maintain medium term bearishness. That is, larger down trend from 1.9799 is not completed yet. Break of 1.4318 low will target 61.8% projection of 1.9799 to 1.5250 from 1.6434 at 1.3623, which is close to 1.3624 long term support (2017 low). This will remain the favored case now as long as 1.5396 resistance holds.
EUR/CHF Daily Outlook
Daily Pivots: (S1) 0.9751; (P) 0.9774; (R1) 0.9810; More....
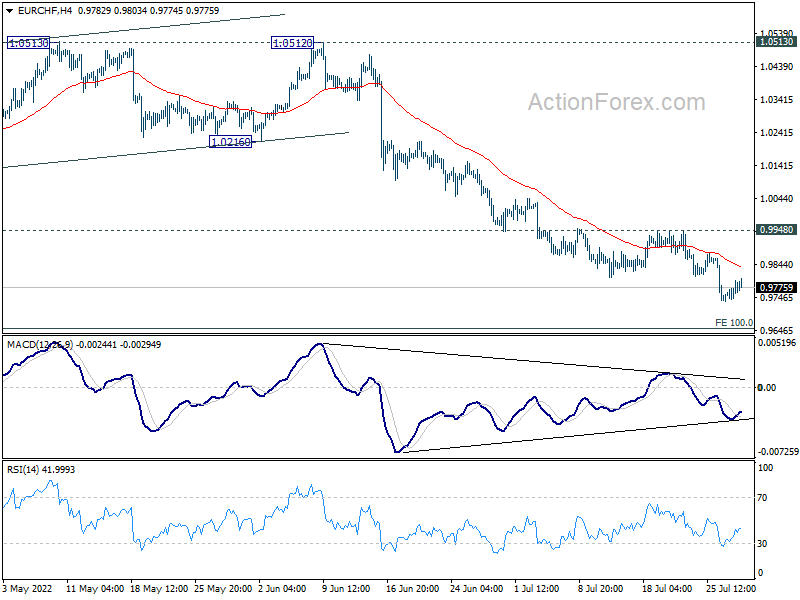
EUR/CHF is losing downside momentum again. But further decline is still expected as long as 0.9948 resistance holds. Current down trend should target 0.9650 long term projection level. On the upside, however, considering bullish convergence condition in 4 hour MACD, break of 0.9948 should confirm short term bottoming. Intraday bias will be back to the upside for further rebound.
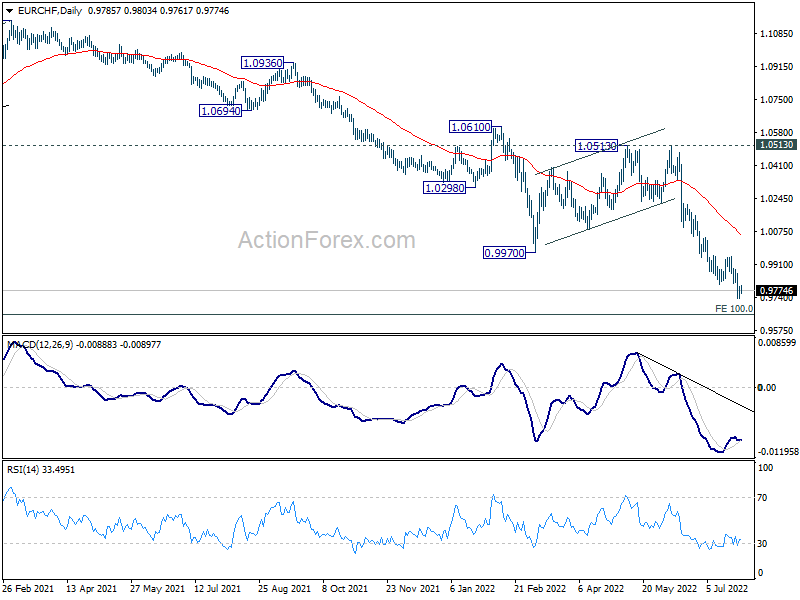
In the bigger picture,long term down trend from 1.2004 (2018 high) is expected to target 100% projection of 1.2004 to 1.0505 to 1.1149 at 0.9650. On the upside, break of 1.0513 resistance is needed to indicate medium term bottoming. Otherwise, outlook will stay bearish in case of strong rebound.
Ethereum Outperforms Bitcoin as Merge Continues to Attract Attention
The major cryptocurrencies have been steadily climbing since mid-June, recovering somewhat from the heavy losses suffered from April and emulating the stock rebound on Wall Street. Bitcoin has gained a healthy 30% from the June low point, but its rival Ether – the world’s second most popular crypto – has staged an even more impressive comeback, rallying by about 90%. Although Ether is known to be more volatile than Bitcoin, there is more than just the bounce back in broader risk assets driving this upswing.
The merge
Ethereum – the blockchain-based platform that processes the payments made via Ether – will receive a major upgrade on September 19 when the network will merge with Beacon Chain, replacing the existing proof-of-work (PoW) mechanism with a proof-of-stake (PoS) one. PoW is currently how most cryptocurrencies like Bitcoin are mined. But this system is seen as inefficient as it requires a lot of computing power to validate incoming transactions and transaction speeds are slow. It can also be quite costly for would-be miners to invest in the right software and hardware equipment.
In comparison, PoS uses less energy, is faster and does not require miners. Instead, PoS has validators who don’t need any specialized equipment to participate. However, it does have one major drawback, which is it’s not as secure as the more proven PoW system.
A supply shock?
But the most important distinction between the two is that in proof of stake, validators have to ‘stake’ a certain amount of their coins or tokens as a form of guarantee. This is in fact the primary concept on which the PoS mechanism is built upon in that it assumes that participants staking their funds will want to do things correctly to maintain the integrity of the blockchain network so as not to lose their stake.
And this is what could prove to be a game changer for Ether and Ethereum as the method of staking will significantly reduce the supply of the coin in circulation. The annual issuance of new Ether is also expected to be affected as the amount will be determined by how much validators stake rather than the current fixed rate of approximately 4.5 million a year.
The potential deflationary impact of the switch from PoW to PoS is what’s spurring this speculative interest in Ethereum, magnifying its upside whenever cryptos are rallying.
Bullish hopes
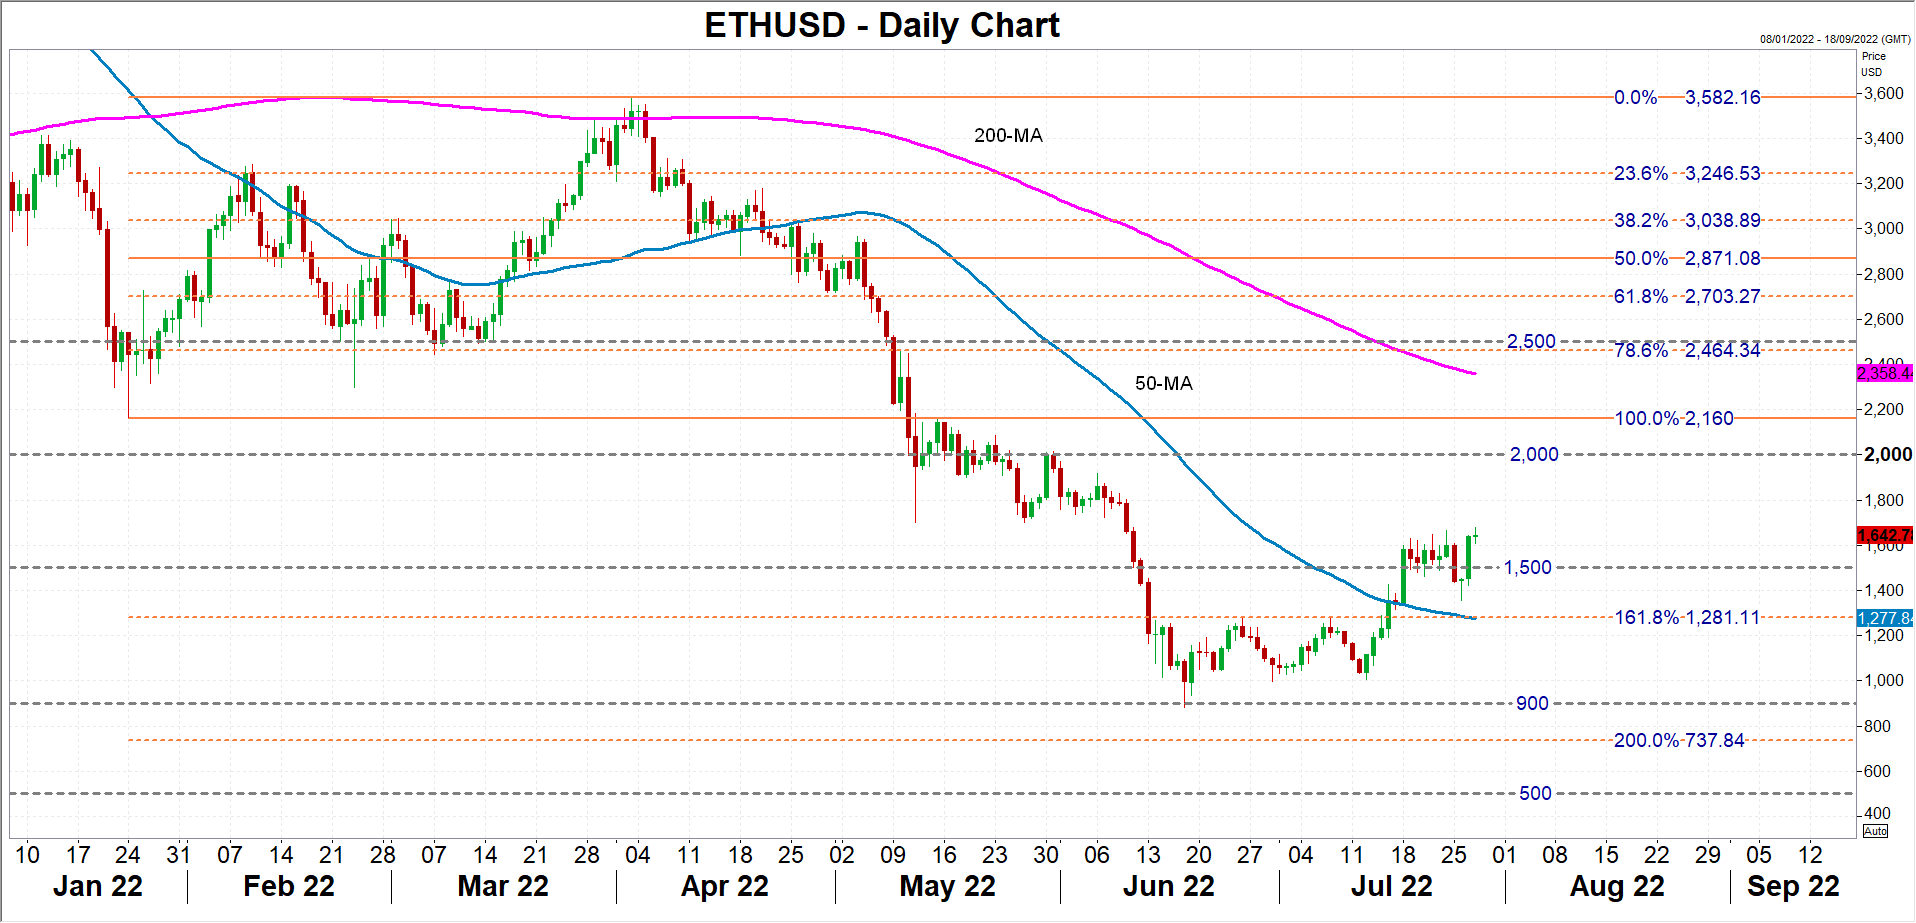
The price of ETHUSD hit a six-week high of $1,677.51 on Thursday. If the positive momentum gathers more steam, the $2,000 level will likely be eyed next before challenging the heavily congested region of $2,500.
The problem for the bulls, though, is that a more meaningful rally may not come until after the merge in September. An improvement in the macroeconomic environment by year-end might also propel Ethereum and other cryptocurrencies higher if inflationary pressures begin to moderate in the coming months and central banks like the Fed pause hiking interest rates.
Equity markets are already encouraged by the possibility of rate cuts in 2023 despite the increasing prospect of a recession in the interim and many traders are betting that stocks have bottomed out. Given how strong the positive correlation between equities and cryptos has grown this year, this could also be true for the crypto market.
Uncertainties ahead
However, it’s also possible that the worst has yet to come. For example, Europe’s energy crisis may only just be unfolding, and the Fed risks overestimating the spending power of the US consumer. If stocks tumble again, so would cryptos.
A sharp selloff could push ETHUSD towards the 50-day moving average, which is converging with the 161.8% Fibonacci extensions of the January-April uptrend around $1,280. A breach below it would pave the way for the $900 support zone, which defended the price back in June, while steeper declines could stretch until the $500 level.
Another risk and one that is more specific to cryptos is the liquidity problems facing some crypto lending and exchange platforms such as Coinbase. It comes after crypto lenders Celsius Network and Voyager Digital recently filed for bankruptcy, fuelling fears of full-scale liquidity crisis.
More upgrades to come
For Ethereum, the hype around the upcoming merge could yet cushion it against another crash, or at the very least, expedite any rebound that follows. Moreover, further updates are planned for Ethereum, such as the ‘surge’ upgrade that will boost its transaction processing capabilities. Hence, this phase of outperformance may only be just starting.
WTI Futures Extend Sideways Move Supported by 200-SMA
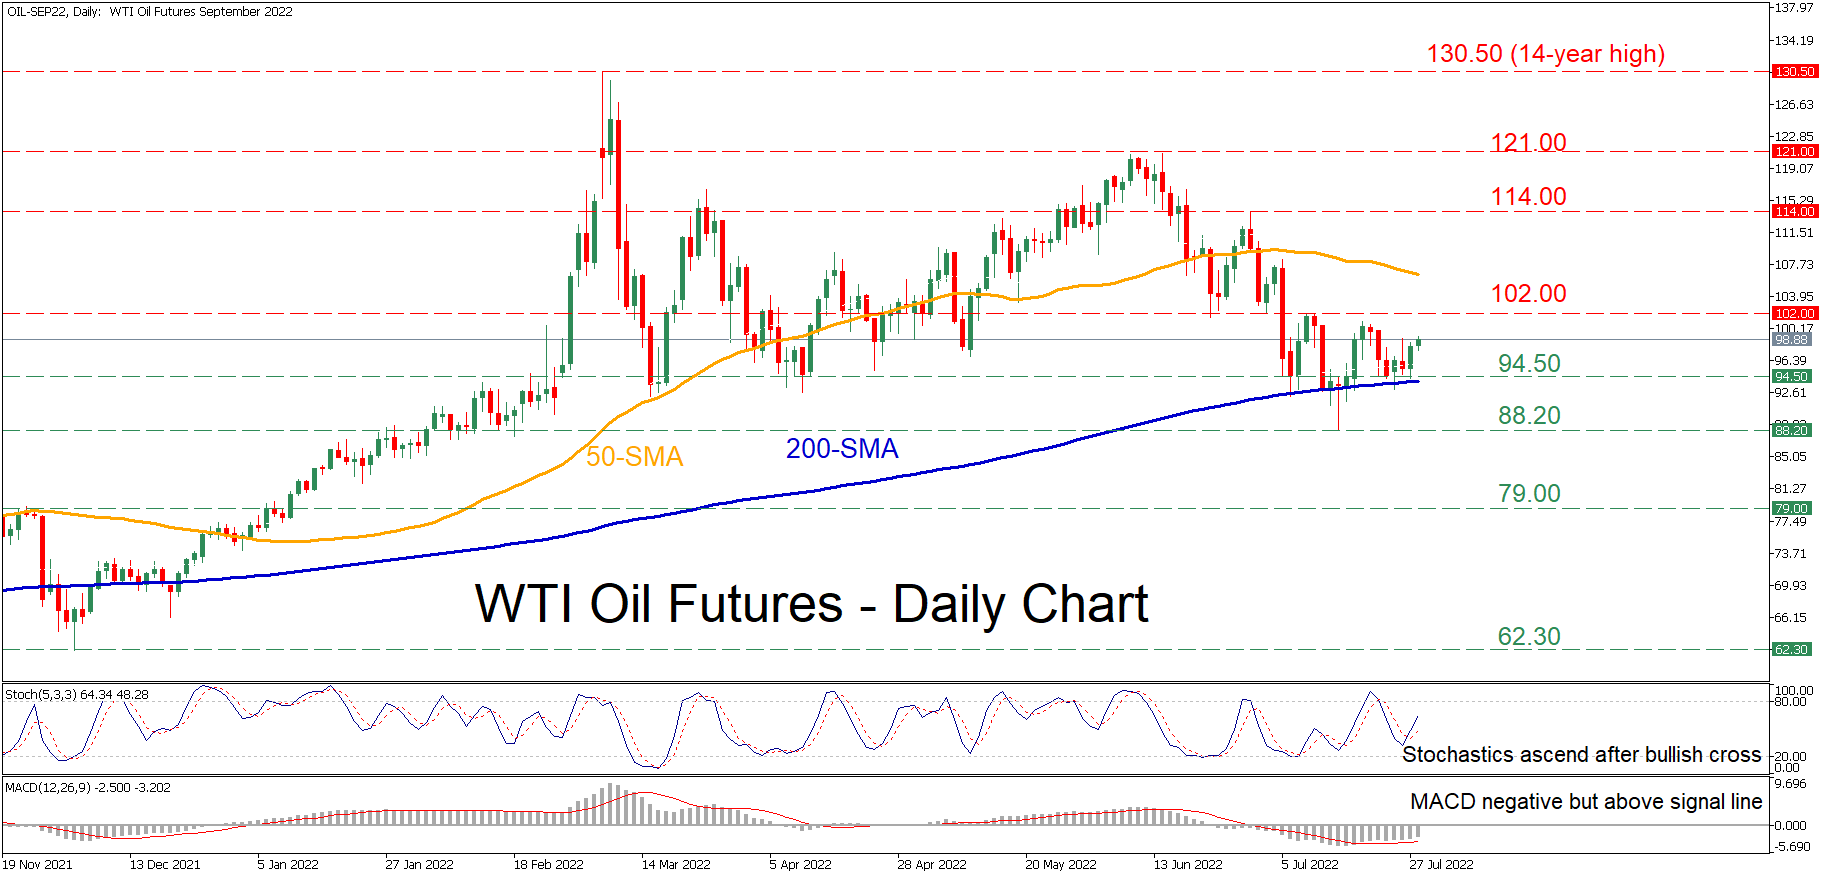
WTI oil futures (September delivery) have been losing ground since early June when the price failed to surpass the 121.00 mark. However, a further decline has been rejected multiple times by the 200-day simple moving average (SMA) and the price has currently adopted a rangebound pattern.
The momentum indicators suggest that near-term risks are tilted to the upside. Specifically, the stochastic oscillator is sloping upwards after posting a bearish cross, while the MACD histogram has jumped above its red signal line but remains in the negative territory.
Should the negative momentum strengthen, the price might encounter support at 94.50, which overlaps with the 200-day SMA. Sliding below that floor, the commodity could descend towards the recent low of 88.20 before the spotlight turns to 79.00. Failing to halt there, the December low of 62.30 might prove to be a tough obstacle for the bears to overcome.
On the flipside, bullish actions could propel the price towards 102.00, which is the upper boundary of the recent sideways pattern. Conquering this barricade, the bulls could aim for 114.00 before the price challenges the crucial resistance region of 121.00. An upside violation of the latter could open the door for the 14-year high of 130.50.
Overall, the recent sell-off in WTI oil futures is likely to resume, bringing the 200-day SMA under examination again. Nevertheless, a profound break above the 100 psychological mark might attract further buying interest and enable the commodity to post a strong rebound.