Sample Category Title
GBP/JPY Daily Outlook
Daily Pivots: (S1) 160.72; (P) 161.61; (R1) 162.17; More...
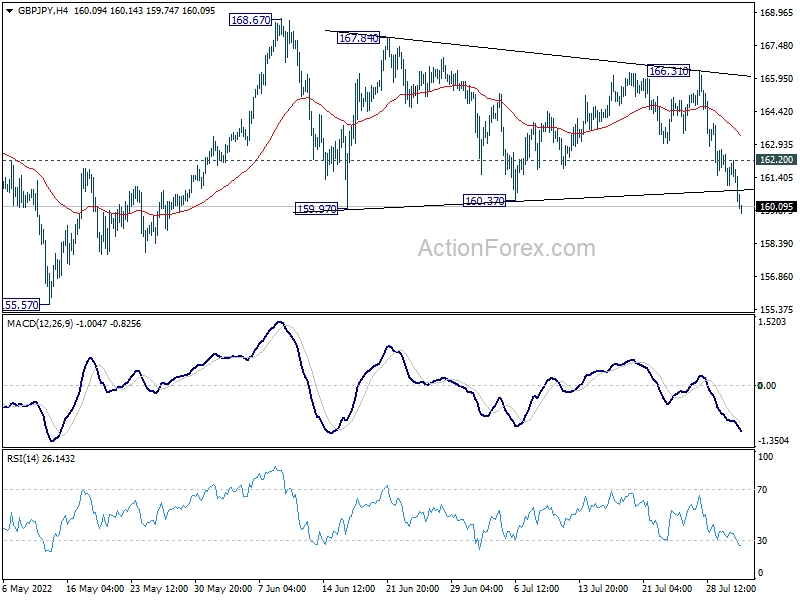
GBP/JPY's fall continues today and breaks through 160.37 support. Intraday bias stays on the downside. Deeper decline would be seen to 162.67 support next. On the upside, above 162.20 minor resistance will turn intraday bias neutral and bring consolidations first.
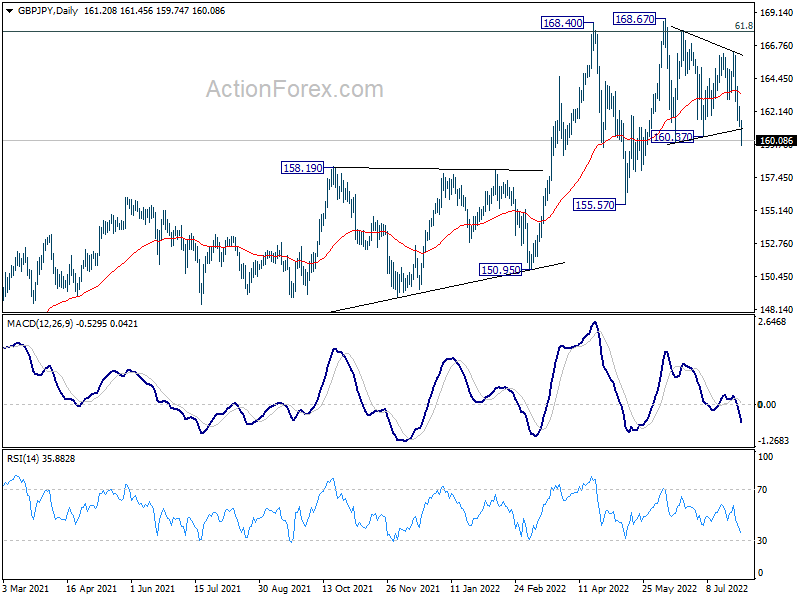
In the bigger picture, up trend from 123.94 (2020 low) is still in progress. Sustained break of 61.8% retracement of 195.86 (2015 high) to 122.75 (2016 low) at 167.93 will be a long term bullish signal, and could pave the way back to 195.86 high. This will now remain the favored case as long as 155.57 support holds, even in case of deep pull back.
EUR/GBP Daily Outlook
Daily Pivots: (S1) 0.8351; (P) 0.8376; (R1) 0.8396; More...
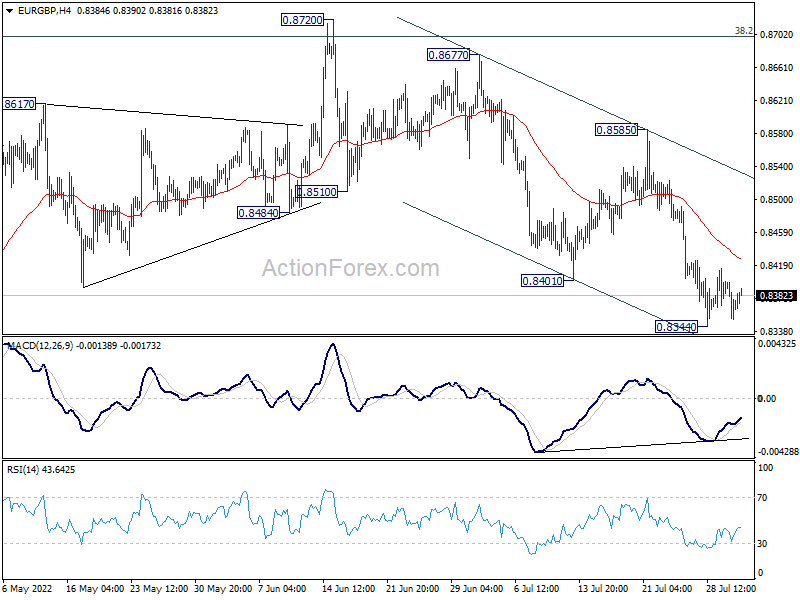
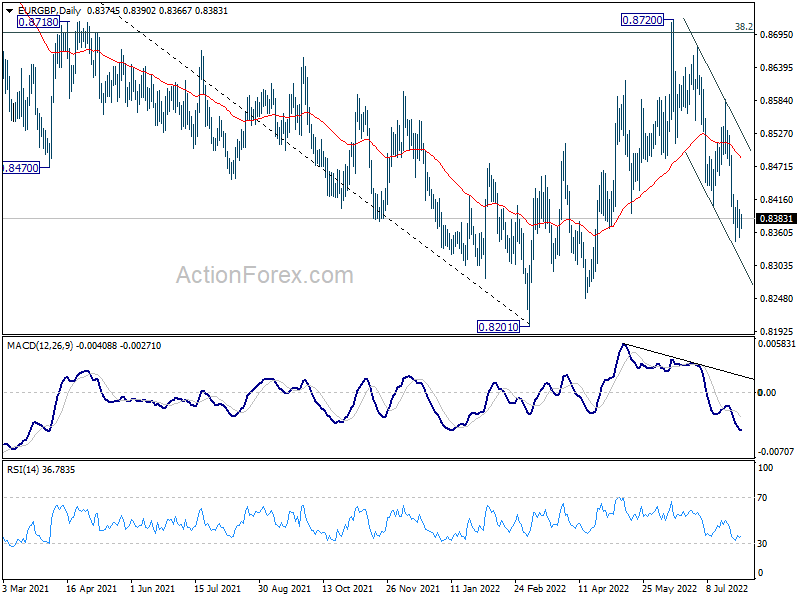
EUR/GBP is staying in consolidation above 0.8344 and intraday bias remains neutral first. While stronger recovery cannot be ruled out, further decline is expected as long as 0.8585 resistance holds. Below 0.8344 will resume the fall from 0.8720 for retesting 0.8201 low.
In the bigger picture, current development suggests rejection by 38.2% retracement of 0.9499 to 0.8201 at 0.8697. Medium term term bearishness is maintained. Break of 0.8201 will resume larger down trend from 0.9499 (2020 high). Nevertheless, sustained break of 0.8697 will affirm the case that rise from 0.8201 is a medium term up trend itself.
EUR/AUD Daily Outlook
Daily Pivots: (S1) 1.4532; (P) 1.4598; (R1) 1.4665; More...
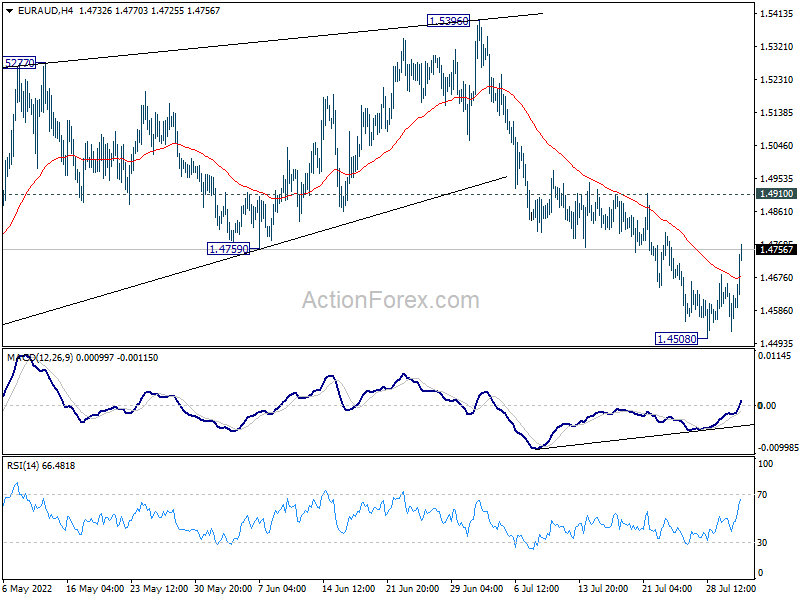
Intraday bias in EUR/AUD remains mildly on the upside as recovery from 1.4508 extends. Upside should be limited below 1.4910 resistance to bring fall resumption. On the downside, break the 1.4508 will resume the decline from 1.5396 to retest 1.4318 low. However, firm break of 1.4910 will dampen this bearish view and bring stronger rally.
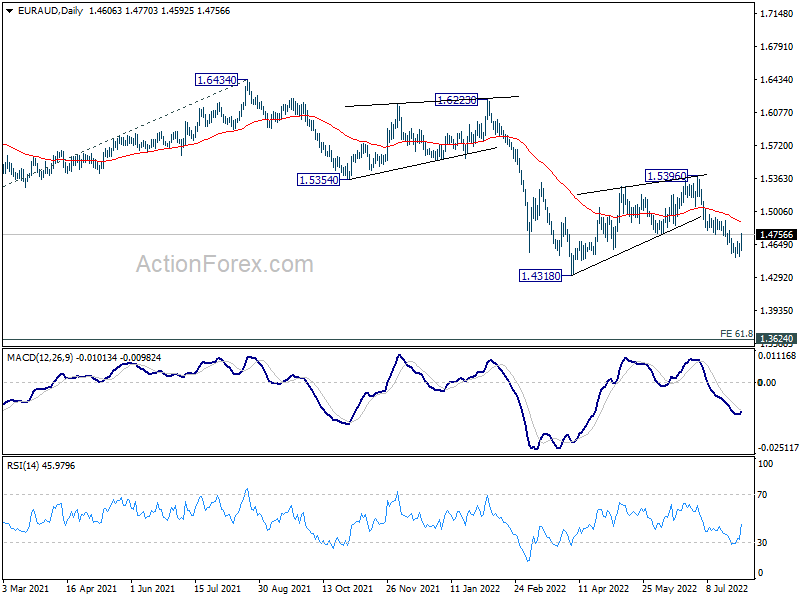
In the bigger picture, rejection by 1.5354 support turned resistance, as well as 55 week EMA (now at 1.5378), maintain medium term bearishness. That is, larger down trend from 1.9799 is not completed yet. Break of 1.4318 low will target 61.8% projection of 1.9799 to 1.5250 from 1.6434 at 1.3623, which is close to 1.3624 long term support (2017 low). This will remain the favored case now as long as 1.5396 resistance holds.
EUR/CHF Daily Outlook
Daily Pivots: (S1) 0.9720; (P) 0.9740; (R1) 0.9765; More....
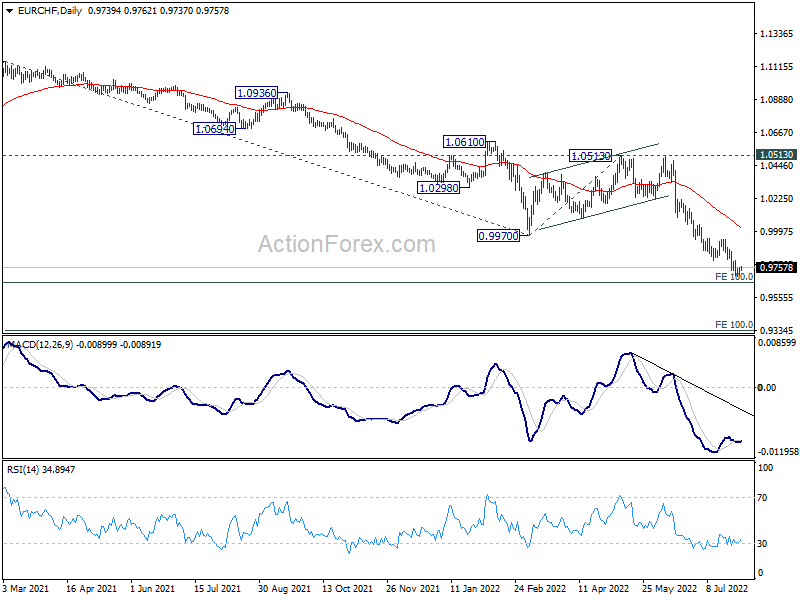
Intraday bias in EUR/CHF is turned neutral first as it lost downside momentum after hitting 0.9697. While further fall cannot be ruled out, some support might be seen from 0.9650 long term projection level to bring rebound. Break of 0.9948 resistance will indicate short term bottoming. nevertheless, firm break of 0.9650 will target 100% projection of 1.1149 to 0.9970 from 1.0513 at 0.9334.
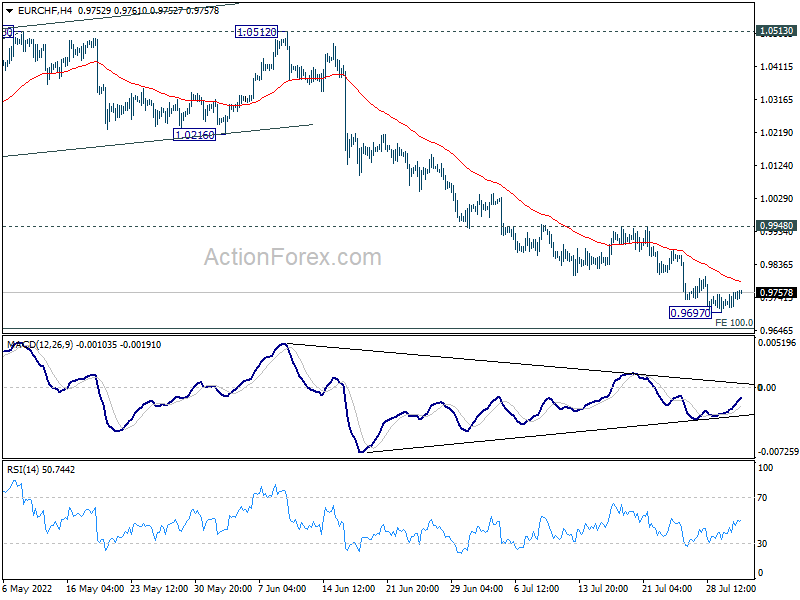
In the bigger picture, long term down trend from 1.2004 (2018 high) is expected to target 100% projection of 1.2004 to 1.0505 to 1.1149 at 0.9650. Firm break there will target 138.2% projection at 0.9033. On the upside, break of 1.0513 resistance is needed to indicate medium term bottoming. Otherwise, outlook will stay bearish in case of strong rebound.
EUR/USD Daily Outlook
Daily Pivots: (S1) 1.0220; (P) 1.0247; (R1) 1.0289; More...
Intraday bias in EUR/USD is back on the upside as rebound from 0.9951 is now trying to resume. Further rise should be seen to 1.0348 resistance first. Break there will target channel resistance at 1.0452. On the downside, break of 1.0095 minor support will turn bias back to the downside, and bring retest of 0.9951 low instead.
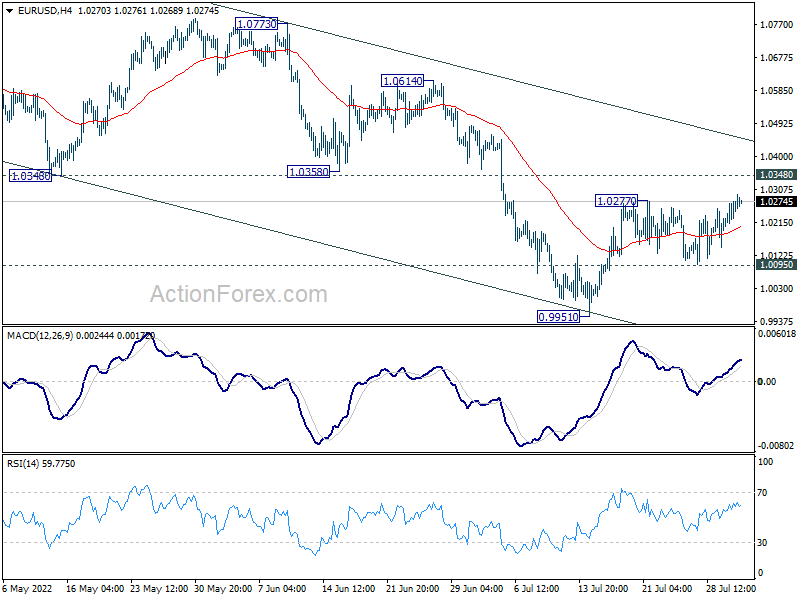
In the bigger picture, down trend from 1.6039 (2008 high) is still in progress. Next target is 100% projection of 1.3993 to 1.0339 from 1.2348 at 0.8694. In any case, outlook will stay bearish as long as 1.0773 resistance holds, in case of strong rebound.
GBP/USD Daily Outlook
Daily Pivots: (S1) 1.2177; (P) 1.2236; (R1) 1.2314; More...
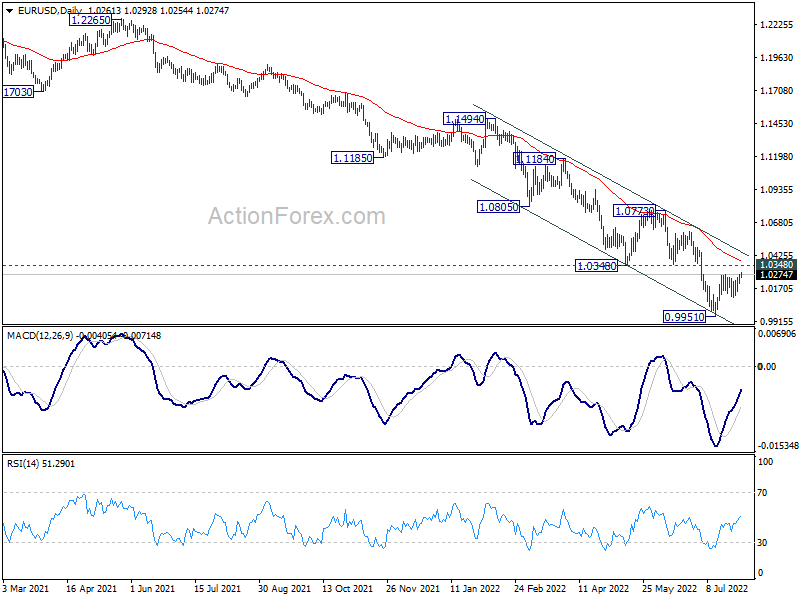
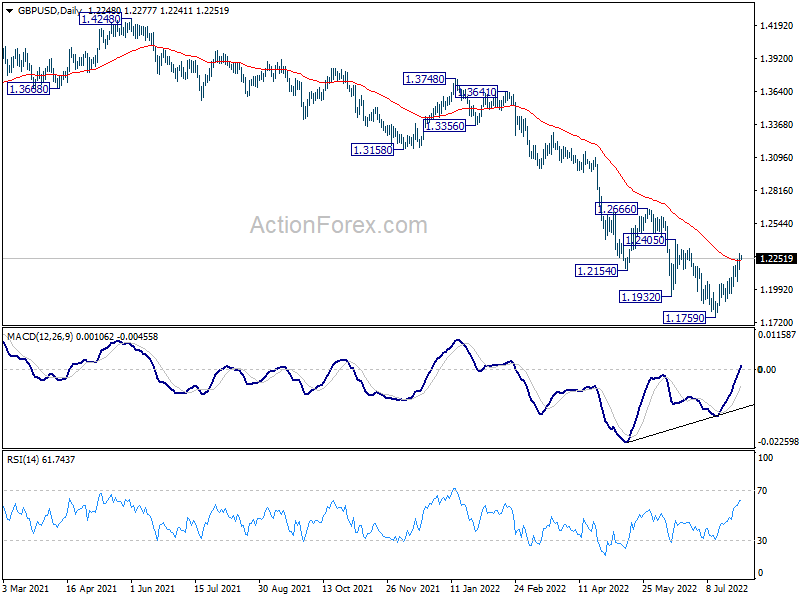
GBP/USD's rally from 1.1759 is in progress and intraday bias stays on the upside. Next target is 1.2405 resistance. Firm break there will target 1.2666 key resistance next. On the downside, however, break of 1.2062 minor support will argue that the rebound is over, and turn bias back to the downside for retesting 1.1759 low instead.
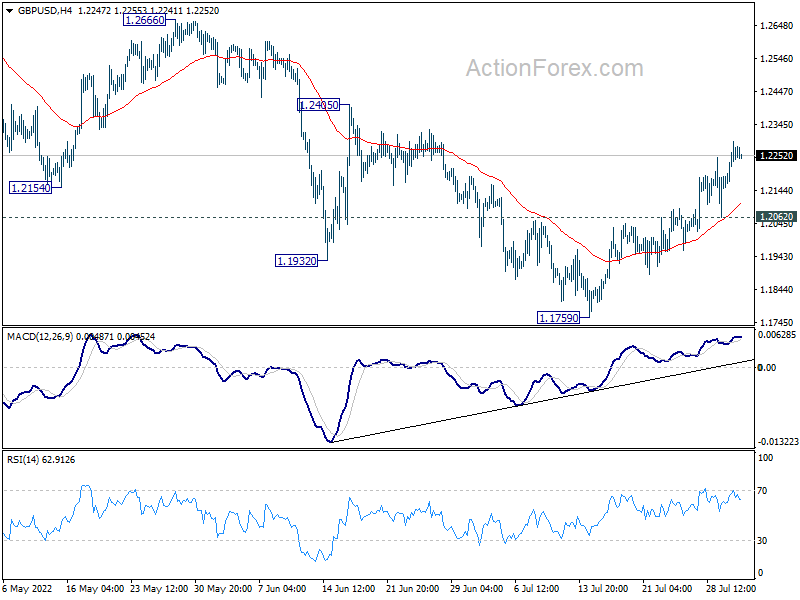
In the bigger picture, fall from 1.4248 (2018 high) could be a leg inside the pattern from 1.1409 (2020 low), or resuming the longer term down trend. Deeper decline is expected as long as 1.2666 resistance holds. Next target is 1.1409 low. However, firm break of 1.2666 will bring stronger rise back to 55 week EMA (now at 1.2957).
USD/CHF Daily Outlook
Daily Pivots: (S1) 0.9473; (P) 0.9505; (R1) 0.9528; More...
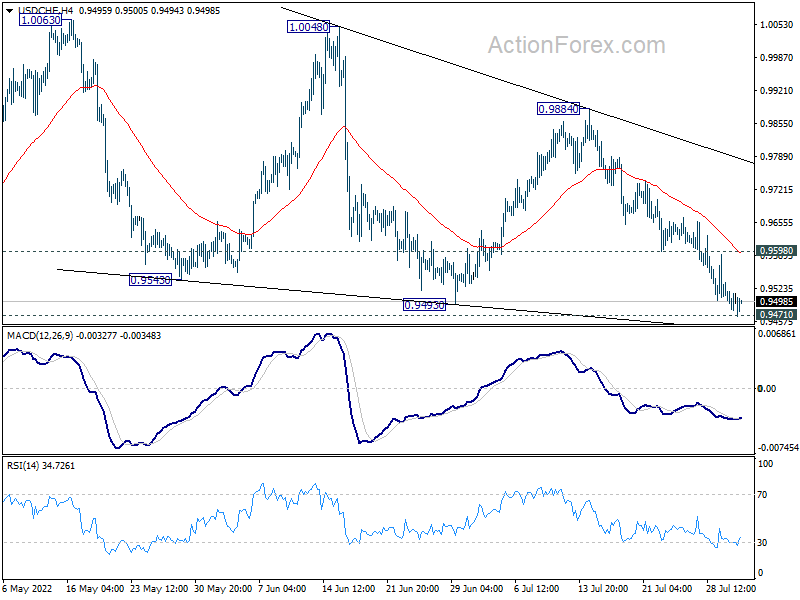
Focus stays on 0.9471 resistance turned support in USD/CHF. Strong support should be seen there to bring rebound. On the upside, above 0.9598 minor resistance will turn bias back to the upside for recovery towards 55 day EMA (now at 0.9651) and above. However, sustained break of 0.9471 will carry larger bearish implication and target 0.9193 support next.
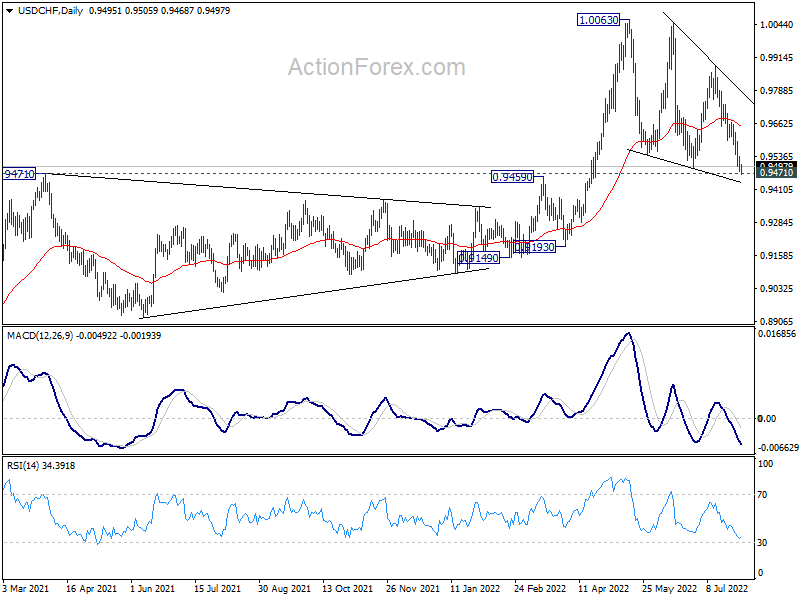
In the bigger picture, medium term up trend from 0.8756 (2021 low) is still in progress. On resumption, next target is 1.0342 (2016 high). Sustained break there will resume long term up trend from 0.7065 (2011 low). This will remain the favored case as long as 0.9471 resistance turned support holds. However, firm break of 0.9471 will raise the chance that such up trend is over. Sustained trading below 55 week EMA (now at 0.9424) could bring deeper medium term fall back to 0.9149 support and below.
USD/JPY Daily Outlook
Daily Pivots: (S1) 130.96; (P) 132.26; (R1) 132.92; More...
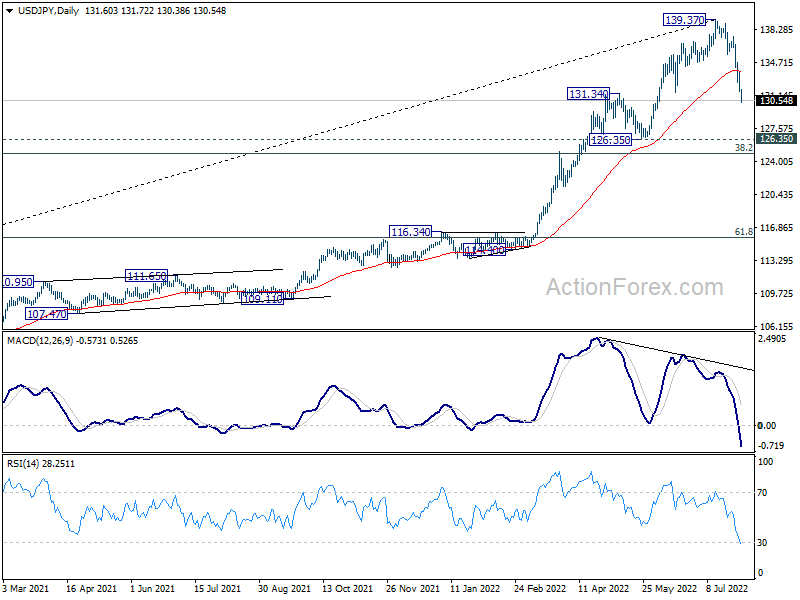
USD/JPY's decline from 139.37 is still in progress and intraday bias stays on the downside. Further fall would be seen towards 126.35 support. But strong support is expected above there, at least on first attempt, to bring rebound. On the upside, above 132.49 minor resistance will turn intraday bias neutral first, and bring some consolidations.
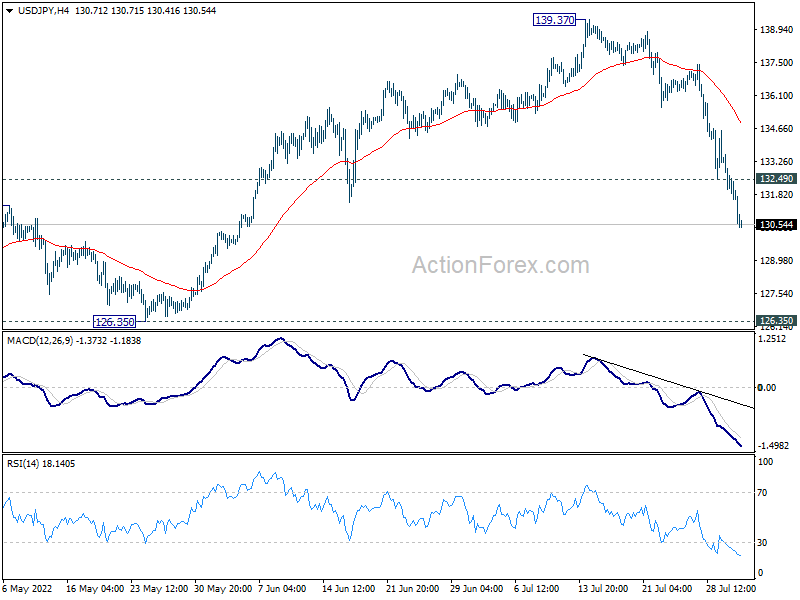
In the bigger picture, a medium term top should be in place at 139.37, on bearish divergence condition in daily MACD. Fall from there could be correcting whole up trend from 101.18 (2020 low). While deeper decline cannot be ruled out, outlook will stays bullish as long as 55 week EMA (now at 121.84) holds. Long term up trend is expected to resume through 139.37 at a later stage, after the correction finishes.
USD/CAD Daily Outlook
Daily Pivots: (S1) 1.2786; (P) 1.2821; (R1) 1.2874; More...
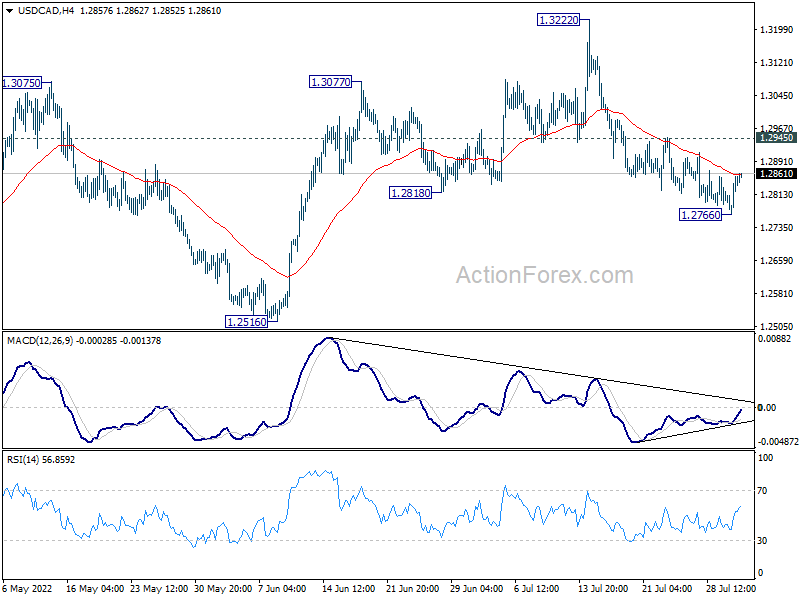
USD/CAD recovered after dipping to 1.2766 and intraday bias is turned neutral first. Further decline is mildly in favor with 1.2945 minor resistance intact. Below 1.2766 will resume the fall from 1.3222 to 1.2818 support next. On the upside, above 1.2945 minor resistance will revive near term bullishness, and turn bias back to the upside for retesting 1.3222 instead.
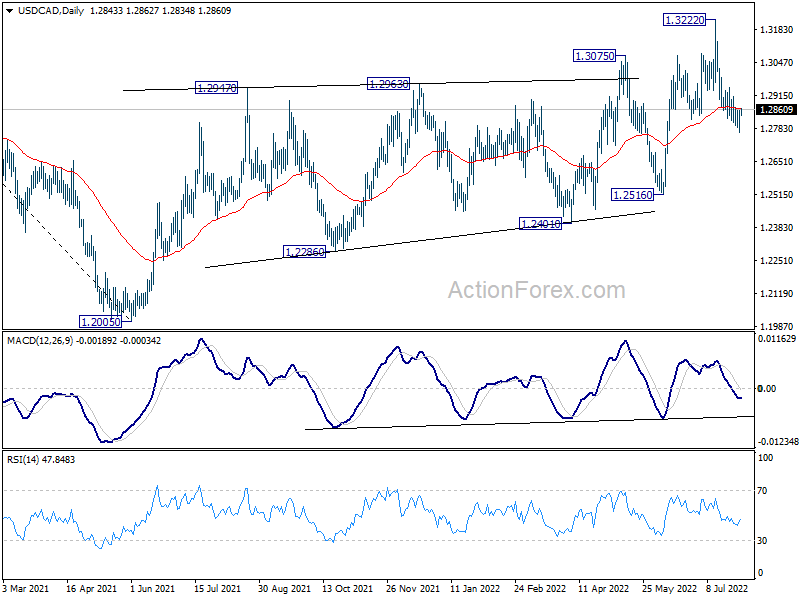
In the bigger picture, down trend from 1.4667 (2020 high) should have completed at 1.2005, after defending 1.2061 long term cluster support. Rise from there should target 61.8% retracement of 1.4667 to 1.2005 (2021 low) at 1.3650. This will remain the favored case now as long as 1.2516 support holds.
Elliott Wave View: AUDJPY Looking for Further Downside
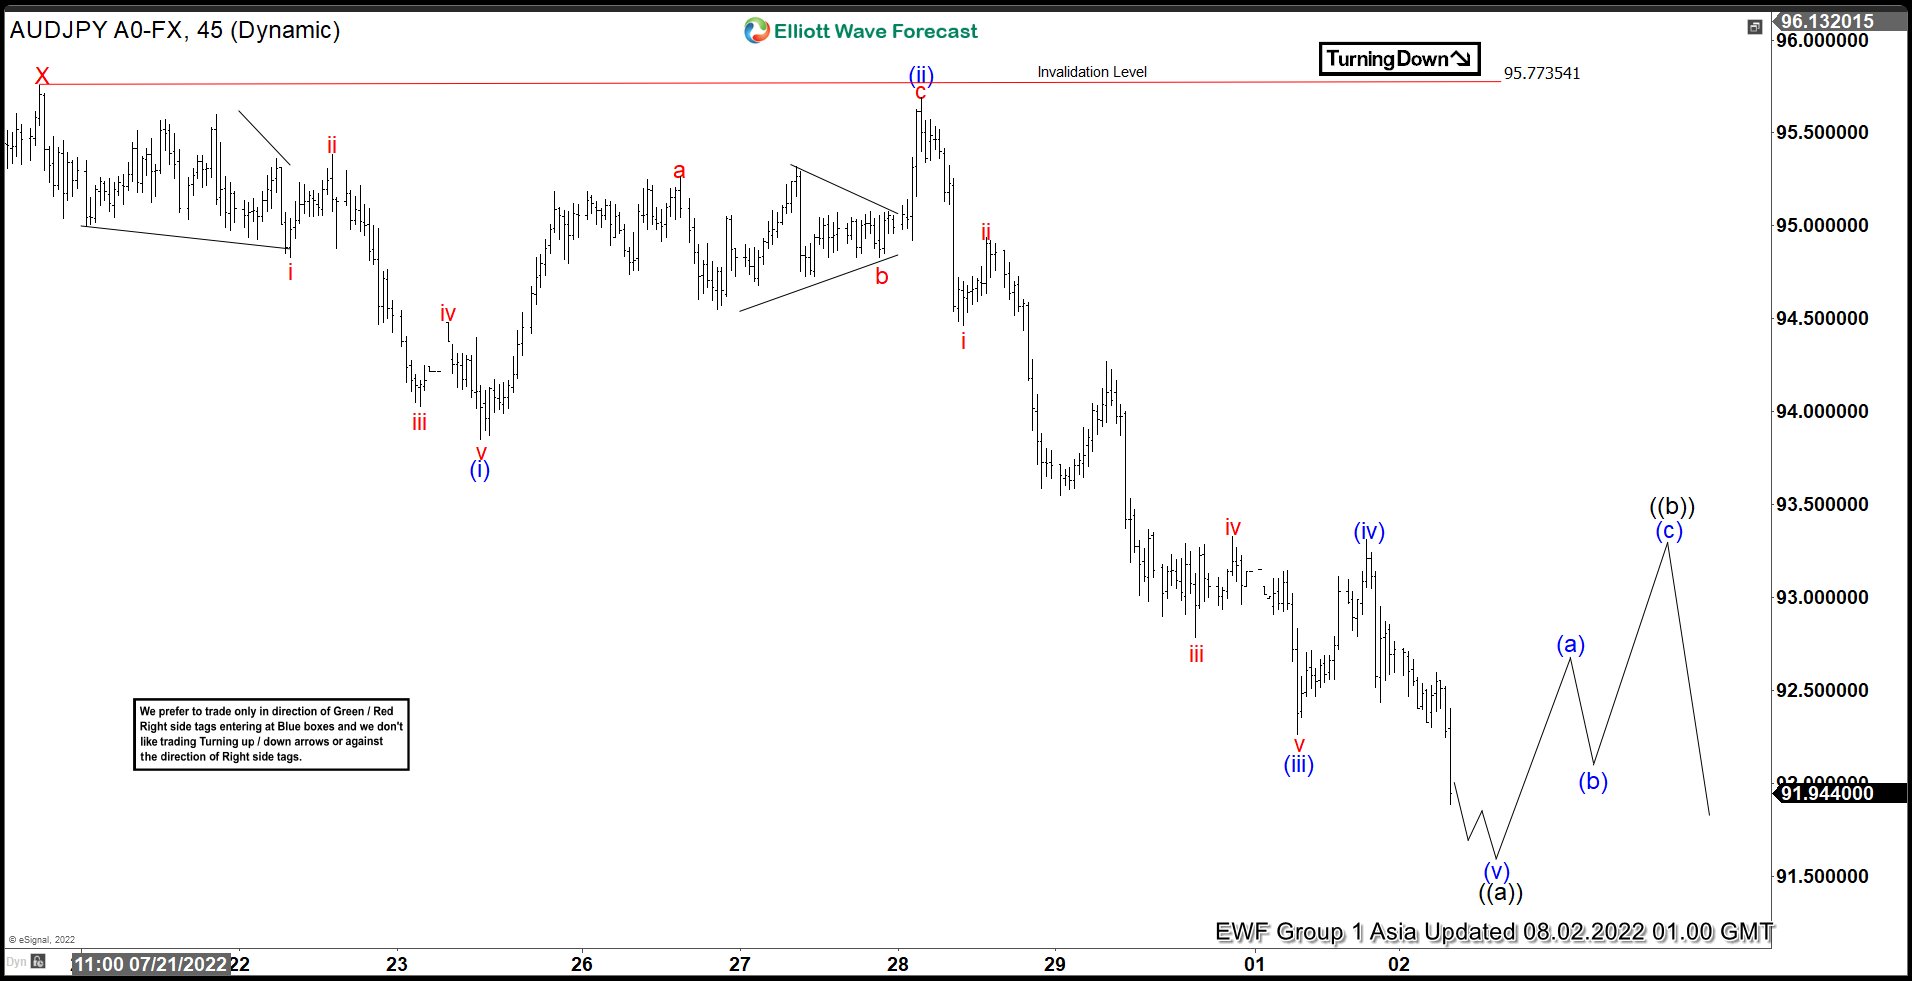
Short Term Elliott Wave view in AUDJPY suggests cycle from 6/8/2022 peak looks incomplete and can see further downside. Decline from 6/8/2022 peak is unfolding as a double three Elliott Wave structure. Down from there, wave W ended at 91.4 and rally in wave X ended at 95.75. Pair has broken below wave W at 91.4, confirming that wave Y lower has started. Down from wave X, wave (i) ended at 93.85 and wave (ii) rally ended at 95.69.
Pair then resumes lower in wave (iii) towards 92.26 and wave (iv) rally ended at 93.31. Final leg lower wave (v) should complete soon and this will end wave ((a)) in larger degree. Afterwards, pair should rally to correct cycle from 7/20/2022 high within wave ((b)) in larger degree before the decline resumes in wave ((c)) of Y. Near term, as far as pivot at 95.77 high stays intact, expect rally to fail in 3, 7, or 11 swing for further downside. Potential target lower is 100% – 161.8% Fibonacci extension from 6/8/2022 peak which comes at 87 – 90.3. From this area, pair could then rally in 3 swing at least to correct the entire decline from 6/8/2022 peak.
AUDJPY 45 Minutes Elliott Wave Chart