Sample Category Title
EUR/JPY Seeks Support
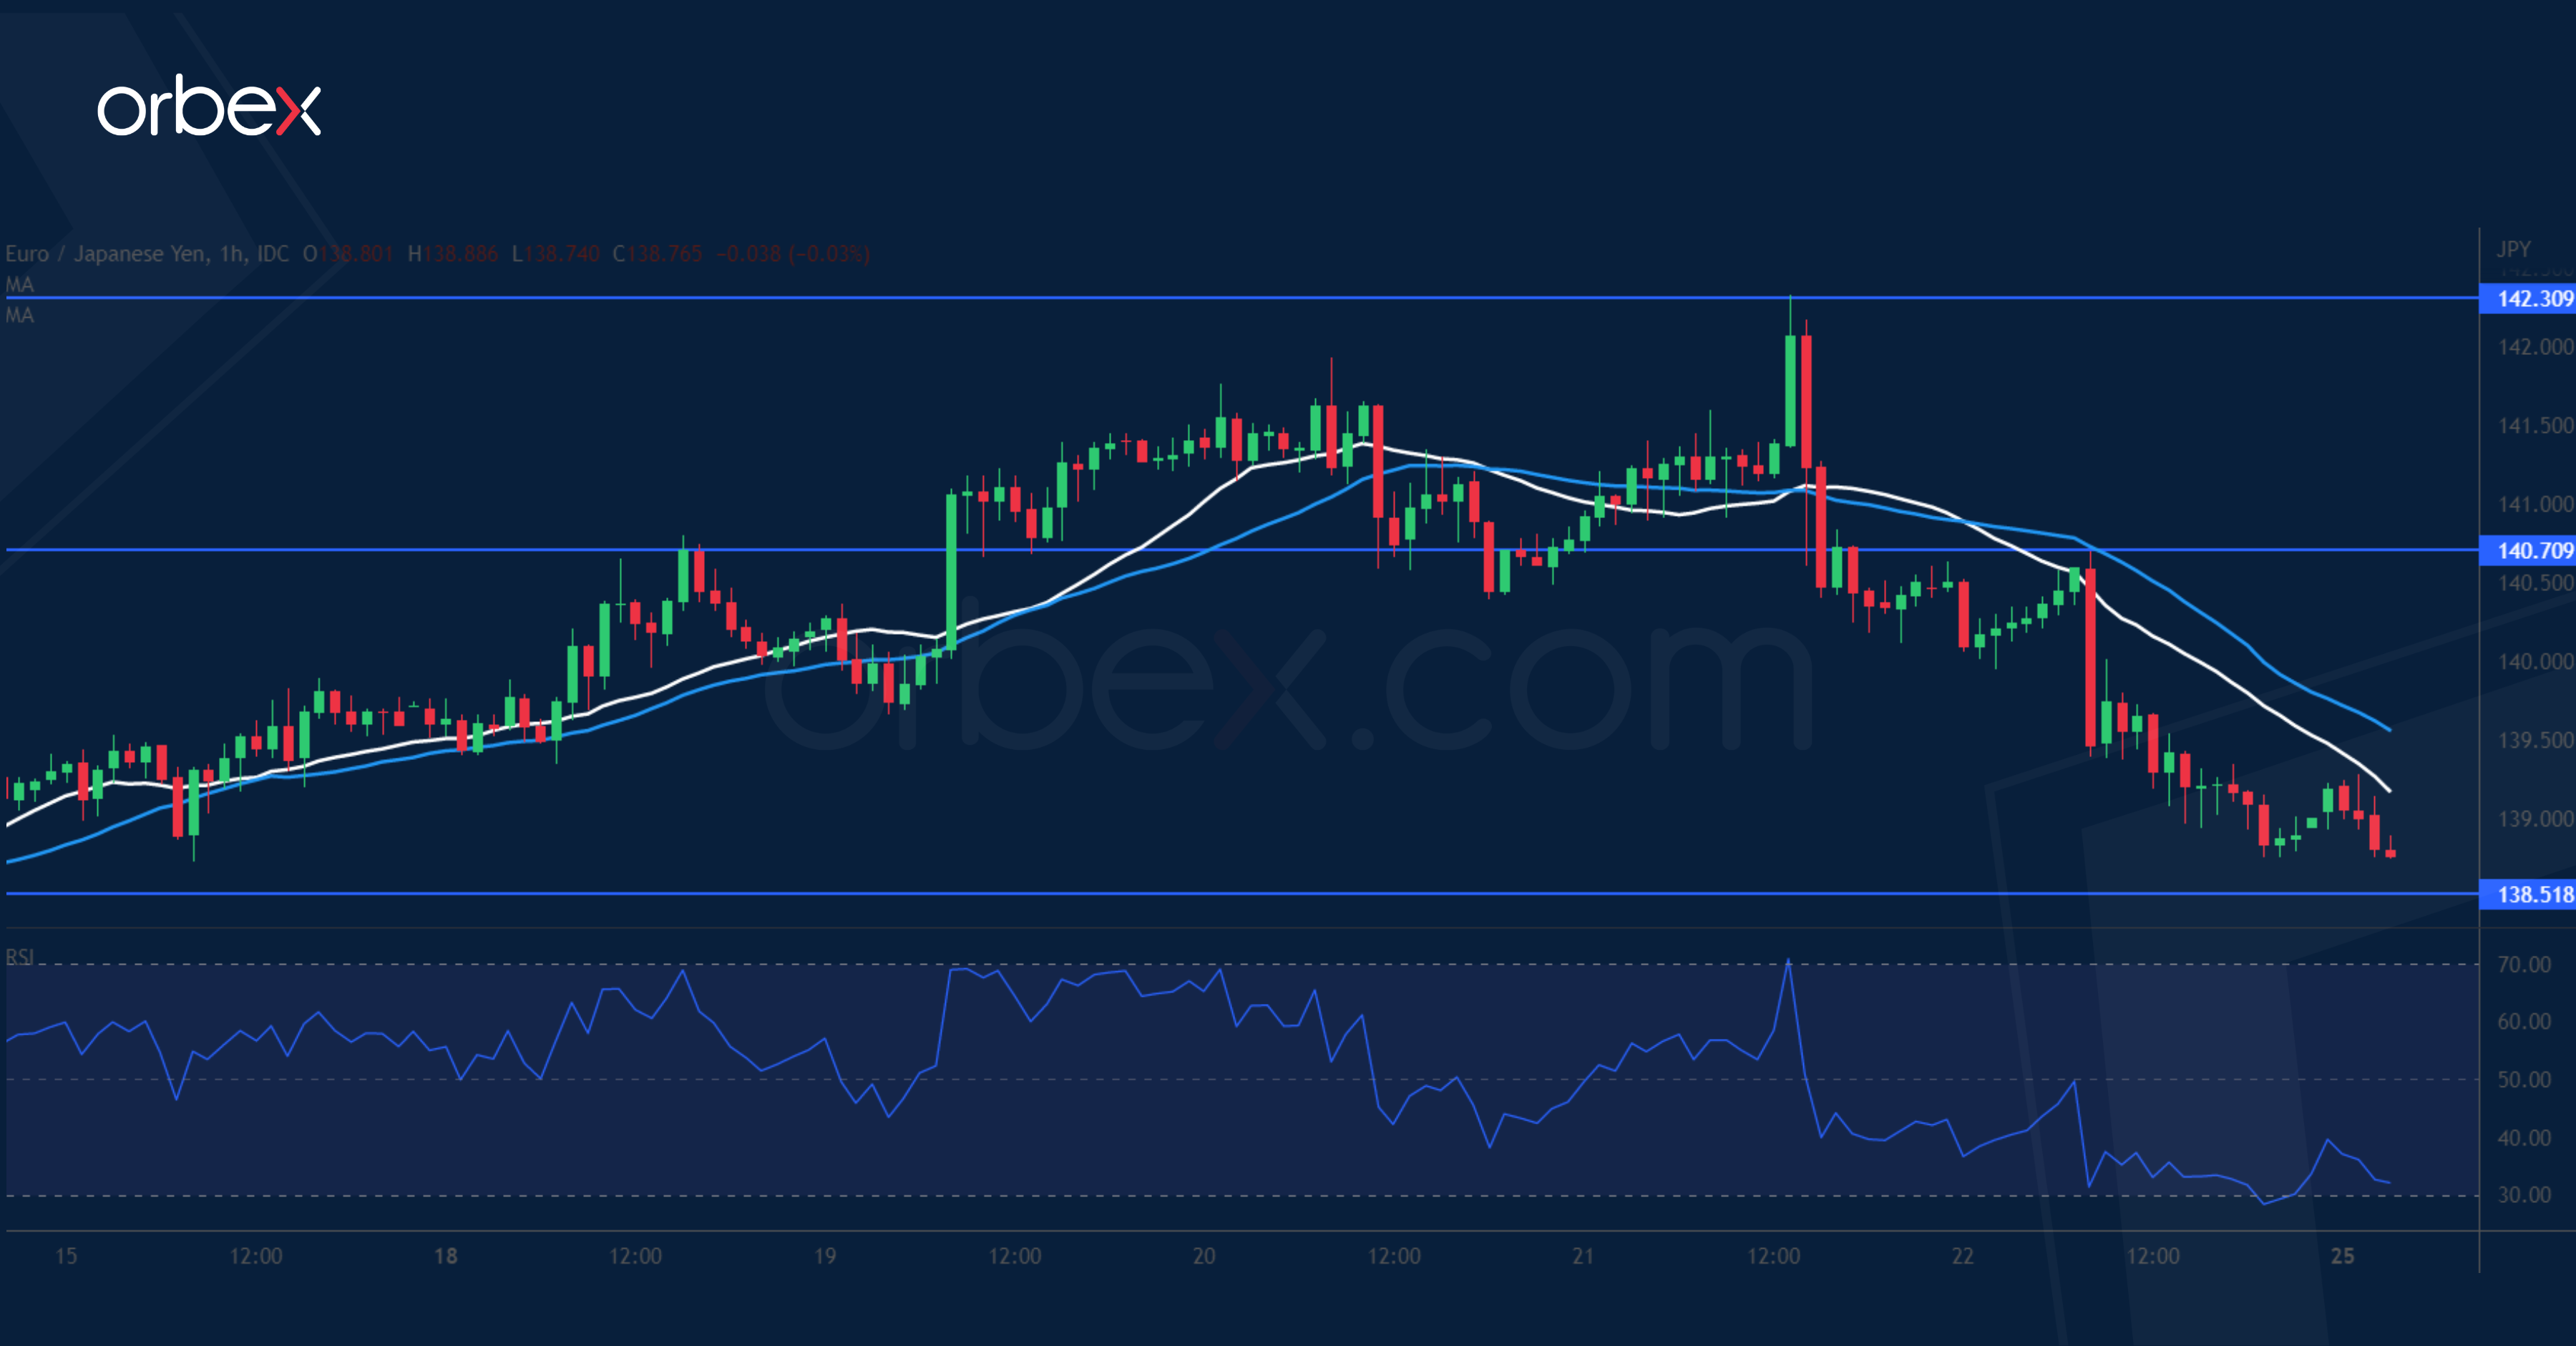
The euro softened after manufacturing and service activities in the eurozone contracted in July. The pair has met stiff selling pressure at July’s high at 142.30. A break below 140.70 caused a liquidation of leveraged long positions and a bearish MA cross indicates an acceleration to the downside. The former support has turned into resistance. 138.50 at the origin of a bullish breakout is the next support. 137.00 is a critical level from the daily chart and its breach could pave the way for a bearish reversal in the medium-term.
USD/CAD Bounces Off Critical Floor
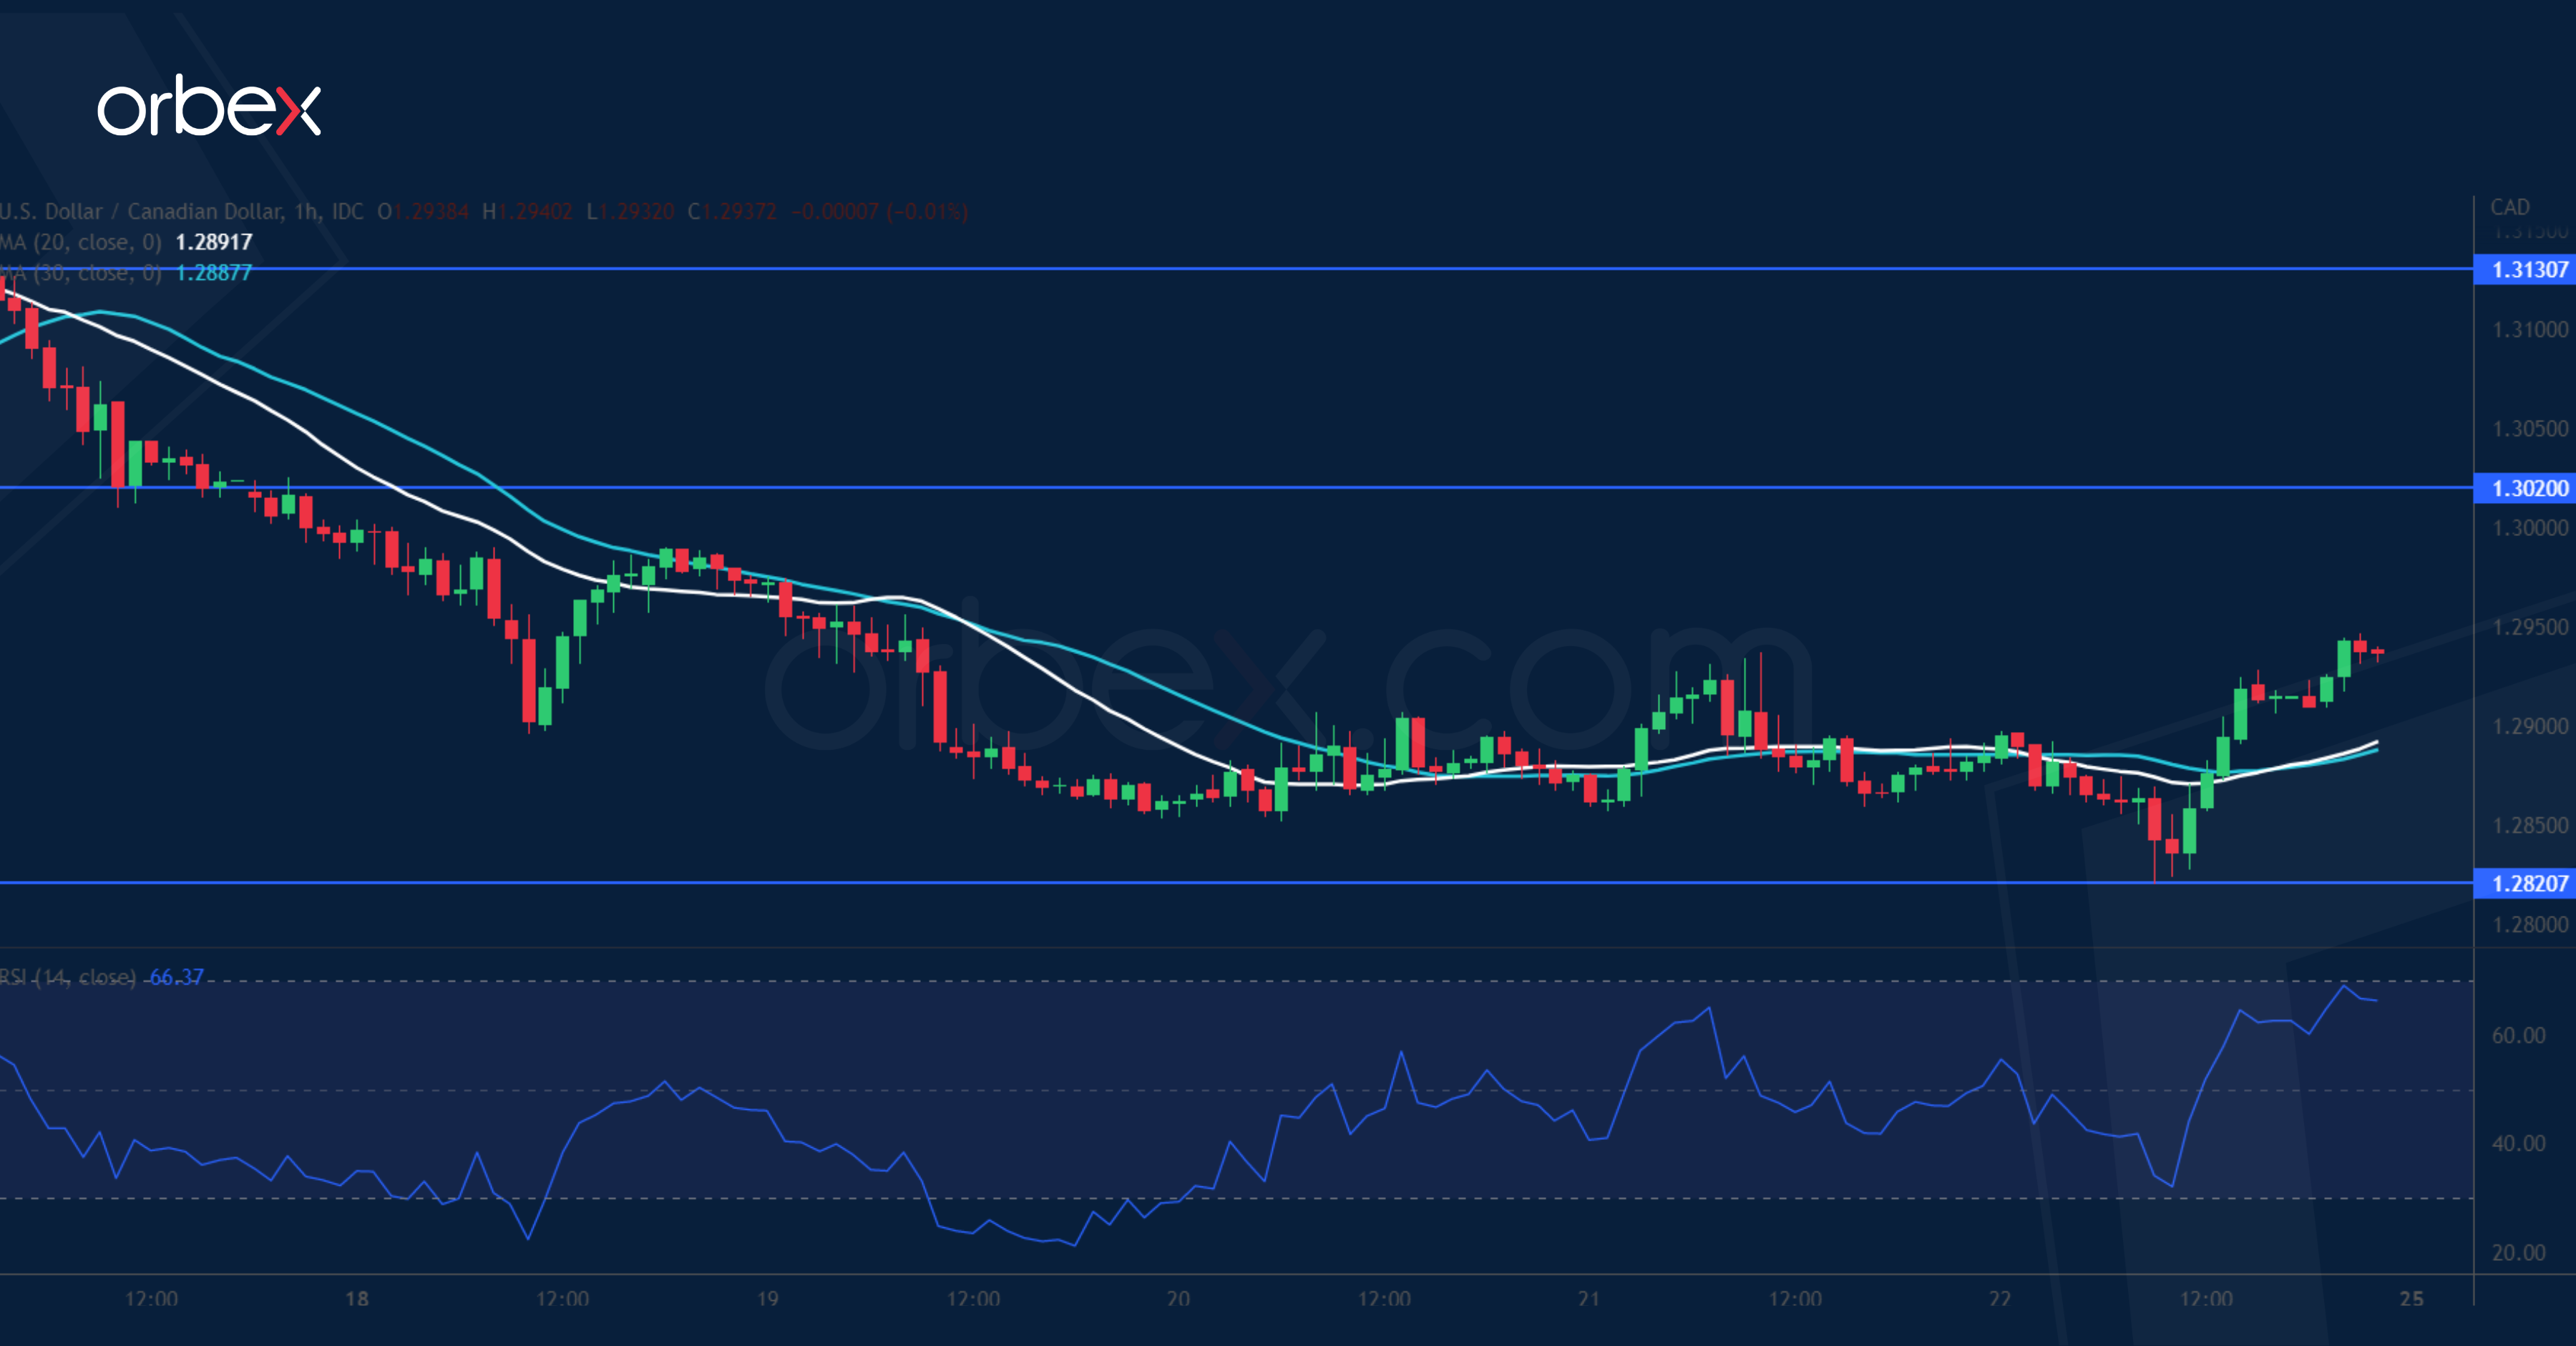
The Canadian dollar retreats dragged by weakness in oil prices, the country’s main export. The pair has been hovering above the daily support at 1.2820. The RSI’s double dip in the oversold area led some traders to buy the dip. A rally above 1.2930 would squeeze the short side. The bulls will need to clear 1.3020 before they could regain control and push back above 1.3130. Failing that, the path of least resistance would be down. A fall below 1.2820 would invalidate the July rally and cause a sell-off towards 1.2700.
EUR/USD Daily Outlook
Daily Pivots: (S1) 1.0146; (P) 1.0201; (R1) 1.0271; More...
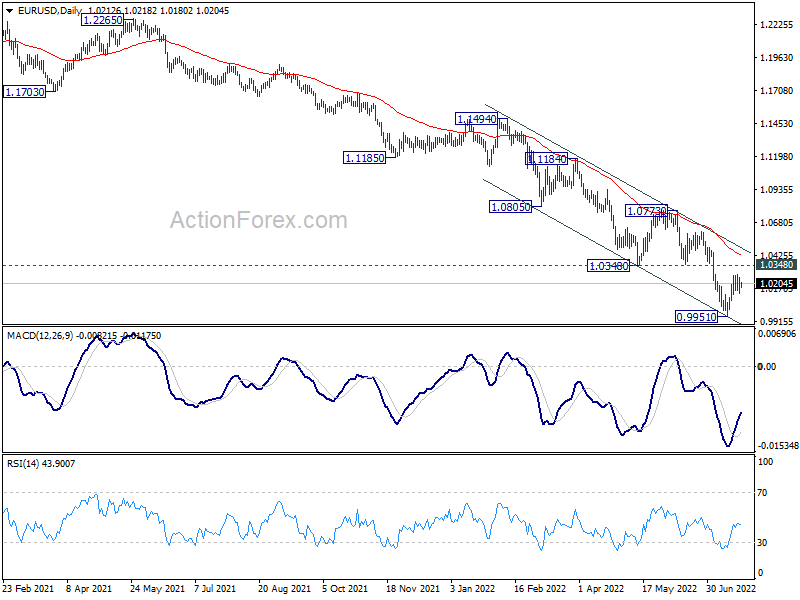
Range trading continues in EUR/USD and intraday bias remains neutral. Further rise is in favor this week as long as 1.0118 minor support holds. Above 1.0277 minor resistance will target 1.0348 support turned resistance. Sustained break there will bring stronger rebound back to channel resistance (now at 1.0493). On the downside, below 1.0118 will bring retest of 0.9951 low instead.
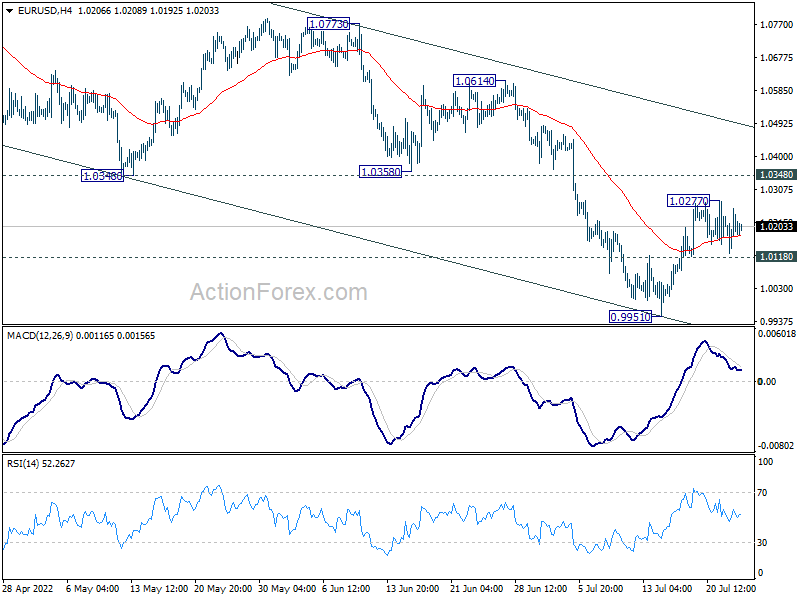
In the bigger picture, down trend from 1.6039 (2008 high) is still in progress. Next target is 100% projection of 1.3993 to 1.0339 from 1.2348 at 0.8694. In any case, outlook will stay bearish as long as 1.0773 resistance holds, in case of strong rebound.
GBP/USD Daily Outlook
Daily Pivots: (S1) 1.1929; (P) 1.1996; (R1) 1.2076; More...
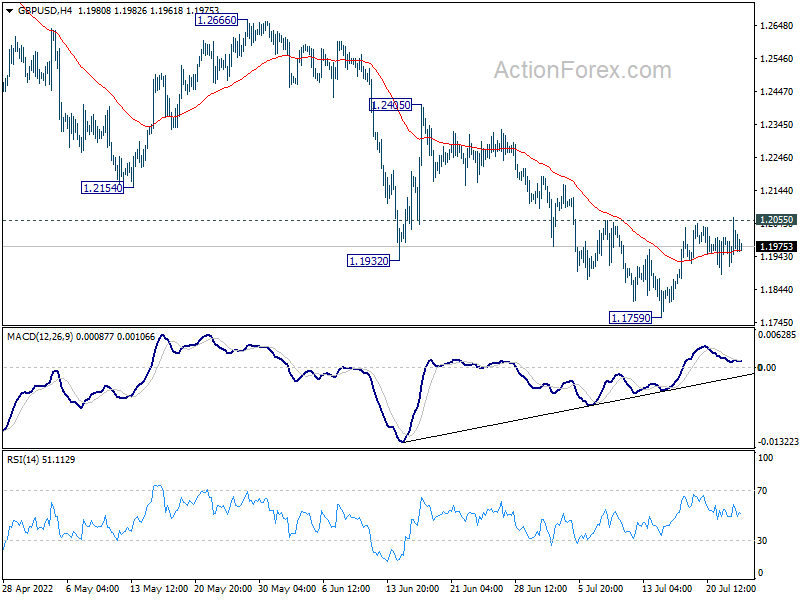
Intraday bias in GBP/USD remains neutral for the moment. On the upside, firm break of 1.2055 minor resistance will confirm short term bottoming at 1.1759. Bias will be turned back to the upside for 1.2405 resistance next. On the downside, break of 1.1759 will resume larger down trend.
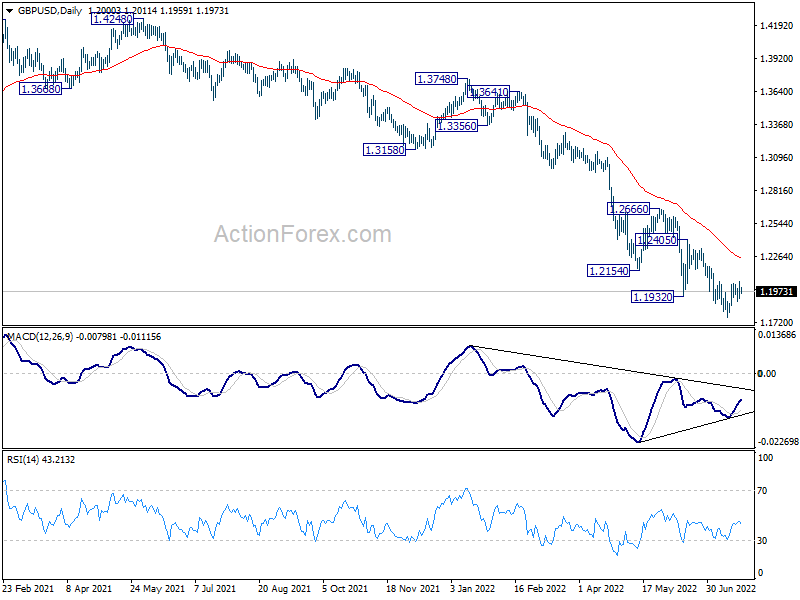
In the bigger picture, fall from 1.4248 (2018 high) could be a leg inside the pattern from 1.1409 (2020 low), or resuming the longer term down trend. Deeper decline is expected as long as 1.2666 resistance holds. Next target is 1.1409 low. However, firm break of 1.2666 will bring stronger rise back to 55 week EMA (now at 1.2986).
USD/CHF Daily Outlook
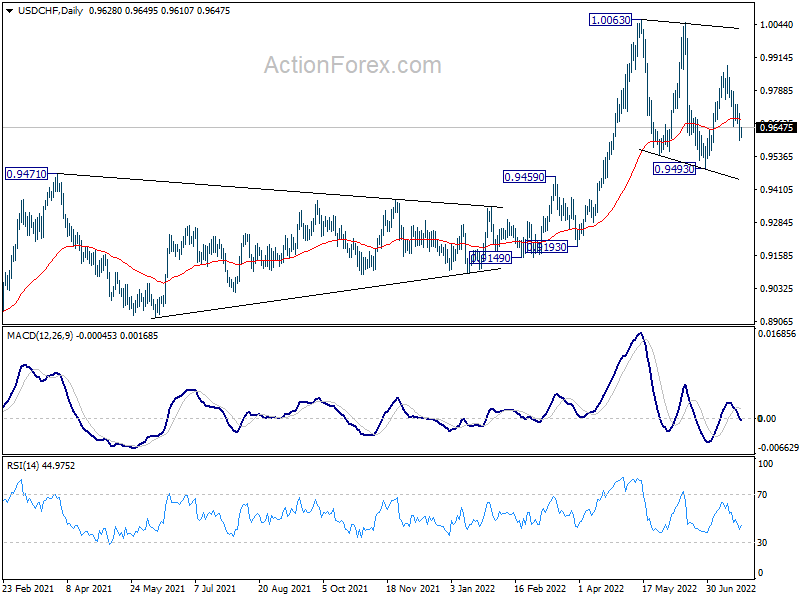
Daily Pivots: (S1) 0.9575; (P) 0.9640; (R1) 0.9679; More...
Intraday bias in USD/CHF remains on the downside. Fall from 0.9884 is seen as a falling leg of the consolidation from 1.0063. Deeper decline would be seen to 0.9493 support. On the upside, though, above 0.9738 minor resistance will turn bias back to the upside for 0.9884 resistance.
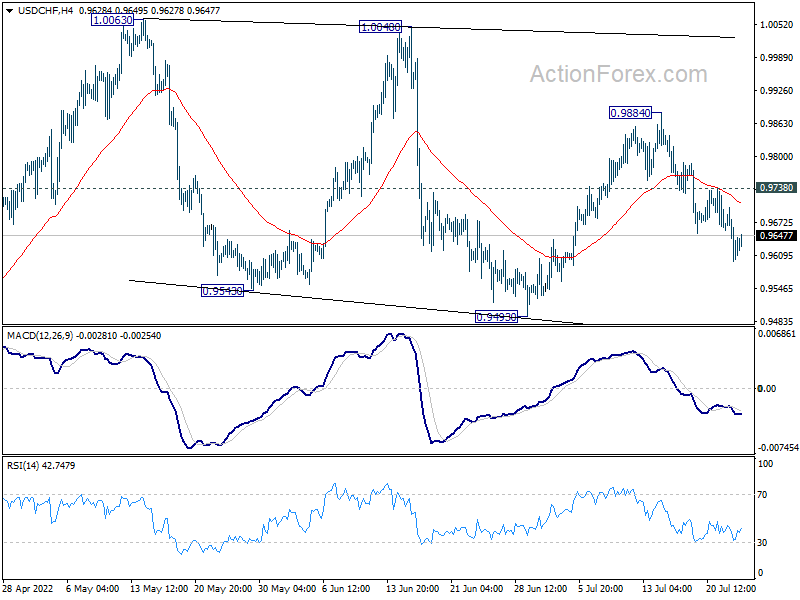
In the bigger picture, medium term up trend from 0.8756 (2021 low) is still in progress. On resumption, next target is 1.0342 (2016 high). Sustained break there will resume long term up trend from 0.7065 (2011 low). This will remain the favored case as long as 0.9471 resistance turned support holds.
USD/JPY Daily Outlook
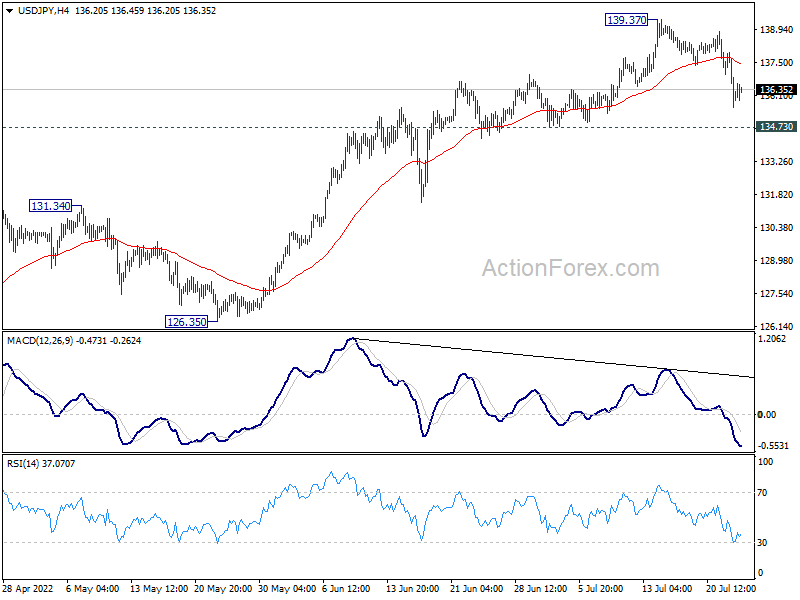
Daily Pivots: (S1) 135.11; (P) 136.54; (R1) 137.50; More...
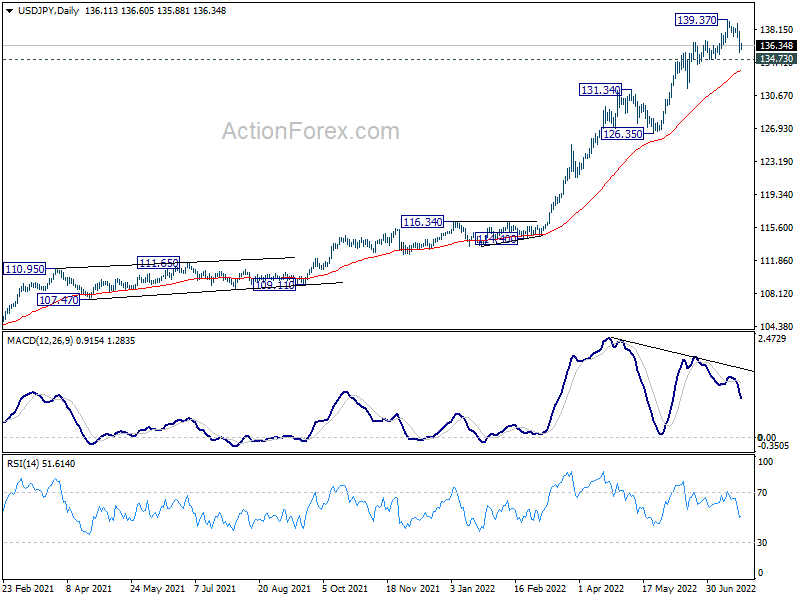
Intraday bias in USD/JPY remains neutral for the moment. On the downside, firm break of 134.73 will confirm short term topping, on bearish divergence condition in 4 hour and daily MACD. Deeper fall would be seen through 55 day EMA to 126.35/131.34 support zone. On the upside, break of 139.37 will resume larger up trend.
In the bigger picture, current rally is seen as part of the long term up trend from 75.56 (2011 low). Next target is 100% projection of 75.56 (2011 low) to 125.85 (2015 high) from 98.97 at 149.26, which is close to 147.68 (1998 high). This will remain the favored case as long as 126.35 support holds.
AUD/USD Daily Report
Daily Pivots: (S1) 0.6886; (P) 0.6932; (R1) 0.6970; More...
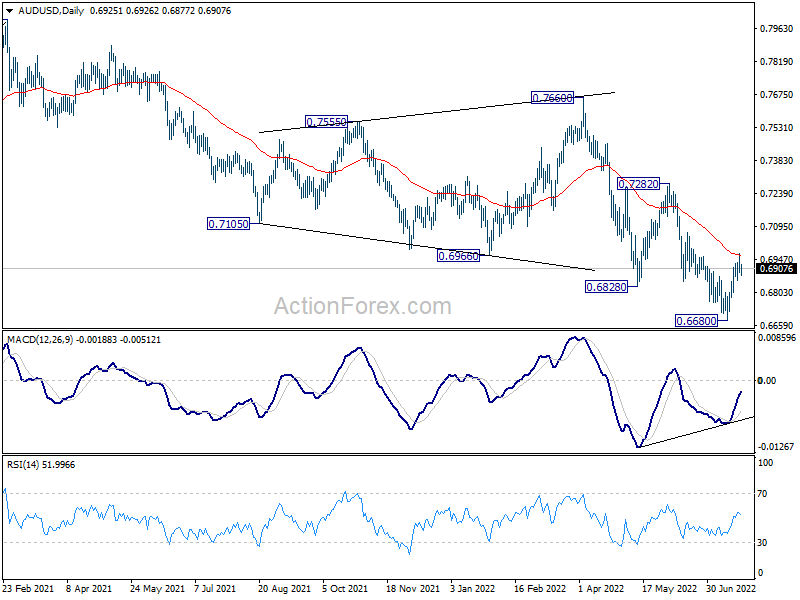
Intraday bias in AUD/USD is neutral with current retreat. Further rise is mildly in favor as long as 0.6858 minor support holds. Sustained trading above 55 day EMA (now at 0.6967) will pave the way to 0.7282 resistance next. Nevertheless, break of 0.6858 will turn bias back to the downside for retesting 0.6680 low.
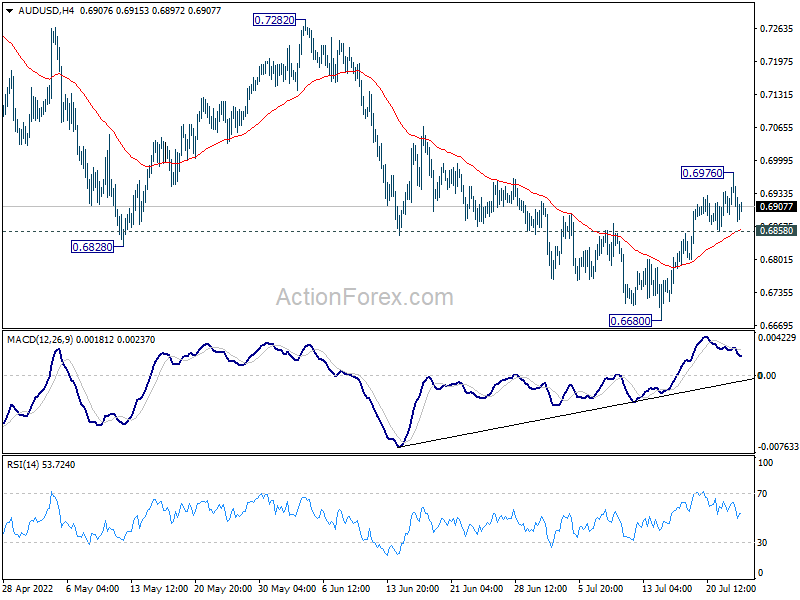
In the bigger picture, price actions from 0.8006 (2021 high) could still be a corrective pattern to rise from 0.5506 (2020 low). But current downside acceleration, as seen in weekly MACD), is raising the chance that it's a bearish impulsive move. In either case, outlook will remain bearish as long as 0.7282 resistance holds. Next target is 61.8% retracement of 0.5506 to 0.8006 at 0.6461.
FOMC Week Finally
This month has dragged on and seems to be lasting forever. One reason could be that it is my last full month as a keyboard warrior, toiling as the voice of reason as I try to make sense of the nonsense in the financial markets. The second, and more likely, is that the US FOMC policy meetings falls at the end of the month, instead of its usual mid-month slot. But as the last week of July arrives, so does the FOMC policy meeting, with the results due out in the early hours of Thursday morning Singapore time. For what its worth, I am in Team Taylor, and going for 75 basis points, with 100 being a bridge to far.
Last Friday’s price action may have softened the ardour of the 100 basis point hikes on the committee as well. Equity markets finished sharply lower, ostensibly because of soft social media earnings, but given Wall Street’s schizophrenic nature of late, it was just as likely to be recession fears, booking some short-term profits, and cutting exposure ahead of the weekend and any potential risks that emerged over it. Currency markets had a noisy day but finished not far from unchanged across the DM and EM space, so I don’t think Friday’s equity sell-off was a structural move.
Friday’s S&P Global Manufacturing and Services PMIs for Europe and the US were disappointing to say the least, coming in softer across the board. Eurozone bond yields moved sharply lower as the market falls over itself to price in a recession there. Even Italian BTPs rallied. That seems to have flowed into the US bond market as well, with the US yield also moving sharply lower across the 5 to 30-year tenors, and even 2-years closed under 3.0%. The R-word remains on everyone’s lips. Even gold managed to string two consecutive positive days together, while oil markets were broadly unchanged.
Agricultural commodities fell on Friday after Russia and Ukraine signed a Turkey-brokered deal to allow Ukrainian grain exports to resume from Black Sea ports such as Odessa. Naturally, Russia decided to rain cruise missiles down on Odessa over the weekend, including one that hit a grain silo. That has seen wheat futures rise by 2.0% this morning and has led to some US Dollar strength and extended the risk-off tone to equity markets. Various news outlets are also running a story about China’s increasingly strident warnings behind the scenes to US officials around Nancy Pelosi’s intended visit to Taiwan sometime in the next few weeks.
This week features a raft of heavyweight US second-quarter earnings from tech heavyweights, which could drive volatility on stock markets in addition to the FOMC. Alphabet and Microsoft announce tomorrow, Meta on Wednesday, perhaps the highest risk one looking at the ad-strewn content-light wasteland of my Facebook and Instagram feed. Apple announces after the bell on Thursday evening NYT. Falling across the FOMC, we could be in for some tasty volatility around the mid-week hump.
Alongside the FOMC, we have the German Ifo this afternoon, US Durable Goods Wednesday, German Inflation and US GDP on Thursday, and German, French, Italian, Spanish and Eurozone GDPs Thursday, and then Eurozone Inflation prints and US Personal Consumption and Expenditure data and the Chicago PMI on Friday. Slap in some China property and Taiwan risk, Eastern Europe risk, and the US President who has covid, and good luck picking the bones out of this week. It’s the show with everything but Yul Brunner. I’ll be in Bali next week for four days, and mightily glad I am, watching the dust settle from the distance.
Closer to home, we see Singapore Core Inflation for June (4.20% exp. YoY), and Headline Inflation (6.20% exp YoY), released at 1300 SGT today. Having already made an unscheduled monetary tightening this month, higher than expected inflation data this afternoon will lock-and-load the Monetary Authority of Singapore to tighten again at their scheduled October meeting. I am in Singapore this week, and although COE’s have hit record high prices in July, I am still seeing a lot of brand new Mercedes and Range Rovers being driven around. I also paid just over seven dollars for a quite small, but pleasing, hipster latte in Singapore this morning. My feeling is that inflation will come in on the high side this afternoon, which may give local equities some headwinds this week, while supporting the Singapore Dollar.
On a similar note, Australia releases its Q2 CPI on Wednesday, and we can expect volatility over the number as the street uses it to reprice the trajectory of the Reserve Bank of Australia tightening cycle. The Australian Dollar’s value is a function of international investors macro outlook for the world economy, risk-on/risk-off for those of us in pilot fish part of the financial markets. A high CPI print could also be a headwind for Australian equities though, although they have been mostly content to follow Wall Street like a doting puppy of late.
It is a slow week for China data, with just Industrial Profits on Wednesday. However, we do see official PMIs released this weekend on Sunday, and the Caixin PMI next Monday. The focus is likely to remain on China’s covid-19 trajectory and the China property market woes. Evergrande is approaching an end-of-month deadline around debt restructuring, and if no progress is made, this could start grabbing more headlines as the week advances.
The bear market rally in equities faces more than a few hurdles this week as outlined above. Currency markets technical picture look a bit clearer and the US Dollar correction lower would appear to still have legs. There are rising and falling wedge breakouts everywhere. The dollar index is testing the base of its rising wedge, USD/JPY has broken lower out of its, GBP/USD, AUD/USD and NZD/USD have all broken higher out of falling wedges. USD/JPY has the potential to be the most emotional, especially if the evolution of the week sees US yields move sharply lower again. Long USD/JPY is a very crowded trade, and a thinning of the herd is long overdue.
One could also argue that both Bitcoin and gold are trying to form bases as well, but let’s not get too far ahead of ourselves, they remain the ugliest horses in the glue factory. However this week plays out, I suspect today will be the most sedate day of the week to come, enjoy the peace and quiet while you can.
Asian equity markets mostly softer
Wall Street unwound some of its gains on Friday, as investors lightened positions ahead of the weekend ahead of heavyweight US earnings this week, and recession nerves. The S&P 500 finished 0.93% lower, the Nasdaq slumped by 1.87%, and the Dow Jones eased by 0.43%. In Asia, US futures are mixed, S&P 500 and Dow futures edging 0.15% lower, with Nasdaq futures gaining 0.15%.
Asian markets have been mostly content to follow Wall Street once again, although without the tail-chasing volatility, and are cautiously lower today. The exception is South Korea’s Kospi, which has moved 0.40% higher today. Elsewhere, Japan’s Nikkei 225 is down 0.80%. News that China is setting up an investment fund to prop up embattled China property developers has had little to no impact on markets today. The Shanghai Composite is down 0.55%, the CSI 300 is 0.65% lower, while the Hang Seng has fallen by 0.85%.
In regional markets, Singapore has gained 0.40%, while Taipei has fallen by 0.20%. Jakarta and Kuala Lumpur unchanged, with Bangkok down 0.25%, and Manila drooping by a hefty 1.30%. Australian markets are slightly softer, the All Ordinaries and ASX 200 have eased 0.10% lower.
European markets finished modestly higher on Friday, but the move lower by Wall Street, and the cruise missile attack on Odessa over the weekend just after the grain export deal was signed, is likely to spook European markets once again. Wall Street has so many variables this week, I am not even going to hazard a guess as to what mode the FOMO gnomes will show up in today.
US Dollar moves higher in Asia
The US Dollar has moved slightly higher in Asia today versus both the DM and Asia FX space, most likely due to the Russian attack on Odessa over the weekend. Friday saw a noisy session, with large intra-day trading ranges versus the major currencies. As the dust settled though, the US Dollar finished only modestly lower.
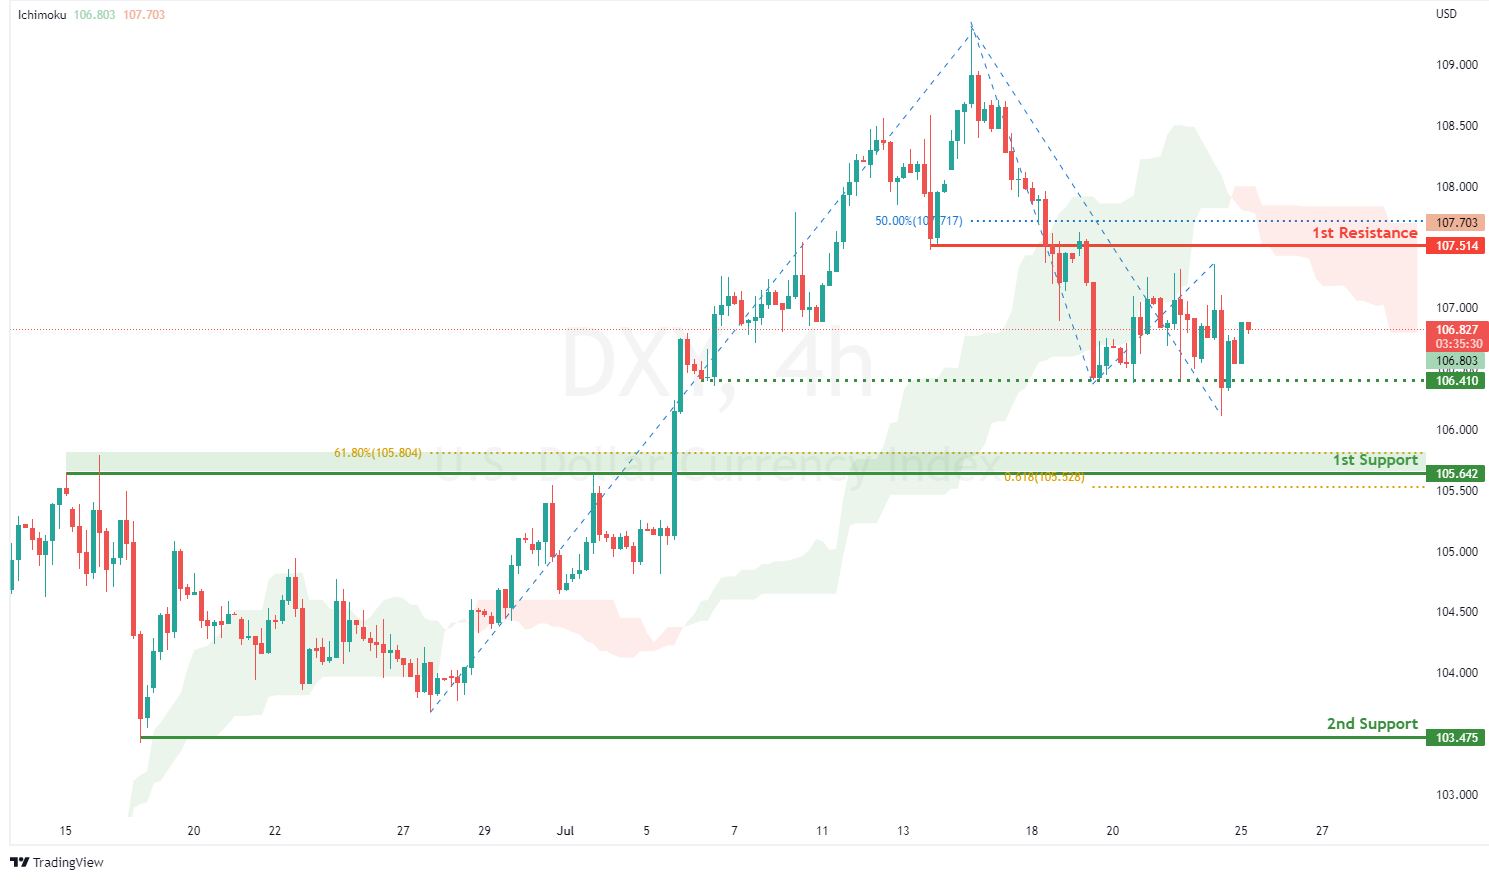
The dollar index was almost unchanged at 106.55 on Friday, edging higher to 108.65 in sedate Asian trading. The bottom of its rising wedge is at 106.30 today, and a sustained failure suggests a much deeper correction to 104.00, and potentially to its 102.50 long-term breakout point. Resistance remains at 107.40 and 108.00.
EUR/USD traded another wide range on Friday, but closed just 0.15% lower at 1.0215, easing to 1.0205 in Asia. It has resistance at 1.0275, which allows for a test of the 1.0360/1.0400 resistance zone. Only a sustained rise above would suggest a longer-term low is in place. EUR/USD has support at 1.0130 and 1.0100.
GBP/USD closed almost unchanged overnight at 1.2010 on Friday, falling to 1.1990 in Asia. GBP/USD has broken out of its falling wedge but need to take our heavyweight resistance around 1.2060 to confirm a low is in place. It has support at 1.1900 and 1.1800, with resistance at 1.2060 and 1.2200.
Lower US yields across the curve saw the Japanese Yen emerge a winner overnight as the US/Japan rate differential narrowed, with the street still long to the eyeballs of USD/JPY. USD/JPY finished 0.92% lower at 136.10 overnight, rising slightly to 136.20 in Asia. Its has broken out of its rising wedge support at 135.50 initially. Initial resistance is distance at 139.00, followed by 139.40. The US/Japan rate differential continues to hold USD/JPY in its thrall, and if US yields move sharply lower this week, the technical picture suggests USD/JPY could fall back to 132.00.
AUD/USD and NZD/USD fell slightly overnight to 0.6925 and 0.6250, easing to 0.6905 and 0.6235 in Asia, likely due to the Russia missile attack on Odessa. Both currencies remain well above their upside breakout points and only a move back below either 0.6700 or 0.6100 changes the bullish technical outlook.
USD/Asia finished almost unchanged on Friday, with the USD between 0.10% and 0.20% versus the THB, TWD, MYR, and CNY today. Both the INR and KRW have strengthened slightly and in USD/IDRs case, it looks like Bank Indonesia is on top at 15,000.00 today. I expect volatility in Asian currencies to increase as the week goes on and we get more inputs from tier-1 data, the US FOMC, and US earnings. Overall, Asian currencies remain under pressure versus the greenback, and I believe we will need to see a sustained move lower by the US 2-year yield to change that dynamic. A hawkish FOMC likely sees selling pressure return to Asia FX.
Oil prices ease in Asia
Brent crude and WTI had another choppy intra-day session on Friday, but like currency markets, closed almost unchanged as the dust settled on the day. Futures markets remain deeply in backwardation, suggesting that in the real world, prompt supplies are as tight as ever, however rising recession fears globally do suggest that gains are likely to be limited in the shorter-term, geopolitics aside. Oil futures biggest problem is that the mind-boggling intra-day volatility seen of late, is likely to reduce risk positioning, and thus, trading liquidity. A negative feedback loop likely to exacerbate prices moves.
Brent crude closed 0.25% lower at $103.60 on Friday, falling by 1.10% to $102.50 a barrel in Asia today. WTI closed 1.45% lower at $95.00 on Friday, losing another 1.0% to $94.05 a barrel in Asia today. Brent crude has well-denoted resistance at $108.00 a barrel on the charts, and then 111.00. It has support at $101.75 and $101.00 a barrel.
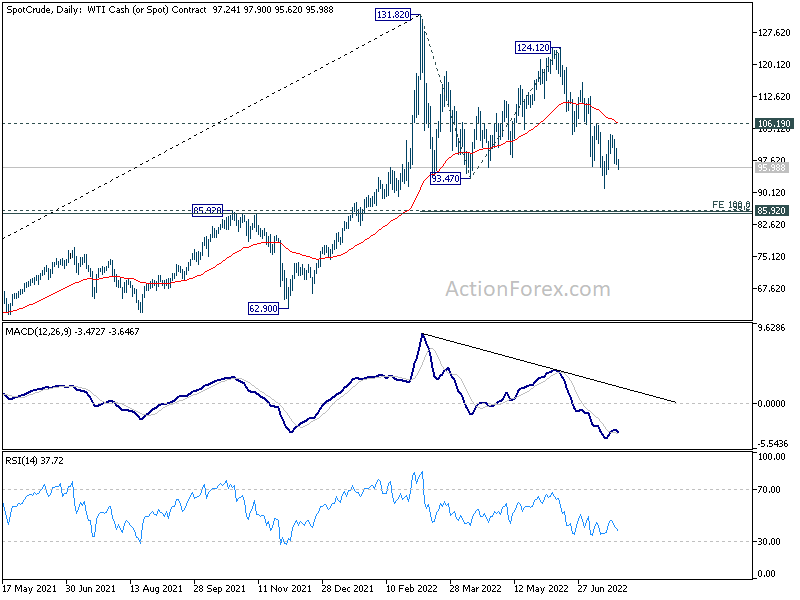
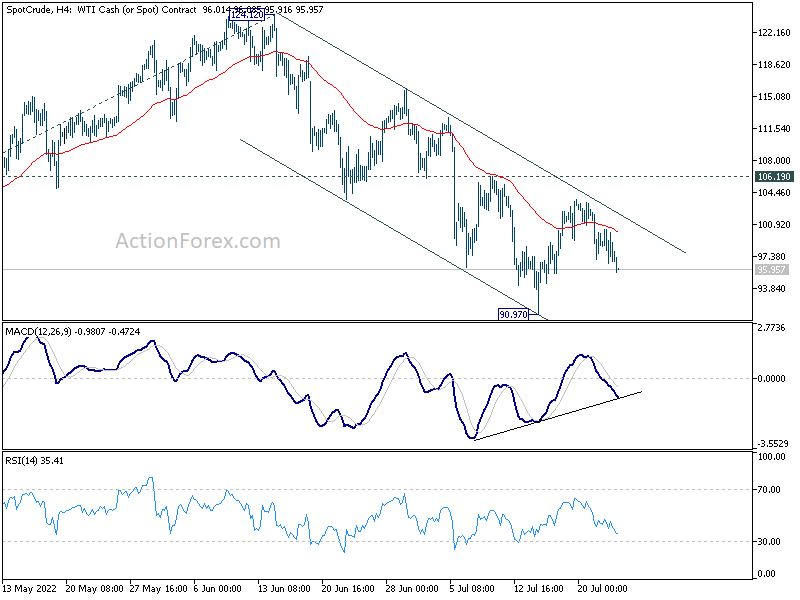
WTI looks the more vulnerable, moving below its 200-day moving average (DMA) at $94.75 today, and taking out support at $94.30 a barrel. traced a double bottom $94.30, its overnight low and its 200-day moving average. (DMA). That now opens a retest of the July lows at $90.60 a barrel. Resistance is distant at $100.00 a barrel.
Brent’s outperformance likely reflects its use as the international benchmark for global trade in oil, where physical supplies remain tight. WTI, on the other hand, is a domestic benchmark meaning that US recession nerves seem to be more heavily weighing on its price. Brent crude continues to hold comfortably above its 200-DMA at $97.65 a barrel, and until that comprehensively breaks, I am not yet pencilling in the demise of high oil prices, although I have long said I believe a medium-term high is in place. The more analysts there were calling for $200 and $300 a barrel crude, the more confident I became.
Gold’s is trying to form a base
Gold closed higher for the second session in a row on Friday, quite the achievement given its woeful performance of late. Gold closed 0.50% higher at $1727.50 an ounce on Friday, edging slightly lower in moribund Asian trading to $1728.75. Two positive sessions do not mean gold is out of the woods, but the technical picture does suggest it is trying to form a base, having bounced of long-term support near $1680.00 an ounce last week. It faces a myriad of data and event risk this week, but the chart does suggest buying the dips toward $1700.00 with a tight stop wouldn’t be the dumbest call of your career.
Gold needs to overcome heavy resistance at the $1745.00 an ounce triple top before the gold bugs can really start to get excited. It has support at $1680.00, and then the longer-term support around $1675.00 an ounce zone. A sustained failure of $1675.00 will signal a much deeper move lower targeting the $1450.00 to $1500.00 an ounce regions.
Technical Outlook and Review
DXY:
On the H4, with prices moving below the ichimoku indicator, we have a bearish bias that prices will drop to the 1st support at 105.642 in line with overlap support, 61.8% fibonacci projection and 61.8% fibonacci retracement. Take note of intermediate support at 106.410 where the overlap support is. Once there is downside confirmation of price breaking 1st support structure, we would expect bearish momentum to carry price to 2nd support at 103.475 in line with swing low support. Alternatively, price could rise to 1st resistance at 107.514 where the pullback resistance and 50% fibonacci retracement are.
Areas of consideration:
- H4 time frame, 1st resistance at 107.514
- H4 time frame, 1st support at 105.642
XAU/USD (GOLD):
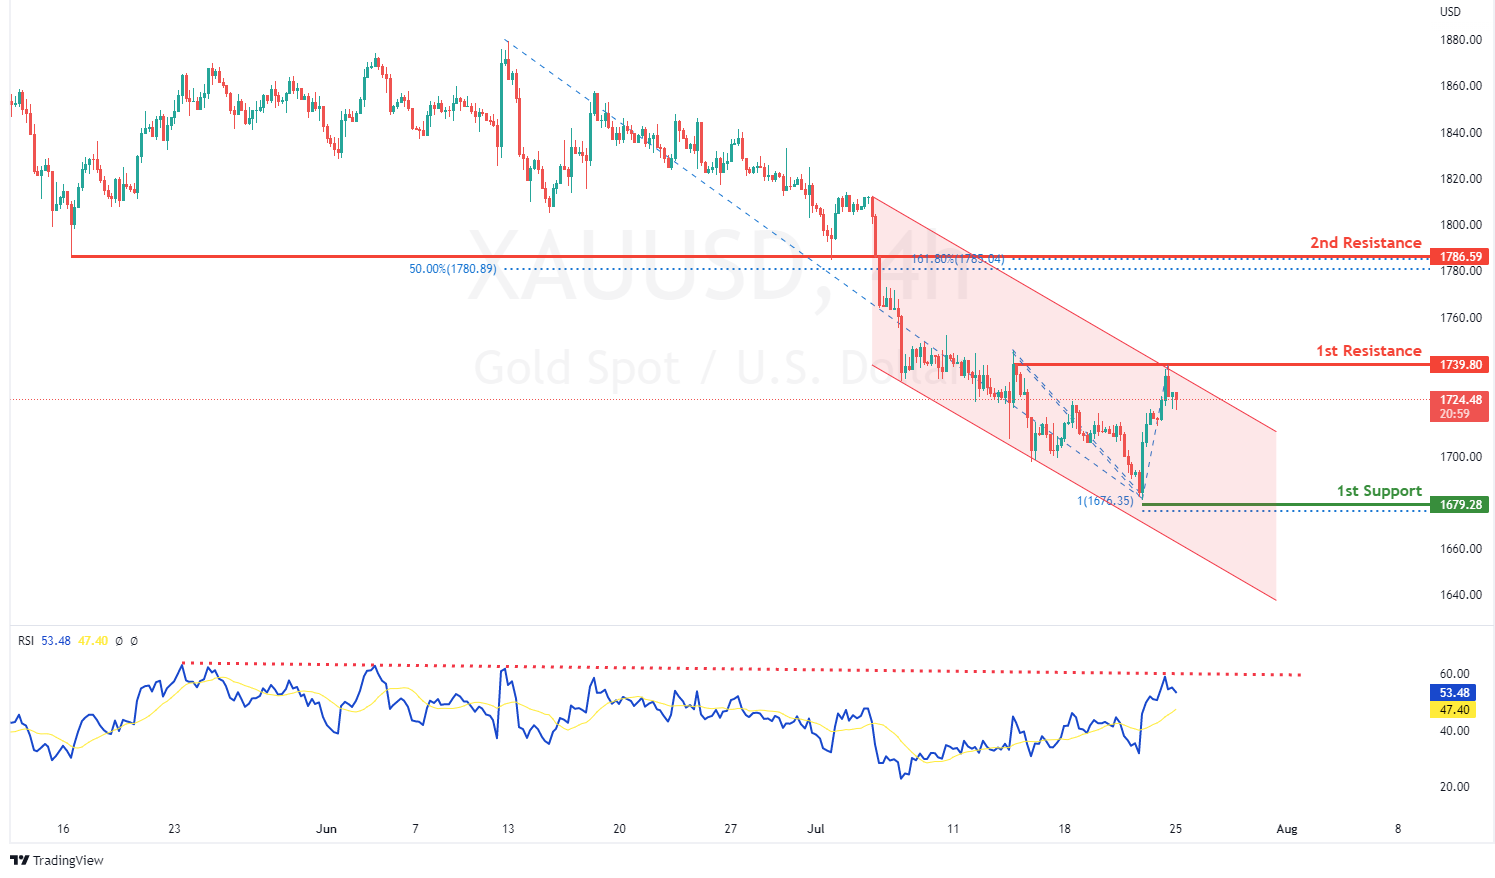
On the H4, with price moving within a descending channel and RSI moving in a descending trendline, we have a bearish bias that price will rise and drop from 1st resistance at 1739.80 where the swing high resistance is to 1st support at 1679.28 in line with 100% fibonacci projection and swing low support on the daily timeframe. Alternatively, price could break 1st resistance and rise to 2nd resistance at 1786.59 where the 50% fibonacci retracement, 161.8% fibonacci extension and pullback resistance are.
Areas of consideration:
- H4 time frame, 1st Resistance at 1739.80
- H4 time frame, 1st Support at 1679.28
GBP/USD:
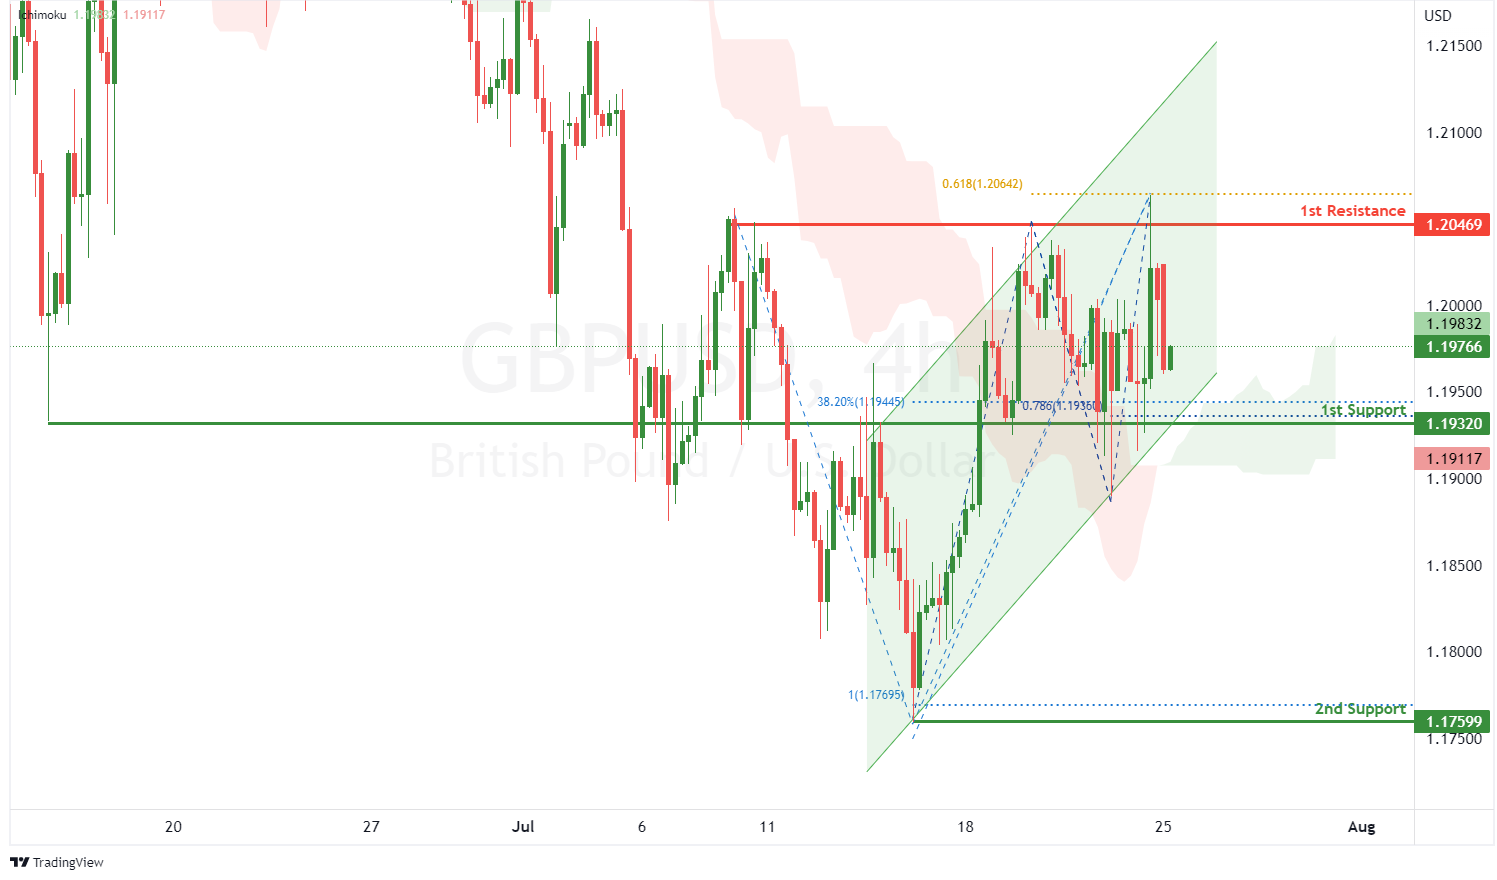
On the H4, with prices moving within an ascending channel and above the ichimoku indicator, we have a bullish bias that price will rise to the 1st resistance at 1.20469 where the swing high resistance and 61.8% fibonacci projection are from the 1st support at 1.19320 where the pullback support, 38.2% fibonacci retracement and 78.6% fibonacci projection are. Alternatively, price could break 1st support and drop to 2nd support at 1.17599 where the swing low support and 100% fibonacci projection are.
Areas of consideration:
- H4 1st resistance at 1.20469
- H4 1st support at 1.19320
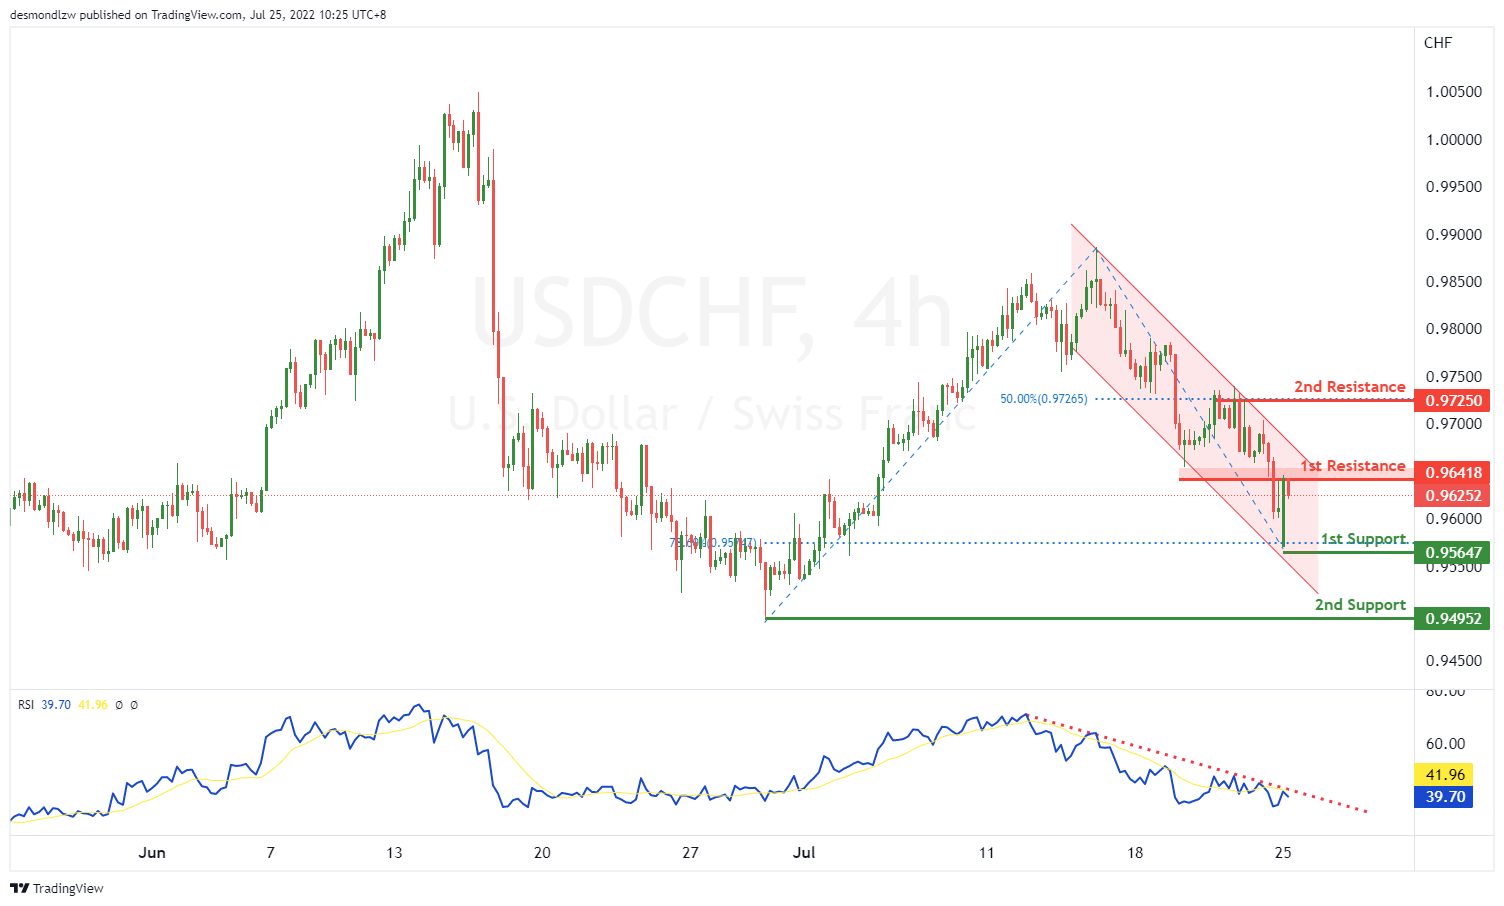
USD/CHF:
On the H4, with price moving along the descending channel, we have a bearish bias that price might drop from our 1st resistance at 0.96407, which is in line with the previous swing low to the 1st support, which is in line with 78.6% fibonacci retracement, if the price keep going down, it may drop to our 2nd support at 0.94952, which is in line with the swing low. Alternatively, price may break 1st resistance and head for 2nd resistance at 0.97250 where the close swing high and 50% fibonacci retracement is.
Areas of consideration
- 1st resistance level at 0.96407
- 1st support level at 0.95647
EUR/USD :
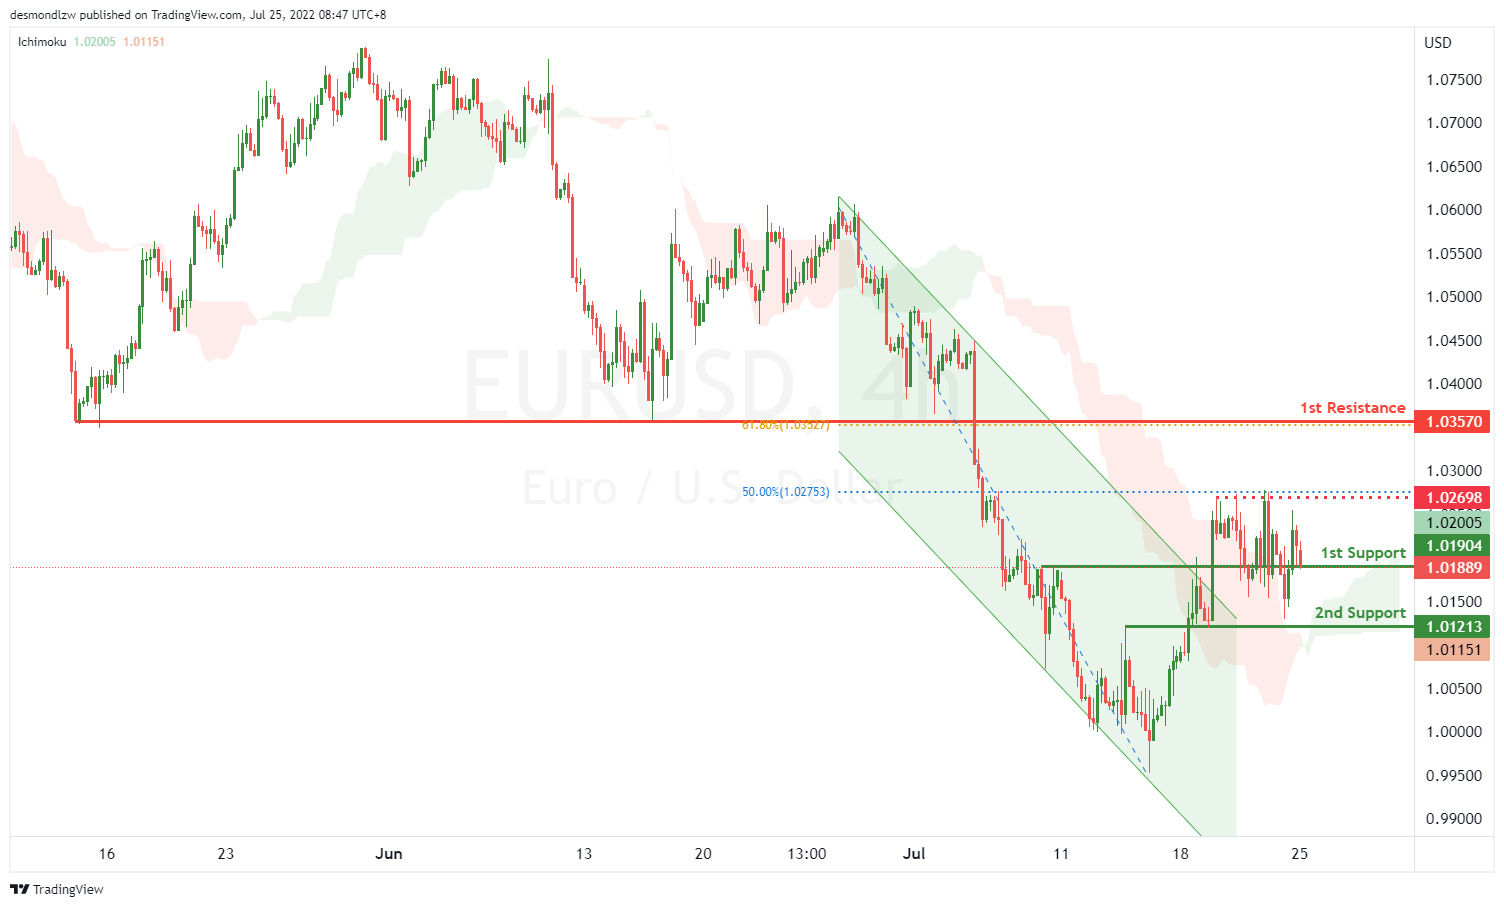
On the H4, with price moving above the ichimoku cloud and breaking out of the descending trend channel, we have a bullish bias that price will continue to rise from the 1st support at 1.01904 at the overlap support. If price breaks above the intermediary resistance at 1.02698 in line with the 50% fibonacci retracement, we have upside confirmation that price will continue to rise to the 1st resistance at 1.03570 at the pullback resistance in line with the 61.8% fibonacci retracement. Alternatively, price may break the support structure at the 1st support and drop to the 2nd support at 1.01213 at the overlap support.
Areas of consideration :
- H4 1st resistance at 1.03570
- H4 1st support at 1.01904
USD/JPY:
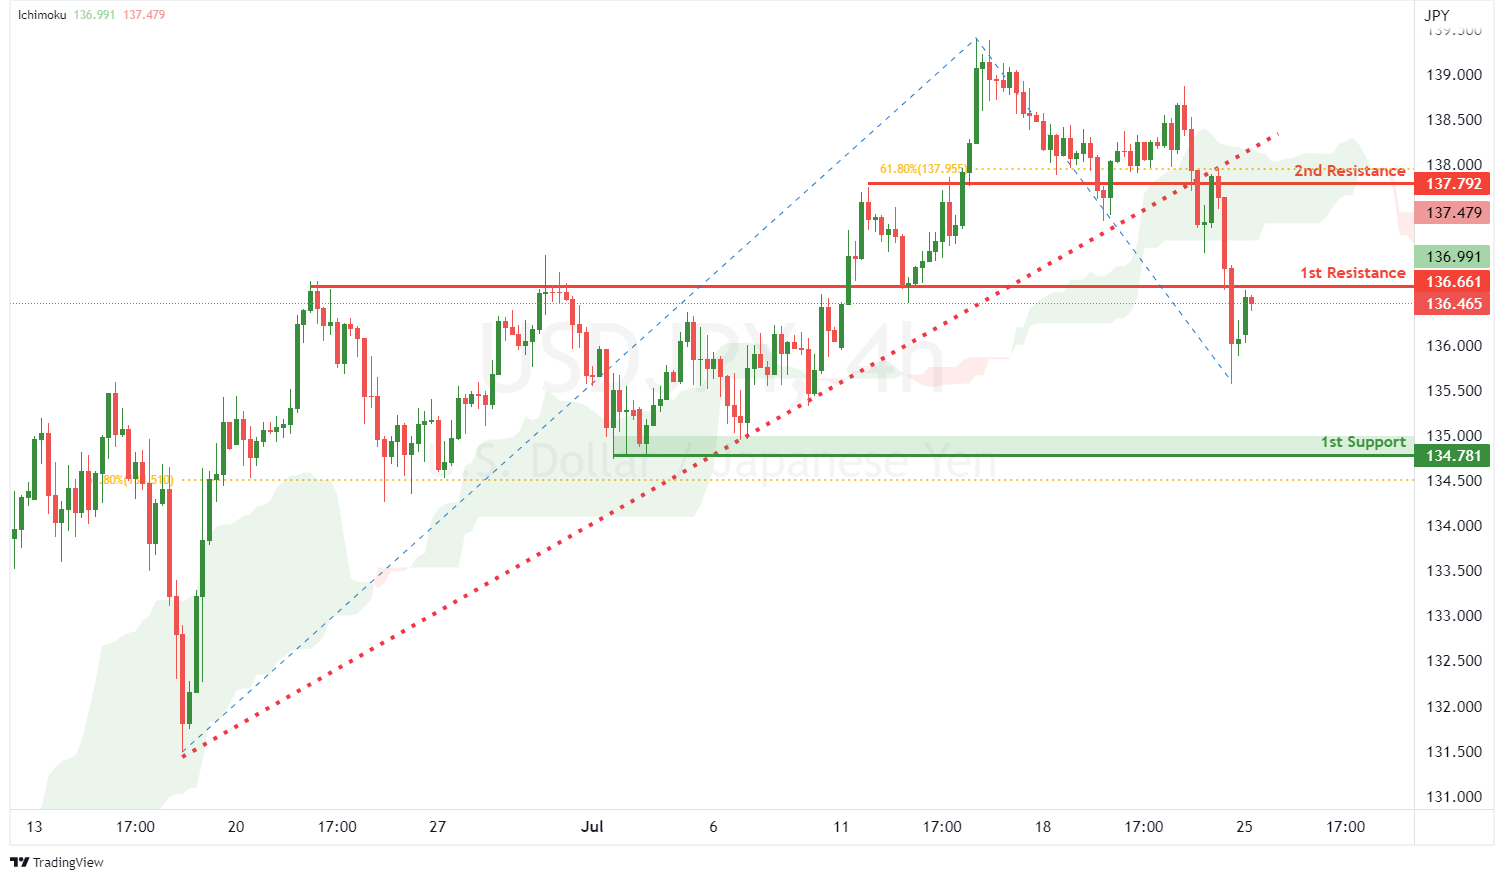
On the H4, with price broken out of the ascending trendline and moving below the ichimoku indicator, we have a bearish bias that price will rise and drop from our 1st resistance at 136.661 where the overlap resistance is to the 1st support at 134.781 where the swing low support and 61.8% fibonacci retracement are. Alternatively, price could break 1st resistance structure and head for 2nd resistance at 137.792 where the pullback resistance and 61.8% fibonacci retracement are.
Areas of consideration:
- H4 time frame, 1st resistance at 136.661
- H4 time frame, 1st support at 134.781
AUD/USD:
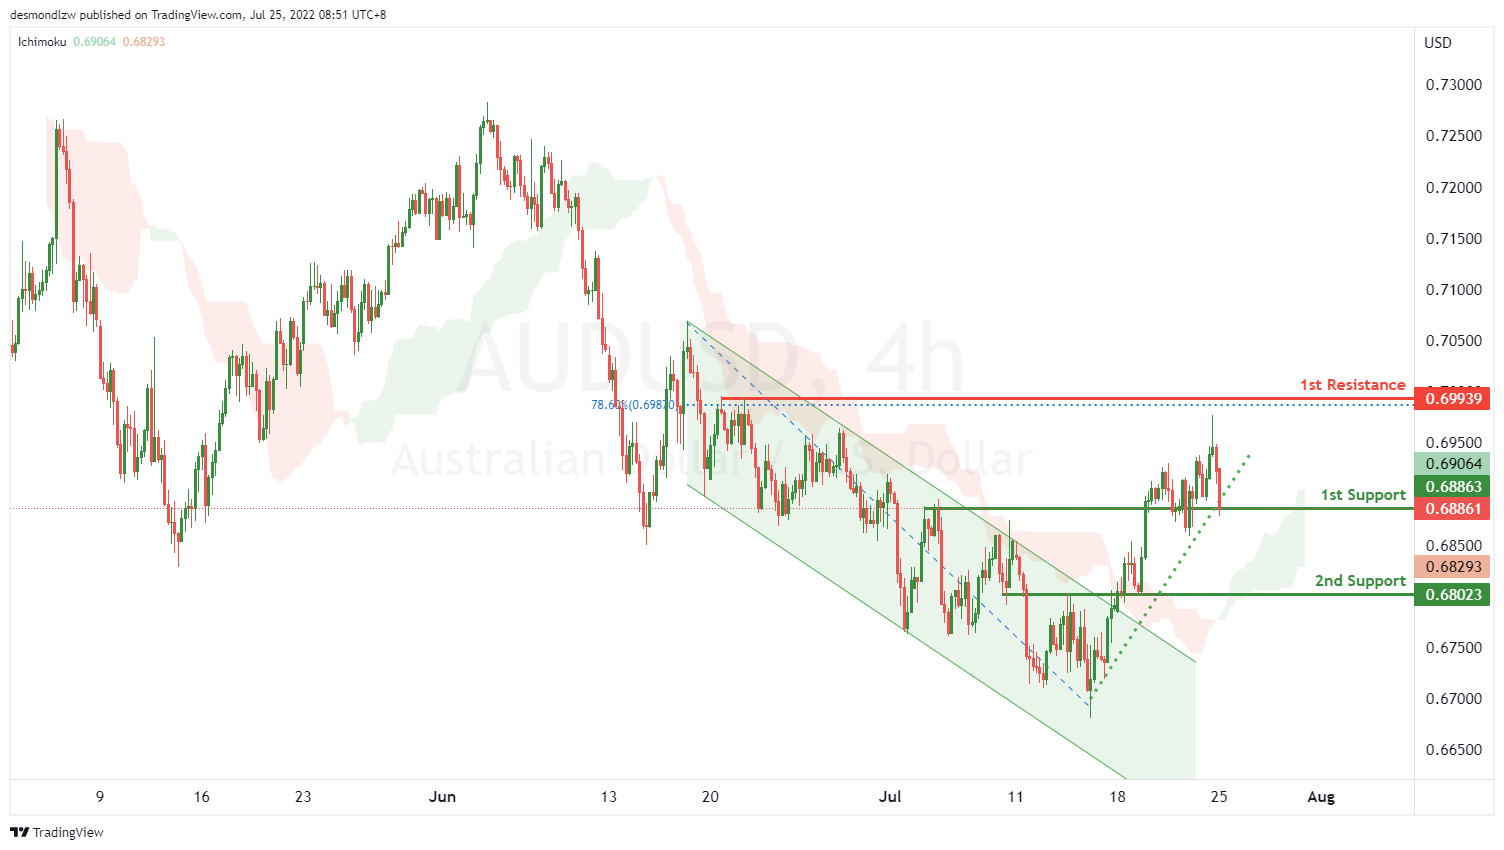
On the H4, with price moving above the ichimoku cloud and breaking out of the descending trend channel and moving in an ascending support, we have a bullish bias that price will rise from the 1st support at 0.68863 at the overlap support to the 1st resistance at 0.69939 at the swing high in line with the 78.6% fibonacci retracement. Alternatively, price may break support at the 1st support and drop to the 2nd support at 0.68023 at the overlap support.
Areas of consideration
- H4 1st resistance at 0.69939
- H4 1st support at 0.68863
NZD/USD:
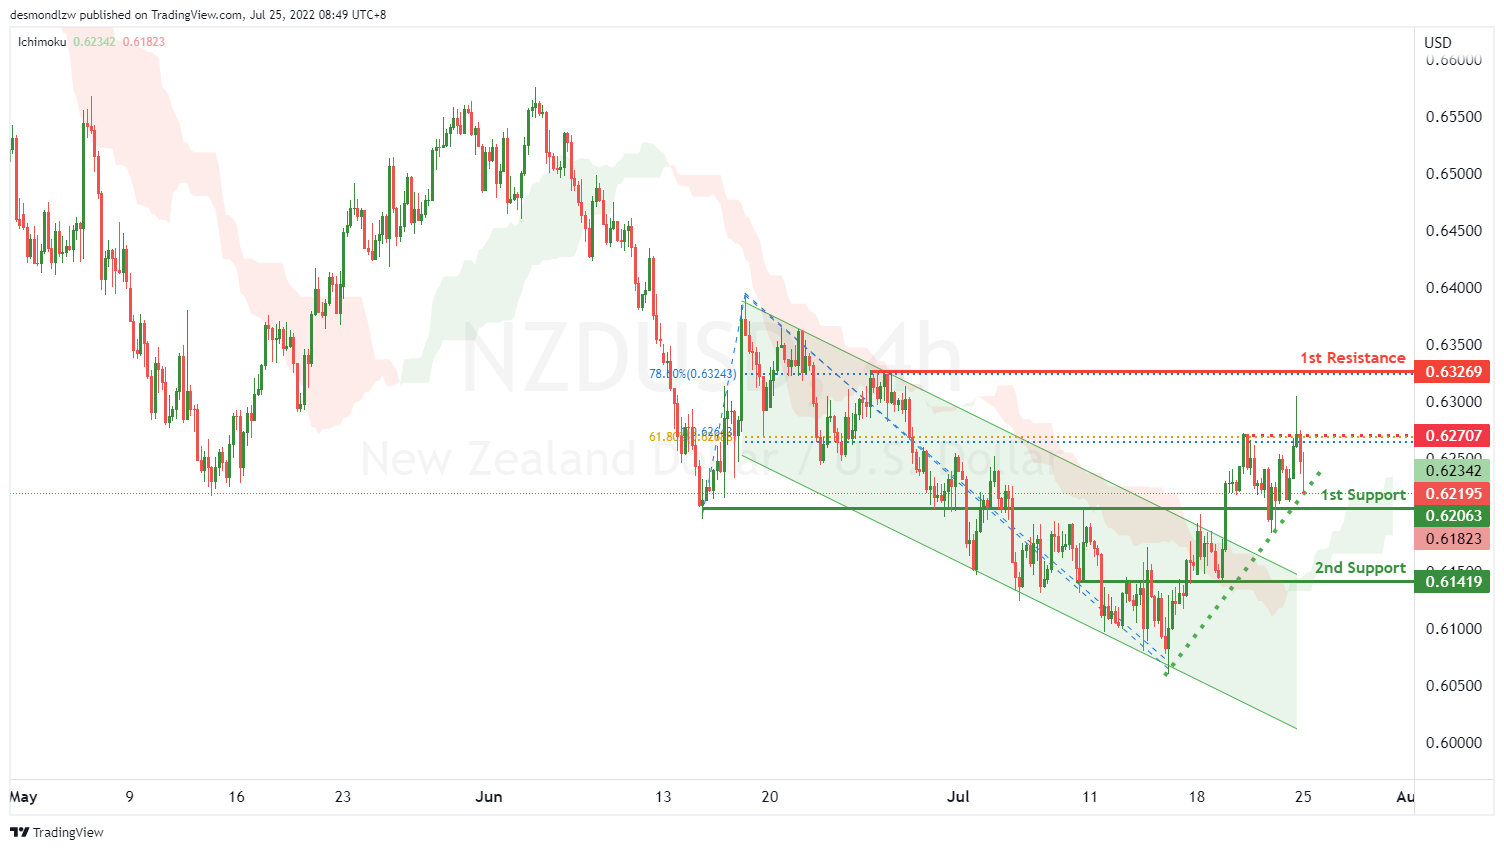
On the H4, with price breaking the descending trend channel, short term ascending support and moving above the ichimoku cloud, we have a bullish bias that price will rise from the 1st support at 0.62177 at the overlap support. If price breaks the intermediary resistance at 0.62707 at the swing high in line with the 61.8% fibonacci retracement and 100% fibonacci projection, we will have upside confirmation that price will rise to the 1st resistance at 0.63269 at the swing high in line with the 78.6% fibonacci retracement. Alternatively, price may break the support structure at the 1st support and drop to the 2nd support at 0.61419 at the pullback support.
Areas of consideration:
- H4 time frame, 1st support at 0.62177
- H4 time frame, 1st resistance at 0.6326
USD/CAD:
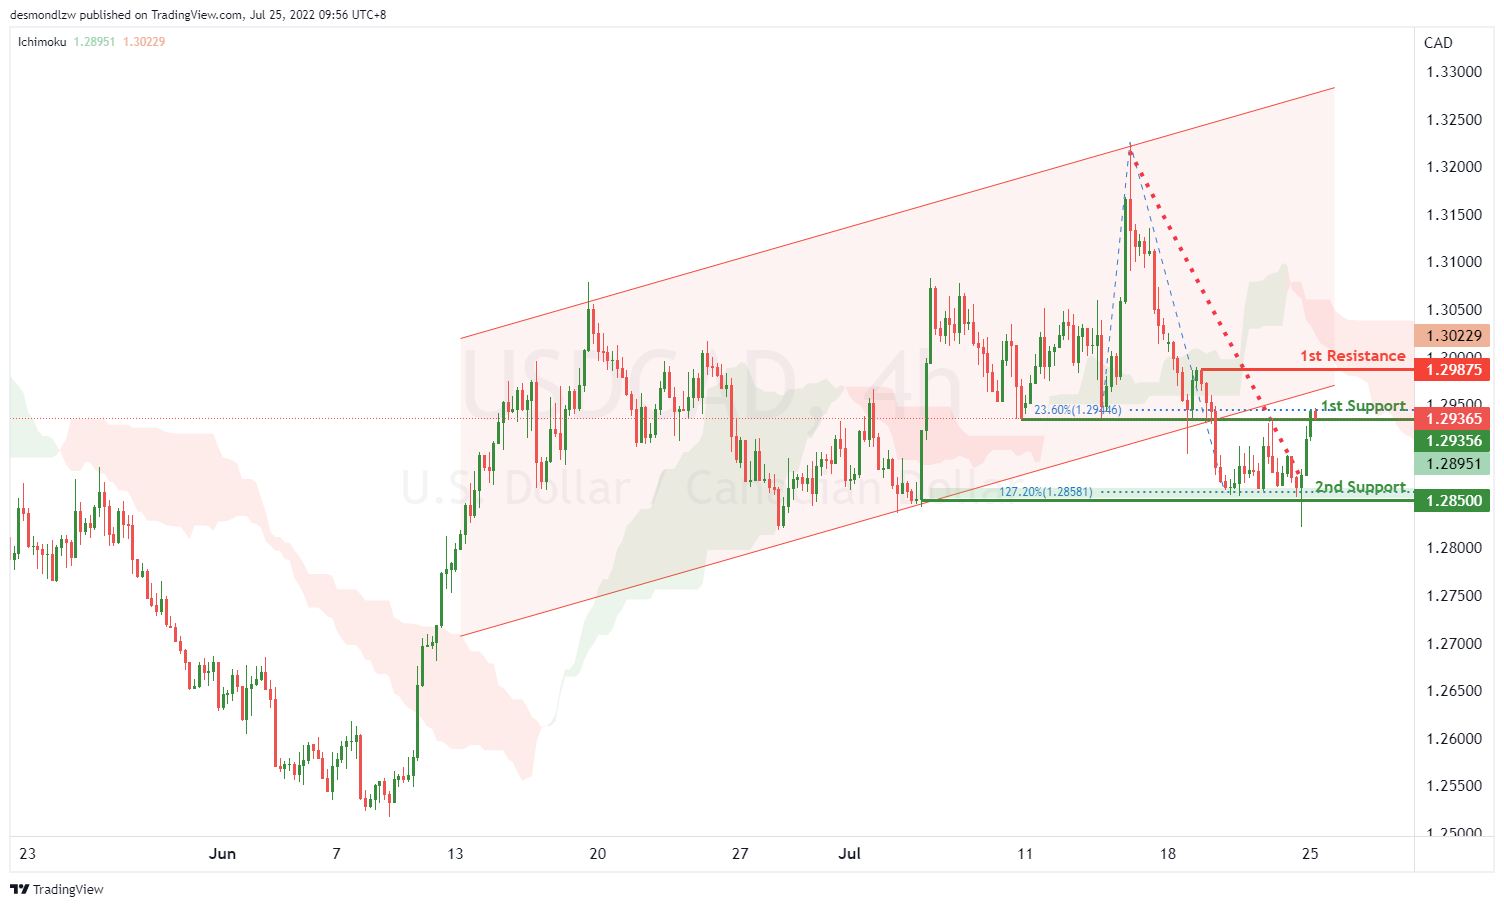
On the H4, with the price breaking the ascending channel, we have a bearish bias that the price may drop from our 1st support at 1.29356, which is in line with 23.6% fibonacci retracement to our 2nd support at 1.28500, which is in line with 127.2% % fibonacci extension. Alternatively, the price may rise to the 1st resistance at 1.29875, which is in line with the close swing high.
Areas of consideration:
- H4 time frame, 1st support at 1.29356
- H4 time frame, 2nd support at 1.28500
OIL:
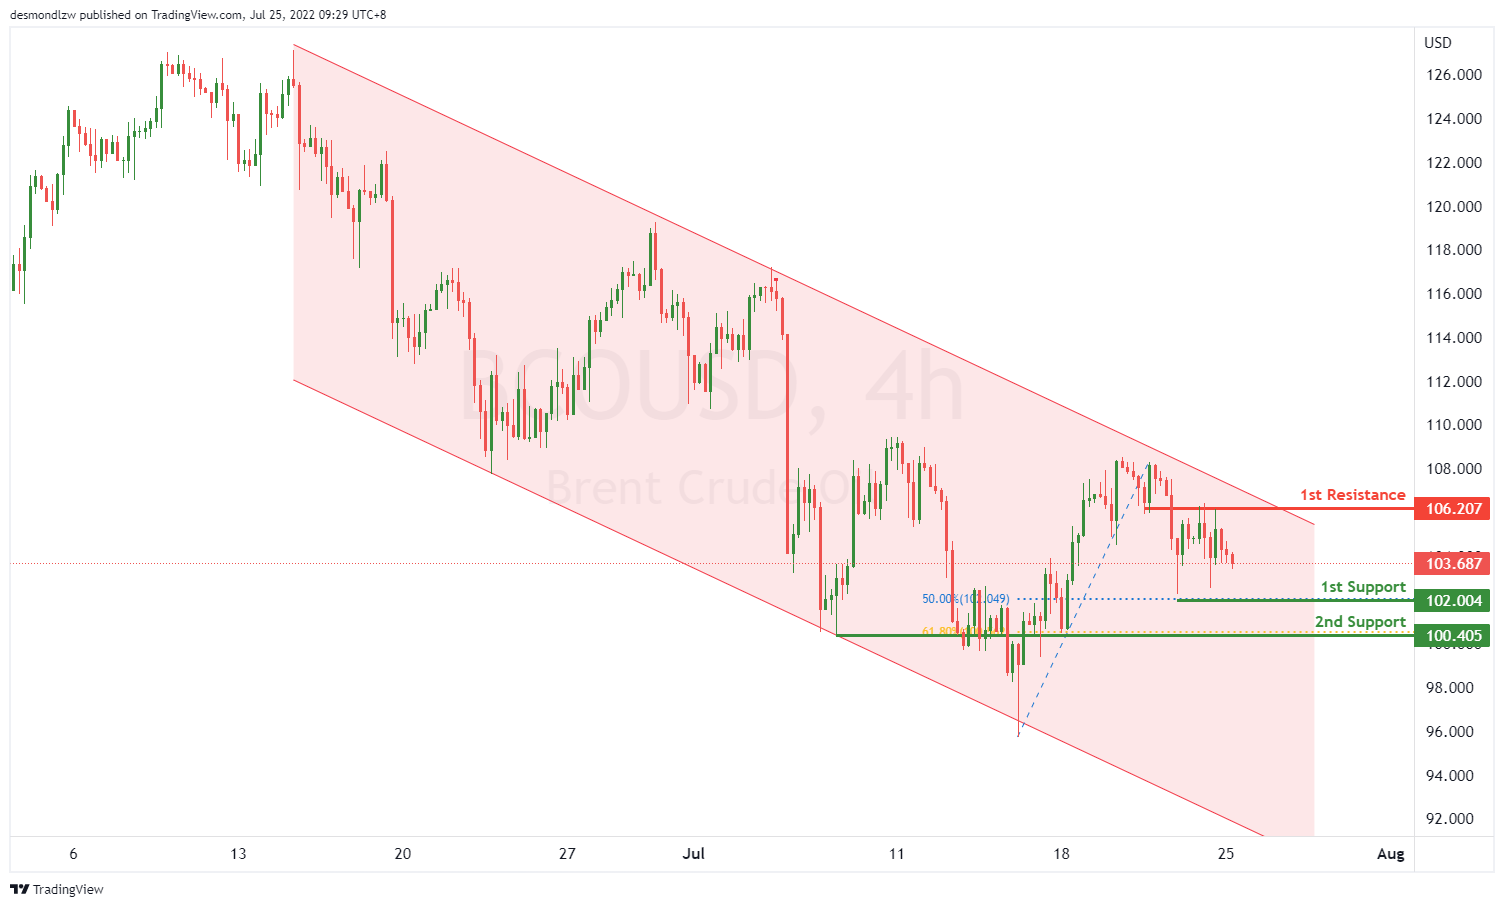
On the H4, with price moving along the bearish channel, we have a bearish bias that price might drop to our 1st support at 102.004, which is in line with 50% retracement. If the price keeps going down, it may drop to our 2nd support at 100.405, which is in line with 61.8% fibonacci retracement. Alternatively, price may rise to 1st resistance at 106.207, which is in line with overlap resistance.
Areas of consideration:
- H4 time frame, 1st support of 102.004
- H4 time frame, 2nd support of 200.405
Dow Jones Industrial Average:
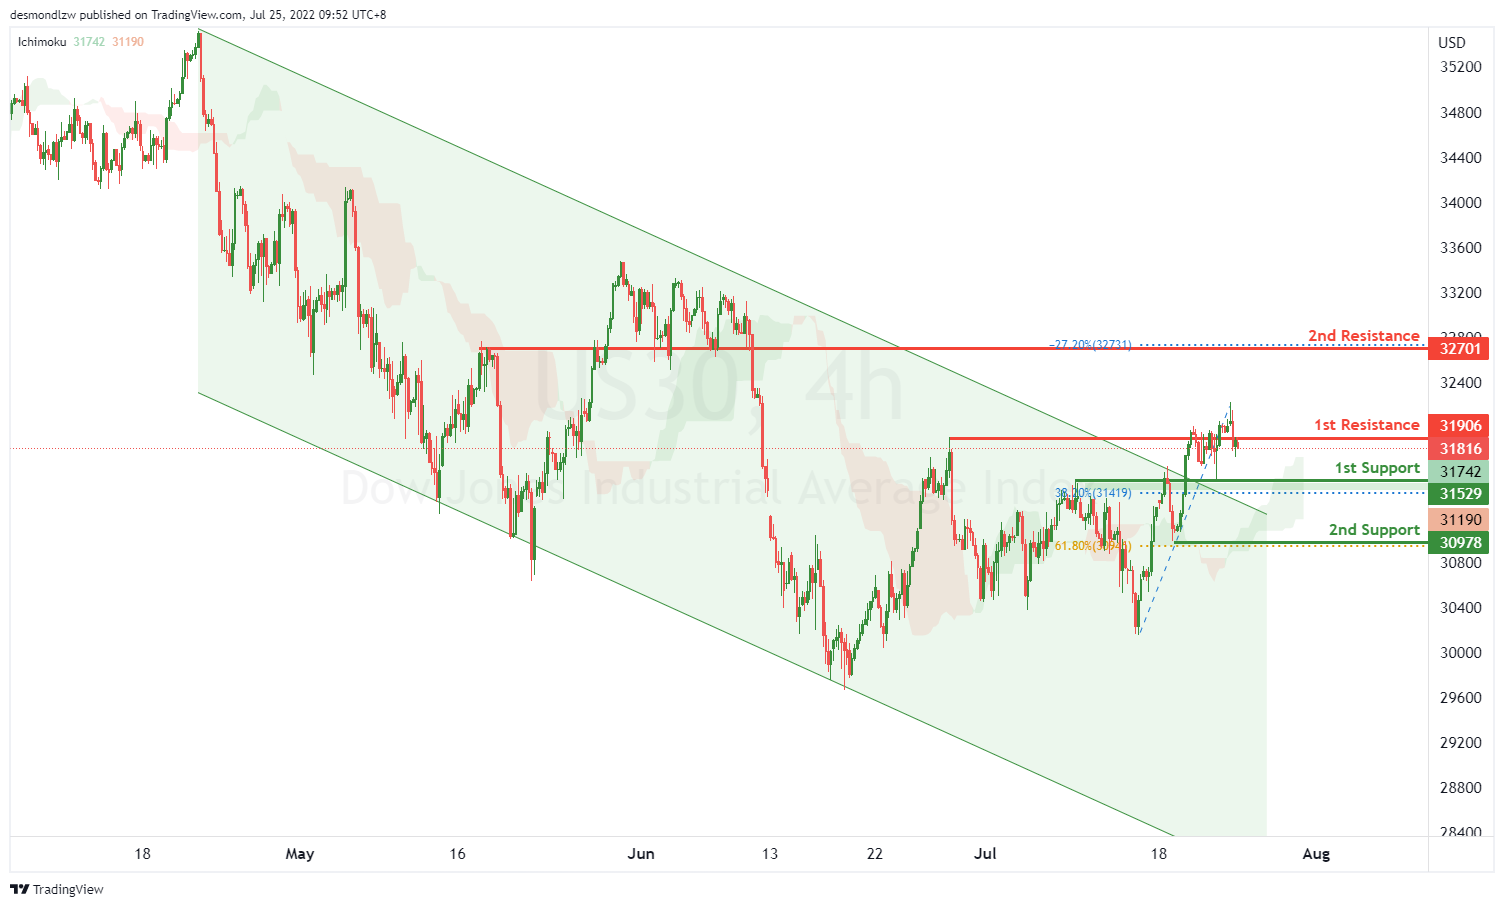
On the H4, with price moving with a bearish channel and having a bullish break, we have a bullish bias that price might rise from our 1st resistance at 31906, which is in line with the swing highs to our 2nd resistance at 32701, which is in line with -27.2% fibonacci expansion. Alternatively, price may reverse off the 1st resistance and drop to the 1st support at 31529, which is in line with the overlap support and 38.2% fibonacci retracement, if the price keeps going down, it may drop to our 2nd support at 30971, which is in line with 61.8% fibonacci retracement.
Areas of consideration:
- H4 time frame, 1st resistance of 31906
- H4 time frame, 2nd resistance at 32701
USD/CAD Daily Outlook
Daily Pivots: (S1) 1.2849; (P) 1.2889; (R1) 1.2954; More...
Intraday bias in USD/CAD stays neutral at this point. On the downside, break of 1.2818 support will bring deeper fall back to 1.2516 key support. On the upside, above 1.2988 minor resistance will reinforce near term bullishness, and turn bias back to the upside for retesting 1.3222 instead.
In the bigger picture, down trend from 1.4667 (2020 high) should have completed at 1.2005, after defending 1.2061 long term cluster support. Rise from there should target 61.8% retracement of 1.4667 to 1.2005 (2021 low) at 1.3650. This will remain the favored case now as long as 1.2516 support holds.