Sample Category Title
Dollar Recovers Mildly, But Needs Fed Guidance for Next Move
Dollar recovers mildly in quiet Asian session today, but it's bounded inside Friday's range except versus Canadian. The greenback will most probably wait until Fed Chair Jerome Powell's comment, after another 75bps this week, before taking another firm move. As for today, Euro is so far the firmer ones, follow by Yen. New Zealand Dollar is leading commodity currencies lower. Sterling and Swiss Franc are mixed.
Technically, Dollar's selloff lost some momentum towards the end of the week. But for now, further decline will remain in favor. Levels to watch include 1.0118 minor support in EUR/USD, 0.9738 minor resistance in USD/CHF, 0.6858 minor support in AUD/USD and 1.2988 minor resistance in USD/CAD. As long as these levels hold, near term risks stay on the downside for the greenback.
In Asia, at the time of writing, Nikkei is down -0.76%. Hong Kong HSI is down -0.75%. China Shanghai SSE is down -0.71%. Singapore Strait Times is up 0.32%. Japan 10-year JGB yield is down -0.0230 at 0.191, back below 0.2% handle.
ECB Lagarde will keep raising rates for as long as necessary
In a blog post, ECB President Christine Lagarde said that last week 50bps rate hike, the first rate increase in 11 years, was "only the latest step in our journey to unwind the special measures we had to take to fight a series of crises", following the end of the net asset purchase programs.
"With these actions, we are sending a clear message to companies, workers and investors: inflation will return to our 2% target over the medium term," she added. "We will keep raising rates for as long as necessary to bring inflation down to our target over the medium term."
While Europe is facing great uncertainty, "not least over the war and energy prices... the Governing Council will review the situation and decide on the right pace for our next steps depending on the incoming data."
ECB Holzmann: We'll need in autumn to decide to do another 0.5% or less
ECB Governing Council member Robert Holzmann told Austrian broadcaster ORG on Sunday, "the economy will grow less strongly, the forecasts point in this direction, that has made us somewhat cautious."
"We will see in the autumn what the economic situation is. Then we can probably decide if we do another 0.5% (rate hike) or less," he added.
He also noted that ECB might have to accept a moderate recession to curb inflation. "We hope that won't become necessary," he said.
WTI heading back to 90 as rebound lost momentum
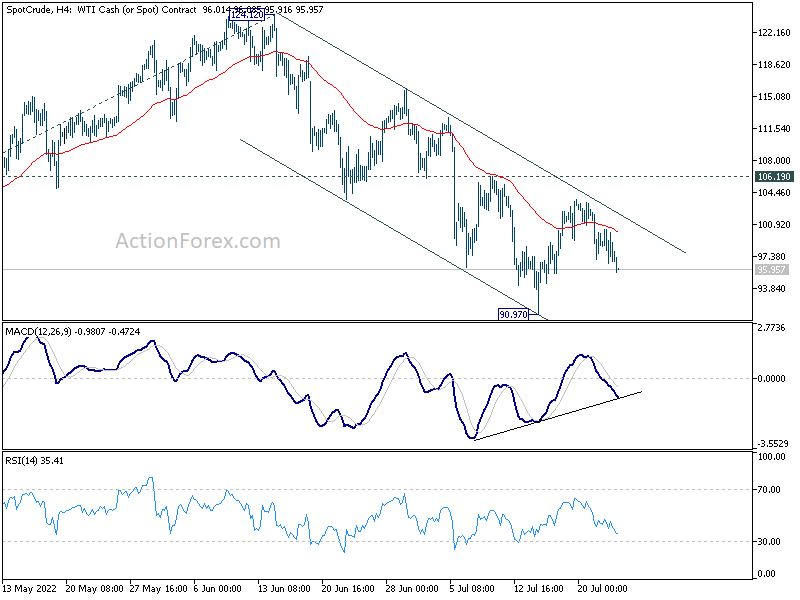
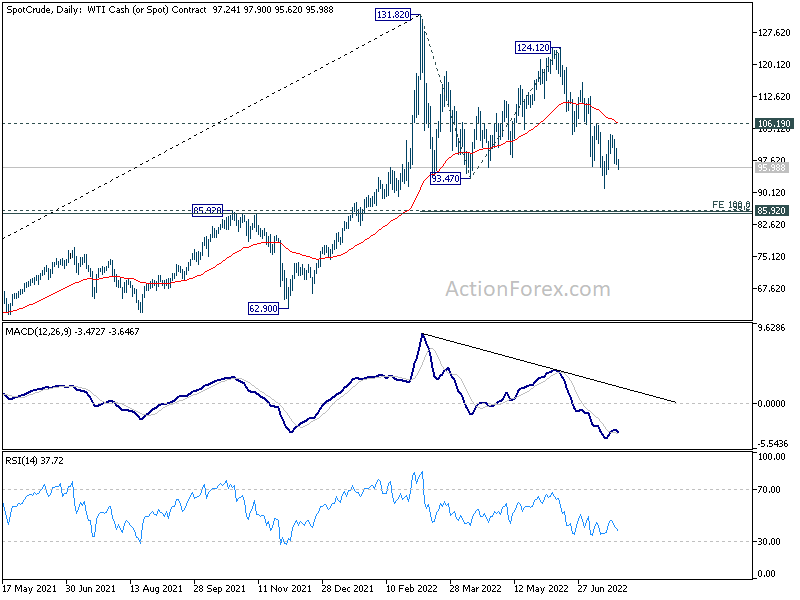
WTI crude oil turns weaker today as the recovery from 90.97 lost momentum ahead of 106.19 resistance. The selloff came on the back on gloomy economic outlook, as indicated by the poor PMI data from Eurozone and US released last week. There's growing expectation that a global recession is inevitable as central banks move to tighten monetary policy to curb inflation.
Development in WTI suggests that fall from 124.12 is still in progress and further decline would be seen to 90.97 support and below. Current decline from 134.12 is seen as the third leg of the corrective pattern from 131.82. Deeper fall could be seen to 85.92 resistance turn support (100% projection of 131.82 to 93.47 from 124.12 at 85.77). Stronger support should be seen there to finally complete the pattern to bring sustainable rebound. This will remain the favored case as long as 106.19 resistance holds.
Fed to hike 75bps; GDP from US, Eurozone and Canada
FOMC rate decision in a major focus this week and Fed is widely expected to hike by 75bps. Given recent poor PMI and consumer sentiment data, it's likely for Fed to deliver a larger hike. The question is indeed on whether Chair Jerome Powell would signal a slowdown in tightening after this move, and his view on recession risks. On central bank front, BoJ will release meeting minutes and summary of opinions.
Also, attention will be on GDP data from US, Eurozone and Canada. CPI from Australia and Eurozone will also be watched, as well as US PCE inflation. Some focuses will also be on Germany Ifo business climate and Gfk consumer sentiment; US consumer confidence and durable goods orders. Here are some highlights for the week:
- Monday: Germany Ifo business climate.
- Tuesday: BoJ minutes, corporate services prices; US house price index, consumer confidence, new homes sales.
- Wednesday: Australia CPI; Germany Gfk consumer climate; Swiss Credit Suisse economic expectations; Eurozone M3; US durable goods orders, goods trade balance, pending home sales, FOMC rate decision.
- Thursday: New Zealand ANZ business confidence; Australia import prices, retail sales; Germany CPI flash; US Q2 advance GDP, jobless claims.
- Friday: BoJ summary of opinions, Japan Tokyo CPI, unemployment rate, retail sales, consumer confidence, housing starts; Australia PPI, private sector credit; France consumer spending, GDP; Germany GDP, import prices, unemployment; Swiss retail sales, KOF economic barometer; Italy GDP; UK mortgage approvals, M4 money supply; Eurozone GDP; Canada GDP; US personal income and spending, and PCE inflation, Chicago PMI.
USD/CAD Daily Outlook
Daily Pivots: (S1) 1.2849; (P) 1.2889; (R1) 1.2954; More...
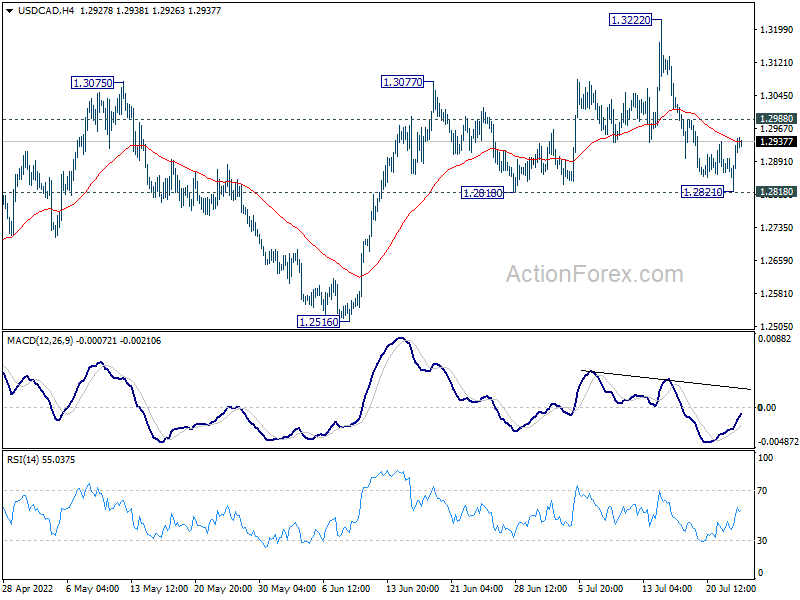
Intraday bias in USD/CAD stays neutral at this point. On the downside, break of 1.2818 support will bring deeper fall back to 1.2516 key support. On the upside, above 1.2988 minor resistance will reinforce near term bullishness, and turn bias back to the upside for retesting 1.3222 instead.
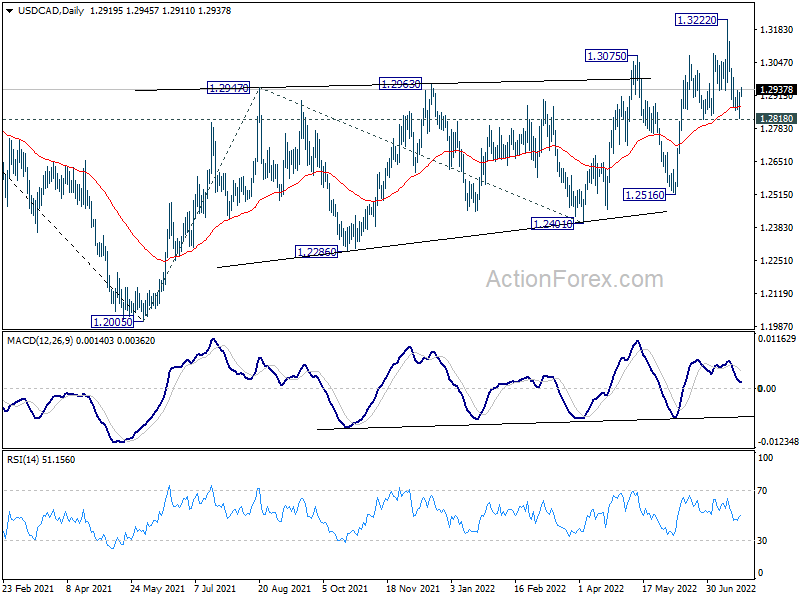
In the bigger picture, down trend from 1.4667 (2020 high) should have completed at 1.2005, after defending 1.2061 long term cluster support. Rise from there should target 61.8% retracement of 1.4667 to 1.2005 (2021 low) at 1.3650. This will remain the favored case now as long as 1.2516 support holds.
Economic Indicators Update
| GMT | Ccy | Events | Actual | Forecast | Previous | Revised |
|---|---|---|---|---|---|---|
| 08:00 | EUR | Germany IFO Business Climate Jul | 90.5 | 92.3 | ||
| 08:00 | EUR | Germany IFO Current Assessment Jul | 98.2 | 99.3 | ||
| 08:00 | EUR | Germany IFO Expectations Jul | 83 | 85.8 |
WTI heading back to 90 as rebound lost momentum
WTI crude oil turns weaker today as the recovery from 90.97 lost momentum ahead of 106.19 resistance. The selloff came on the back on gloomy economic outlook, as indicated by the poor PMI data from Eurozone and US released last week. There's growing expectation that a global recession is inevitable as central banks move to tighten monetary policy to curb inflation.
Development in WTI suggests that fall from 124.12 is still in progress and further decline would be seen to 90.97 support and below. Current decline from 134.12 is seen as the third leg of the corrective pattern from 131.82. Deeper fall could be seen to 85.92 resistance turn support (100% projection of 131.82 to 93.47 from 124.12 at 85.77). Stronger support should be seen there to finally complete the pattern to bring sustainable rebound. This will remain the favored case as long as 106.19 resistance holds.
ECB Holzmann: We’ll need in autumn to decide to do another 0.5% or less
ECB Governing Council member Robert Holzmann told Austrian broadcaster ORG on Sunday, "the economy will grow less strongly, the forecasts point in this direction, that has made us somewhat cautious."
"We will see in the autumn what the economic situation is. Then we can probably decide if we do another 0.5% (rate hike) or less," he added.
He also noted that ECB might have to accept a moderate recession to curb inflation. "We hope that won't become necessary," he said.
ECB Lagarde will keep raising rates for as long as necessary
In a blog post, ECB President Christine Lagarde said that last week 50bps rate hike, the first rate increase in 11 years, was "only the latest step in our journey to unwind the special measures we had to take to fight a series of crises", following the end of the net asset purchase programs.
"With these actions, we are sending a clear message to companies, workers and investors: inflation will return to our 2% target over the medium term," she added. "We will keep raising rates for as long as necessary to bring inflation down to our target over the medium term."
While Europe is facing great uncertainty, "not least over the war and energy prices... the Governing Council will review the situation and decide on the right pace for our next steps depending on the incoming data."
Eco Data 7/25/22
[php_everywhere instance="1"]
Forex and Cryptocurrencies Forecast
EUR/USD: The ECB's Monetary Experiment: Crossing a Hawk with a Dove
The single European currency showed slight growth at the beginning of last week, fixing a local high at 1.0272. There are three reasons for this. The first and most banal one is a corrective rebound after the EUR/USD pair, having broken through the parity level of 1.0000, found the bottom at 0.9951 on July 14. The second one is the resumption of Russian gas supplies to the EU via the Nord Stream pipeline. And finally, the third and most important one is the expectation of a rise in the euro interest rate. Moreover, the market expected that the rate would be raised by 50 basis points (bp) at once, and not by 25, as announced by the ECB itself at its previous meeting. This is what happened in reality. For the first time in 13 years, the European regulator raised the lending rate from 0 to 0.5% on Thursday, July 21, and brought the deposit rate out of the negative zone, raising it from -0.5% to 0%.
The ECB explained in its press release that it felt appropriate to take a larger first step towards rate normalization for two reasons. The first is obvious and consists of an updated assessment of inflation growth. As a second reason, the ECB announced the launch of a new instrument, the Transmission Protection Instrument (TPI), which should allow, despite the increase in the rate, not to increase the cost of borrowing too aggressively in the vulnerable economies of the Eurozone. The TPI description explains that this tool was introduced to counter the unreasonable erratic market movements that took place in mid-June.
In short, the essence of TPI is that the ECB will be able to buy back securities issued in those EU countries where there is a destabilization of financial conditions unjustified by fundamental factors, on the secondary market. The volume of purchases is not limited by anything and will depend on the severity of the risks. In other words, the regulator will try to cross a hawk with a dove: on the one hand, by raising the rate (QT), and on the other hand, by continuing potentially unlimited quantitative easing (QE). The market reaction to this monetary experiment turned out to be appropriate and predictable: the EUR/USD pair fell to 1.0152. After that, it went up again and completed the five-day period at the level of 1.0210.
There will be a meeting of the FOMC (Federal Open Market Committee) of the US Federal Reserve next week, on Wednesday, July 27. Almost no one doubts that the key interest rate will be raised there. But how much? By 100 bp, which hasn't happened since 1981, or by 75 bp? If the FOMC chooses the first option, the rate will reach 2.75%. It is this growth that the markets put into their quotes, expecting a new assault on the 1.0000 horizon by the EUR/USD pair. However, if the Fed abandons this idea and the rise is more modest, then a further rebound of the pair to the north is not ruled out.
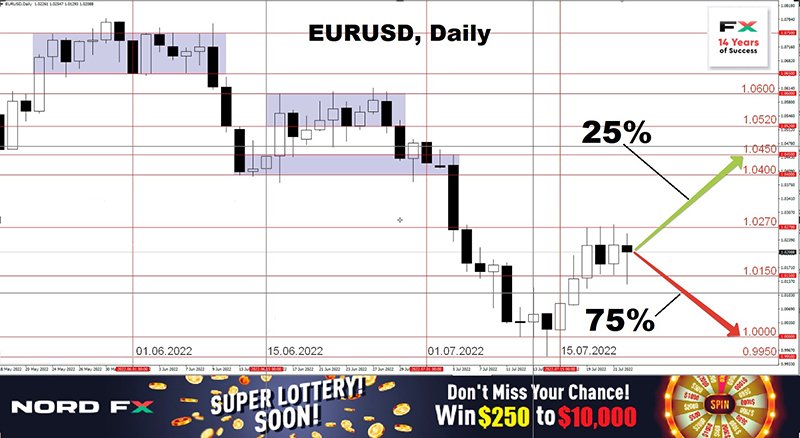
At the time of writing this review, on the evening of July 22, 25% of experts supported the growth of the pair. The remaining 75% showed it the way to the south. The oscillator readings on D1 give a slightly different signal: 60% are colored red, 25% are green and 15% are neutral grey. As for the trend indicators, 65% look south, the remaining 35% have taken the opposite position. The immediate support for the EUR/USD pair is the 1.0150-1.0200 zone, then, of course, comes the 1.0000 level. After it is broken, the bears will target the July 14 low at 0.9950, even lower is the strong 2002 support/resistance zone. 0.9900-0.9930. The next serious task for the bulls will be to break through the resistance at 1.0270 and return to the 1.0400-1.0450 zone, followed by the 1.0520-1.0600 and 1.0650-1.0750 zones.
As already mentioned, the most important event of the upcoming week will be the FOMC meeting of the US Federal Reserve and its decision on the interest rate. The volume of US orders for capital goods and durable goods will become known on the same day, Wednesday, July 27. Data (CPI) on consumer markets in Germany and the Eurozone will arrive on Thursday, July 28 and Friday, July 29, respectively. The preliminary size of the US GDP (Q2) will be known on July 28, and the GDP of Germany and the Eurozone on July 29.
GBP/USD: The Battle for 1.2000 Continues
Last week was quite busy for the pound as for the publication of important macro-statistics on the UK. And although it turned out to be rather ambiguous, there were distinct positive notes in it, especially where it concerned the labor market. The number of applications for unemployment benefits in the country for the month decreased from 34.7K to 20.0K, and this is against the forecast of 41.2K.
Unlike EUR/USD, thanks to such statistics, the GBP/USD pair showed more confident growth and managed to return to where it was trading two and five weeks ago, putting the final chord at around 1.2000. And now the question arises: will this level turn into strong resistance or support?
At the moment, 75% of experts believe that the British currency will continue to lose ground, 25%, on the contrary, expect a rebound upwards. The readings of the indicators on D1 are as follows. Among the trend indicators, the balance of power is 65-35% in favor of the reds. Among the oscillators, the advantage of the bears is much less: 35% indicate a fall, 25% indicate an increase, the remaining 40% remain neutral. The closest support is located in the 1.1875-1.1915 zone. Below is the level of 1.1800, the low of July 14 of 1.1759, then 1.1650, 1.1535 and the lows of March 2020 in the zone 1.1400-1.1450. As for the bulls, they will meet resistance in the zones and at the levels of 1.2100, 1.2160-1.2175, 1.2200-1.2235, 1.2300-1.2325 and 1.2400-1.2430.
The macroeconomic calendar does not include major news from the United Kingdom itself. The determining factor for the dynamics of the GBP/USD pair, of course, will be the meeting of the US Federal Reserve on Wednesday, July 27. Recall that the interest rate on the pound is 1.25% at the moment , and the next meeting of the Bank of England (BOE) is scheduled for August 04, 2022.
USD/JPY: Correction or Trend Change?
What most experts dreamed about for so long has come true. The USD/JPY pair did not renew the 24-year high again, and did not even take a break, but literally collapsed down. And this despite the fact that the Bank of Japan (BOJ) once again left the interest rate unchanged at a negative level of -0.1% on Thursday, July 21. The management of the regulator did not even hint of tightening monetary policy. On the contrary, it was stated that the Japanese Central Bank will not hesitate to take additional easing measures (QE) if necessary, and also expects short-term and long-term interest rates to remain at the current or even lower (!) levels.
Although inflation in Japan tends to rise, it is still below 2%, which is many times lower than in the US and Europe. Thus, given the dynamics of domestic demand and weak wage growth, there is still little incentive for the BOJ to change its ultra-dove tack. So the current strengthening of the yen and the fall of the pair USD/JPY from 139.38 to 135.56 is due, with a high degree of probability, to its being strong overbought.
This time, 70% of experts are waiting for a new push of the pair to the height of 142.00. 15% hope for a continuation of the downtrend, the remaining 15% speak of a side corridor. The picture is vaguer in the readings of indicators on D1: trend indicators have a parity of 50% to 50%, 25% of oscillators look to the north, 40% to the south and 35% to the east. Supports are located at the levels and in the zones 135.55, 134.75, 134.00, 133.50, 133.00 and 131.40. Resistances are 136.35-137.00, 137.90-138.40, 138.50-1.139.00, followed by the July 14 high at 139.38 and round bull targets of 140.00 and 142.00.
No major events are expected in Japan this week. Of course, we can note the publication on Monday, July 26 of the report on the latest meeting of the Monetary Policy Committee of the Bank of Japan, however, it is unlikely that it will cause not only a tsunami, but even a small wave in the market. So the focus of attention, as for other currency pairs, will be on the meeting of the US Federal Reserve on Wednesday, July 27.
CRYPTOCURRENCIES: A Little Patience, Ladies and Gentlemen!
For the first time since June 13, BTC/USD rose above $23,000 and even hit $24,263 last week. What is this, a long-awaited change in trend? Or a brief thaw in the middle of a crypto winter? Or maybe another insidious trap arranged by bears for gullible investors? Let's figure it out.
We have repeatedly written that a popular marker among crypto-analysts is the 200-week moving average (SMA200), which has been referred to more and more often lately. The reason is that it used to be the main support for the BTC/USD pair. But it is not at all certain that what happened before will be repeated in the future. And the proof of this is the recent breakdown of this very SMA200. However, this technical analysis indicator is still one of the most used in making forecasts.
So, bitcoin managed to rise above the 200-week moving average last week. The reason for this, of course, is not that the flagship cryptocurrency has become stronger, but that the US dollar has weakened a little. Against this background, the US stock indices, S&P500, Dow Jones and Nasdaq went up, and after them the quotes of such risky assets as cryptocurrencies followed.
At the time of writing this review (Friday evening, July 22), bitcoin is trading around $22,670. The total capitalization of the crypto market is $1.026 trillion ($0.945 trillion a week ago). The Crypto Fear & Greed Index rose from 15 to 33 points in a week, and finally got out of the Extreme Fear zone into the Fear zone.
Thus, bitcoin is up about 20% from the July 13 low ($18.886) and is just above the 200-week moving average ($22.565). According to analysts at the Binance crypto exchange, such a close of the week gives hope for the restoration of strong support in the form of SMA200, which is typical for bitcoin bear cycles.
Bitcoin's break above the 200-week SMA caused a surge of enthusiasm among investors. Amsterdam Stock Exchange trader Michael van de Poppe first tweeted out a graphical forecast anticipating a cryptocurrency rally to $28,000 and then compared the current market situation to the recovery from the memorable collapse triggered by the announcement of the coronavirus pandemic in March 2020. At that time, bitcoin collapsed to $3,782, but then rose by 1.600% over the next 13 months (to $64,853 in April 2021).
Analysts of the Kraken cryptocurrency exchange are equally optimistic, who also use the 200-week moving average as the main indicator. In particular, they drew attention to the multipliers with which BTC traded in the past relative to its 200-week SMA. Thus, having rebounded from the SMA200, bitcoin grew 15.2 times in December 2017. The growth was 13.2 times in November 2013. At the moment, BTC is trading close to its 200-week moving average. If the coin shows a multiplier in the range of 13x - 15x again, it may rise to about $300,000.
Of course, the multiplier for BTC was not always 10x when touching the SMA200. Growth peaked at 5.8x in March 2021 before the crypto market began to decline noticeably. However, even with this value of the multiplier, bitcoin can rise to $130,000. But when will this happen? The patience of many market participants has already run out.
We have already written that, according to Glassnode data, bitcoin's record price decline in June almost took the rest of the "market tourists" out of the game, leaving only hodlers "at the front". In the context of monthly dynamics, the situation was worse only in 2011. The largest outflow was recorded among institutional investors (companies with investments from $1 million), public miners (expanding production on credit), as well as speculators and casual players.
Assuming the market cycle repeats, the bearish phase of bitcoin will end in the first half of autumn. Such a conclusion can be drawn from the historical data provided by the analysts at Grayscale Investments. It took bitcoin 1,290 and 1,257 days to form a full cycle in 2012 and 2016, respectively. It took 391 and 364 days to fall from the peak by 73% in 2012 and by 84% in 2016. The duration of the current cycle, which began in 2020, has reached 1206 days (as of July 20, 2022). In other words, it may take another two to three months before reaching the bottom.
A crypto strategist with the nickname Rekt Capital came to similar conclusions. In his opinion, despite the oversold signals, the downward exchange rate movement may continue for quite a long time. The analyst noted that the Relative Strength Index (RSI) on the BTC monthly timeframe is now below the lowest levels of the bear markets of 2015 and 2018, which could become new resistance levels for bitcoin.
According to Rekt Capital, the short-term prospects of the coin do not look very good, and the bottom can be reached only in a few months: "Bitcoin has about 650 days before the next halving (April 2024). Historically, it bottomed around 517-547 days before its halving. In the event of a repeat of history, bitcoin will need another 100-150 days before reaching the bottom, which will form in the fourth quarter of 2022."
American businessman Thomas Peterffy, whose capital is estimated at $18.4 billion, is ready to buy bitcoins when the value of the cryptocurrency drops to $12,000. This chairman of Interactive Brokers admitted in a recent interview with Forbes that he does not intend to buy cryptocurrency at the current, in his opinion, high price, as he believes that in the future, bitcoin is very likely to depreciate or be banned in the United States.
Most traders from China are in solidarity with Thomas Peterffi. A poll on the social network Weibo with the participation of more than 2,200 people showed that Chinese traders are waiting for further decline in the price of bitcoin. 8% of respondents said they would buy BTC at $18,000 per coin. 26% of respondents will start purchases at $15,000. But if the bitcoin rate falls to $10,000, 40% of respondents will buy the first cryptocurrency.
It can be seen from all of the above that, despite the prospects for BTC to rise to the cosmic $300,000, there are no clear signals for investing in this coin yet. The US Federal Reserve will make a decision on the interest rate on Wednesday, July 27. And, most likely, the prospects for the BTC/USD pair will become more distinct after that. A sharp increase in the rate will lead to an increase in the DXY dollar index and a further drop in investor risk appetite. And then the chances of seeing bitcoin at $10,000 will increase dramatically. Otherwise, we'll see it aim for $30,000. It won't take long to find out which of these scenarios will come true. So, dear traders and investors, let's be patient.
EUR/USD Weekly Outlook
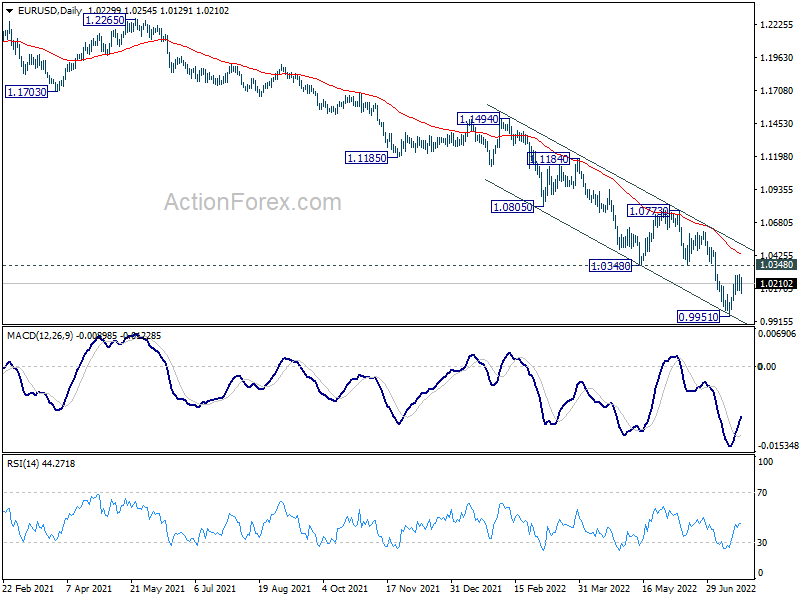
EUR/USD's rebound from 0.9951 extended higher last week and confirmed short term bottoming. Further rise is in favor this week as long as 1.0118 minor support holds. Above 1.0277 minor resistance will target 1.0348 support turned resistance. Sustained break there will bring stronger rebound back to channel resistance (now at 1.0517). On the downside, below 1.0118 will bring retest of 0.9951 low instead.
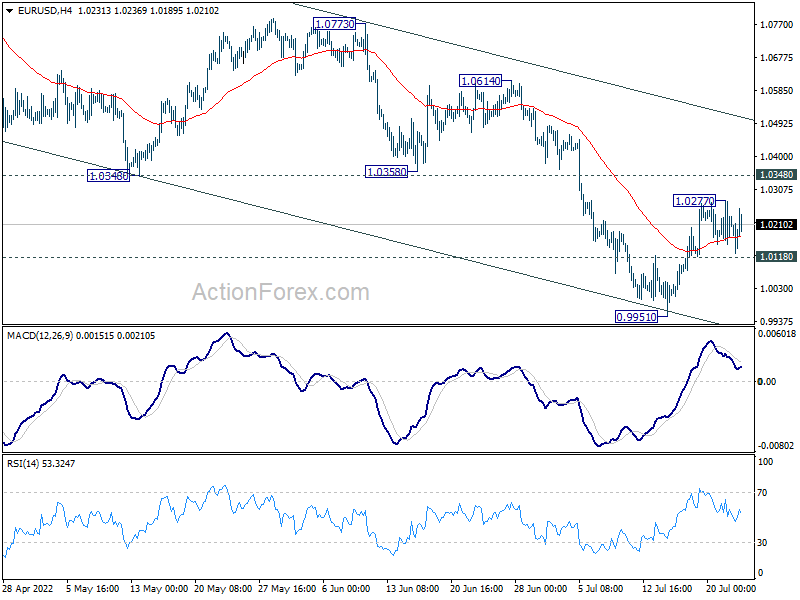
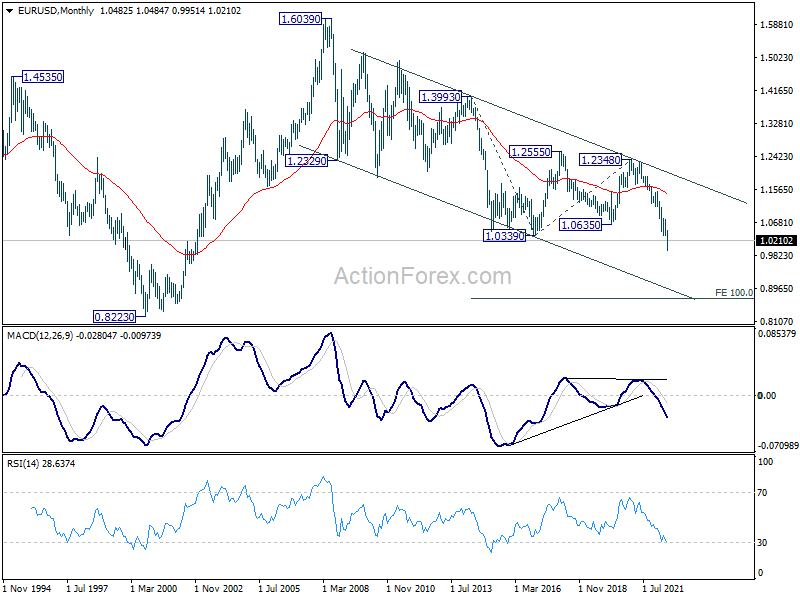
In the bigger picture, down trend from 1.6039 (2008 high) is still in progress. Next target is 100% projection of 1.3993 to 1.0339 from 1.2348 at 0.8694. In any case, outlook will stay bearish as long as 1.0773 resistance holds, in case of strong rebound.
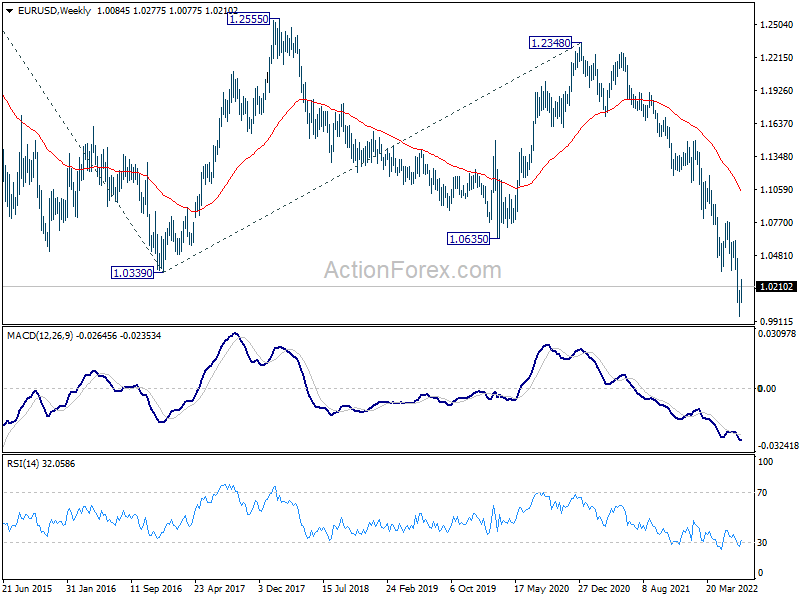
In the long term picture, long term down trend from 1.6039 (2008 high) resuming. Sustained break of 61.8% projection of 1.3993 to 1.0339 from 1.2348 at 1.0090 will pave the way to 100% projection at 0.8694.
USD/JPY Weekly Outlook
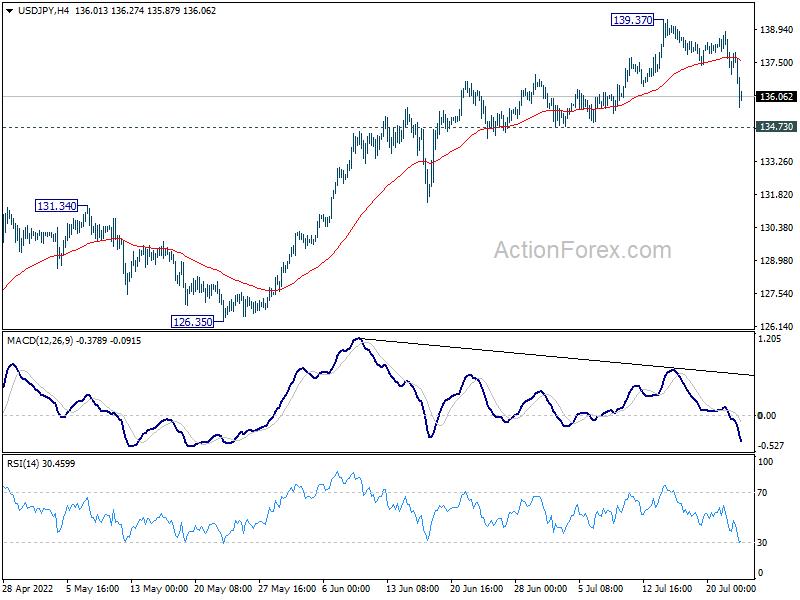
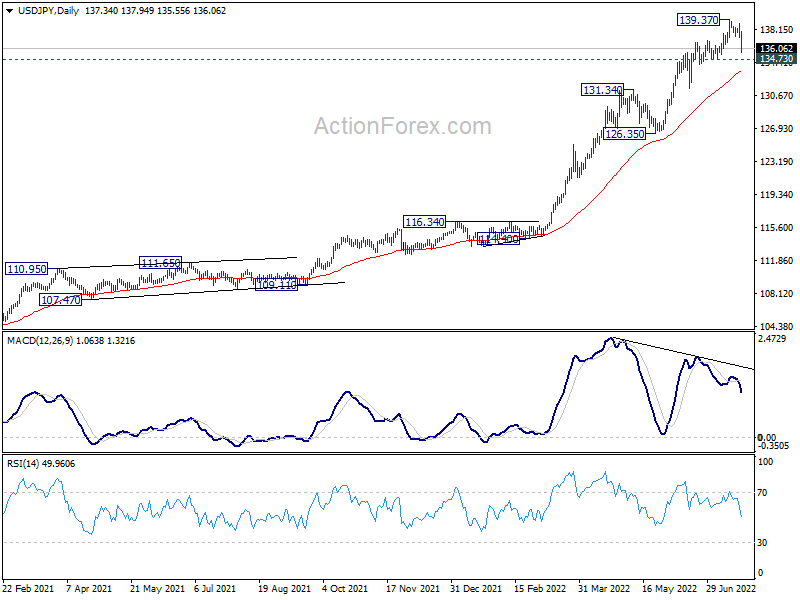
USD/JPY's pull back from 139.37 extended lower last week but stayed above 134.73 support. Initial bias stays neutral this week first. On the downside, firm break of 134.73 will confirm short term topping, on bearish divergence condition in 4 hour and daily MACD. Deeper fall would be seen through 55 day EMA to 126.35/131.34 support zone. On the upside, break of 139.37 will resume larger up trend.
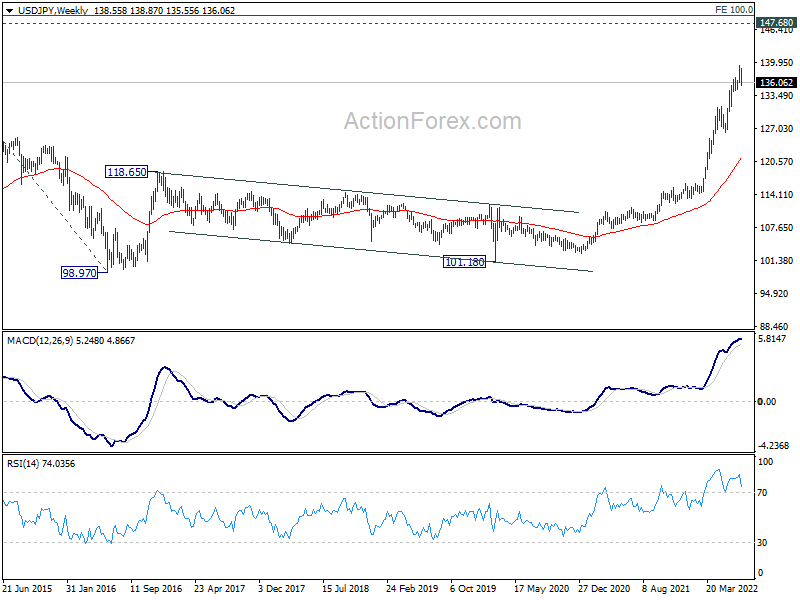
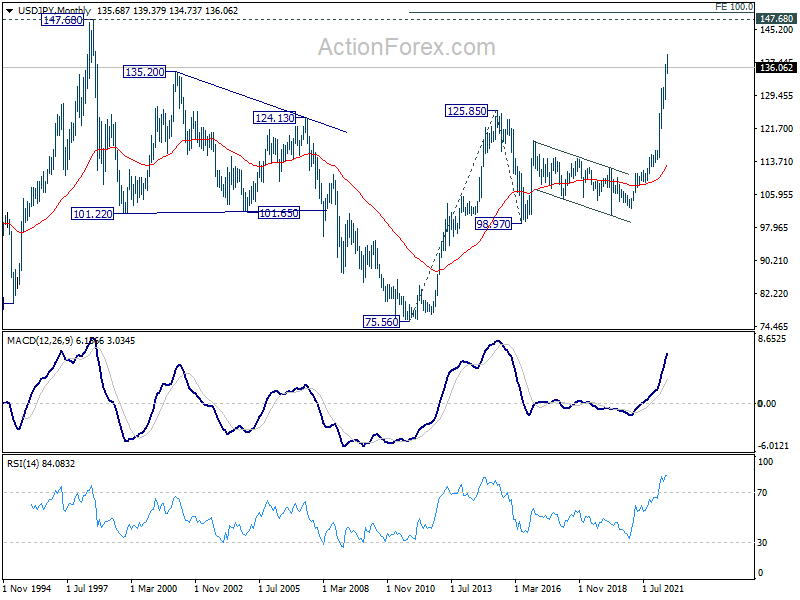
In the bigger picture, current rally is seen as part of the long term up trend from 75.56 (2011 low). Next target is 100% projection of 75.56 (2011 low) to 125.85 (2015 high) from 98.97 at 149.26, which is close to 147.68 (1998 high). This will remain the favored case as long as 126.35 support holds.
In the long term picture, the up trend from 75.56 (2011 low) long term bottom to 125.85 (2015 high) has just resumed. Next target is 100% projection of 75.56 (2011 low) to 125.85 (2015 high) from 98.97 at 149.26, which is close to 147.68 (1998 high).
GBP/USD Weekly Outlook
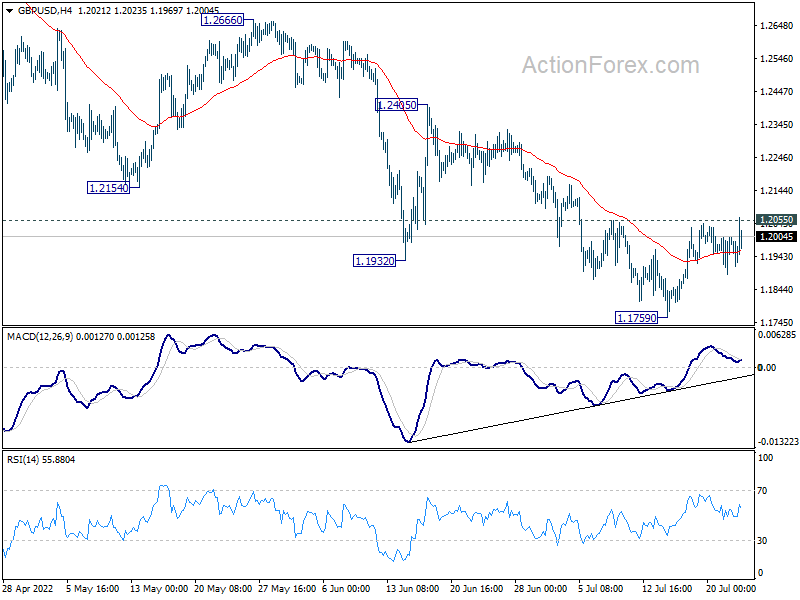
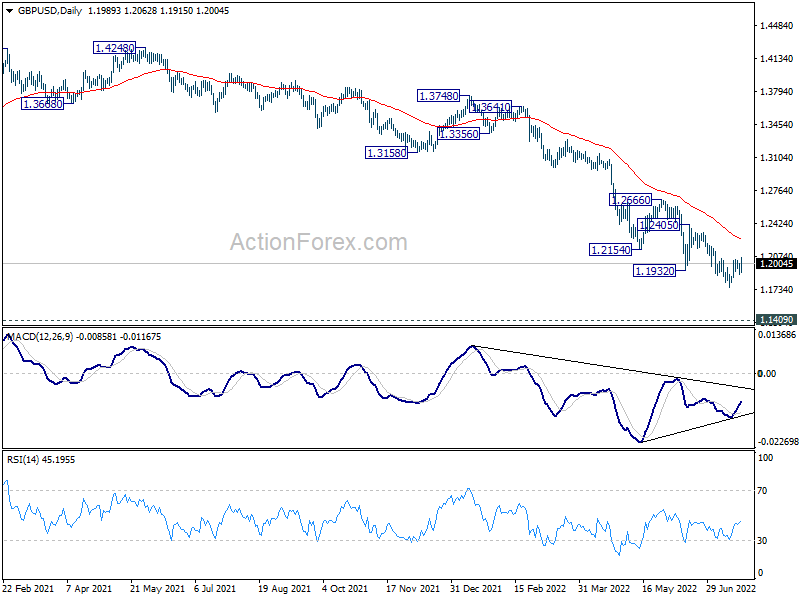
GBP/USD's edged higher last week but struggle to break through 1.2055 minor resistance cleanly. Initial bias stays neutral this week first. On the upside, firm break of 1.2055 minor resistance will confirm short term bottoming at 1.1759. Bias will be turned back to the upside for 1.2405 resistance next. On the downside, break of 1.1759 will resume larger down trend.
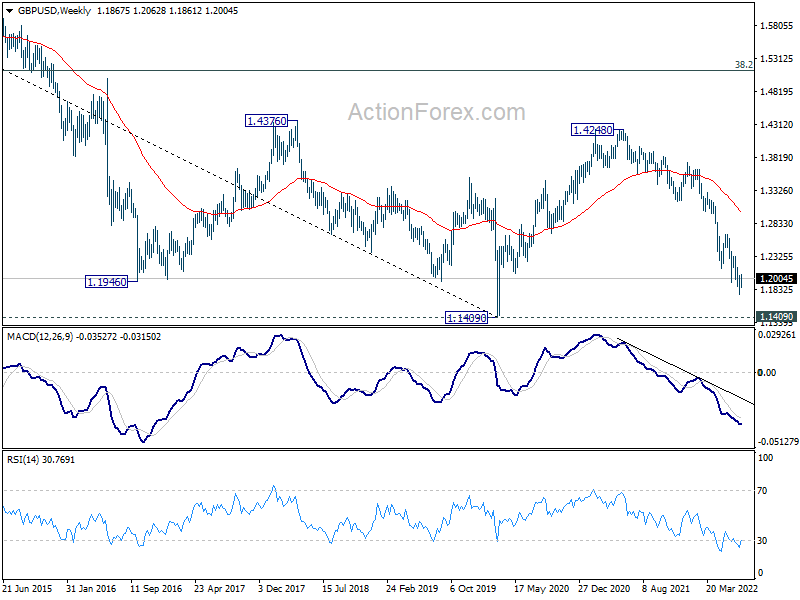
In the bigger picture, fall from 1.4248 (2018 high) could be a leg inside the pattern from 1.1409 (2020 low), or resuming the longer term down trend. Deeper decline is expected as long as 1.2666 resistance holds. Next target is 1.1409 low. However, firm break of 1.2666 will bring stronger rise back to 55 week EMA (now at 1.2986).
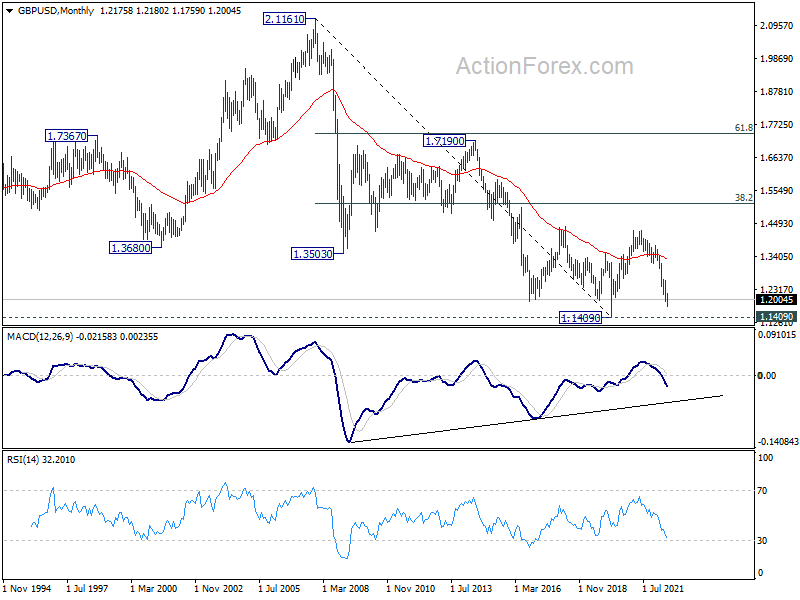
In the longer term picture, rebound from 1.1409 long term bottom should have completed at 1.4248 already, well ahead of 38.2% retracement of 2.1161 to 1.1409 at 1.5134. The development argues that price actions from 1.1409 are developing into a corrective pattern only. That is, long term bearishness is retained for resuming the down trend from 2.1161 (2007 high) at a later stage.
USD/CHF Weekly Outlook
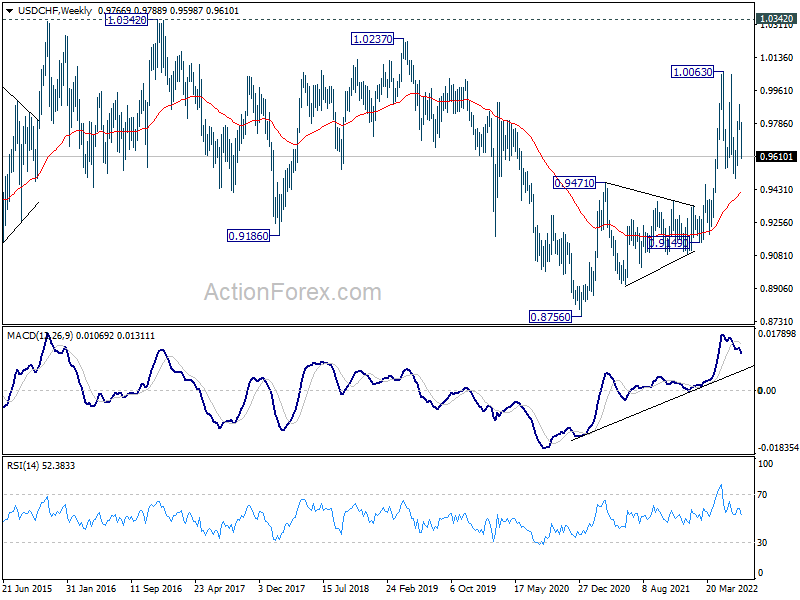
USD/CHF's fall from 0.9884 extended lower last week and outlook is unchanged. Such decline is seen as a falling leg of the consolidation from 1.0063. Initial bias stays on the downside for 0.9493 support. On the upside, though, above 0.9738 minor resistance will turn bias back to the upside for 0.9884 resistance.
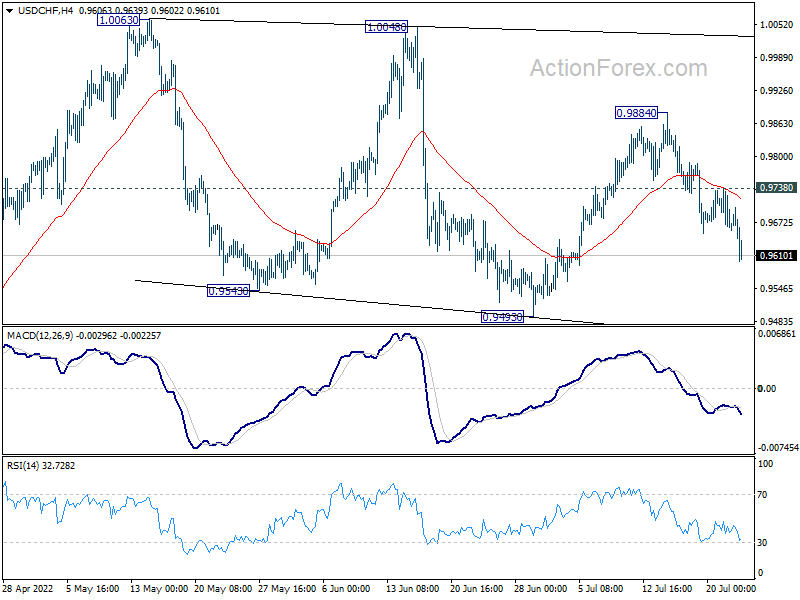
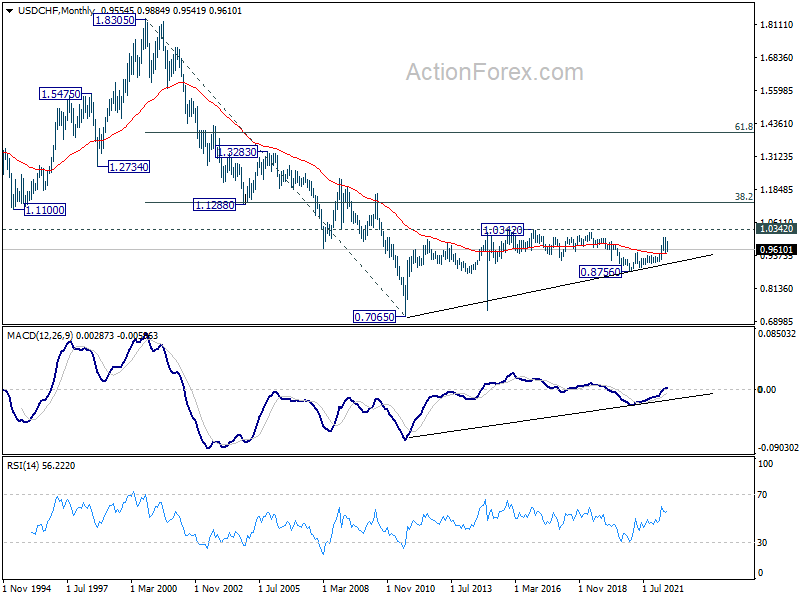
In the bigger picture, medium term up trend from 0.8756 (2021 low) is still in progress. On resumption, next target is 1.0342 (2016 high). Sustained break there will resume long term up trend from 0.7065 (2011 low). This will remain the favored case as long as 0.9471 resistance turned support holds.
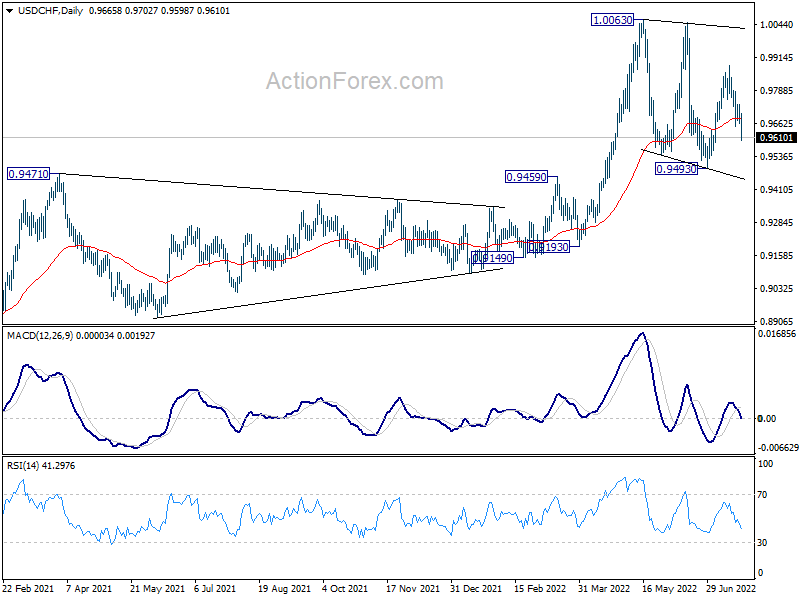
In the long term picture, current development argues that the correction from 1.0342 (2016 high) has completed at 0.8756 (2020 low) already. Rise from 0.7065 (2011 low) might be ready to resume. Firm break of 1.0342 will confirm and target 38.2% retracement of 1.8305 (2000 high) to 0.7065 at 1.1359.