Sample Category Title
AUD/USD Weekly Outlook
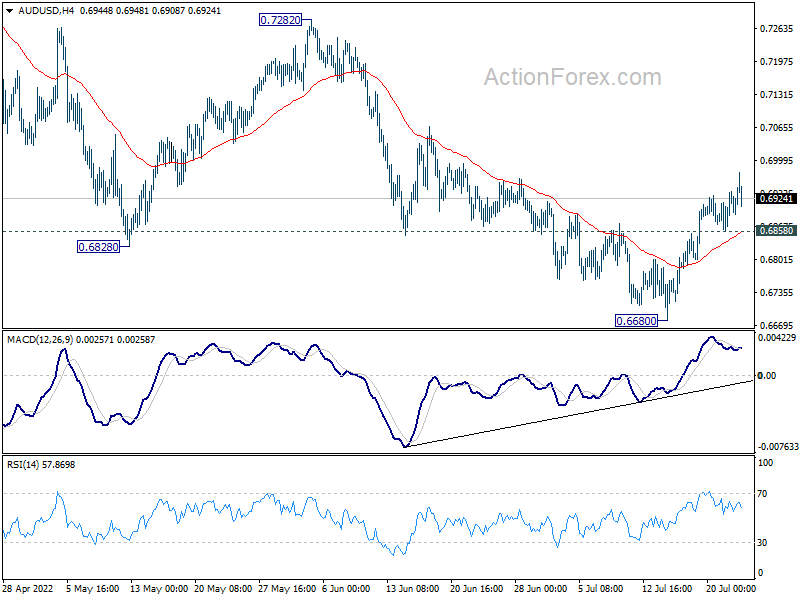
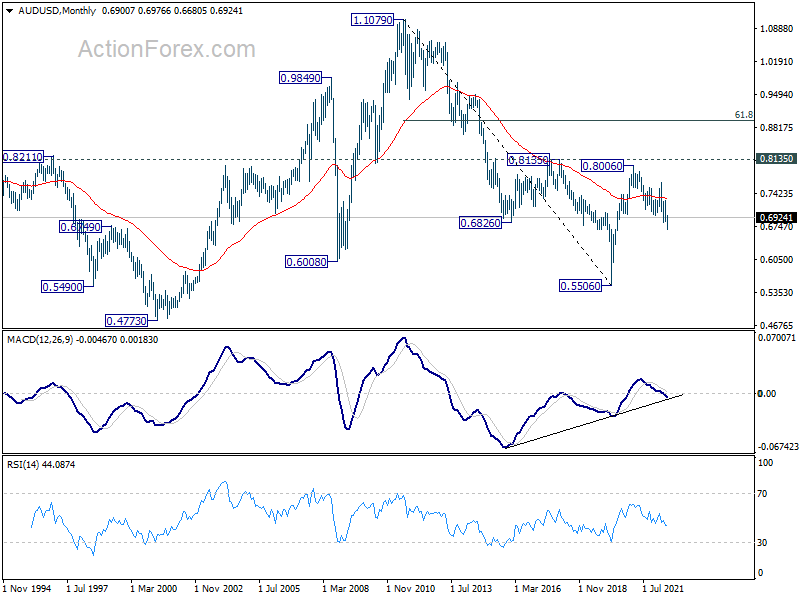
AUD/USD's rebound from 0.6680 extended to as high as 0.6976 last week. The develope indicates that a short term bottom was already formed. Further rally is in favor as long as 0.6858 minor support holds. Sustained trading above 55 day EMA (now at 0.6967) will pave the way to 0.7282 resistance next. Nevertheless, break of 0.6858 will turn bias back to the downside for retesting 0.6680 low.
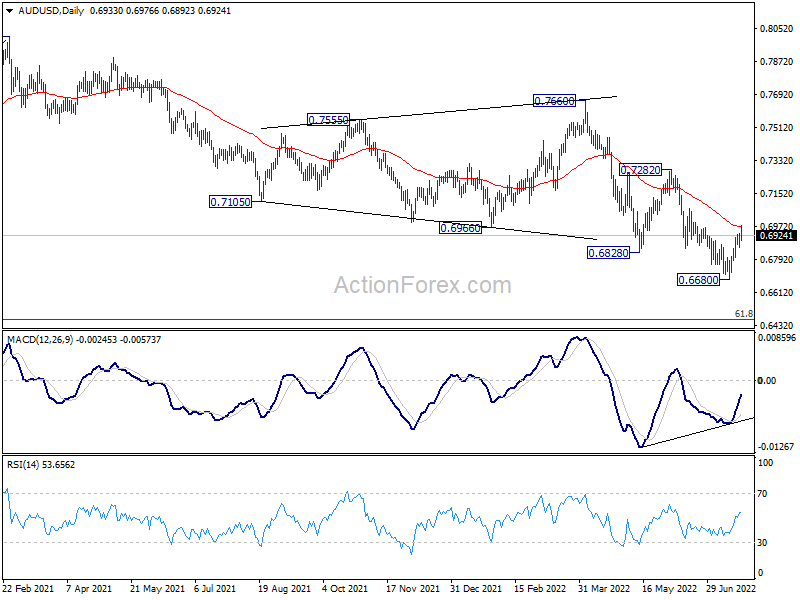
In the bigger picture, price actions from 0.8006 (2021 high) could still be a corrective pattern to rise from 0.5506 (2020 low). But current downside acceleration, as seen in weekly MACD), is raising the chance that it's a bearish impulsive move. In either case, outlook will remain bearish as long as 0.7282 resistance holds. Next target is 61.8% retracement of 0.5506 to 0.8006 at 0.6461.
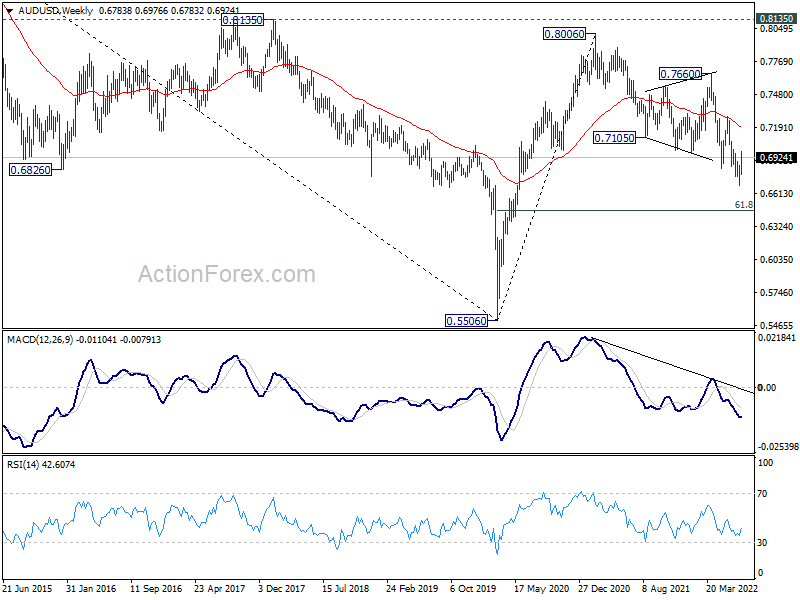
In the long term picture, rejection by 0.8135 resistance suggests that the long term down trend from 1.1079 (2011 high) is not ready to reverse. Yet, the structure of the fall from 0.8006 still argues that it's a corrective move. Hence, break of 0.5506 low is not envisaged for now. The long term outlook stays neutral first, and will be reassessed later after the fall from 0.8006 completes.
USD/CAD Weekly Outlook
USD/CAD dropped further to 1.2821 last week but recovered ahead of 1.2818 support. Initial bias is neutral this week first. On the downside, break of 1.2818 support will bring deeper fall back to 1.2516 key support. On the upside, above 1.2988 minor resistance will turn bias back to the upside for retesting 1.3222 instead.
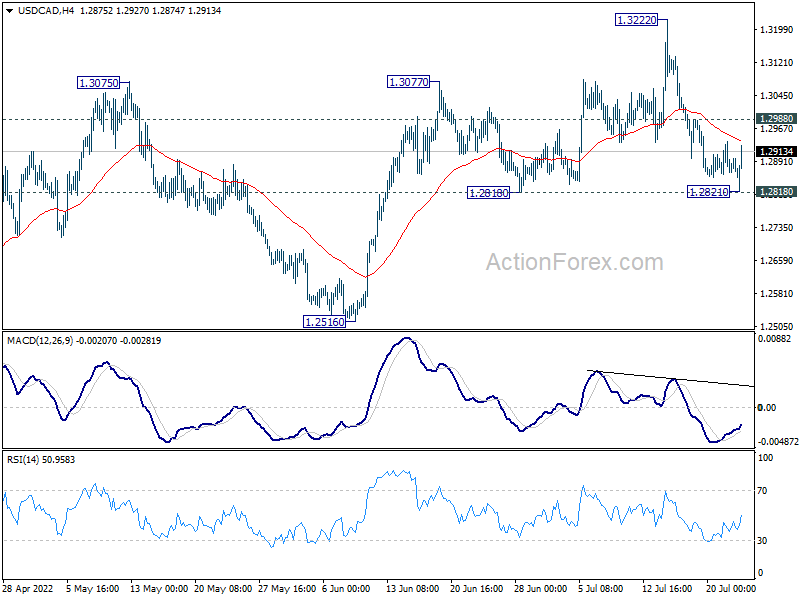
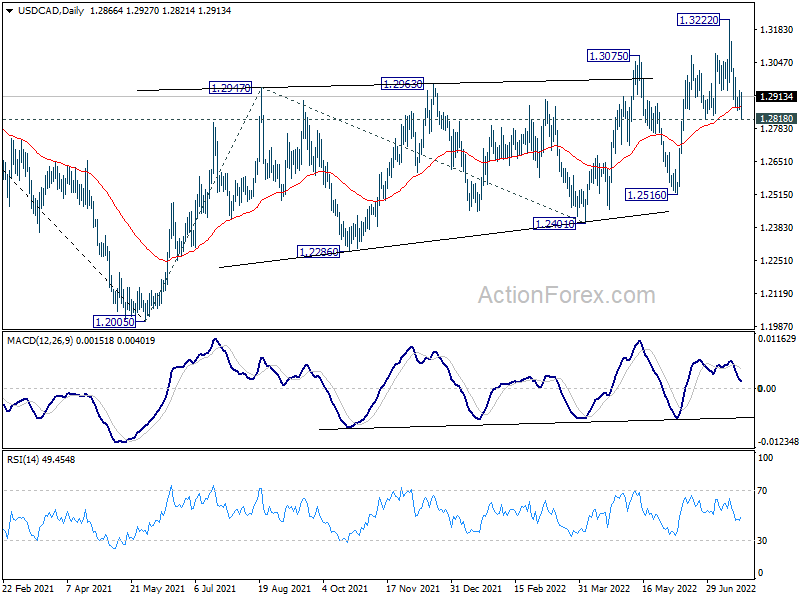
In the bigger picture, down trend from 1.4667 (2020 high) should have completed at 1.2005, after defending 1.2061 long term cluster support. Rise from there should target 61.8% retracement of 1.4667 to 1.2005 (2021 low) at 1.3650. This will remain the favored case now as long as 1.2516 support holds.
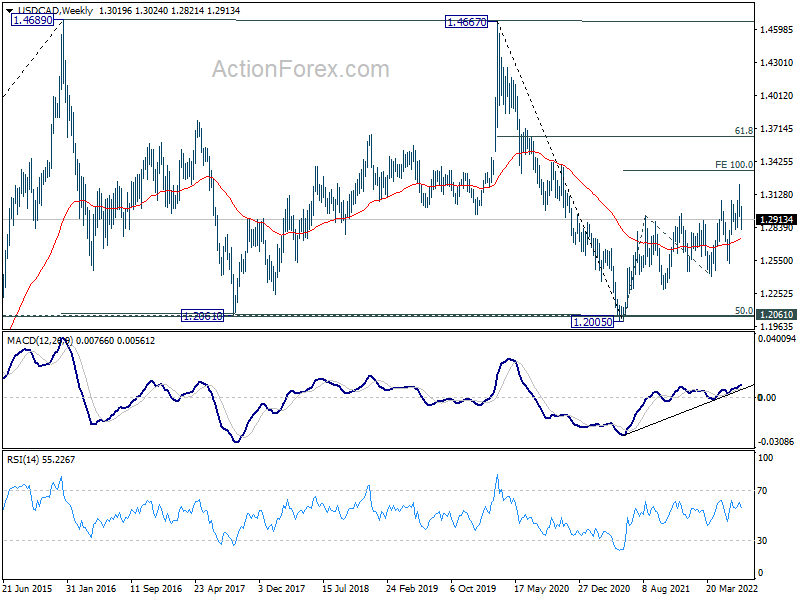
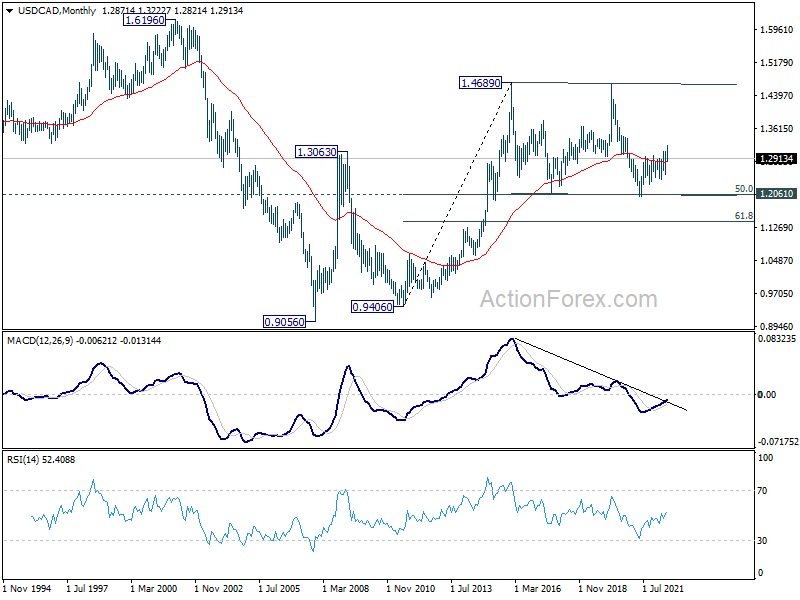
In the longer term picture, price actions from 1.4689 (2016 high) are seen as a consolidation pattern only. That is, up trend from 0.9506 (2007 low) is still expected to resume at a later stage. This will remain the favored case as long as 1.2061 support holds, which is close to 50% retracement of 0.9406 to 1.4689 at 1.2048. However, firm break of 1.2061 support will argue that USD/CAD has already started a long term down trend. Next target is 61.8% retracement of 0.9406 to 1.4689 at 1.1424.
GBP/JPY Weekly Outlook
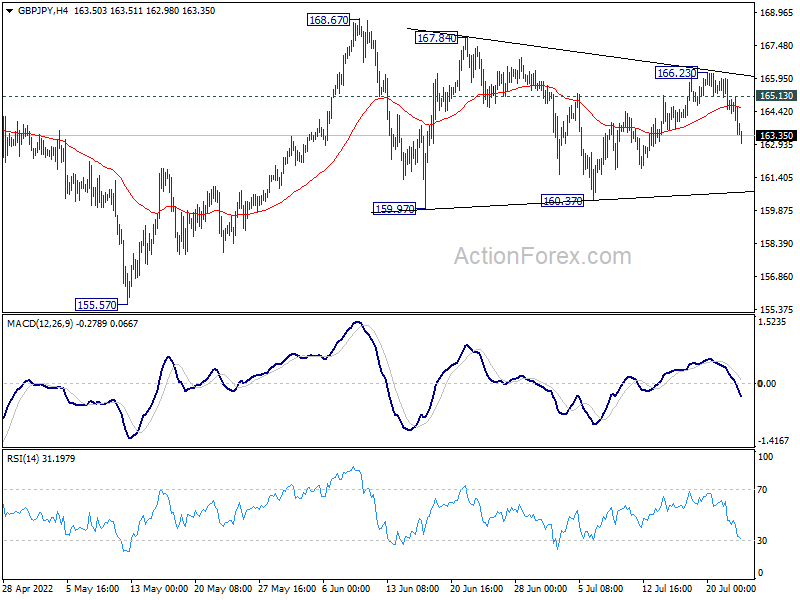
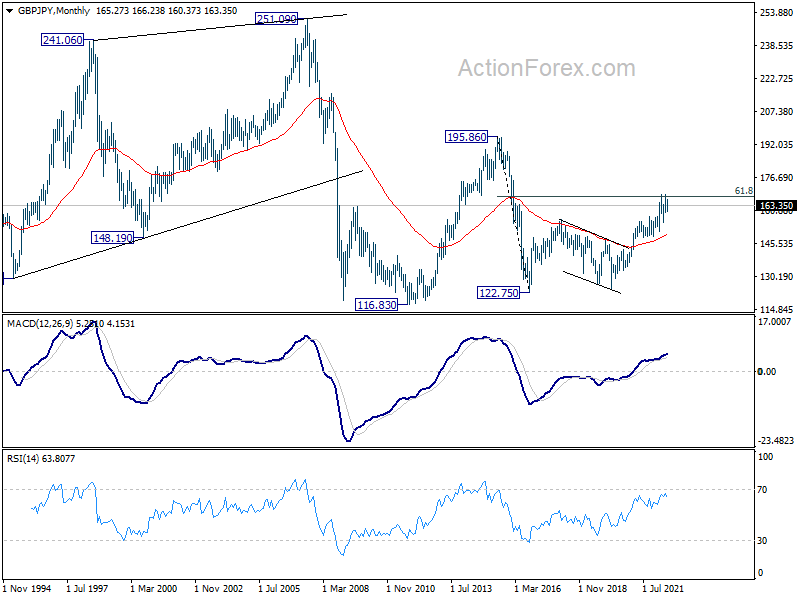
GBP/JPY edged higher to 166.23 last week but reversed from there. The development argues that corrective pattern from 168.67 is extending with another falling leg. Initial bias is mildly on the downside this week for 160.37 support. On the upside, above 165.13 minor resistance will turn bias back to the upside for 166.23 resistance again.
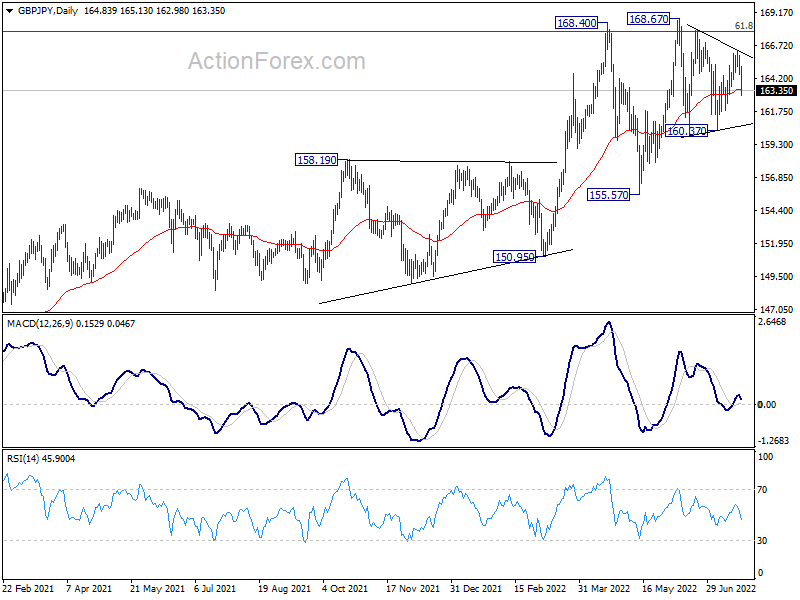
In the bigger picture, up trend from 123.94 (2020 low) is still in progress. Sustained break of 61.8% retracement of 195.86 (2015 high) to 122.75 (2016 low) at 167.93 will be a long term bullish signal, and could pave the way back to 195.86 high. This will now remain the favored case as long as 155.57 support holds, even in case of deep pull back.
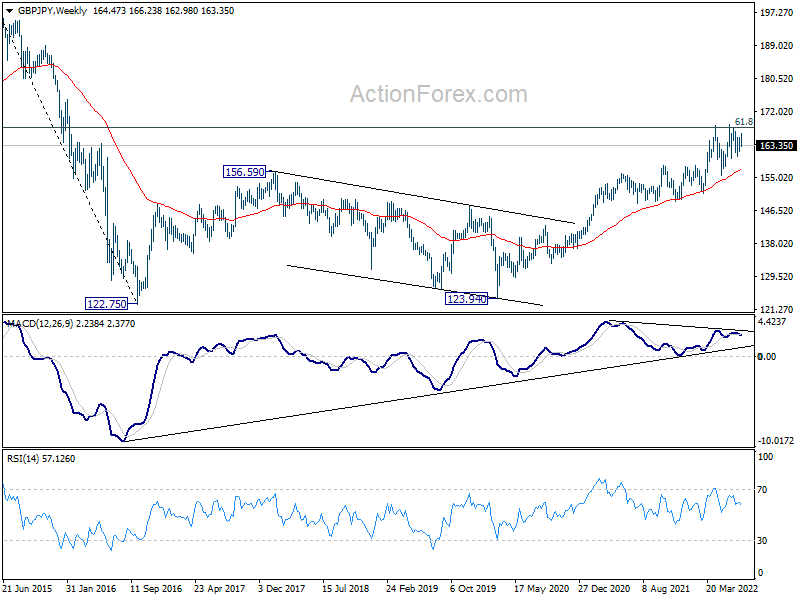
In the longer term picture, rise from 122.75 could be the third leg the the pattern from 116.83 (2011 low). Further rise will remain in favor as long as 55 month EMA (now at 149.84) holds. Sustained break of 61.8% retracement of 195.86 to 122.75 at 167.93. will pave the way to 195.86 (2015 high).
EUR/JPY Weekly Outlook
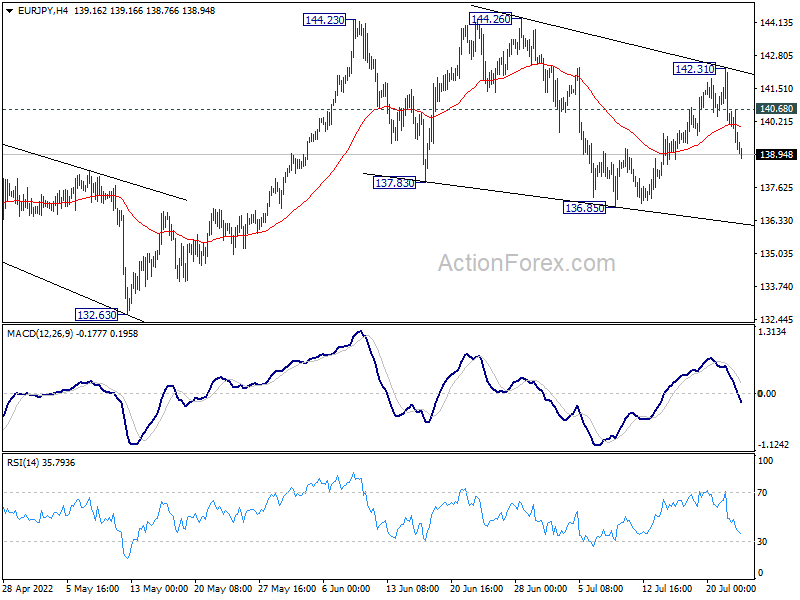
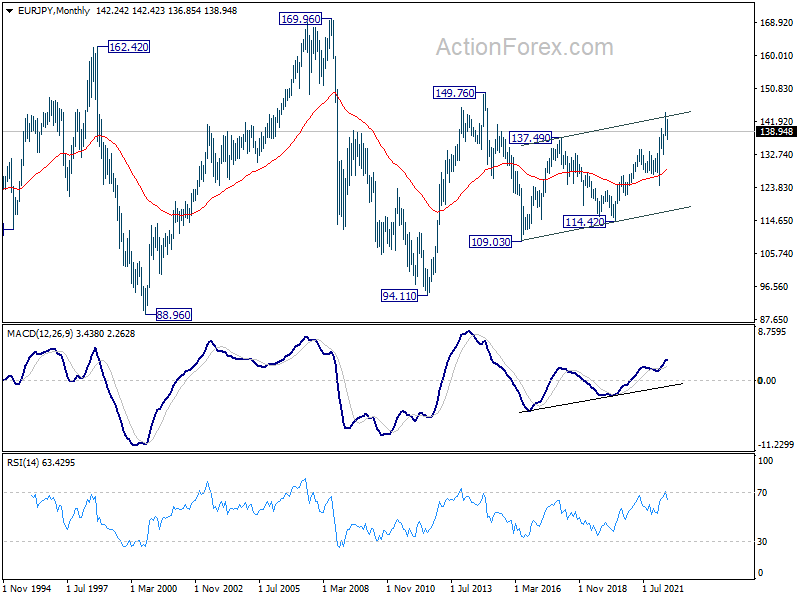
EUR/JPY rose to 142.31 last week but reversed from there. The development suggests that correction pattern from 144.23 is extending with another falling leg. Initial bias stays mildly on the downside this week for 136.85 support. On the upside, above 140.68 minor resistance will turn bias back to the upside for 142.31 resistance instead.
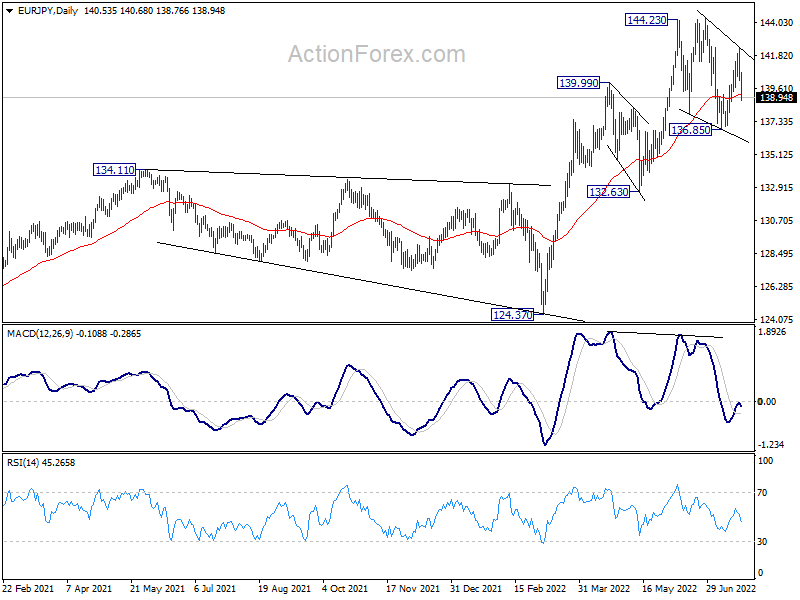
In the bigger picture, up trend from 114.42 (2020 low) is seen as the third leg of the pattern from 109.30 (2016 low). Further rally is in favor as long as 134.11 resistance turned support holds, even in case of deep pull back. Next target is 149.76 (2015 high). However, sustained break of 134.11 will be a sign of medium term bearish reversal and turn focus to 124.37 support for confirmation.
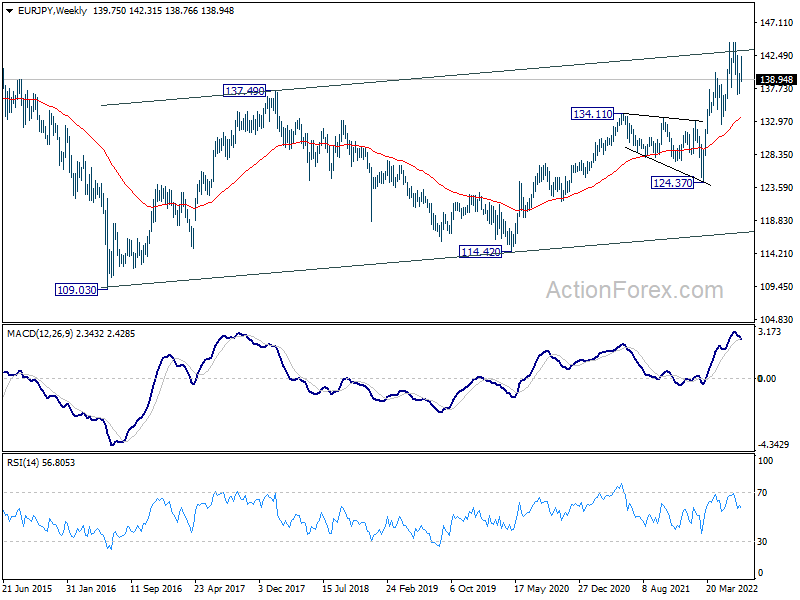
In the long term picture, current rally could be resuming whole rise from 94.11 (2012 low). Further rally would be seen to 149.76 resistance (2014 high) and above. This will remain the favored case as long as 134.11 resistance turned support holds.
EUR/GBP Weekly Outlook
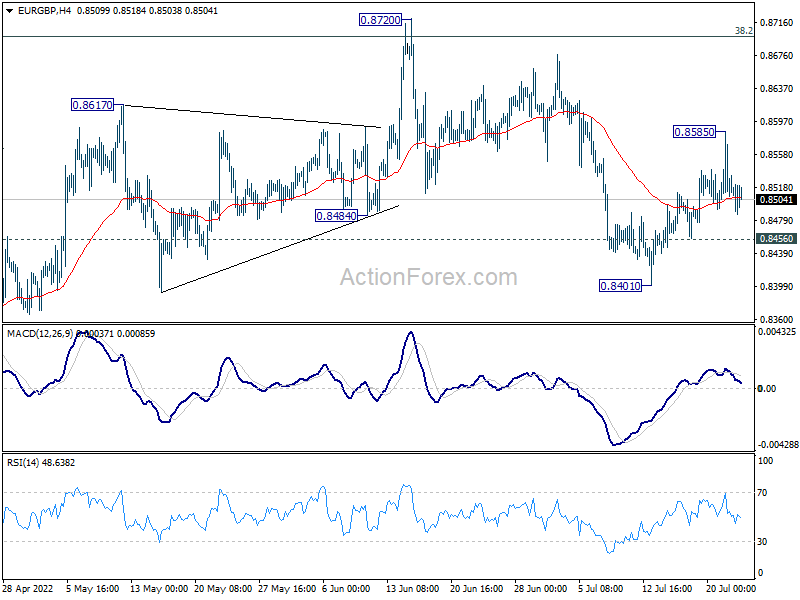
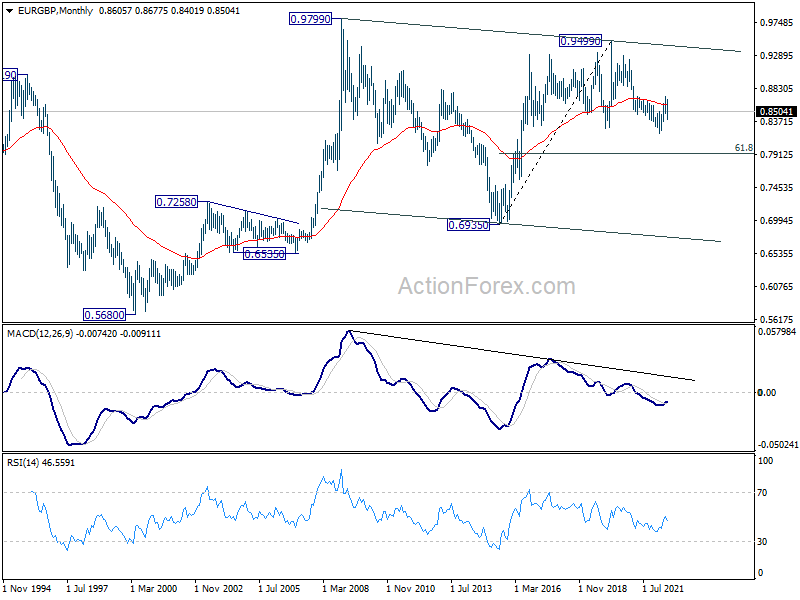
EUR/GBP rebounded strongly to 0.8585 last week but retreated since then. Initial bias is neutral this week first. Further rise will remain mildly in favor as long as 0.8456 minor support holds. Above 0.8585 will target a retest on 0.8720 resistance. However, break of 0.8456 should resume the fall from 0.8720 through 0.8401.
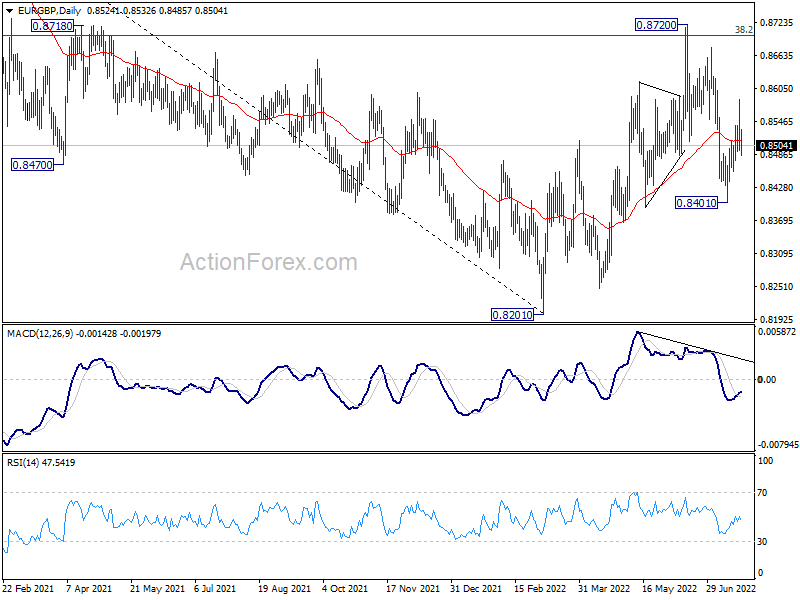
In the bigger picture, attention remains on 38.2% retracement of 0.9499 to 0.8201 at 0.8697. Sustained break there will affirm the case that rise from 0.8201 is a medium term up trend itself. Further rally would then be seen to 61.8% retracement at 0.9003. However, rejection by 0.8697 will confirm medium term bearishness for another fall through 0.8201.
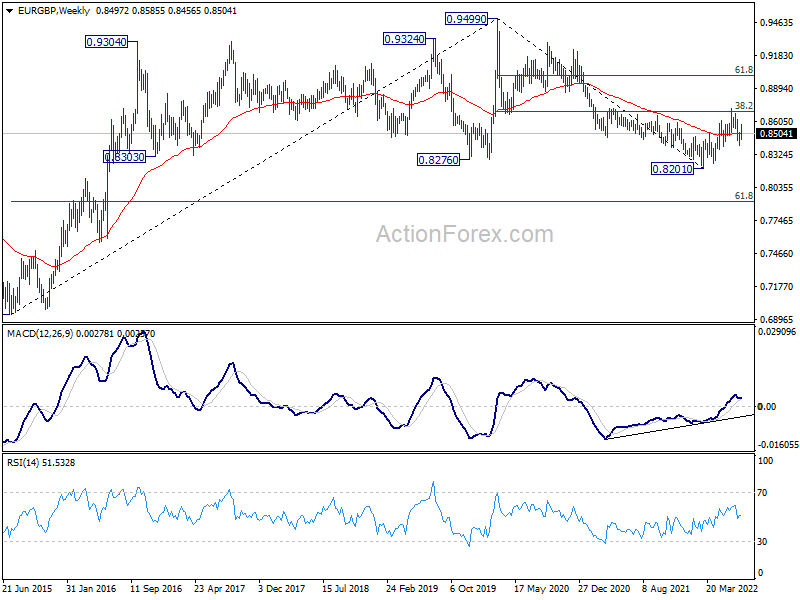
In the long term picture, the lack of medium term downside momentum suggests that fall from 0.9499 (2020 high) is merely a correction to rise from 0.6935 (2015 high). In case of another fall, downside should be contained by 61.8% retracement of 0.6935 to 0.9499 at 0.7917 to bring rebound. Sustained trading above 55 month EMA (now at 0.8604) will indicate that the correction has completed and bring retest of 0.9499.
EUR/AUD Weekly Outlook
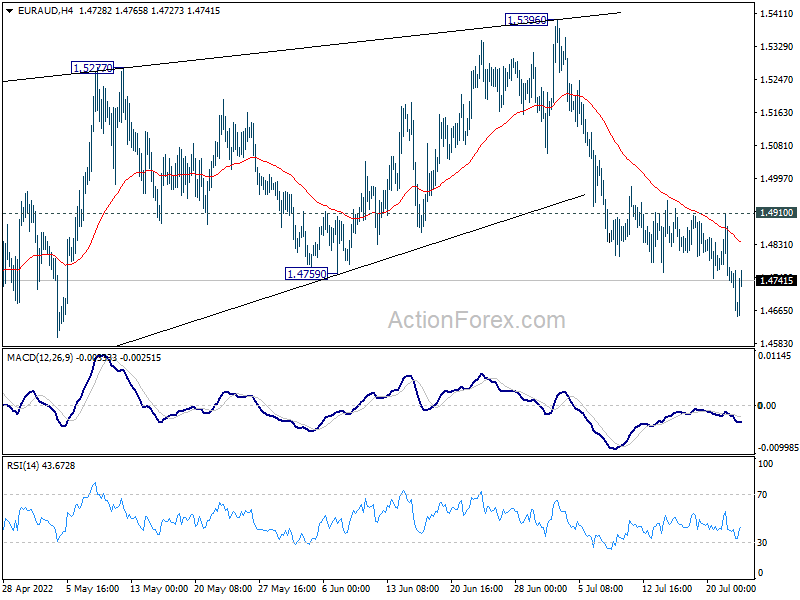
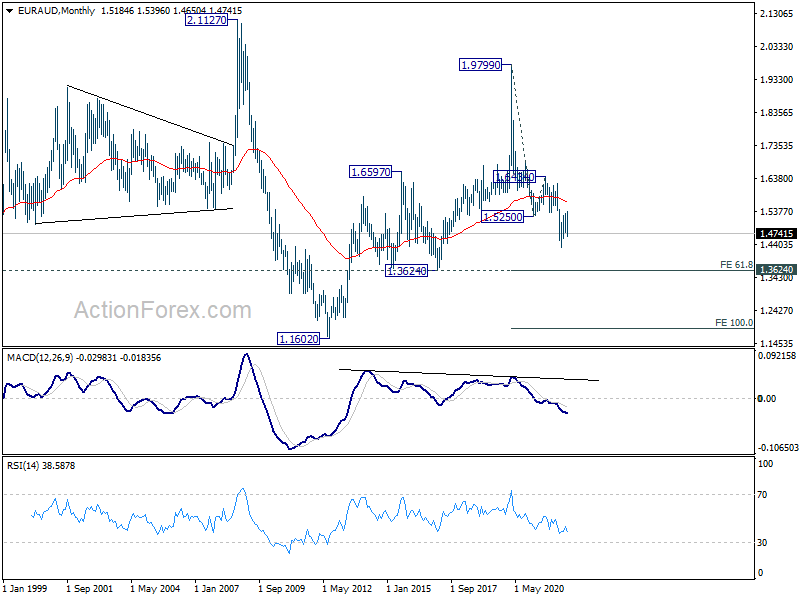
EUR/AUD's fall from 1.5396 resumed last week and hit as low as 1.4650. As noted before, corrective rise from 1.4318 should have completed at 1.5396, after rejection by 1.5354 support turned resistance. Deeper decline should be seen to retest 1.4318 low first. On the upside, above 1.4910 minor resistance will dampen this bearish view, and turn bias back to the upside for stronger rebound.
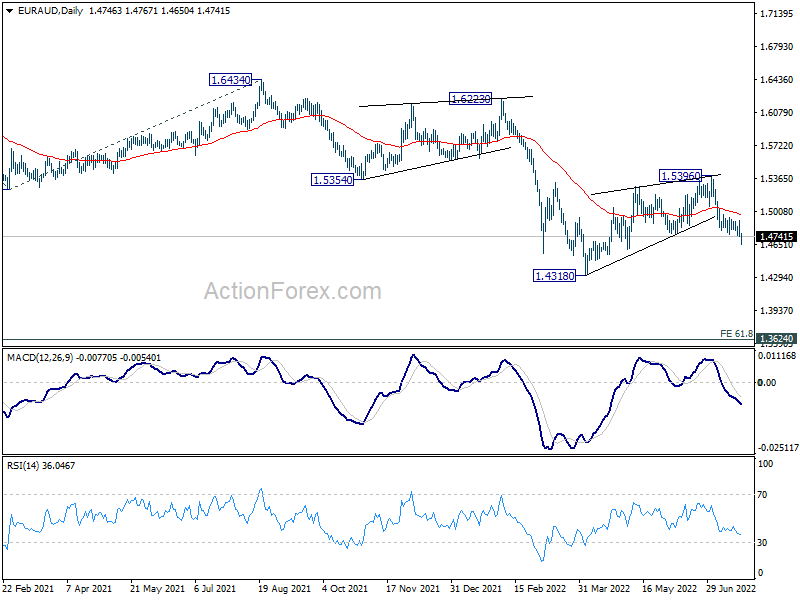
In the bigger picture, rejection by 1.5354 support turned resistance, as well as 55 week EMA (now at 1.5378), maintain medium term bearishness. That is, larger down trend from 1.9799 is not completed yet. Break of 1.4318 low will target 61.8% projection of 1.9799 to 1.5250 from 1.6434 at 1.3623, which is close to 1.3624 long term support (2017 low). This will remain the favored case now as long as 1.5396 resistance holds.
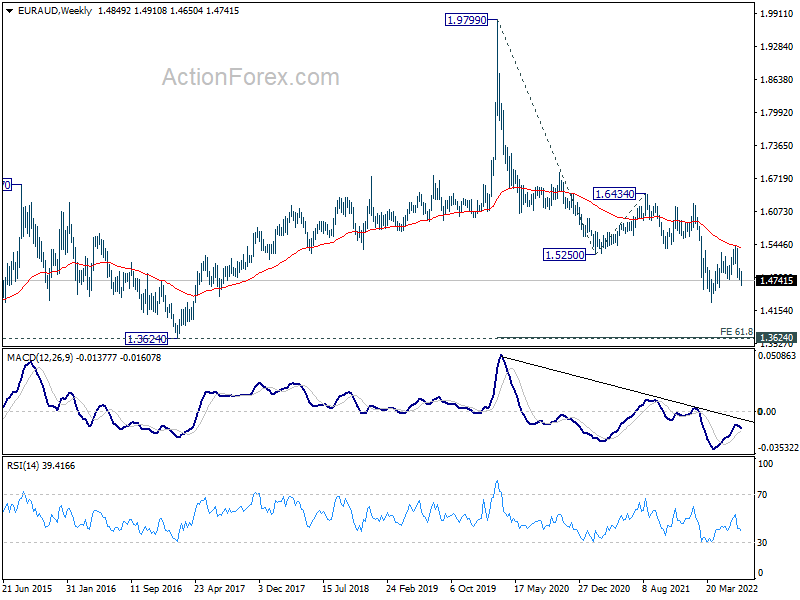
In the longer term picture, fall from 1.9799 (2020 high) is seen as the third leg of the pattern from 2.1127 (2008 high). Deeper fall should be seen to 1.3624 support. Decisive break there would pave the way back to 1.1602 (2012 low). This will remain the favored case as long as 55 month EMA (now at 1.5660) holds.
EUR/CHF Weekly Outlook
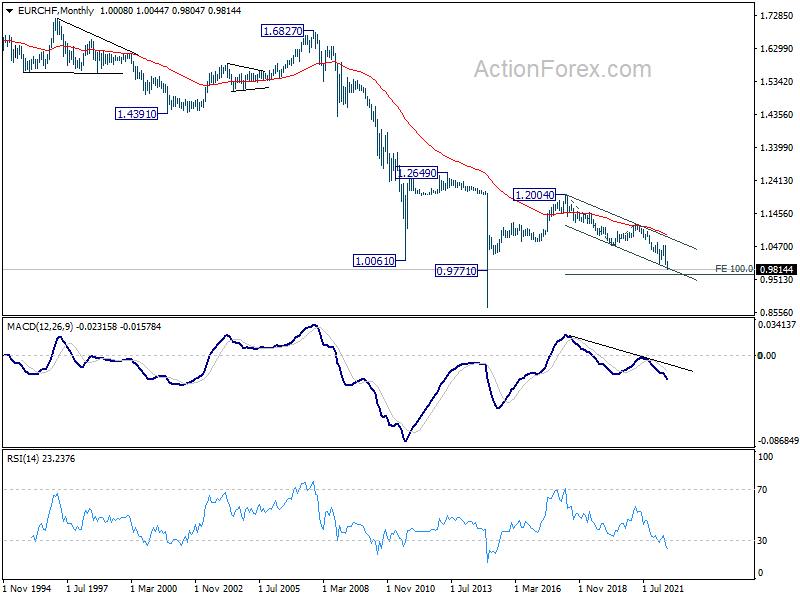
EUR/CHF's recovery was capped by 0.9953 minor resistance last week, but stayed above 0.9804 low. Initial bias remains neutral this week and further fall is expected. On the downside, break of 0.9804 will resume larger down trend. Next target is 0.9650 long term projection level. On the upside, however, break of 0.9953 minor resistance will suggest short term bottoming, and bring stronger rebound to 55 day EMA (now at 1.0097).
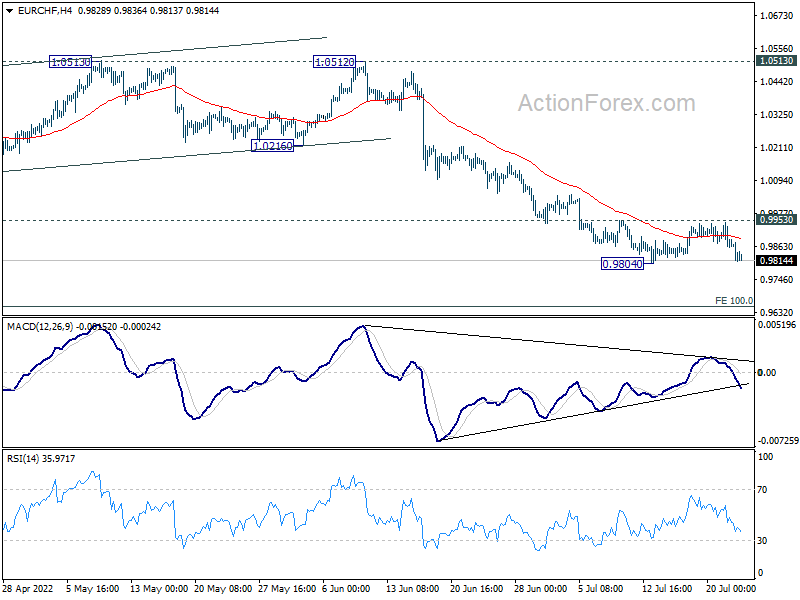
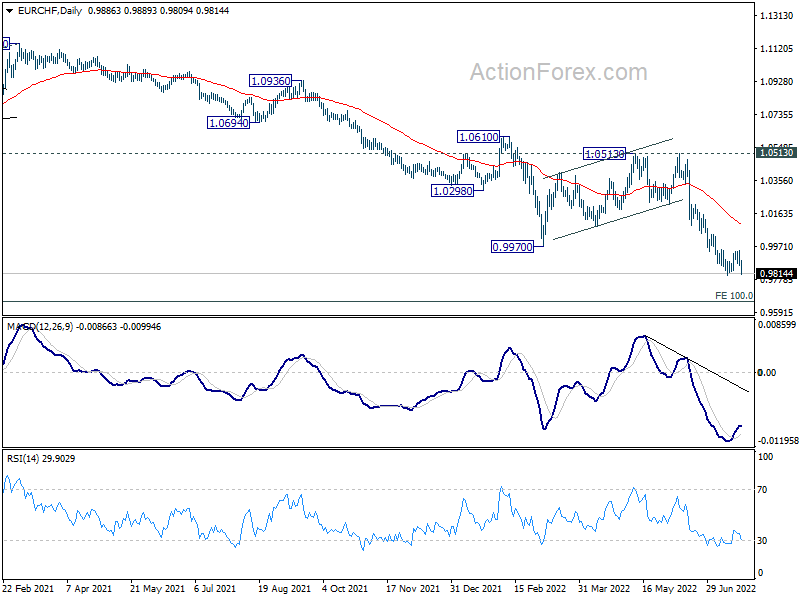
In the bigger picture,long term down trend from 1.2004 (2018 high) is expected to target 100% projection of 1.2004 to 1.0505 to 1.1149 at 0.9650. On the upside, break of 1.0513 resistance is needed to indicate medium term bottoming. Otherwise, outlook will stay bearish in case of strong rebound.
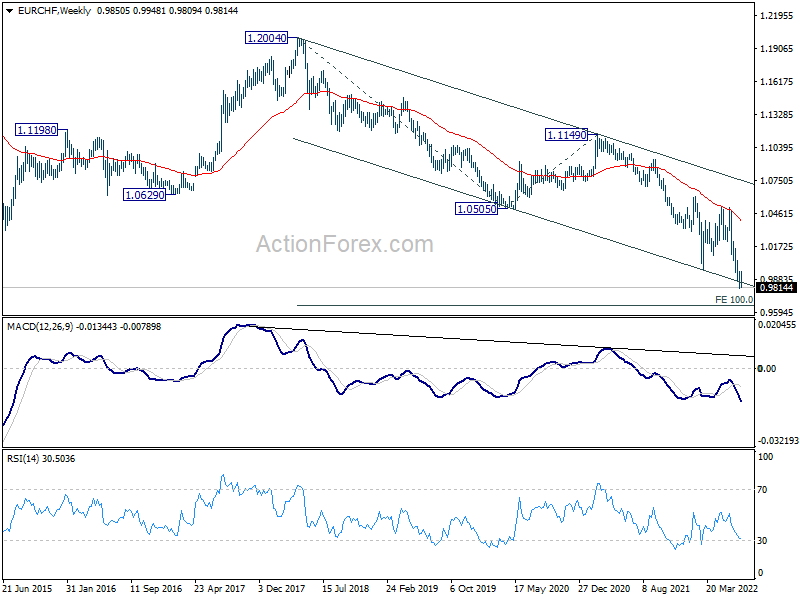
In the long term picture, capped below 55 month EMA, EUR/CHF is seen as extending the multi-decade down trend. There is no prospect of a bullish reversal until some sustained trading above the 55 month EMA (now at 1.0808).
Yield Curve Inversion and Recession Risks, Dollar the Worst Performer of the Week
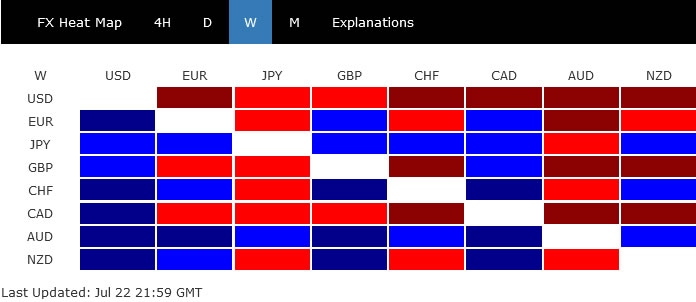
Dollar ended as the worst performing one last week. Selloff somewhat intensified on Friday after poor PMIs indicated that the US economy was already in contraction. Deep fall in benchmark treasury yields dragged down the greenback while traders were betting on a lower terminal rate in Fed's tightening cycle. Canadian Dollar was the second weakest, followed by Sterling.
Euro received just very brief lift from the larger than pre-committed rate hike by ECB and ended mixed. Even Swiss Franc was stronger, as Eurozone PMIs also raised recession risks. But Yen jumped towards the end of the week, in particular against Dollar, on falling yields. But Aussie managed to secure to first place.
Yield curve inversion and Fed to be the focuses
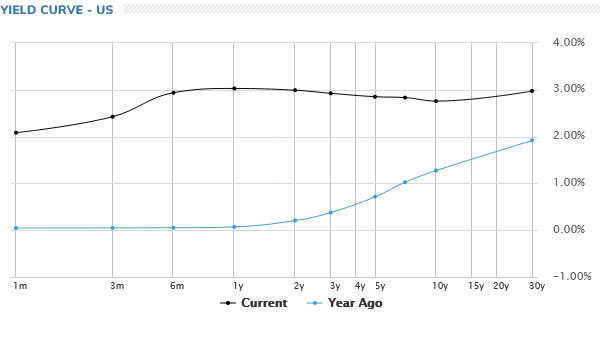
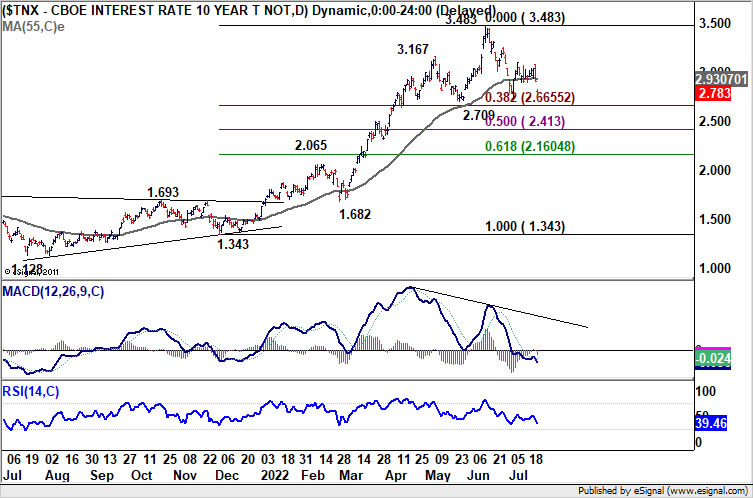
Yield curve inversion in the US has been a topic in the past few weeks. It will certain come back into spotlight again this week, after Friday's steep fall in 10-year yield to close at 2.783, comparing to 2-year yield at 2.991.
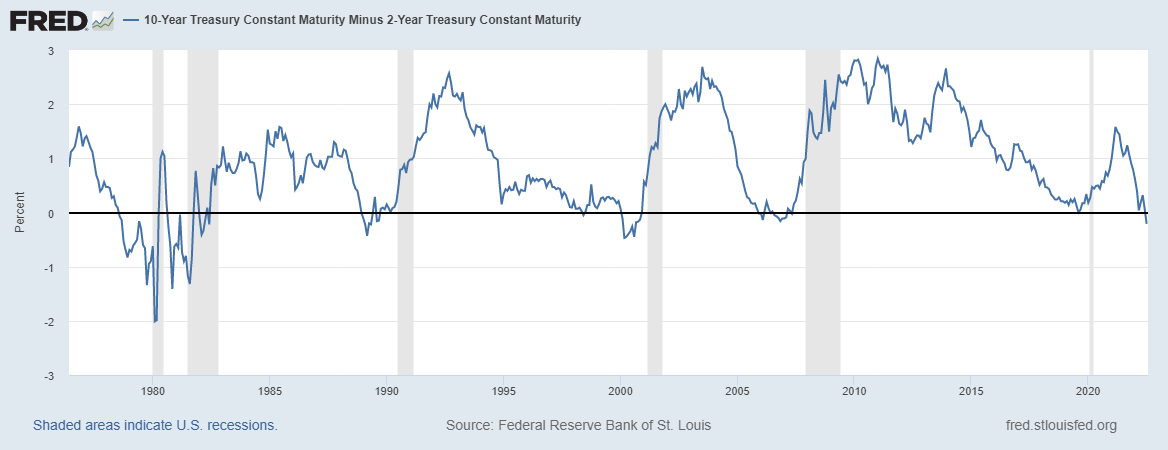
When it comes to the predictive power of recession, there are always three parameters to consider. It's which part of the yield curve, the depth, and then the duration of the inversion.
As for the depth of the inversion of the 2-year to 10-year yield, it now surpassed that during 2006, prior to the global financial crisis in 2008-9. In terms of duration, 3 weeks are considered a little short, but there is no sign of improvement.
Some economists believed that the curve of 3-month to 10-year yield is the most recession predictor. With 3-month yield currently at 2.425%, this part of the curve remains pretty safe.
Technically, strong support is still expected around 2.709 in 10-year yield, and 38.2% retracement of 1.343 to 3.483 at 2.665 to act as the floor of the consolidation from 3.483 high. However, strong break of 2.665/709 could send 10-year yield further lower to 50% retracement at 2.413. That will, at least, flatten the 3-month to 10-year curve. Further fall to 61.8% retracement at 2.160 should definitely seal the deal of inversion, and recession, possibly a relatively prolonged one.
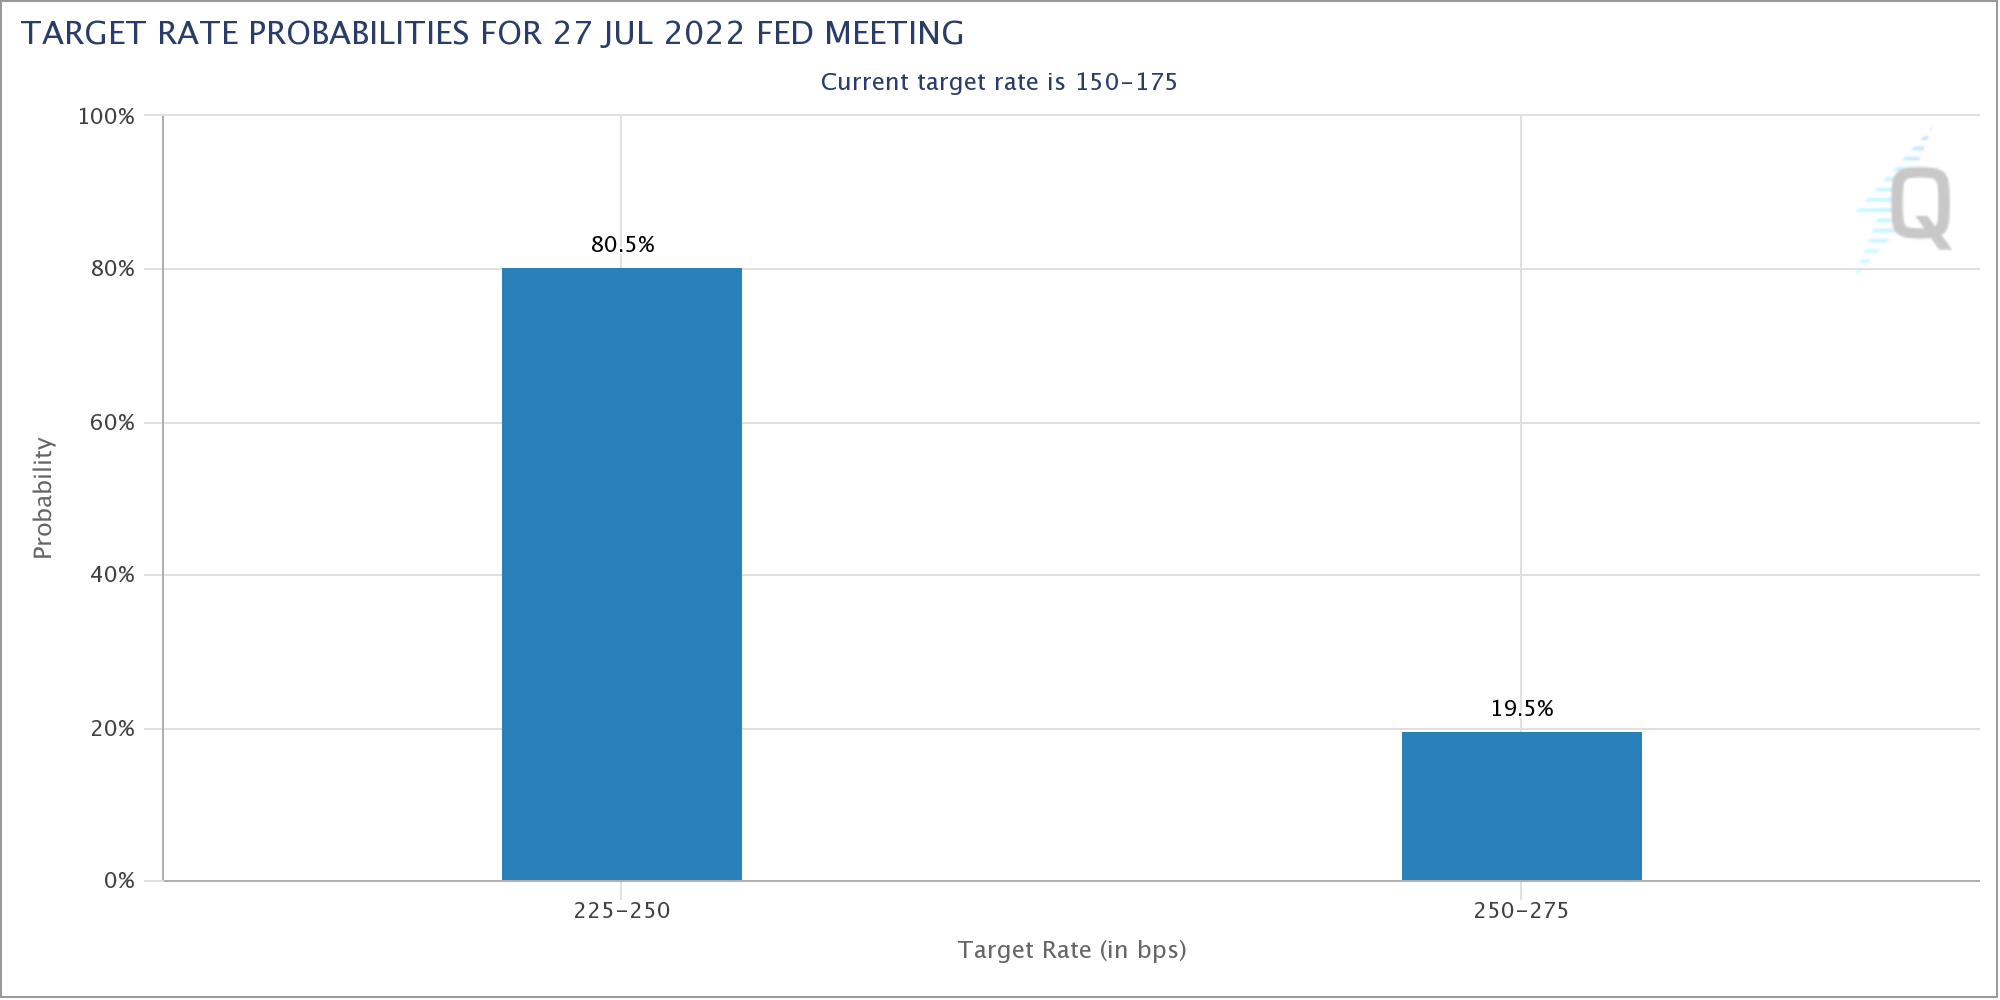
As for Fed, markets are now pricing 80.5% chance of another 75bps hike on July 27 this week. There is little chance of an upside surprise there, after the very poor US PMI data last week, which was already indicative of -1% annualized GDP contraction. The question now is Fed Chair Jerome Powell's view on recession risks, as well as any indication on a slowdown in tightening pace from September and onwards.
NASDAQ rebound lacks buying, vulnerable to another fall
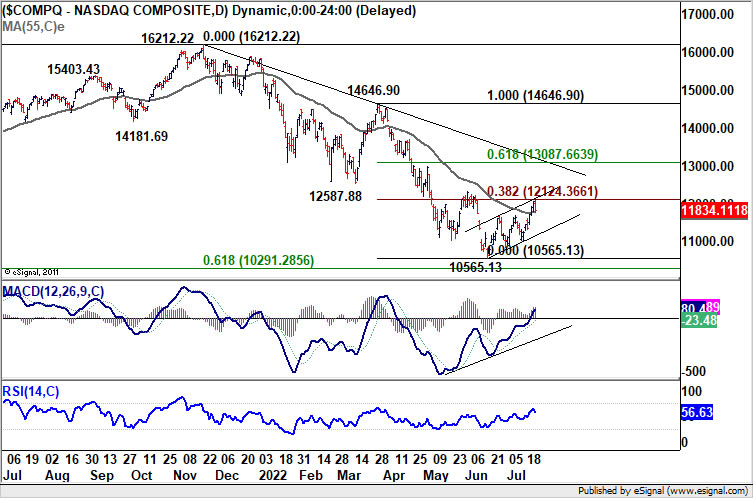
The rebound in US stocks was rather disappointing last week. NASDAQ clearly struggled to find enough buying to push through 38.2% retracement of 14646.90 to 10565.1 at 12124.36, with coincides with near term channel resistance. Rejection by this channel will keep the rebound from 10565.13 corrective, which maintains bearishness in the index. Sustained trading below 55 day EMA (now at 11776.15) could set the stage for at least another fall to retest 10565.13, or 61.8% retracement of 6631.42 to 16212.22 at 10291.28. Such development could come if recession worries intensify.
Dollar index drawing support from first fibonacci level
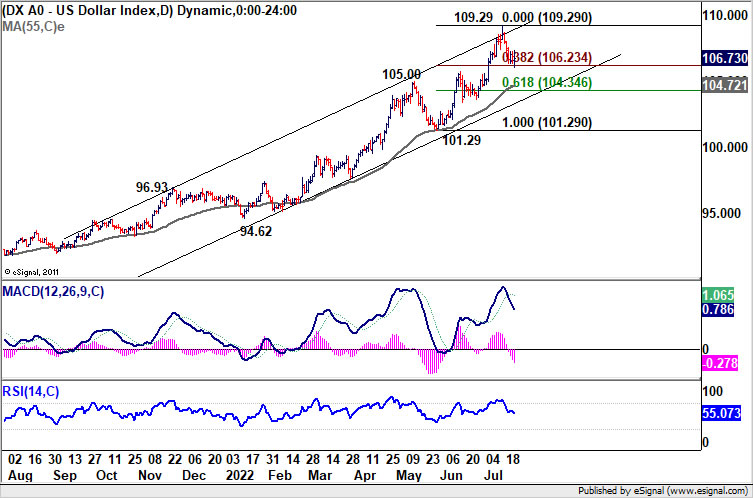
Dollar index's decline last week should have confirmed short term topping at 109.29. That came as the greenback was dragged down by falling US benchmark yields. Additionally, traders were probably already pricing in a lower terminal rate in the current tightening cycle of Fed.
Initial support was found at 38.2% retracement at 101.29 to 109.29 at 106.23. Stabilization at the current level should help set the range of a relatively brief near term consolidation. However, should 10-year yield break through above mentioned 2.66/70 support zone, it's highly likely that DXY will follow and target 55 day EMA (now at 104.72), which is inside 101.29/105.00 support zone. Such development, if happens, could mean that Dollar index has already started a medium term correction, which could last much longer and extend deeper.
EUR/USD, USD/JPY and Gold
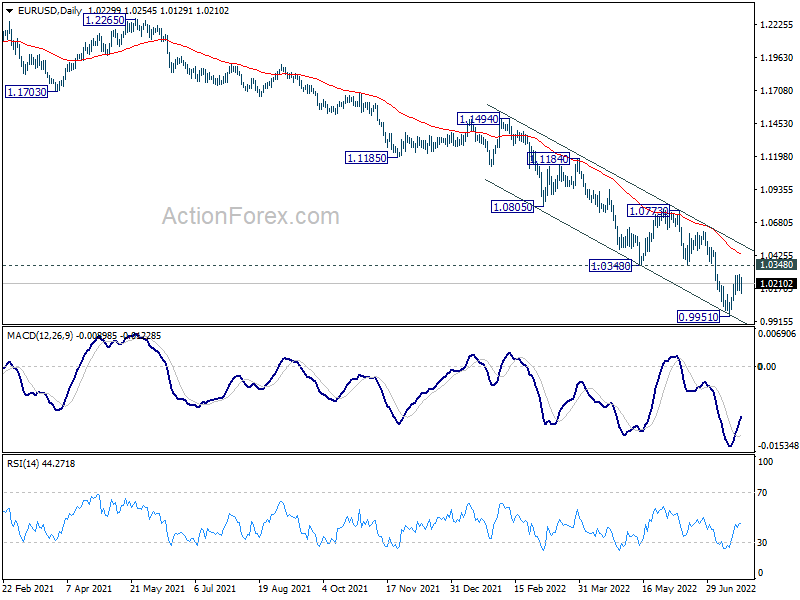
EUR/USD struggled to extend the rebound from 0.9951 last week, despite ECB's surprised 50bps rate hike. Yet, retreat from 1.0227 was shallow, keep more upside in favor. The key resistance is 1.0348 support turned resistance. Firm break there will raise the chance of medium term bottoming at 0.9951, after defending parity, and put channel resistance at 1.0514 in focus. Such development could come if 10-year yield break through the above mentioned 2.66/70 support zone, or with any downbeat warning from Fed Powell.
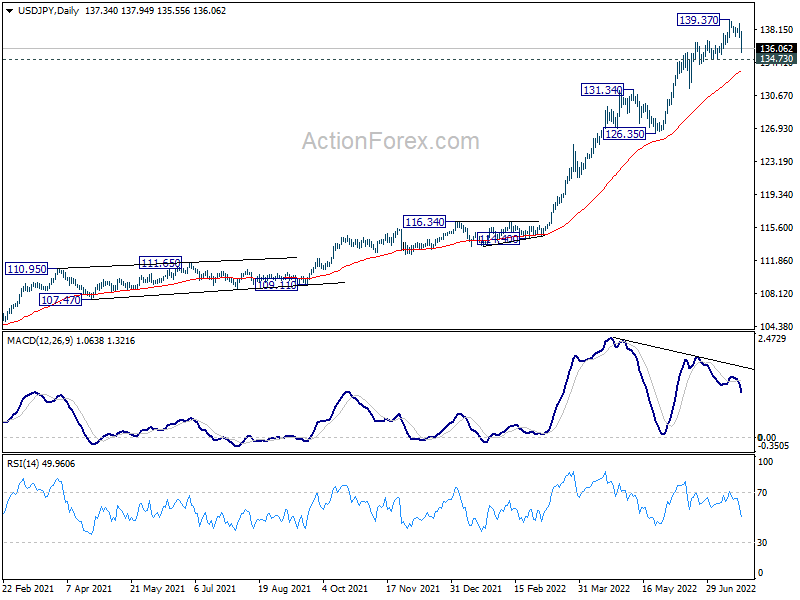
At this same time, while it's still early to conclude, the risk of a deeper medium term correction in USD/JPY is growing. Bearish divergence condition in daily MACD is already a bad sign for the pair. Break of 134.73 support would likely send USD/JPY through 55 day EMA (now at 133.37) into 126.35/131.34 support zone. Such development could come as Yen responds more than Dollar to the next risk-off selling in stocks, as well as deeper pull back in benchmark yields.
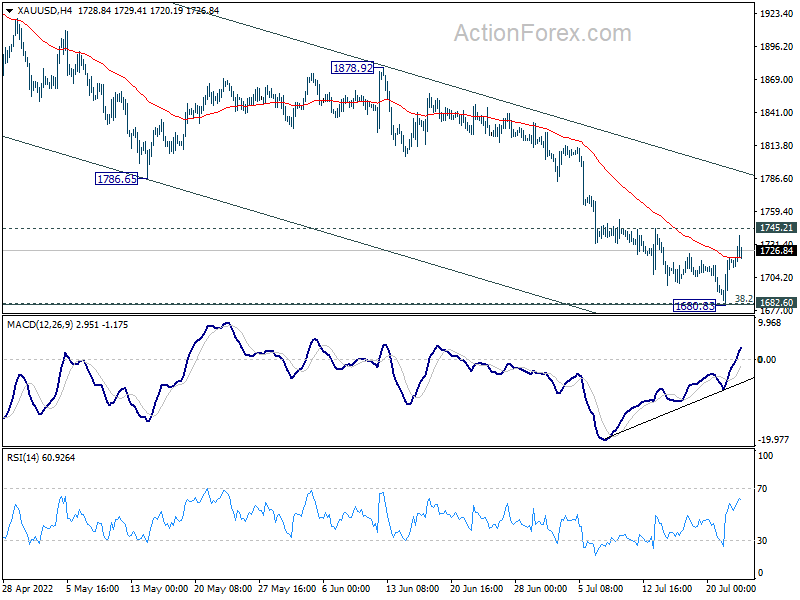
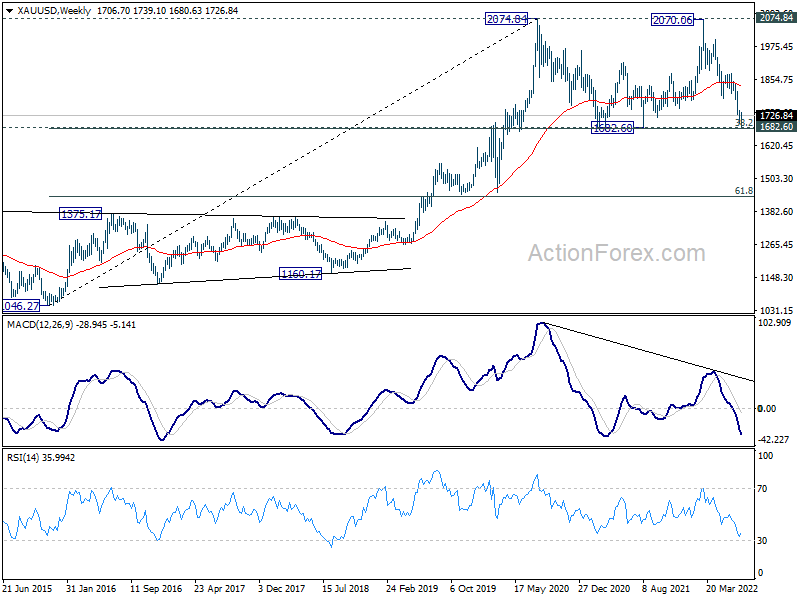
Gold is another one to look at for gauging the odds for deeper selloff in Dollar. While dipping further to 1680.83, Gold quickly recovered to close at 1726.84. It's mentioned a couple of times that fall from 2070.06 is seen as the third leg of the consolidation pattern from 2074.84. Strong support is expected at 1682.60, with 38.2% retracement of 1046.27 to 2074.84 at 1681.92, to complete the pattern. Break of 1745.21 minor resistance will now be a sign of short term bottoming and bring stronger rise back to 1786.65/1878.92 resistance zone.
EUR/CHF Weekly Outlook
EUR/CHF's recovery was capped by 0.9953 minor resistance last week, but stayed above 0.9804 low. Initial bias remains neutral this week and further fall is expected. On the downside, break of 0.9804 will resume larger down trend. Next target is 0.9650 long term projection level. On the upside, however, break of 0.9953 minor resistance will suggest short term bottoming, and bring stronger rebound to 55 day EMA (now at 1.0097).
In the bigger picture,long term down trend from 1.2004 (2018 high) is expected to target 100% projection of 1.2004 to 1.0505 to 1.1149 at 0.9650. On the upside, break of 1.0513 resistance is needed to indicate medium term bottoming. Otherwise, outlook will stay bearish in case of strong rebound.
In the long term picture, capped below 55 month EMA, EUR/CHF is seen as extending the multi-decade down trend. There is no prospect of a bullish reversal until some sustained trading above the 55 month EMA (now at 1.0808).
Summary 7/25 – 7/29
Monday, Jul 25, 2022
[php_everywhere instance="1"]
Tuesday, Jul 26, 2022
[php_everywhere instance="2"]
Wednesday, Jul 27, 2022
[php_everywhere instance="3"]
Thursday, Jul 28, 2022
[php_everywhere instance="4"]
Friday, Jul 29, 2022
[php_everywhere instance="5"]
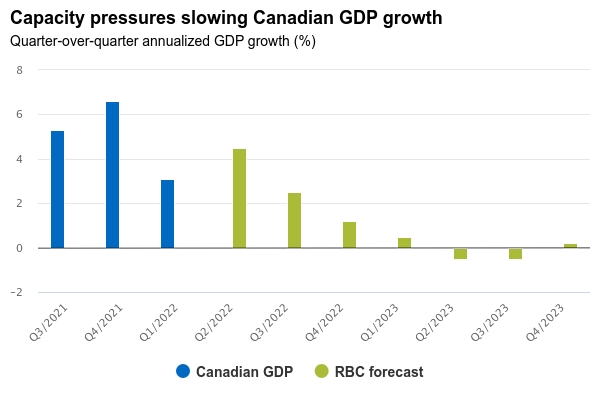
Forward Guidance: GDP Growth Slowing as Capacity Constraints Bind
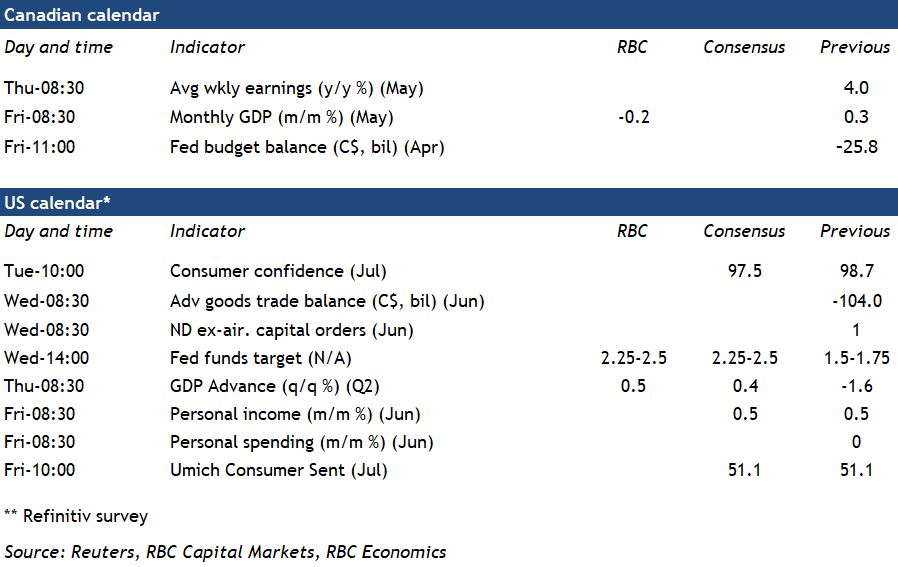
Canadian GDP likely declined in May – in line with the 0.2% drop in Statistics Canada’s preliminary estimate a month ago. We do not expect another drop in June. Auto production bounced back after another round of factory shutdowns in May. Activity in the oil & gas sector has increased on higher global energy prices. And economy-wide hours worked jumped by 1.3% after declining in each of April and May.
There is still substantial momentum in labour markets with demand for staff outstripping the supply of available unemployed workers. And near-term momentum in consumer spending still looks strong with spending on travel and hospitality services recovering from the pandemic. But the pace of growth is clearly slowing as the economy bumps up against long-run production capacity limits, and housing markets have already shifted substantially into reverse. Home resales are down 27% since March and prices starting to decline.
The U.S. has hit capacity constraints earlier than Canada with GDP already declining outright in Q1 of this year and our own tracking calls for little change in next week’s estimate for Q2. Labour market data has been stronger – hours worked rose almost 3% (annualized rate) in Q2. And industrial production jumped over 6%. But wages have continued to surge as acute labour shortages intensify, feeding further domestic price pressures. Against that backdrop, the U.S. Federal Reserve is more focused on cooling demand to address inflation than growth risks. We look for the Fed to hike the fed funds target range by another 75 basis points (to 2.25% to 2.50%) next week.
Week ahead data watch:
- Canada average weekly earnings are expected to trend higher in May after a 0.2% increase in April. The latest Canadian Survey of Consumer Expectations indicated that Canadians continue to anticipate modest wage growth over the next 12-months
- US consumer spending likely jumped higher in June – although largely due to higher prices. Personal incomes also likely rose with both hours worked and hourly wages rising in June