Sample Category Title
Yen Rebounds on Lower US Yields
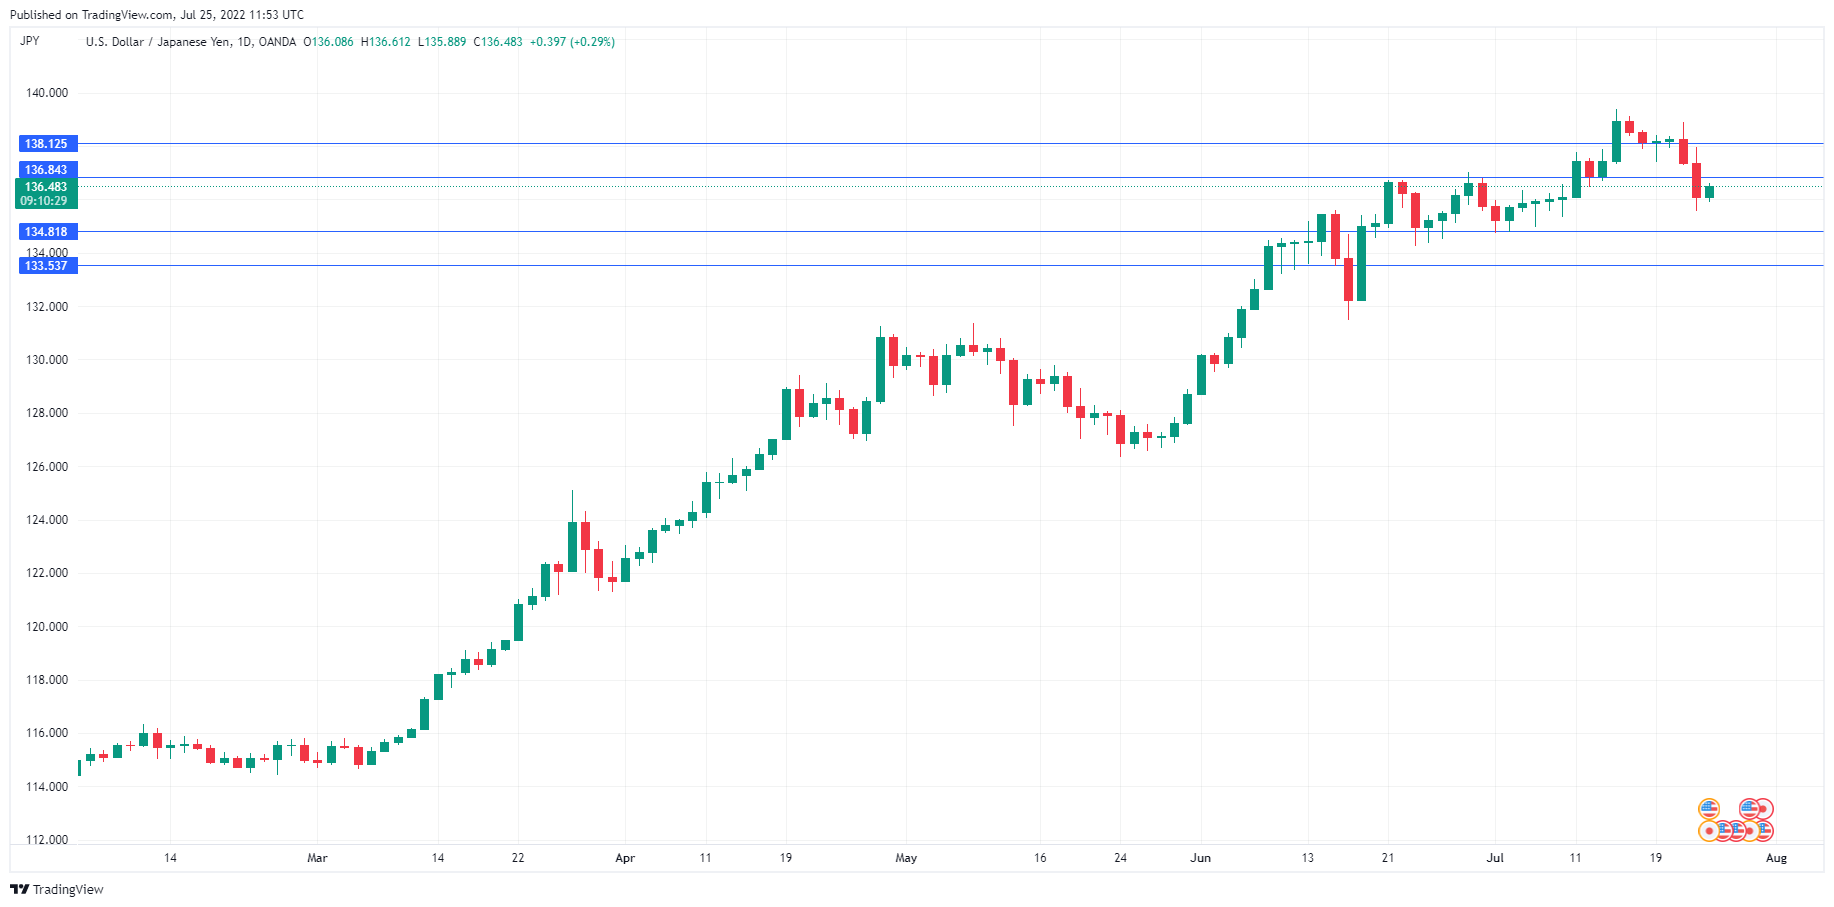
The yen is lower at the start of the week. USD/JPY is trading at 136.53, up 0.34%.
For a change, the yen enjoyed a winning week against the dollar, the first in two months. During that time, USD/JPY has soared about 7.9% and touched a 20-year high of 139.39 earlier in July. This led to speculation that the yen might break above another milestone, this one being the 140 level. However, the yen has since settled down.
Yen jumps on lower US yields
The driver behind USD/JPY remains US yields, as the Bank of Japan continues to exercise strict yield curve control. An aggressive Federal Reserve has pushed US yields higher, widening the rate differential and causing misery for the yen. However, US yields have corrected lower, allowing the yen to make a recovery and move some distance from the symbolic 140.00 line. If US yields move sharply lower this week, the USD/JPY could fall as low as 132.00.
The yen’s most recent slide has shown that the BoJ and Japan’s Ministry of Finance appear unwilling to intervene in order to prop up the yen, with Japanese officials focused on maintaining loose policy in order to support the ailing Japanese economy. USD/JPY broke above 130 and 135 with barely a protest out of Tokyo, which leads me to believe that if there is a line in the sand when it comes to the yen, it is not at 140.00. This means that many market participants might choose to remain long on USD/JPY and try to test 140.00, although that remains a risky stance.
The week kicks off with the BOJ minutes from the June meeting and BoJ Core CPI, the Bank’s preferred inflation indicator. The index has been on the rise and climbed to 1.5% in May, up from 1.4% a month earlier.
USD/JPY Technical
- USD/JPY has support at 134.81 and 133.53
- There is resistance at 136.84, followed by 138.12
GBP/USD: Cable Probes Again Through 1.20 Barrier
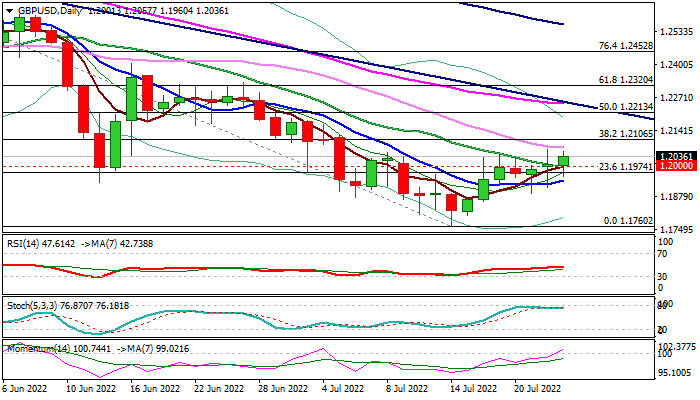
Cable regained traction on Monday and rose again above psychological 1.20 barrier which resisted several attacks last week.
Fresh bulls are supported by rising momentum as 14-d momentum indicator emerged into positive territory and last week’s bullish close, the first in four weeks.
However, bulls need an initial signal on eventual close above 1.20 level, with stronger reversal signal requiring extension and close above pivotal Fibo resistance at 1.2106 (38.2% of 1.2666/1.1760) that would open way for stronger recovery.
Conversely, failure at 1.20 or stall under 1.2106 would add to negative signal and keep the downside at risk.
All eyes at the key events this week (US consumer confidence, Fed policy meeting, US Q2 GDP) with Fed taking the centre stage.
The US central bank is widely expected to raise interest rate for another 0.75%, but investors will be focusing on Fed’s view on inflation, with two scenarios – inflation is peaking or it may rise further.
This would add to Fed’s outlook on the economy, but will also indicate the central bank’s next steps, particularly about the expected action in September’s policy meeting.
Bank of England’s policy meeting next week is also in focus, along with political turmoil after resignation of PM Johnson and two possible successors.
The BoE is likely going to raise its interest rate by 0.5% next week, with most of economists expecting another 0.5% hike in September, that will add to pound’s volatility.
Res: 1.2074; 1.2106; 1.2188;1.2213.
Sup: 1.2000; 1.1940; 1.1890; 1.1861.
Australia Q2 Inflation to Confirm 50bps Rate Gike?
Inflation figures in Australia tend to have a somewhat outside impact, because the country is somewhat unique in only reporting CPI changes once a quarter. Normally, when there isn't much fluctuation in inflation, that isn't much of a problem. But with the wide variations in prices lately, investors are much more interested in knowing what's going on with consumer prices and what the RBA is going to do about it.
The latest commentary from the RBA has Governor Lowe disclosing that the Board discussed what a "neutral rate" would be. What central bankers mean by "neutral rate" is at what policy interest rate will maintain price stability. In a sense, it's kind of where the central bank is expecting interest rates to rise to. It's not a fixed number, since it keeps varying depending on circumstances.
Where things are headed
Lowe said the Board thinks the neutral rate is "at least" 2.5%. And that it could be higher if inflation expectations pick up. The rate is currently at 1.35% (after the unusual less-than a quarter % cut during the pandemic), meaning that there are at least five "rate hikes" between now and where the RBA thinks policy is "neutral". And given that the consensus of expectations of inflation for Q2 are for another increase, that number of rate hikes could even be higher.
So far, analysts are pretty much in agreement that the RBA will hike by 50 bps at their meeting next week. The higher the inflation rate we get tomorrow, the more that consensus is likely to solidify. It would be the third consecutive "double" rate hike, and there isn't much expectation that the RBA will move faster than that. So, where we could see some market turmoil is if the inflation figure comes in below expectations.
What to look out for
There are several CPI figures released at the same time, and they have different purposes. What the RBA pays attention to for monetary policy purposes is the Trimmed Mean CPI. But, the overall inflation rate has more implications for fiscal policy, and particularly for currency flows. With commodity currencies showing potential for growth as their central banks fight inflation, it's not just monetary policy that drives the currencies.
Australia's Q2 Trimmed Mean CPI is expected to show 1.5% increase quarterly, up from 1.4% in the first quarter. On an annual basis, it's expected to increase to 4.7% from 3.7% prior. This is quite a bit lower than other major economies, but given the source of the price increases, it's more of a concern for the Reserve Bank. Housing costs are keeping regulators on their toes.
The other important factors
The headline inflation rate is actually expected to show a quarterly decrease to 1.8% from 2.1% in the first quarter. But when compared to the prior year, it's expected to accelerate to 6.2% compared to 5..1%. An important part of this can be attributed to fuel prices averaging a lower price in the second quarter, and that Australia is entering the winter when there is less demand for energy for home cooling. That number of rate hikes could even be higher.
With expectations in an inflation acceleration, what rate hikes will the #RBA announce, how may their decisions affect the markets?
Bitcoin: A Week-Long Landing after a Shot Up
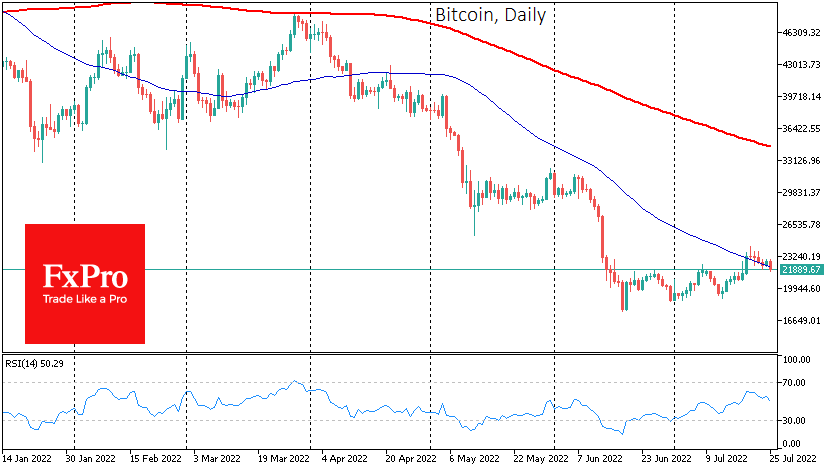
Bitcoin rose 5.3% over the past week, finishing near $22,300. However, the cryptocurrency’s intra-week dynamics are not so rosy, as a moderate downtrend has returned to the market since July 20. Ethereum also declined for most of the week but added 6.6% at the end, to $1525.
The total capitalisation of the crypto market, according to CoinMarketCap, is back to $1009bn at the time of writing, although it was rising to $1082bn in the first half of last week. Bitcoin’s dominance index fell 0.5 percentage points to 41.5% over the same period.
The cryptocurrency fear and greed index rose 10 points to 30 for the week and moved into “fear” from “extreme fear”.
Bitcoin blew an opportunity to consolidate above its 50-day moving average, and for the sixth consecutive trading session, it has been circling that downward curve.
Bitcoin shot off like a rocket last Monday and Tuesday but has been on a gentle descent ever since.
This is a significant signal that the bearish trend remains dominant, and most active players stick with the “sell on the rise” strategy. The technical oversold has already been removed, so there is nothing to deter the bears from a new attack.
The medium-term market participants should prepare for a new test of last month’s support of around 19000. Another bullish success could inspire the buyers. But it’s still worth paying attention to stock performance. If they continue to melt away, big support won’t hold on.
According to Citigroup, the acute phase of deleveraging and panic in the markets is over. According to Arcane Research, major institutions have sold more than 236K bitcoins since May 10, worth more than $5.4 billion.
Luna Foundation Guard’s liquidation of BTC collateral was the largest, with more than 80,000 BTCs sold. Tesla got rid of 29,060 BTC. Another 24,500 bitcoins were sold by the Canadian exchange fund Purpose BTC. Miners sold more than 19,000 BTC between May and June. Boston Consulting Group, Bitget and Foresight Ventures presented a joint study that estimates the number of cryptocurrency users will reach 1 billion by 2030.
WTI: Oil Remains Under Pressure by Growing Demand Concerns
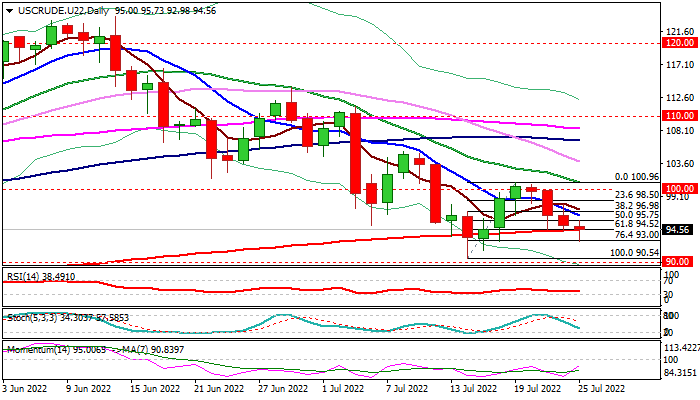
WTI oil remains at the back foot and extends weakness to one-week low ($92.88) on Monday.
Oil prices are weighed by growing demand concerns as the US central bank is expected to make another big rate hike this week that threatens of further slowing of the global economy, with weaker China’s economic recovery (the latest data showed that China narrowly escaped a contraction in the second quarter) adding to worries that demand for oil would weaken.
Signals that Libya is boing to increase oil output to 1.2 million barrels per day would add to supply side and ease market tightness, marking an additional pressure on oil prices.
Also, the European Union said it would ease sanctions to Russian state-owned companies to sell oil to third countries that would further weigh on prices.
Fresh weakness broke through important support at $94.50 (Fibo 61.8% retracement of $90.54 / $100.96 / 200DMA) with sustained break here to generate fresh bearish signal and bring in focus key supports at $90.54/00 (July 14 low / psychological).
Daily technical studies remain in bearish setup and support the action, with additional negative signal developing on monthly chart as oil is on track for the second consecutive strong monthly fall, last seen in Mar/Apr 2020.
Res: 95.75; 96.52; 96.98; 97.92
Sup: 93.00; 91.62; 90.54; 90.00
USD/JPY: Pullback Found a Footstep Well Above Key Support
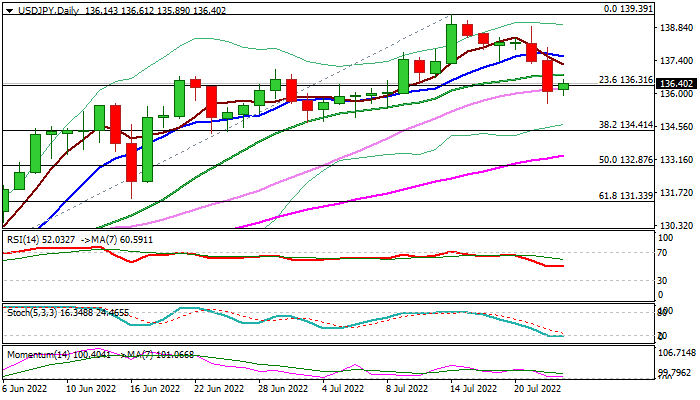
The USDJPY is consolidating in early Monday after strong bearish acceleration last Thu/Fri that extended pullback from new 24-year high to two-week low (135.57).
Friday’s close below initial Fibo support at 136.31 (23.6% of 126.36/139.39 upleg) generated negative signal which was boosted by weekly bearish engulfing on the first weekly close in red in 8 weeks.
Pullback found temporary footstep as stochastic on daily chart entered oversold territory, RSI turned north from neutrality 50-territory and momentum moved into sideways mode above the negative zone borderline.
Overall picture remains bullish and sees current pullback preceding fresh push higher and dips are likely to provide better buying opportunities.
Scenario of bounce on pullback’s stall at 135.57 would require initial signal on close above 20DMA (136.82), with extension above 10DMA (137.59) to confirm reversal.
The second scenario includes deeper correction which should find firm ground at 134.40 zone (Fibo 38.2% / June higher base) to keep larger bulls in play.
Traders await Fed’s decision on Wednesday, with widely expected 0.75% rate hike, though 1% raise cannot be completely ruled out, despite sharply falling expectations percentage after initial euphoria seen last week.
US inflation remains high and Fed’s measures are expected to give results in some time that adds to expectations for a hawkish stance of Chief Powell’s outlook for coming months, which would offer fresh support to the US dollar.
Res: 136.81; 137.59; 137.95; 138.87.
Sup: 135.89; 135.57; 134.41; 134.26.
ECB Kazaks: September rate hike needs to be quite significant
ECB Governing Council member Martins Kazaks said that even after last week's 50bps hike, stronger rate hikes may not be over.
"I would not say that this was the only front-loading," Kazaks said. "I would say that the rate increase in September also needs to be quite significant."
Nevertheless, he admitted that uncertainty is clouding the plans for later moves.
Germany Ifo dropped to 88.6, on the cusp of recession
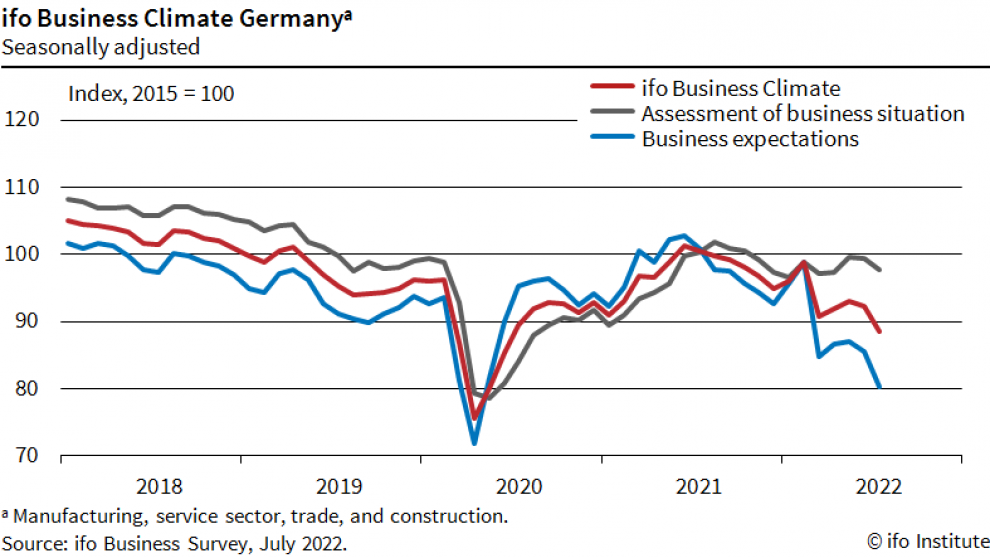
Germany Ifo Business Climate Dropped from 92.2 to 88.6 in July, below expectation of 90.5. That's the lowest level since June 2020. Current Assessment index dropped from 99.4 to 97.7, below expectation of 98.2. Expectations index dropped from 85.5 to 80.3, below expectation of 83.0.
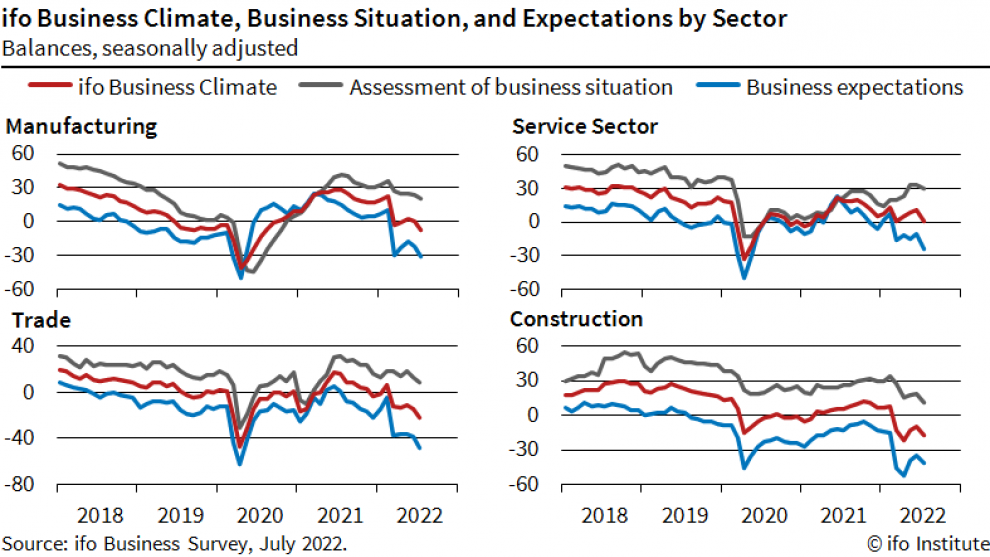
By sector, manufacturing dropped from 0 to -7.1. Services dropped from 10.9 to 0.9. Trade dropped from -14.7 to -21.6. Construction dropped from -9.7 to -17.0.
Ifo said: "Companies are expecting business to become much more difficult in the coming months. They were also less satisfied with their current situation. Higher energy prices and the threat of a gas shortage are weighing on the economy. Germany is on the cusp of a recession."
GBP/JPY Daily Outlook
Daily Pivots: (S1) 162.55; (P) 163.85; (R1) 164.69; More...
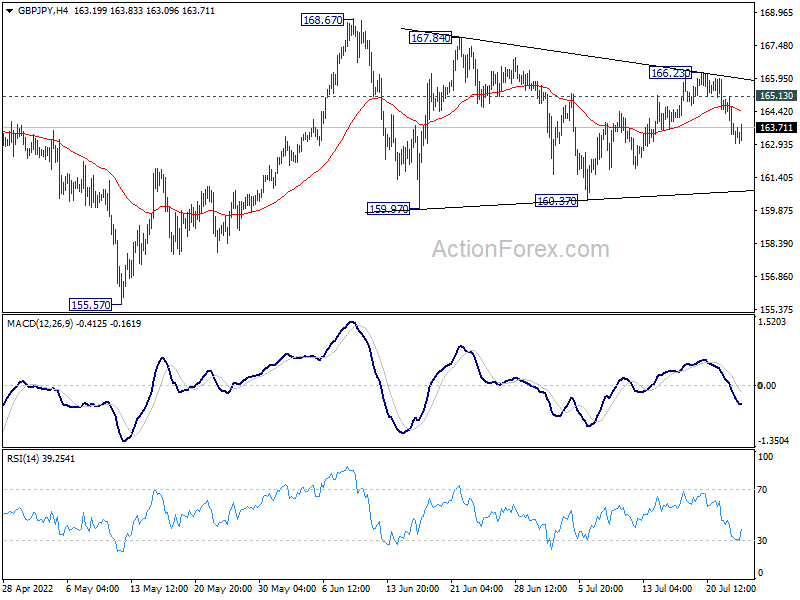
Intraday bias in GBP/JPY remains mildly on the downside at this point. Corrective pattern from 168.67 is extending with another falling leg. Initial bias is mildly on the downside this week for 160.37 support. On the upside, above 165.13 minor resistance will turn bias back to the upside for 166.23 resistance again.
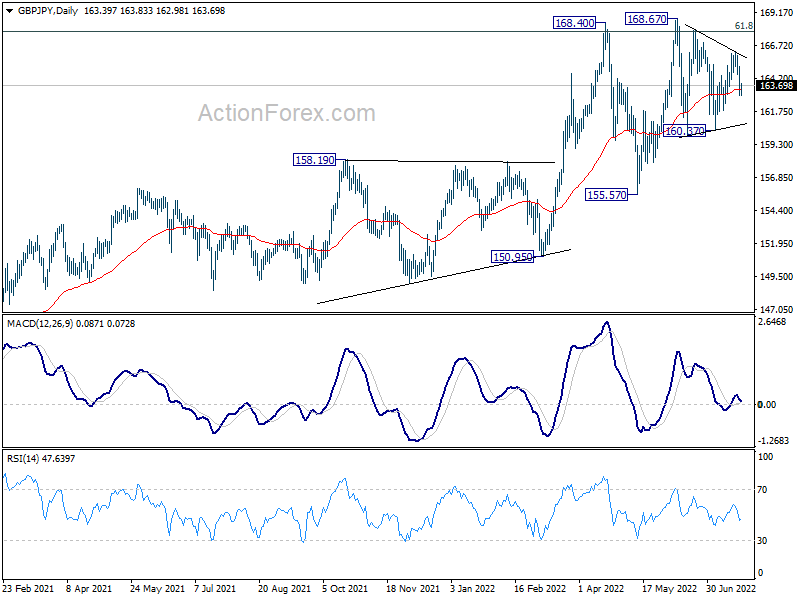
In the bigger picture, up trend from 123.94 (2020 low) is still in progress. Sustained break of 61.8% retracement of 195.86 (2015 high) to 122.75 (2016 low) at 167.93 will be a long term bullish signal, and could pave the way back to 195.86 high. This will now remain the favored case as long as 155.57 support holds, even in case of deep pull back.
EUR/JPY Daily Outlook
Daily Pivots: (S1) 138.26; (P) 139.48; (R1) 140.17; More....
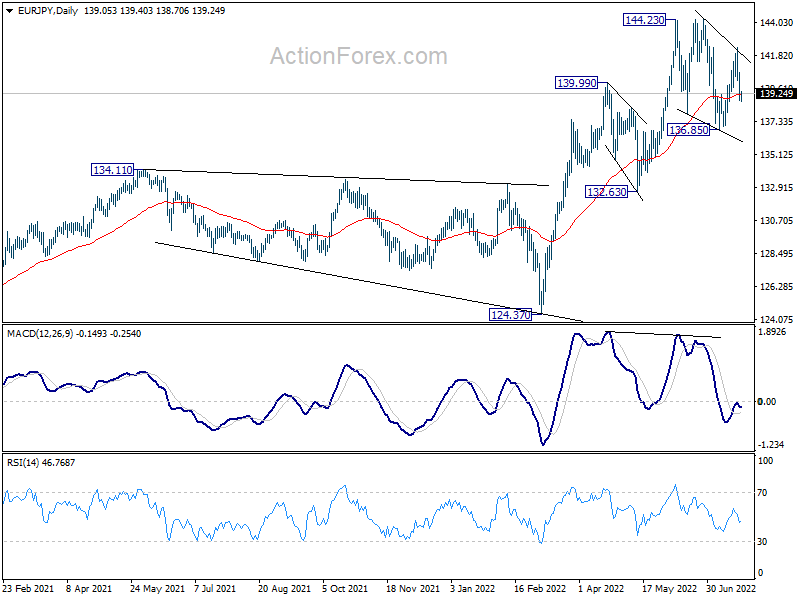
Intraday bias in EUR/JPY stays mildly on the downside at this point. Corrective pattern from 144.23 is extending with another falling leg. Deeper decline would be seen to 136.85 support. On the upside, above 140.68 minor resistance will turn bias back to the upside for 142.31 resistance instead.
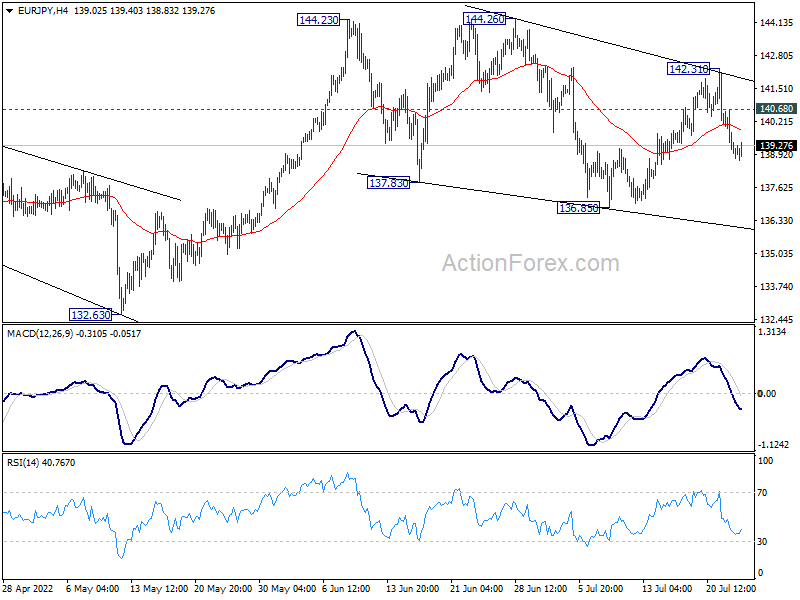
In the bigger picture, up trend from 114.42 (2020 low) is seen as the third leg of the pattern from 109.30 (2016 low). Further rally is in favor as long as 134.11 resistance turned support holds, even in case of deep pull back. Next target is 149.76 (2015 high). However, sustained break of 134.11 will be a sign of medium term bearish reversal and turn focus to 124.37 support for confirmation.