Sample Category Title
Dollar, Yen and Franc Soft in Quiet Cautious Markets
Markets continue to be very quiet in Asian session today. Investors are clearly holding their bets ahead of tomorrow's FOMC rate hike. Dollar is a softer one together with Yen and Swiss Franc. On the other hand, Canadian Dollar is firmer together with Aussie. Euro and Sterling are mixed. Generally speaking, most major pairs and crosses are still stuck inside last week's range.
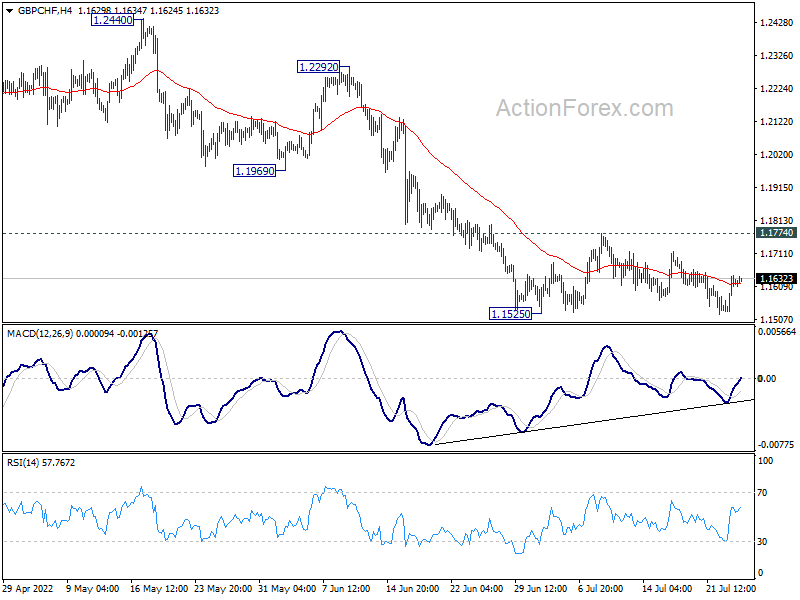
Technically, some attention remains on whether Sterling could build up more upside momentum. Levels to watch include 0.8456 minor support in EUR/GBP and 165.13 minor resistance in GBP/JPY. Additionally, 1.1774 minor resistance in GBP/CHF would be used as a gauge to determine buying in the Pound. Break there will complete a double bottom pattern, and set the stage for a stronger near term rebound at least.
In Asia, at the time of writing, Nikkei is down -0.22%. Hong Kong HSI is up 1.43%. China Shanghai SSE is up 0.60%. Singapore Strait Times is up 0.25%. Japan 10-year JGB yield is up 0.0077 at 0.214. Overnight, DOW rose 0.28%. S&P 500 rose 0.13%. NASDAQ dropped -0.43%. 10-year yield rose 0.037 to 2.820.
BoJ minutes: Board members spoke of importance of wage increases
In the minutes of June meeting, BoJ board said price rises have been broadening. But massive support is still needed for the economy while uncertainty surrounding the outlook was "extremely high".
"Many members spoke about the importance of wage increases from the perspective of achieving the BoJ's price target in a sustained and stable fashion."
"Japan must create a resilient economy at which consumption continues to rise even when companies raise prices," one board member said.
"The BOJ must maintain monetary easing until wage hikes become a trend, and help Japan achieve the bank's price target sustainably and stably," another member said.
Bitcoin and Ethereum stay bearish as rebound lost momentum
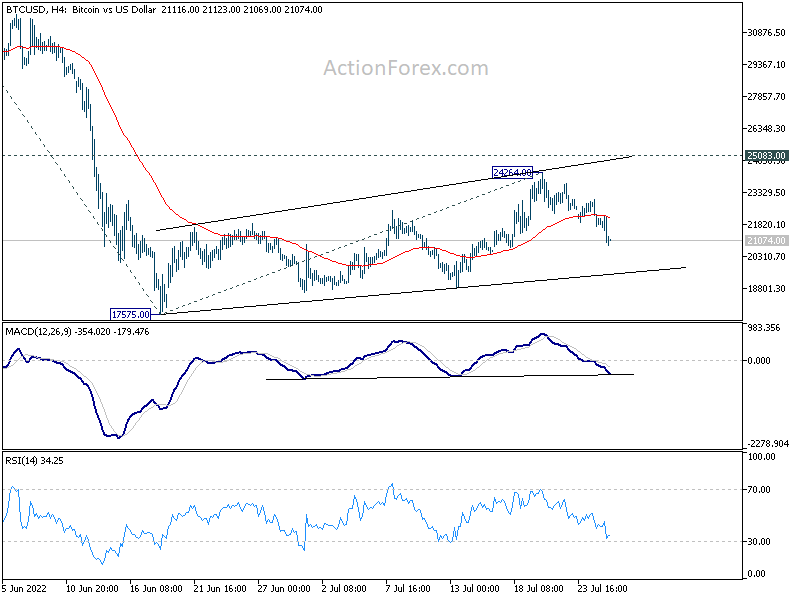
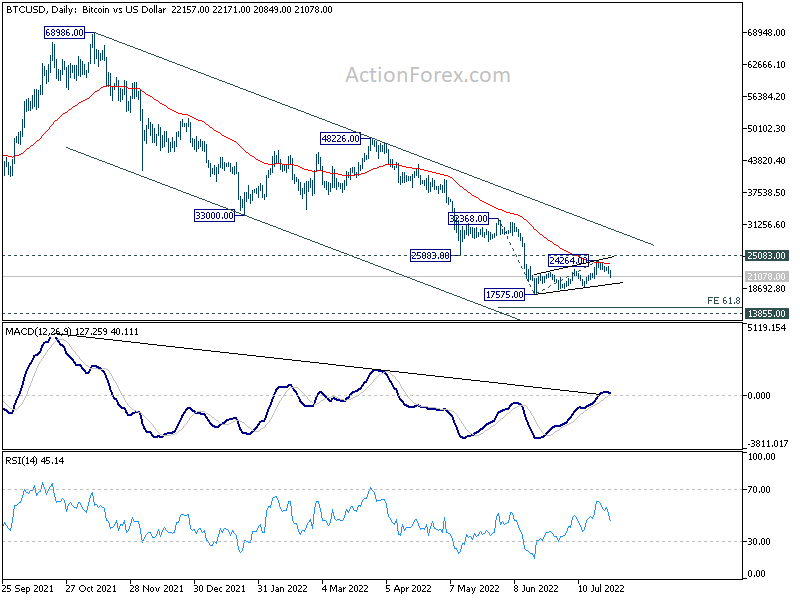
Bitcoin dips notably this week, following overall risk sentiment. Overall outlook stays bearish, with price actions from 17575 low displaying clear corrective structure. Upside of the recovery was also capped below 25083 support turned resistance. Rejection by 55 day EMA is also another bearish sign. On resumption, next target is 61.8% projection of 32368 to 17575 from 24264 at 15121.
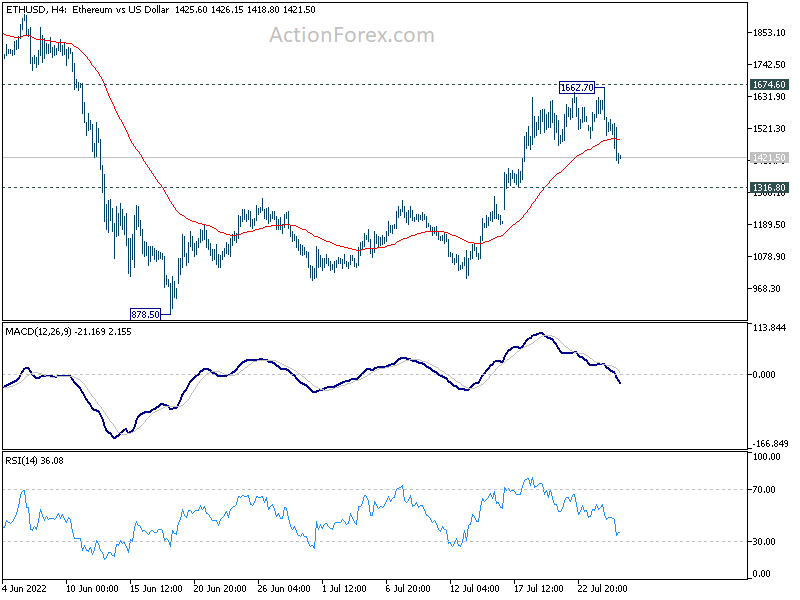
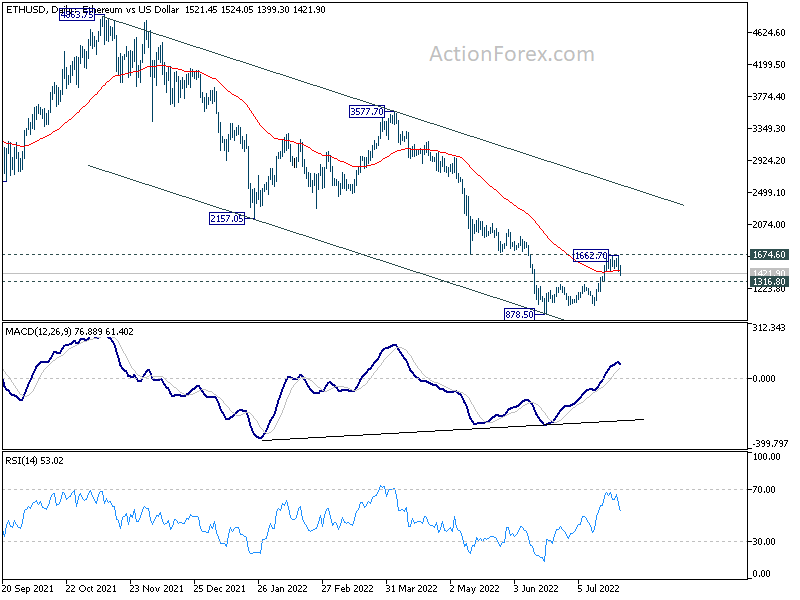
Ethereum's corresponding rebound from 878.50 low was relatively stronger, as it's support by medium term calling channel line. Yet, upside was also limited below 1674.60 support turned resistance. Thus, outlook is staying bearish for now. Break of 1316.80 minor support should resume larger down trend through 878.50 low.
On the data front
Japan corporate price index rose 2.0% yoy in June, matched expectation. Later in the day, US will release consumer confidence, house price index and new home sales.
AUD/USD Daily Report
Daily Pivots: (S1) 0.6903; (P) 0.6934; (R1) 0.6988; More...
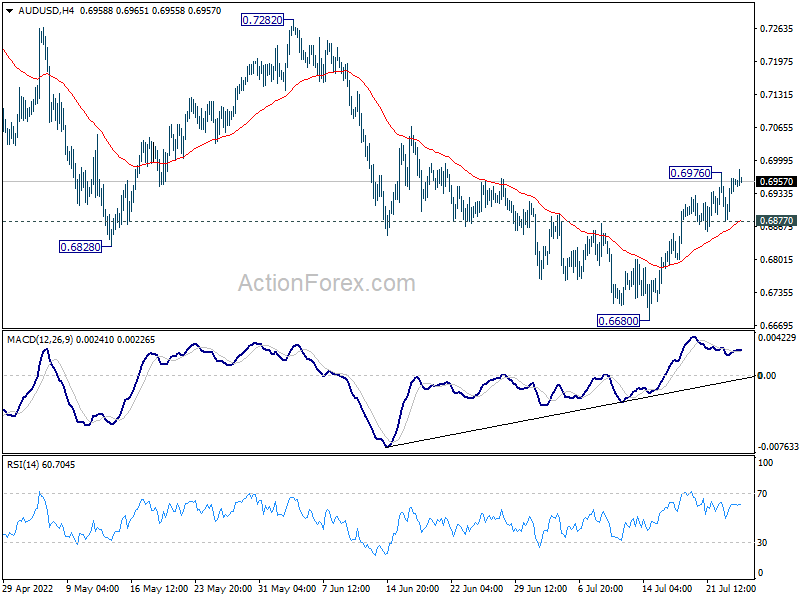
AUD/USD's rebound from 0.6680 resumed after brief retreat and intraday bias is back on the upside. Sustained trading above 55 day EMA (now at 0.6967) will pave the way to 0.7282 resistance next. Nevertheless, break of 0.6877 will turn bias back to the downside for retesting 0.6680 low.
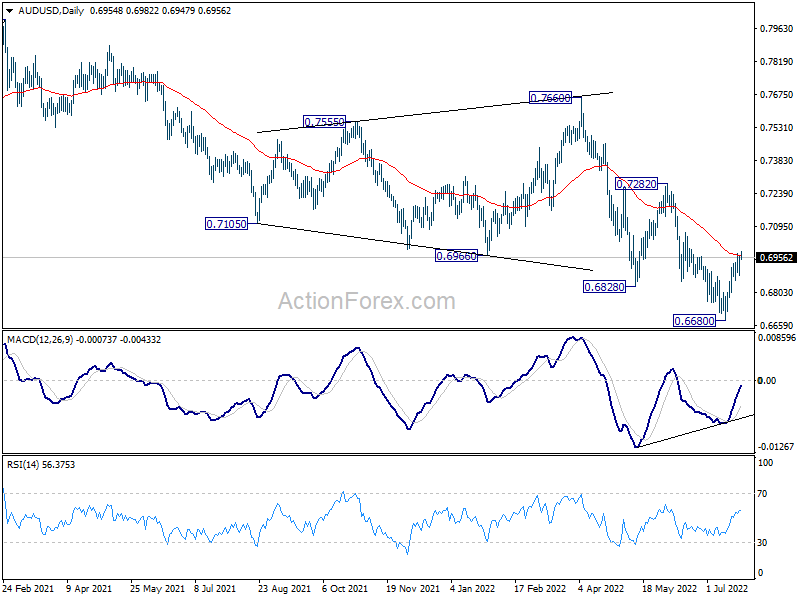
In the bigger picture, price actions from 0.8006 (2021 high) could still be a corrective pattern to rise from 0.5506 (2020 low). But current downside acceleration, as seen in weekly MACD), is raising the chance that it's a bearish impulsive move. In either case, outlook will remain bearish as long as 0.7282 resistance holds. Next target is 61.8% retracement of 0.5506 to 0.8006 at 0.6461.
Economic Indicators Update
| GMT | Ccy | Events | Actual | Forecast | Previous | Revised |
|---|---|---|---|---|---|---|
| 23:50 | JPY | BoJ Minutes | ||||
| 23:50 | JPY | Corporate Service Price Index Y/Y Jun | 2.00% | 2.00% | 1.80% | 1.90% |
| 13:00 | USD | S&P/Case-Shiller Home Price Indices Y/Y May | 20.50% | 21.20% | ||
| 13:00 | USD | Housing Price Index M/M May | 1.00% | 1.60% | ||
| 14:00 | USD | Consumer Confidence Jul | 96.3 | 98.7 | ||
| 14:00 | USD | New Home Sales Jun | 670K | 696K |
Bitcoin and Ethereum stay bearish as rebound lost momentum
Bitcoin dips notably this week, following overall risk sentiment. Overall outlook stays bearish, with price actions from 17575 low displaying clear corrective structure. Upside of the recovery was also capped below 25083 support turned resistance. Rejection by 55 day EMA is also another bearish sign. On resumption, next target is 61.8% projection of 32368 to 17575 from 24264 at 15121.
Ethereum's corresponding rebound from 878.50 low was relatively stronger, as it's support by medium term calling channel line. Yet, upside was also limited below 1674.60 support turned resistance. Thus, outlook is staying bearish for now. Break of 1316.80 minor support should resume larger down trend through 878.50 low.
BoJ minutes: Board members spoke of importance of wage increases
In the minutes of June meeting, BoJ board said price rises have been broadening. But massive support is still needed for the economy while uncertainty surrounding the outlook was "extremely high".
"Many members spoke about the importance of wage increases from the perspective of achieving the BoJ's price target in a sustained and stable fashion."
"Japan must create a resilient economy at which consumption continues to rise even when companies raise prices," one board member said.
"The BOJ must maintain monetary easing until wage hikes become a trend, and help Japan achieve the bank's price target sustainably and stably," another member said.
Technical Outlook and Review
DXY:
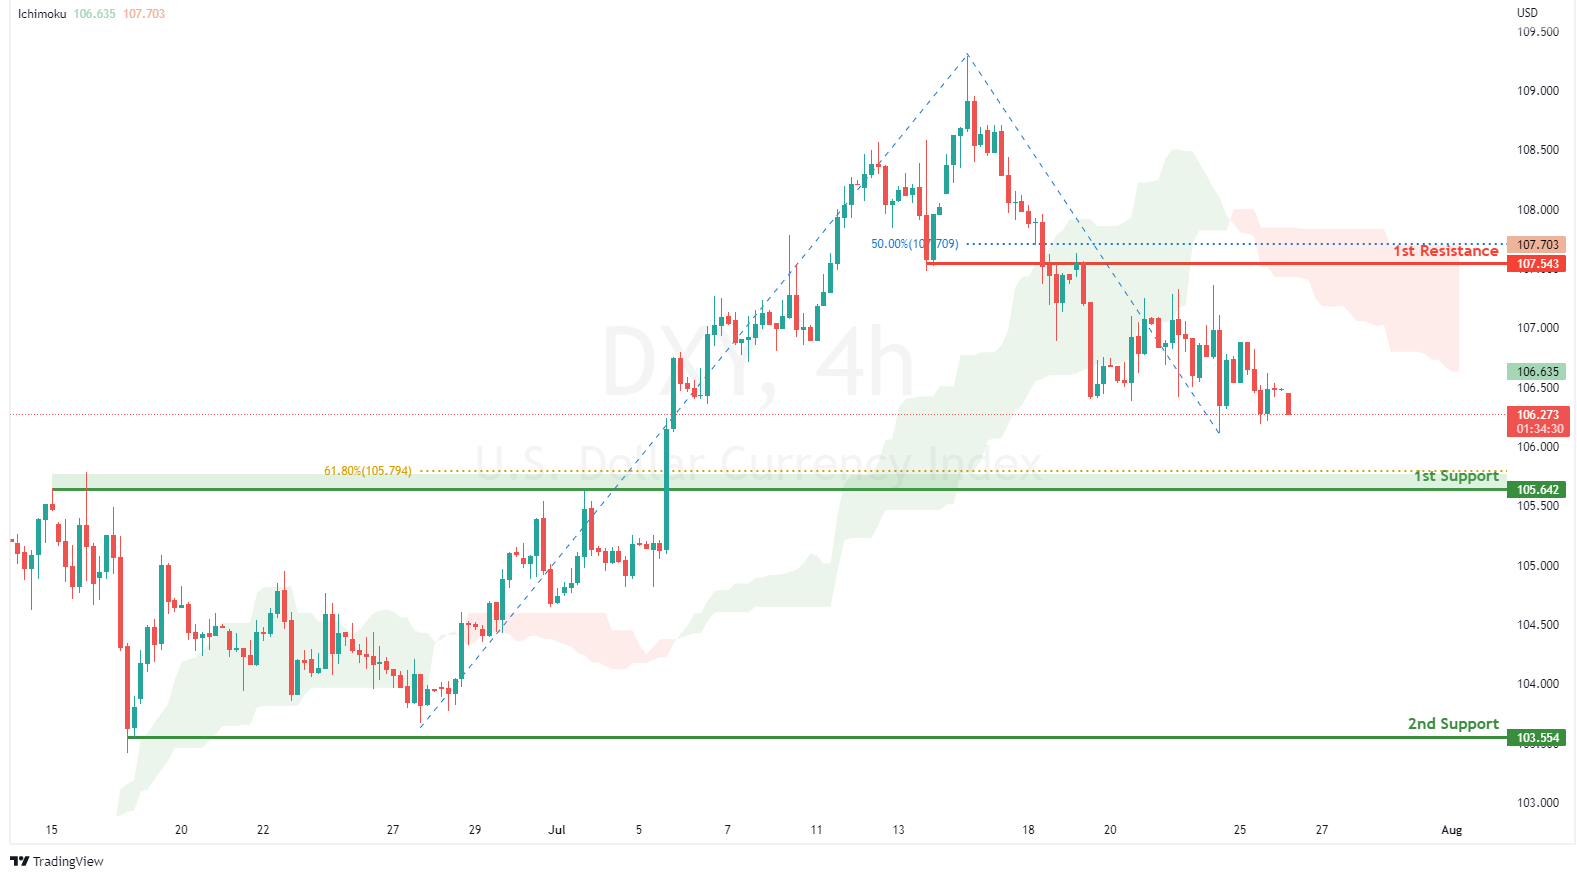
On the H4, with prices moving below the ichimoku indicator, we have a bearish bias that prices will drop to the 1st support at 105.642 in line with overlap support and 61.8% fibonacci retracement. Once there is downside confirmation of price breaking 1st support structure, we would expect bearish momentum to carry price to 2nd support at 103.554 in line with swing low support. Alternatively, price could rise to 1st resistance at 107.543 where the pullback resistance and 50% fibonacci retracement are.
Areas of consideration:
- H4 time frame, 1st resistance at 107.543
- H4 time frame, 1st support at 105.642
XAU/USD (GOLD):
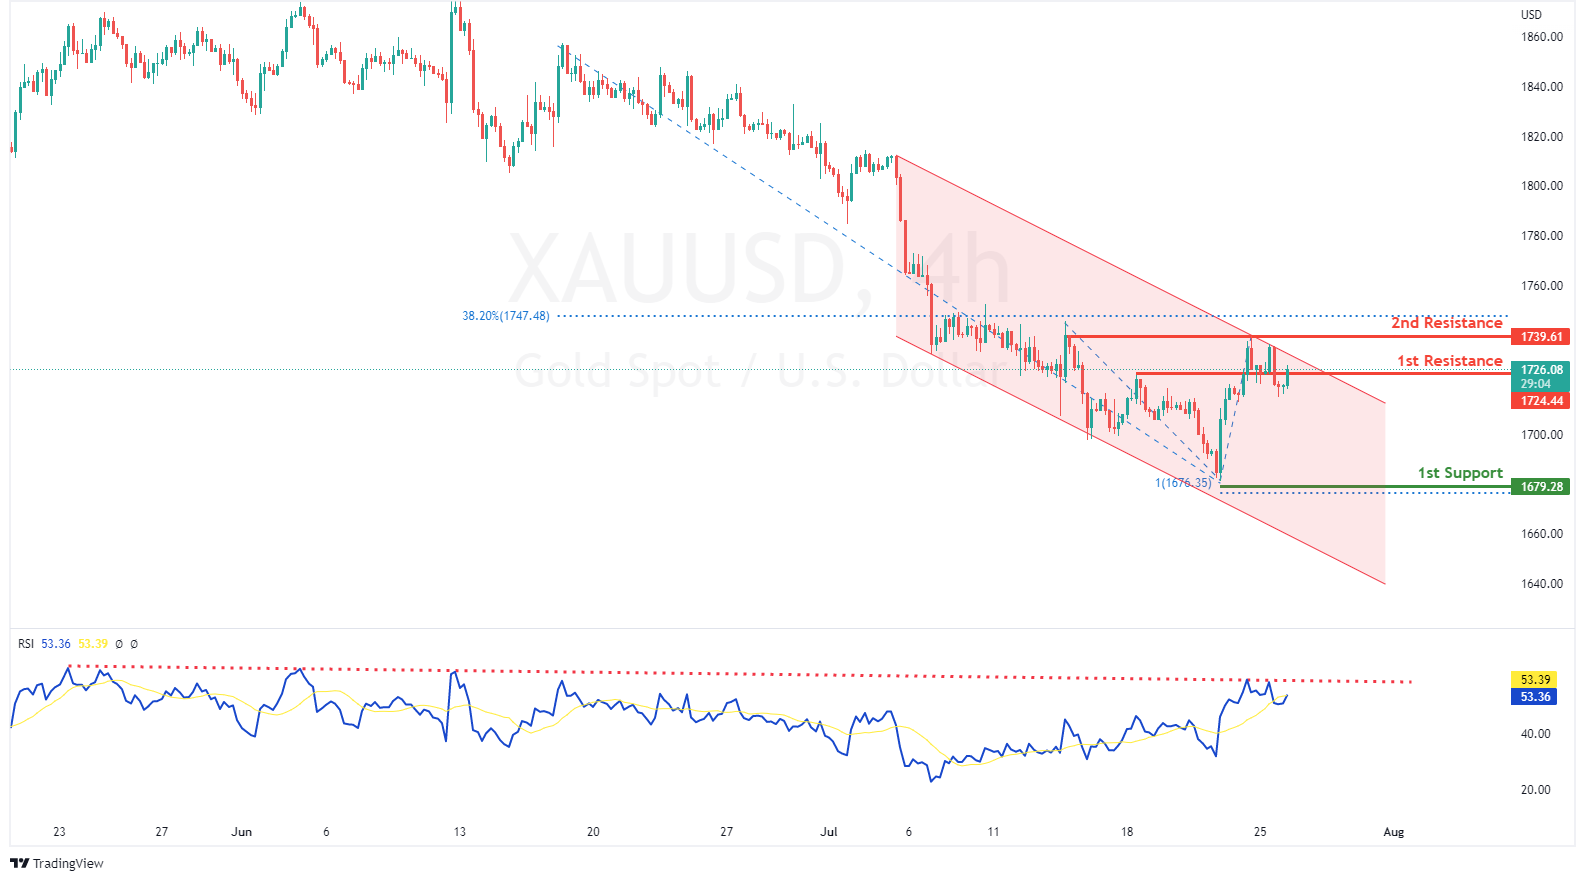
On the H4, with price moving within a descending channel and RSI moving in a descending trendline, we have a bearish bias that price will drop from 1st resistance at 1724.44 where the pullback resistance is to 1st support at 1679.28 in line with 100% fibonacci projection and swing low support on the daily timeframe. Alternatively, price could break 1st resistance and rise to 2nd resistance at 1739.61 where the 38.2% fibonacci retracement and swing high resistance are.
Areas of consideration:
- H4 time frame, 1st Resistance at 1724.44
- H4 time frame, 1st Support at 1679.28
GBP/USD:
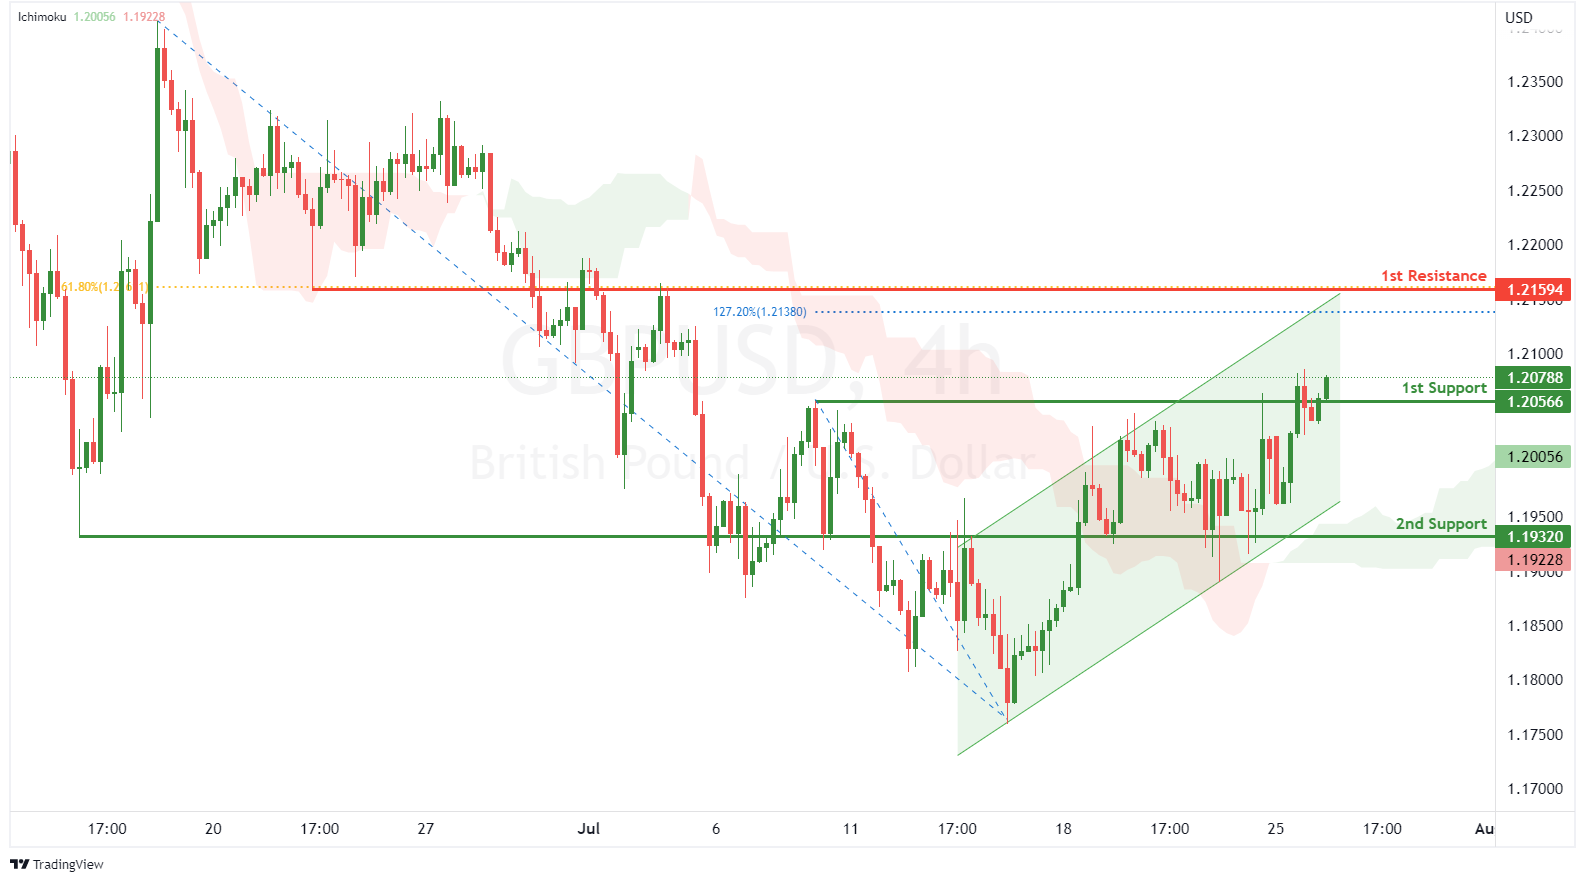
On the H4, with prices moving within an ascending channel and above the ichimoku indicator, we have a bullish bias that price will rise to the 1st resistance at 1.21594 where the pullback resistance, 127.2% fibonacci extension and 61.8% fibonacci retracement are from the 1st support at 1.20566 where the pullback support is. Alternatively, price could break 1st support and drop to 2nd support at 1.19320 where the pullback support is.
Areas of consideration:
- H4 1st resistance at 1.21594
- H4 1st support at 1.20566
USD/CHF:
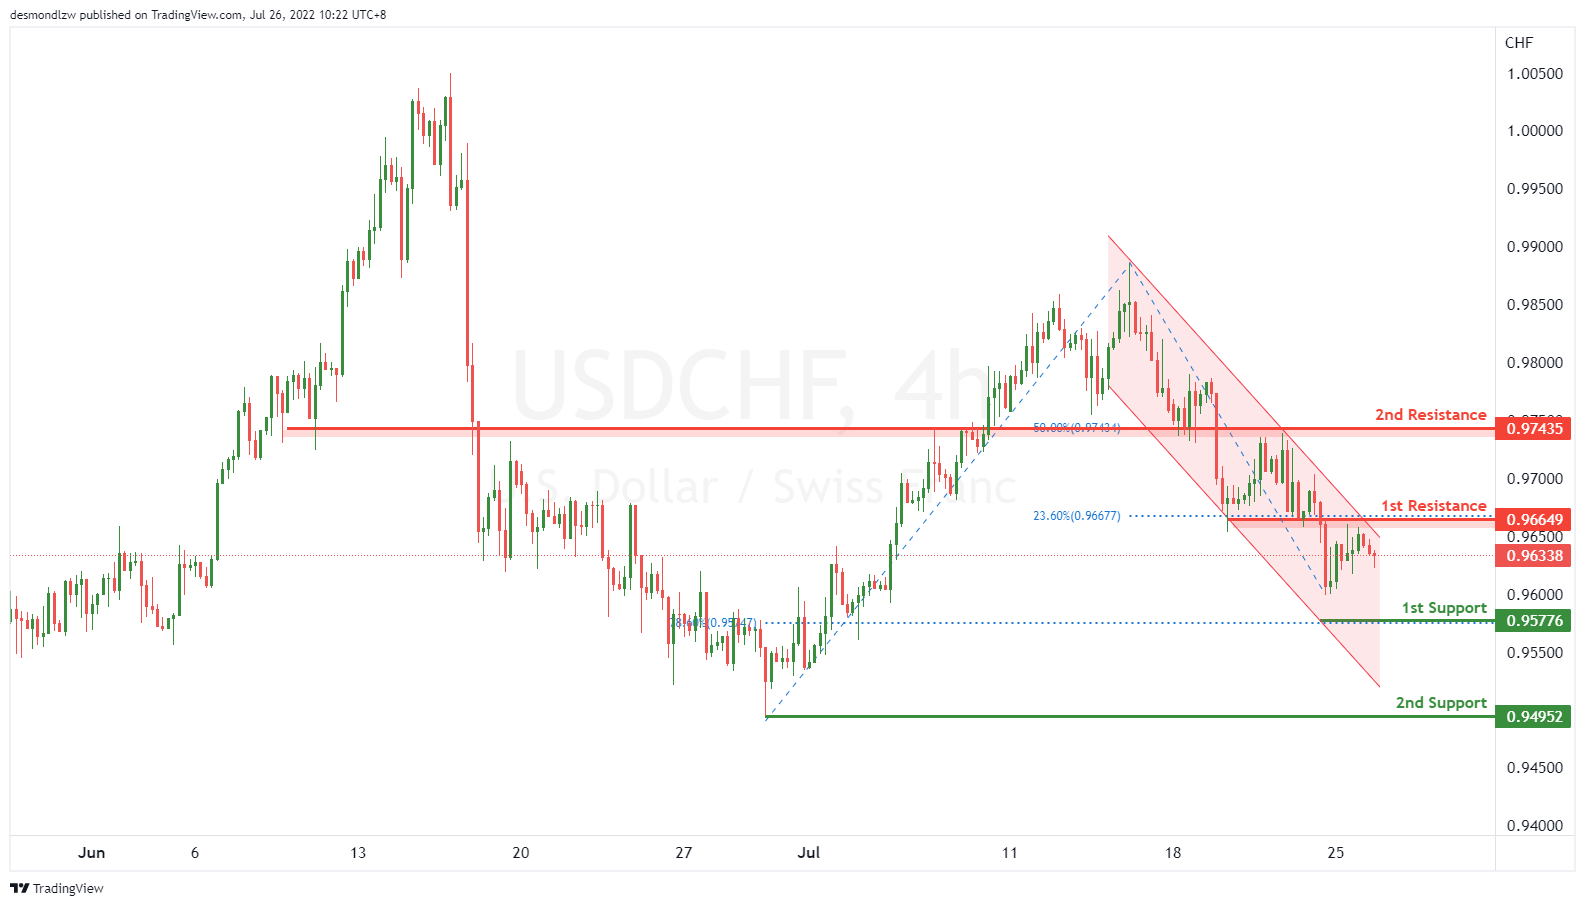
On the H4, with price moving along the descending channel, we have a bearish bias that price might drop from our 1st resistance at 0.96649, which is in line with overlap resistance to the 1st support at 0.95776, which is in line with 78.6% fibonacci retracement, if the price keep going down, it may drop to our 2nd support at 0.94952, which is in line with the swing low. Alternatively, price may break 1st resistance and head for 2nd resistance at 0.97435 where the 50% fibonacci retracement is.
Areas of consideration
- 1st resistance level at 0.96649
- 1st support level at 0.95776
EUR/USD :
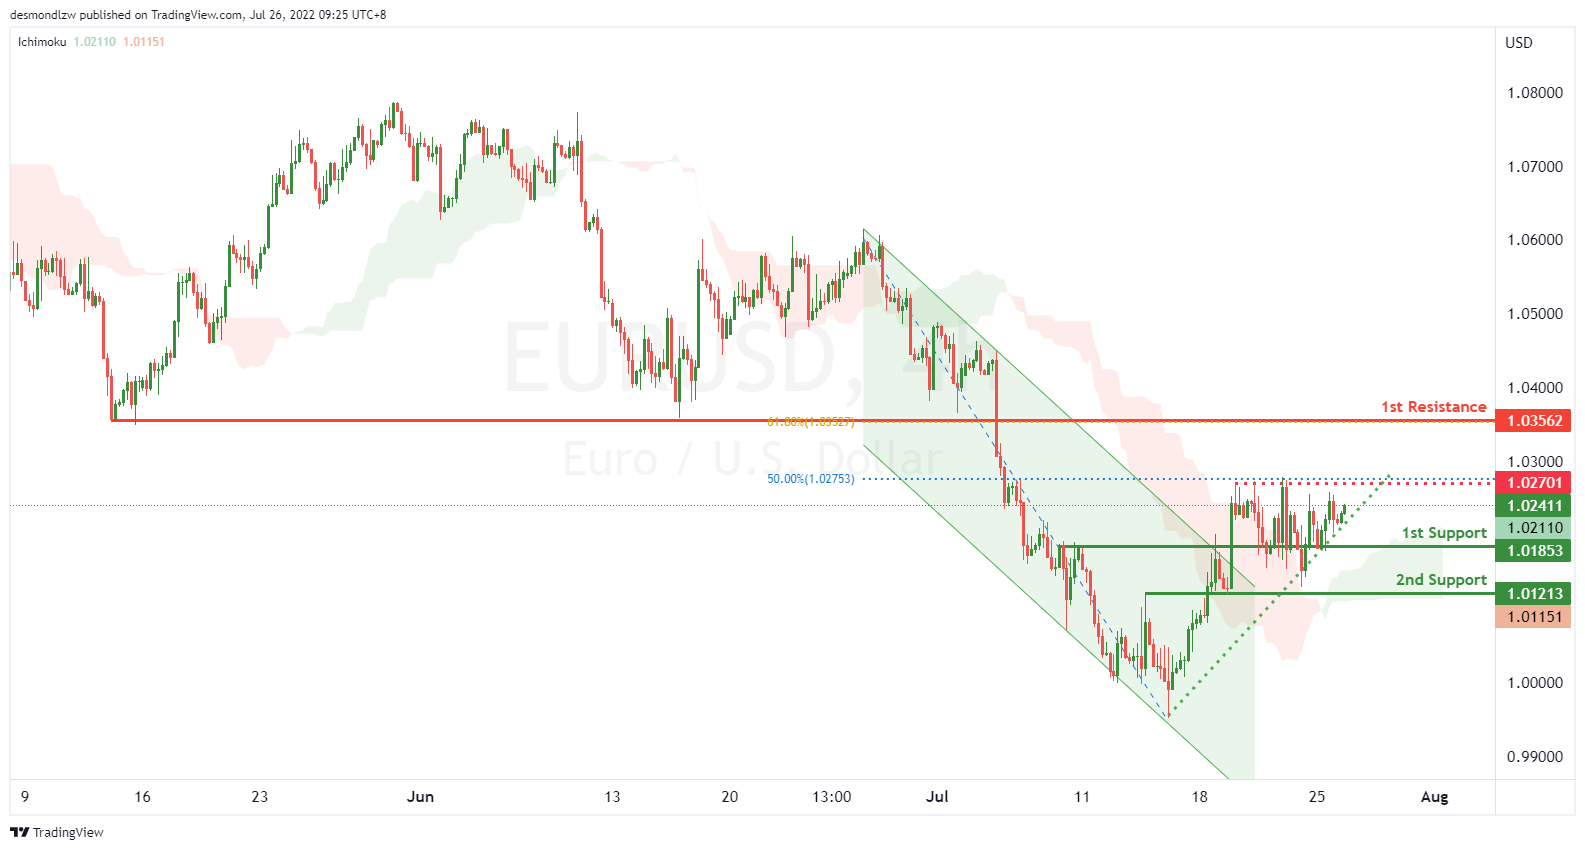
On the H4, with price moving above the ichimoku cloud and breaking out of the descending trend channel, we have a bullish bias that price will continue to rise from the 1st support at 1.01904 at the overlap support. If price breaks above the intermediary resistance at 1.02698 in line with the 50% fibonacci retracement, we have upside confirmation that price will continue to rise to the 1st resistance at 1.03570 at the pullback resistance in line with the 61.8% fibonacci retracement. Alternatively, price may break the support structure at the 1st support and drop to the 2nd support at 1.01213 at the overlap support.
Areas of consideration :
- H4 1st resistance at 1.03570
- H4 1st support at 1.01904
USD/JPY:
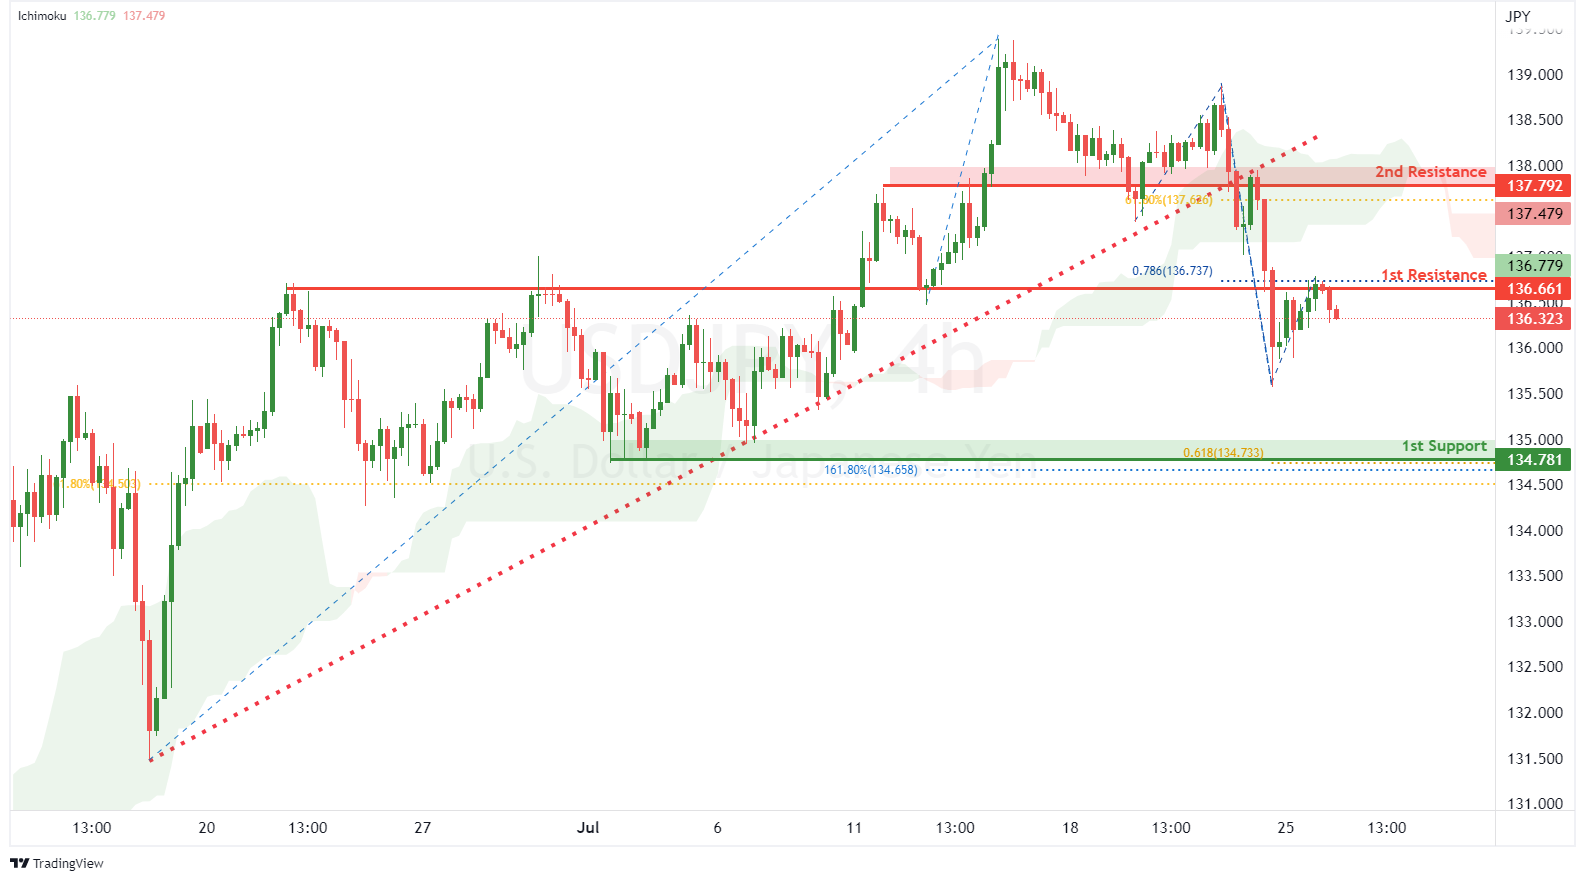
On the H4, with price broken out of the ascending trendline and moving below the ichimoku indicator, we have a bearish bias that price will rise and drop from our 1st resistance at 136.661 where the overlap resistance and 78.6% fibonacci projection are to the 1st support at 134.781 where the swing low support, 61.8% fibonacci projection, 161.8% fibonacci extension and 61.8% fibonacci retracement are. Alternatively, price could break 1st resistance structure and head for 2nd resistance at 137.792 where the pullback resistance and 61.8% fibonacci retracement are.
Areas of consideration:
- H4 time frame, 1st resistance at 136.661
- H4 time frame, 1st support at 134.781
AUD/USD:
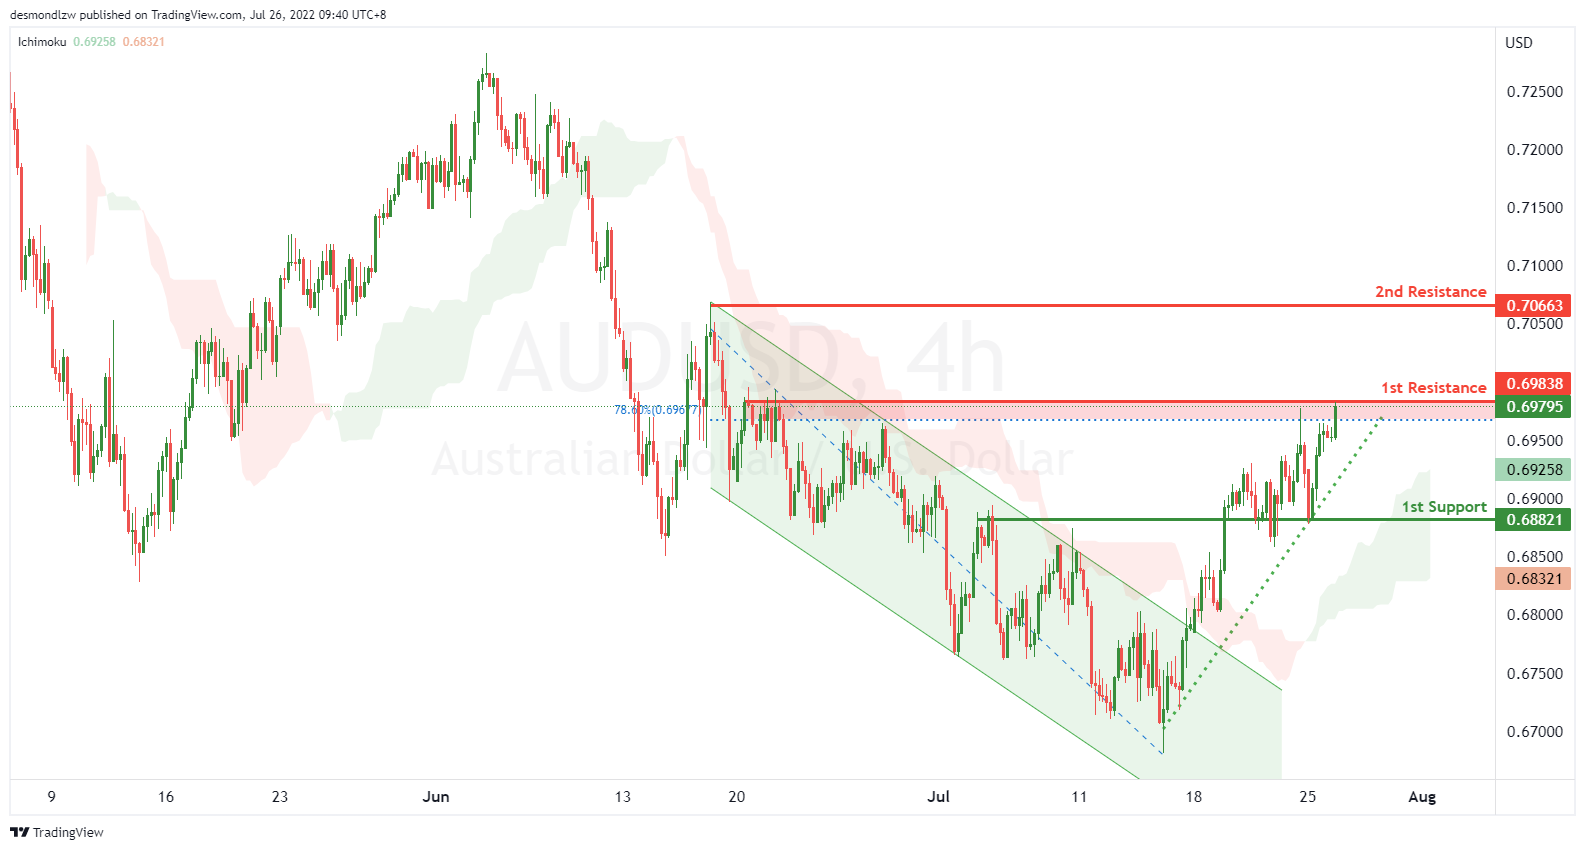
On the H4, with price moving above the ichimoku cloud and breaking out of the descending trend channel and moving in an ascending support, we have a bullish bias that price will rise from the 1st resistance at 0.69838 at the overlap resistance in line with the 78.6% fibonacci retracement to the 2nd resistance at 0.70663 at the swing high. Alternatively, price may reverse off 1st resistance and drop to the 1st support at 0.68021 at the overlap support.
Areas of consideration
- H4 1st resistance at 0.69838
- H4 1st support at 0.68021
NZD/USD:
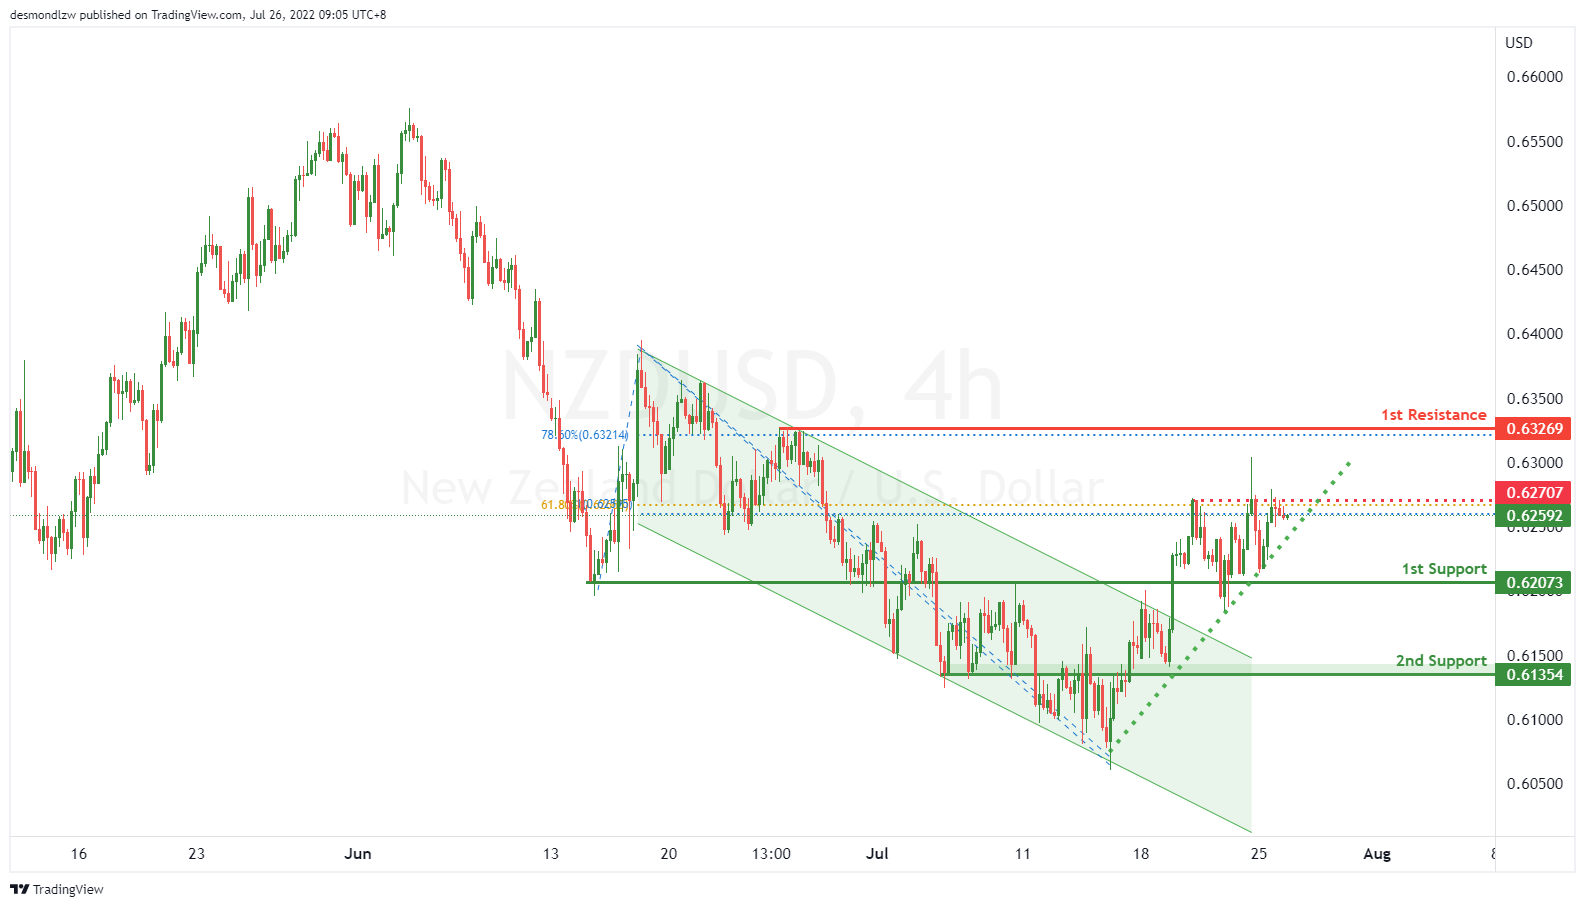
On the H4, with price breaking the descending trend channel, short term ascending support and moving above the ichimoku cloud, we have a bullish bias that price will rise from the 1st support at 0.62177 at the overlap support. If price breaks the intermediary resistance at 0.62707 at the swing high in line with the 61.8% fibonacci retracement and 100% fibonacci projection, we will have upside confirmation that price will rise to the 1st resistance at 0.63269 at the swing high in line with the 78.6% fibonacci retracement. Alternatively, price may break the support structure at the 1st support and drop to the 2nd support at 0.61419 at the pullback support.
Areas of consideration:
- H4 time frame, 1st support at 0.62177
- H4 time frame, 1st resistance at 0.63269
USD/CAD:
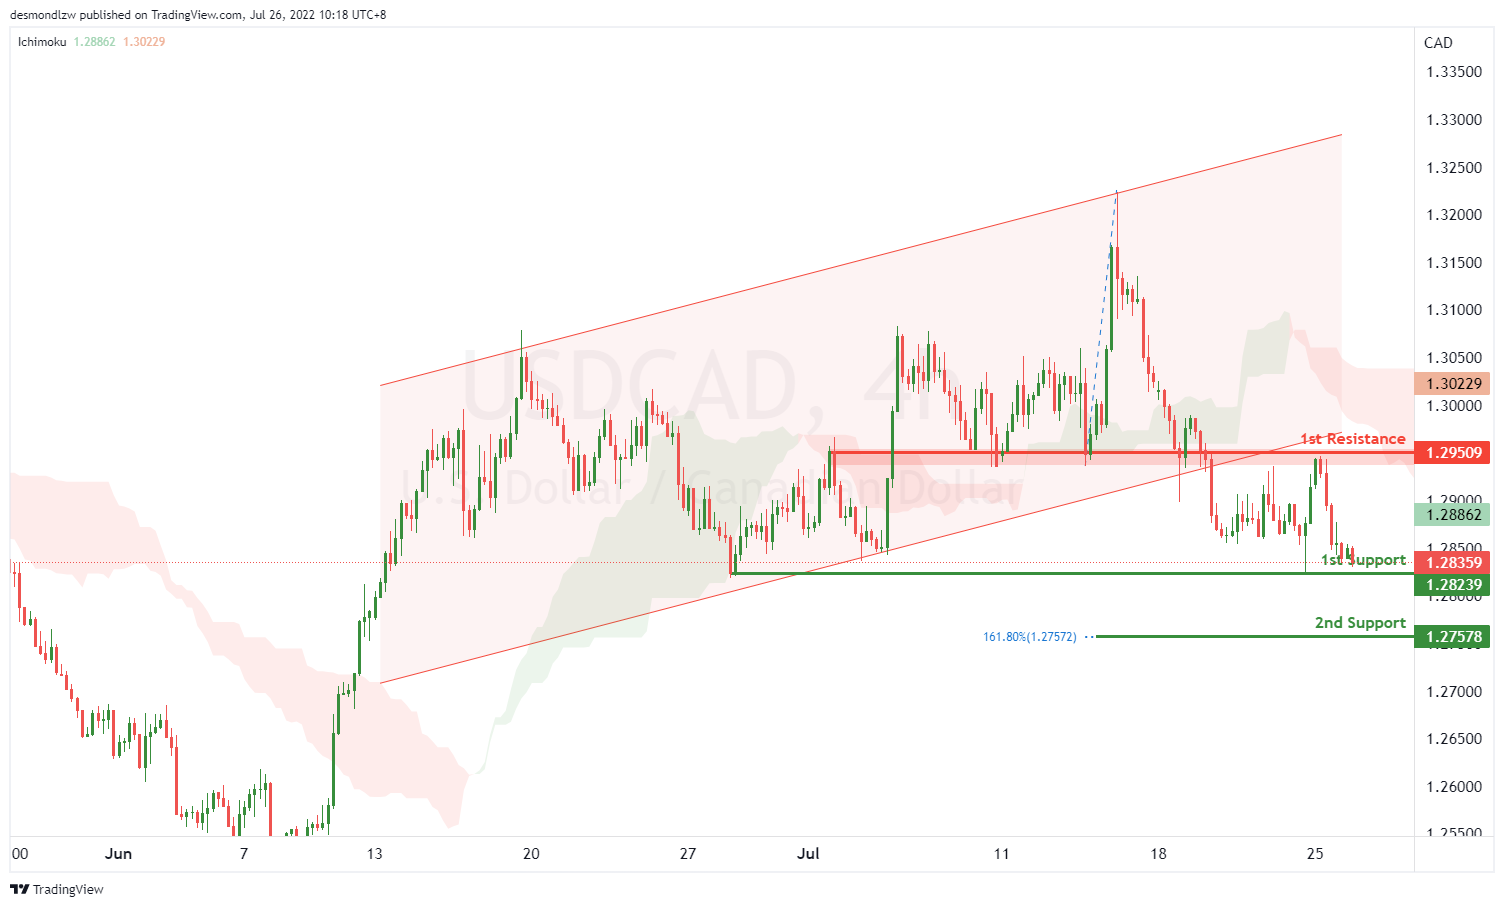
On the H4, with the price breaking the ascending channel, we have a bearish bias that the price may drop from our 1st support at 1.28239, which is in line with swing lows to our 2nd support at 1.27578, which is in line with the 161.8% fibonacci extension. Alternatively, the price may rise to the 1st resistance at 1.29509, which is in line with the overlap resistance.
Areas of consideration:
- H4 time frame, 1st support at 1.28239
- H4 time frame, 2nd support at 1.27578
OIL:
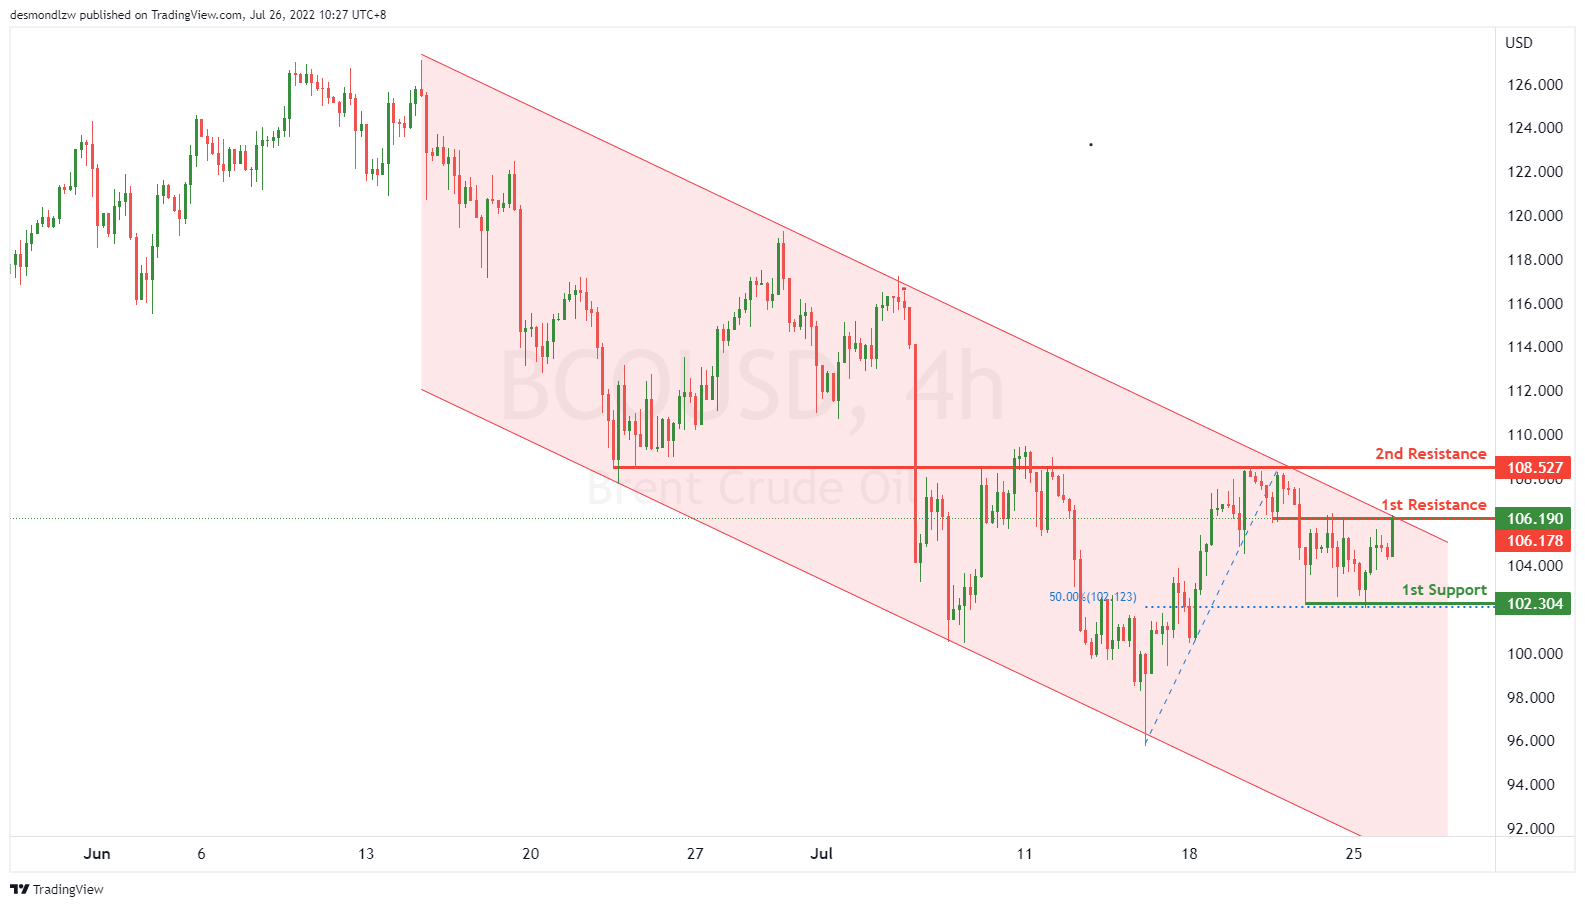
On the H4, with price moving along the bearish channel, we have a bearish bias that price might drop from our 1st resistance at 106.178, which is in line with the close swing high price to our 1st support at 102.304, which is in line with 50% fibonacci retracement. Alternatively, as the price is almost at the upper bound of the channel, the price may rise to 2nd resistance at 108.527, which is in line with overlap resistance.
Areas of consideration:
- H4 time frame, 1st support of 102.304
- H4 time frame, 2nd support of 108.527
Dow Jones Industrial Average:
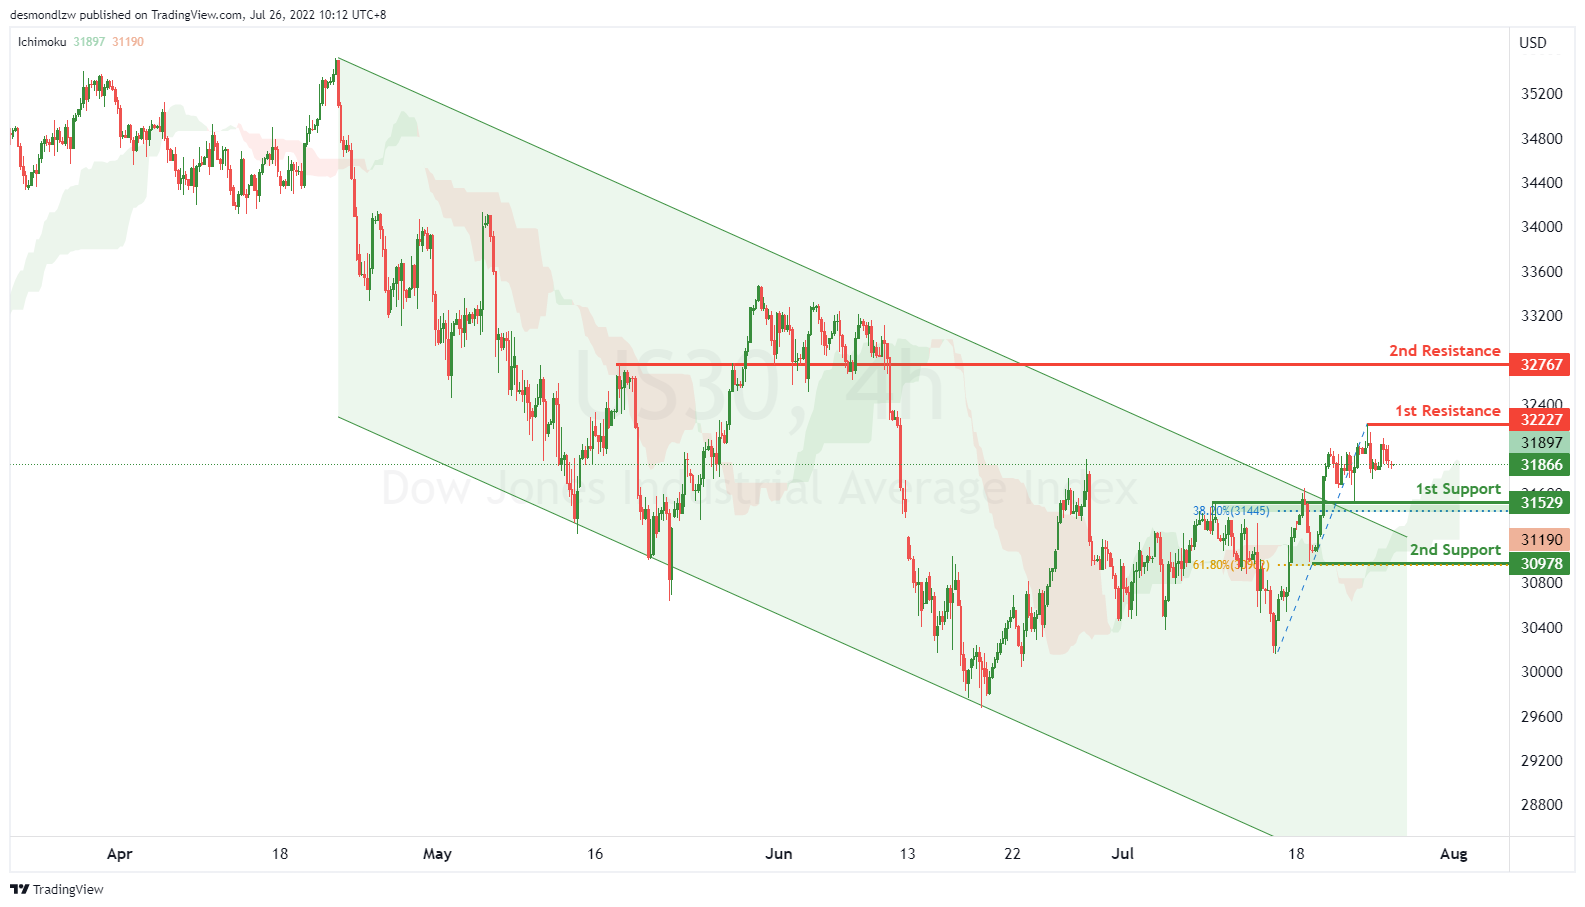
On the H4, with price moving with a bearish channel and having a bullish break, we have a bullish bias that price might rise from our 1st resistance at 32227, which is in line with the swing highs to our 2nd resistance at 32767, which is in line with overlap resistance. Alternatively, price may reverse off the 1st resistance and drop to the 1st support at 31529, which is in line with the overlap support and 38.2% fibonacci retracement, if the price keeps going down, it may drop to our 2nd support at 30978, which is in line with 61.8% fibonacci retracement.
Areas of consideration:
- H4 time frame, 1st resistance of 32227
- H4 time frame, 2nd resistance at 32767
Eco Data 7/26/22
[php_everywhere instance="1"]
Fed to Likely Hike by 75 bps But May Still Weigh 100-bps Option
The Federal Reserve is almost certain to raise interest rates for a fourth time on Wednesday when it announces its decision at 18:00 GMT. A 75 basis-point hike is the likely scenario, but several investors are bracing for a possible bigger 100-bps increase, having been wrongfooted by central banks one too many times lately. Even if the Fed steers clear of surprises this time, Chair Jerome Powell’s press briefing 30 minutes later will be scanned for hints as to what to expect in September. In the meantime, the US dollar is trading a little on the soft side, though showing no sign yet it is ready to hand over its crown as FX king.
Rates seen peaking earlier and lower
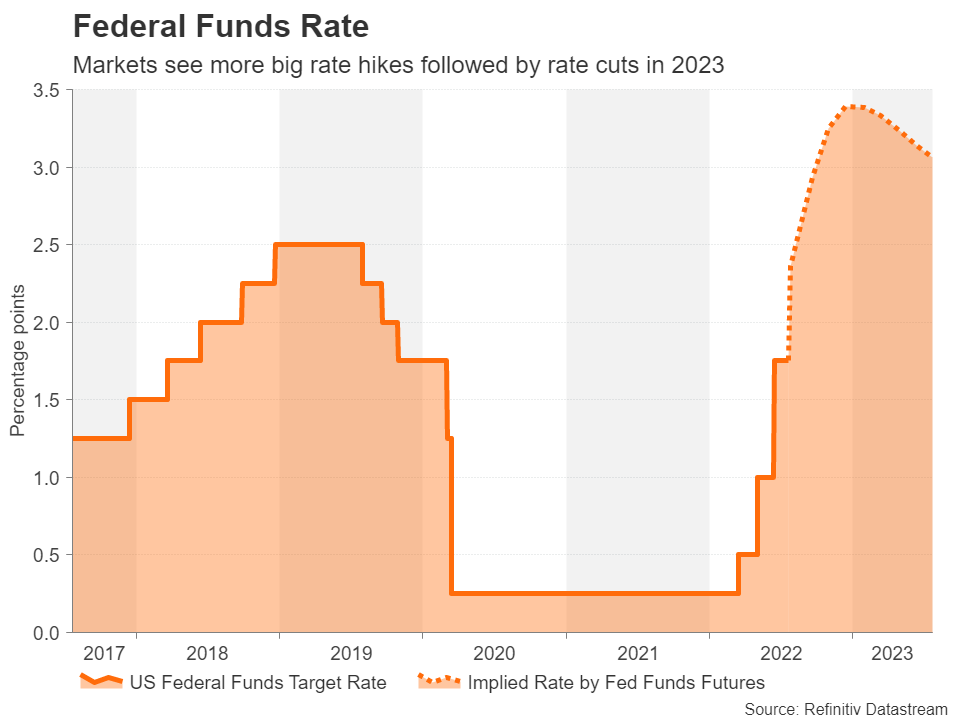
Rate hike speculation has been in overdrive since June as traders are one minute ratcheting up expectations about how high the Fed funds rate will reach to scaling back their bets the next. But after constant readjustments over the past few weeks and still plenty of uncertainties surrounding the economic outlook, investors are growing more certain about where they perceive rates at year-end, as interest rate futures for December appear to be settling just below 3.5%.
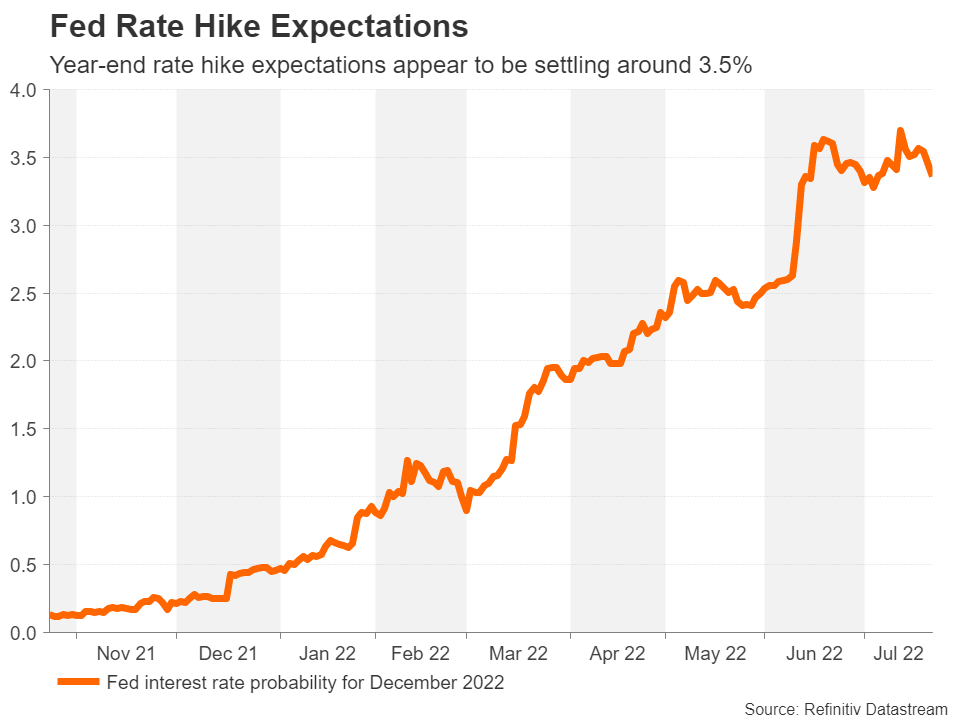
More importantly, markets increasingly see rates peaking in December versus in spring 2023 not that long ago. The forecasts of an earlier peak are partly due to the Fed frontloading its rate hikes more aggressively than anticipated and partly on the back of signs that inflation may finally be topping out. Both market- and consumer-based inflation expectations have receded substantially from recent highs, mirroring the pullback in commodity prices.
Although it’s too soon to assume that this trend will continue, or at the very least not reverse, when also factoring in the slower gear that the US economy is shifting into, markets are optimistic the Fed will be in a position to pause after December and begin cutting rates by the middle of 2023.
Will the Fed discuss a 100-bps rate increase?
Under this purview, the size of the rate hike in July and the next meeting in September might be considered inconsequential. However, with the Fed and other central banks being more data dependent than ever and no longer committing themselves to a precise forward guidance, investors will want to read as much as they can from the statement and Powell’s remarks, particularly as there will be no new dot plot chart this meeting.
While a 100-bps increase cannot be ruled out in July, and markets have assigned about a 10% probability of this, two of the Fed’s most hawkish policymakers played down the need to go for a bigger hike. Nonetheless, the option of a full percentage point increase might still be discussed at the meeting, something that may startle investors, especially following the latest PMI data.
US economy might be slowing faster than predicted
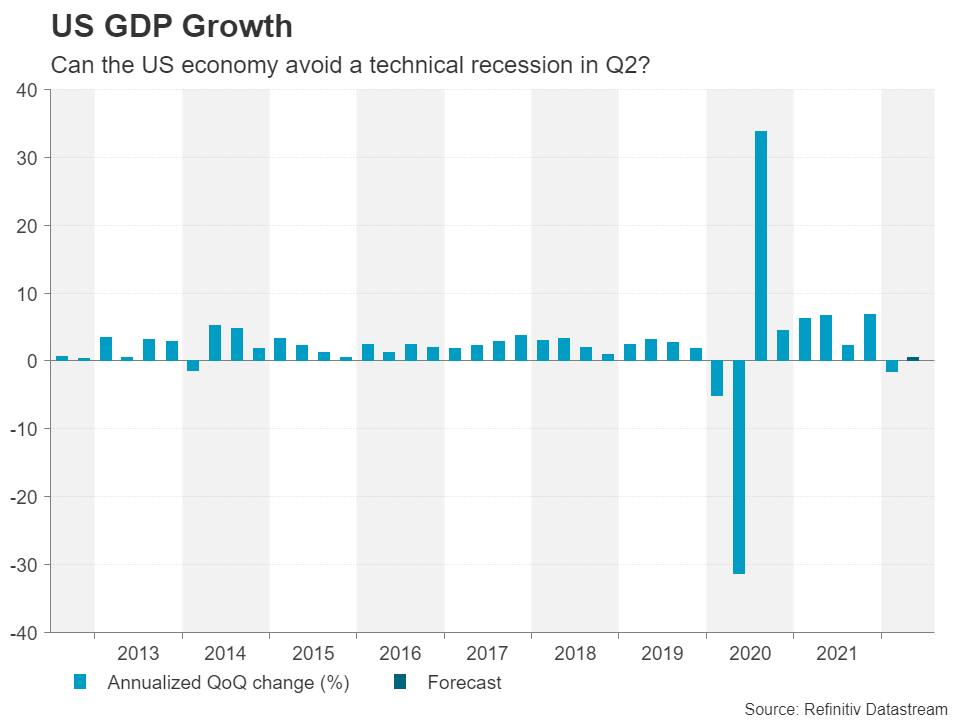
The services sector shrank in July for the first time in two years according to S&P Global’s flash PMI estimates, although, there was a silver lining in that price growth also appeared to be moderating. There will be a raft of other data this week that may well heighten fears of a sharp slowdown, or even a recession, the highlight of which will be Thursday’s GDP numbers.
After the surprise contraction in the first quarter, GDP is projected to have expanded by a paltry 0.4% annualized rate in the three months to June. The puny growth means that it won’t take a big downside surprise to turn the figure negative, hence, it’s possible that the US economy may already be in a technical recession.
Just as significant will be Friday’s PCE inflation and consumption figures for June. Personal consumption is expected to have jumped by a solid 0.9% m/m in June, while the alternative measure of inflation – the core PCE price index, which is preferred by the Fed, is forecast to have held steady at 4.7%.
Powell’s comments could shore up the dollar
In all probability, Powell will dismiss any weaknesses in the data as temporary and indicate he wants to see stronger evidence that inflationary pressures have started to abate substantially before considering toning down his very hawkish rhetoric. That’s why it may be too soon for investors to expect any hints of a policy shift from the Fed or Powell in July.
If that turns out to be the case, the dollar may seek a rerun towards the 140 level against the yen. Its last attempt was blocked at 139.40 by the 261.8% Fibonacci extension of the May downleg. A successful break above 140 would turn the spotlight to the 300% Fibonacci of 141.32.
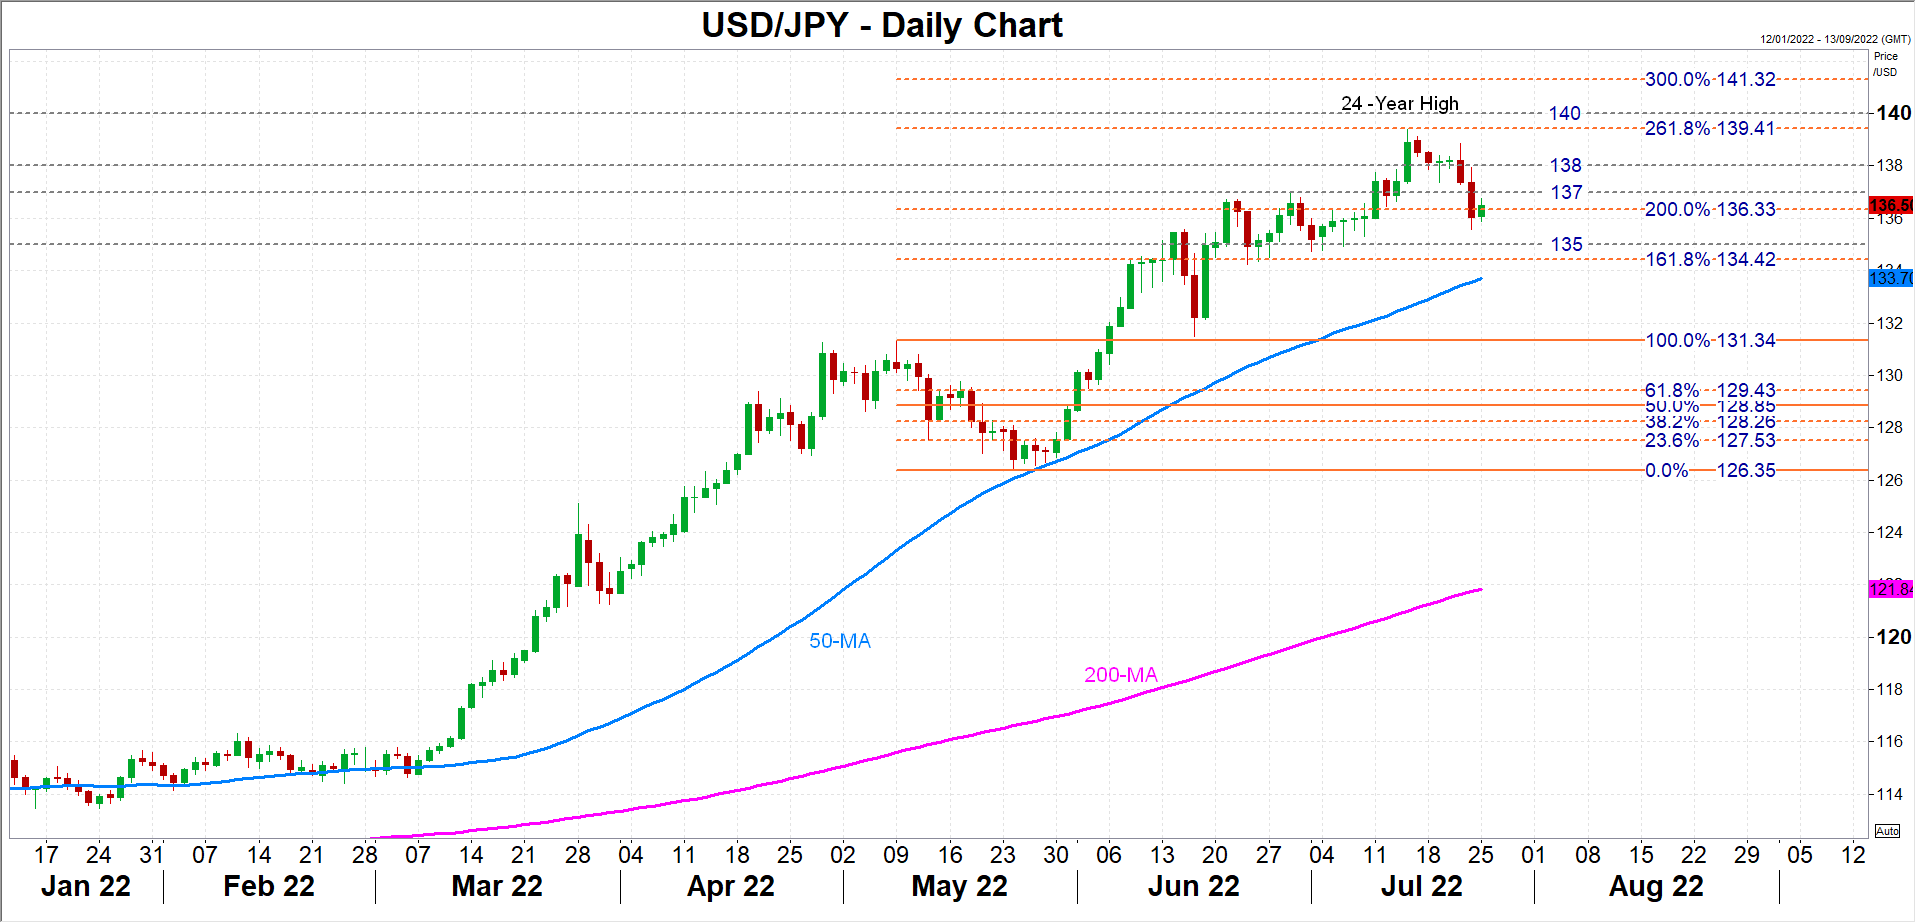
However, if Powell does acknowledge rising downside risks to growth and even suggests that he sees inflation declining in the not too distant future, the dollar could pull back more meaningfully. The 135-yen level is likely to be the first port of call in a sharp selloff and should it fail to hold, the 50-day moving average, currently at 133.70 yen, could be targeted next.
From rate hikes to rate cuts
It’s debatable, though, how long and deep any pullback in the greenback would be from investors lowering their expectations of the Fed’s terminal rate. This is because recession risks are growing for all the major economies, so the United States is not an isolated case. In addition, as long as there is a heightened sense of uncertainty, the dollar will draw support from safe-haven demand. The more important question for the markets and bigger threat to the dollar will come later in the year when the attention switches to who will be the first to cut rates.
EURCHF Wave Analysis
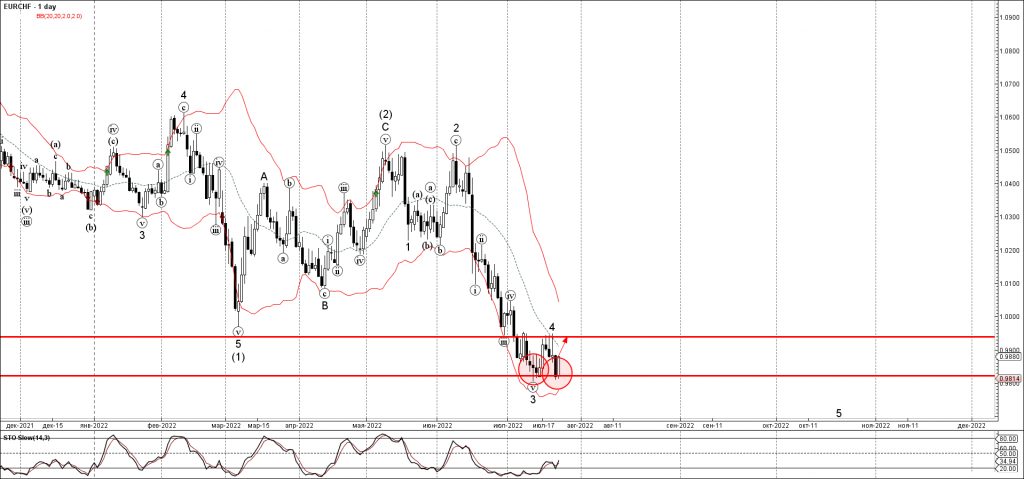
- EURCHF reversed from support area
- Likely to rise to resistance level 0.9940
EURCHF currency pair recently reversed up from the support zone located between the pivotal support 0.9820 (which stopped wave 3 in the middle of this month) and the lower daily Bollinger Band.
The upward reversal from this support area can form the daily candlesticks reversal pattern Bullish Engulfing.
EURCHF can be expected to rise further toward the next resistance level 0.9940 (top of the previous minor correction 4).
Natural Gas Wave Analysis
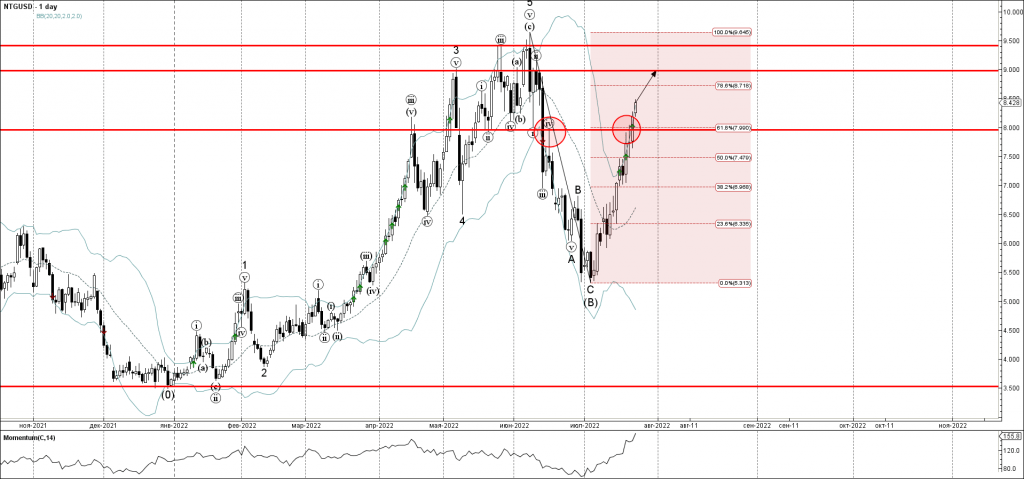
- Natural gas broke resistance level 7.960
- Likely to rise to resistance level 9.000
Natural gas recently broke through the resistance level 7.960 (top of the previous wave (iv) from the middle of June) intersecting with the 61.8% Fibonacci correction of the earlier downward correction (B) from last month.
The breakout of the resistance level 7.960 accelerated the active intermediate impulse wave (C).
Given the clear daily uptrend, Natural gas can be expected to rise further toward the next round resistance level 9.000.
Canadian Dollar Higher After Solid Retail Sales
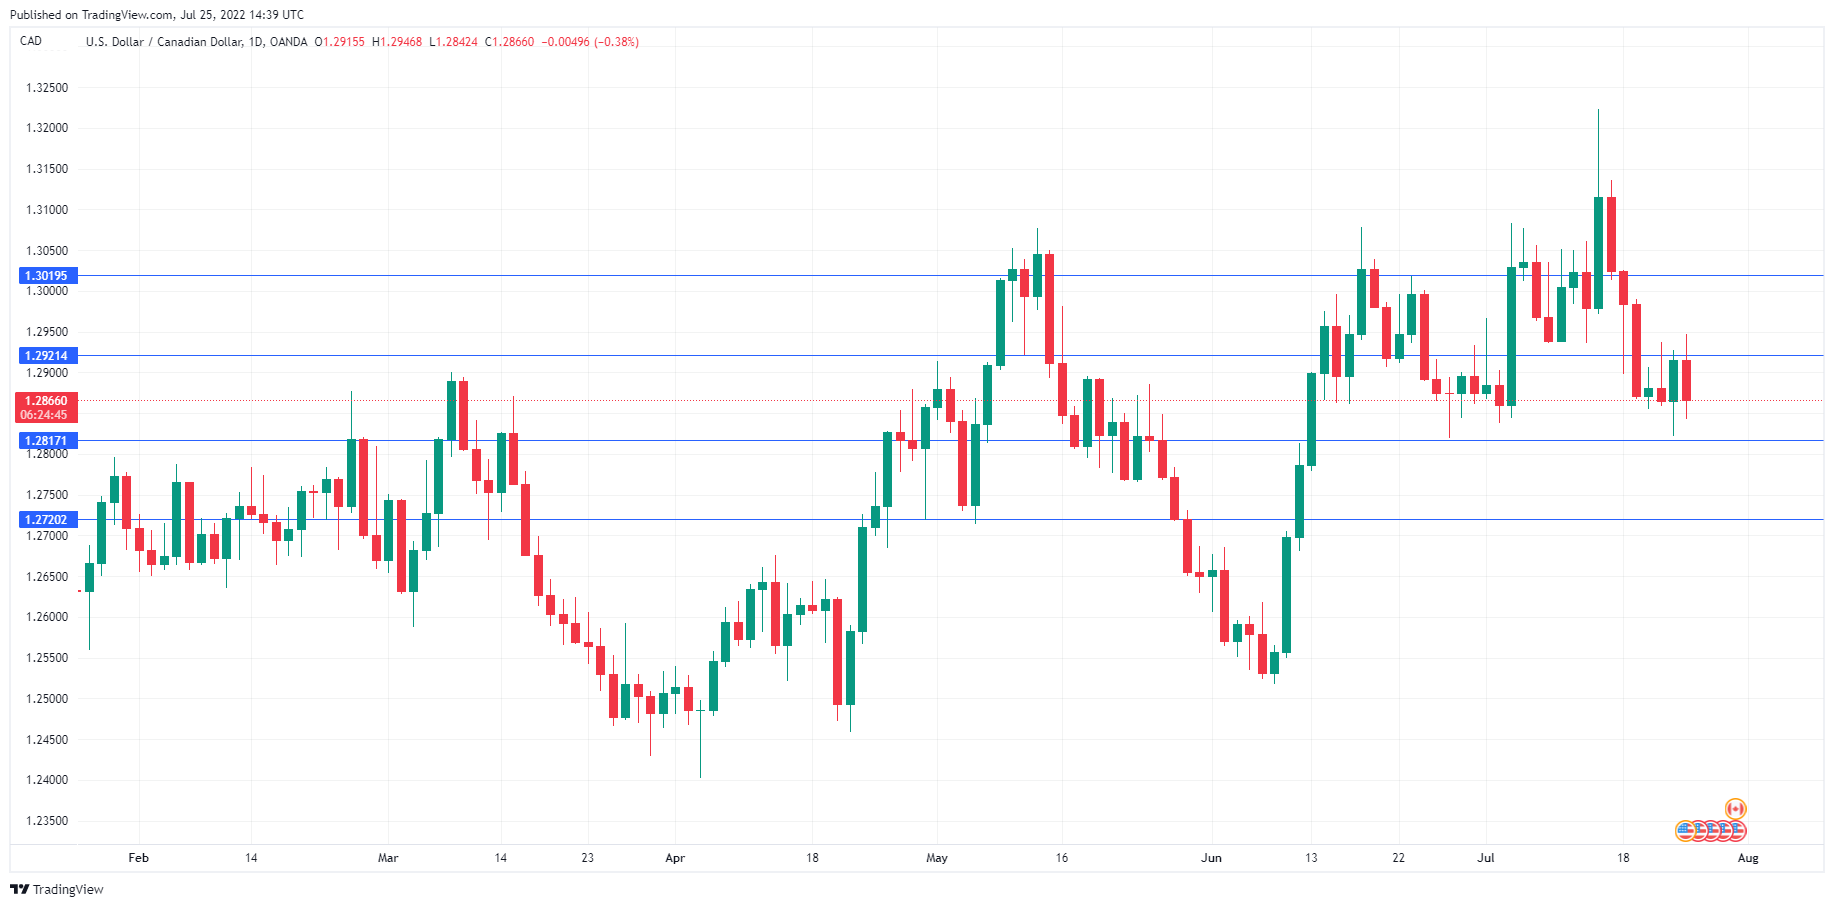
The Canadian dollar has started the week with gains. USD/CAD is trading at 1.2852 in the North American session, down 0.54% on the day.
Canada’s retail sales sparkle
Canada released June retail sales on Friday, and the data was stronger than expected. Retail sales surged to 2.2%, up from 0.7% in May (1.6% exp.). Core retail sales also accelerated, with a gain of 1.9%, up from 1.1% in May (1.6% exp.). The June numbers mark a fifth consecutive increase and points to solid consumer spending.
The Bank of Canada will take a long break after its 1% mega-hike earlier in July. The next meeting doesn’t take place until September 7th which will give the central bank plenty of time to monitor economic data and consider its next move. We can expect further rate hikes in the second half of the year, with inflation rising to 8.1% in June, up from 7.7% in May.
The question facing policy makers is how much to tighten at upcoming meetings. There are serious concerns about a possible recession, but the strong retail sales data shows that consumers are spending despite inflation and higher rates, which means that the BoC may feel that the economy is resilient enough to absorb additional supersize hikes in order to reel in inflation.
After last week’s inflation release, BoC Governor Tiff Macklem said that inflation is likely to remain above 7% for the rest of the year which is “painfully high”. Macklem added that the bank is front-loading its interest rate hikes in order to curb inflation, and the Bank will be raising rates again “pretty quickly”.
USD/CAD Technical
- There is resistance at 1.2921 and 1.3019
- USD/CAD has support at 1.2817 and 1.2719
Reserve Bank of Australia’s Comments Support AUD
AUD/USD is balancing at 0.6083 on Monday. The bulls managed to break the descending channel and they stand a good chance of starting a new ascending tendency in the near future.
The RBA Governor is ready to tighten the regulator’s monetary policy by doubling the benchmark interest rate. The reason for this announcement is simple – it’s necessary to push inflation back to its target of 2-3%. Market players tend to respond to such comments, that’s why the AUD got significant support.
The quarterly CPI report is scheduled to be released as early as Wednesday and it is expected to show further growth in inflation, which has already reached its 20-year highs. Another important report, Retail Sales, will be published on Thursday and no positive dynamics are expected here as well. If this indicator is also far below expectations, the risks of a rate-hike by the RBA will increase, helping the AUD to continue its uptrend.
It should be noted that early in the year Philip Lowe wasn’t ready for monetary policy tightening and said that he couldn’t see the rate going up in 2022. However, high inflation forced the regulator to take emergency measures and start raising the rate.
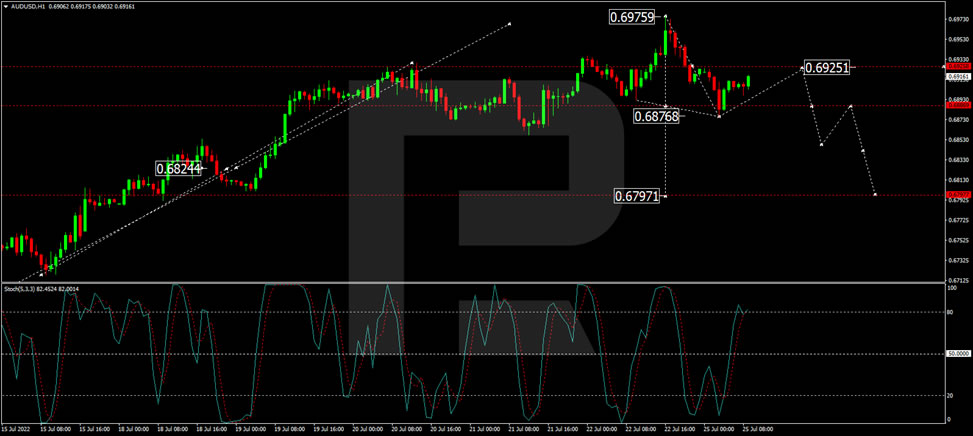
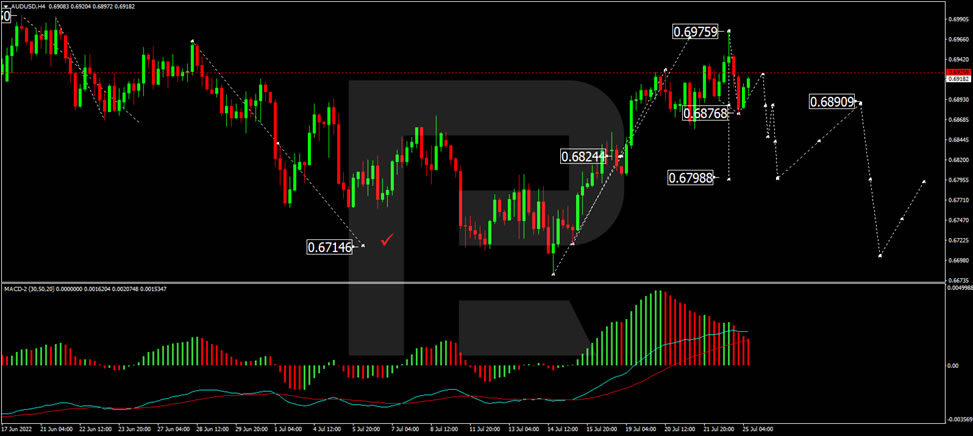
As we can see in the H4 chart, after finishing the first descending impulse at 0.6876, AUD/USD is correcting upwards to reach 0.6925 and may later form another descending impulse towards 0.6886. Later, the market may break the latter level and continue trading within the downtrend with the target at 0.6850, or even extend this structure down to 0.6798. From the technical point of view, this scenario is confirmed by the MACD Oscillator: after leaving the histogram area, its signal line is about to fall and reach 0.
In the H1 chart, having completed the five-wave structure of the first descending impulse at 0.6875, AUD/USD is correcting upwards to reach 0.6925 and may later fall towards 0.6888, thus forming a new consolidation range between the two latter levels. After that, the instrument may break the range to the downside and form a new descending structure with the target at 0.6850. From the technical point of view, this scenario is confirmed by the Stochastic Oscillator: its signal line is moving above 80 and may soon start falling to break 50. Later, it may continue moving down to 20.