Sample Category Title
Fed Waller: Definitely support another 75bps in Jul, probably 50bps in Sep
Fed Governor Christopher Waller said yesterday, "we need to move to a much more restrictive setting" and do that "as quickly as possible."
"I'm definitely in support of doing another 75 basis point hike in July, probably 50 in September, and then after that we can debate whether to go back down to 25s," he added.
"Inflation is a tax on economic activity, and the higher the tax the more it suppresses economic activity," Waller warned. "If we don't get inflation under control, inflation on its own can place us in a really bad economic outcome down the road."
Technical Outlook and Review
DXY:
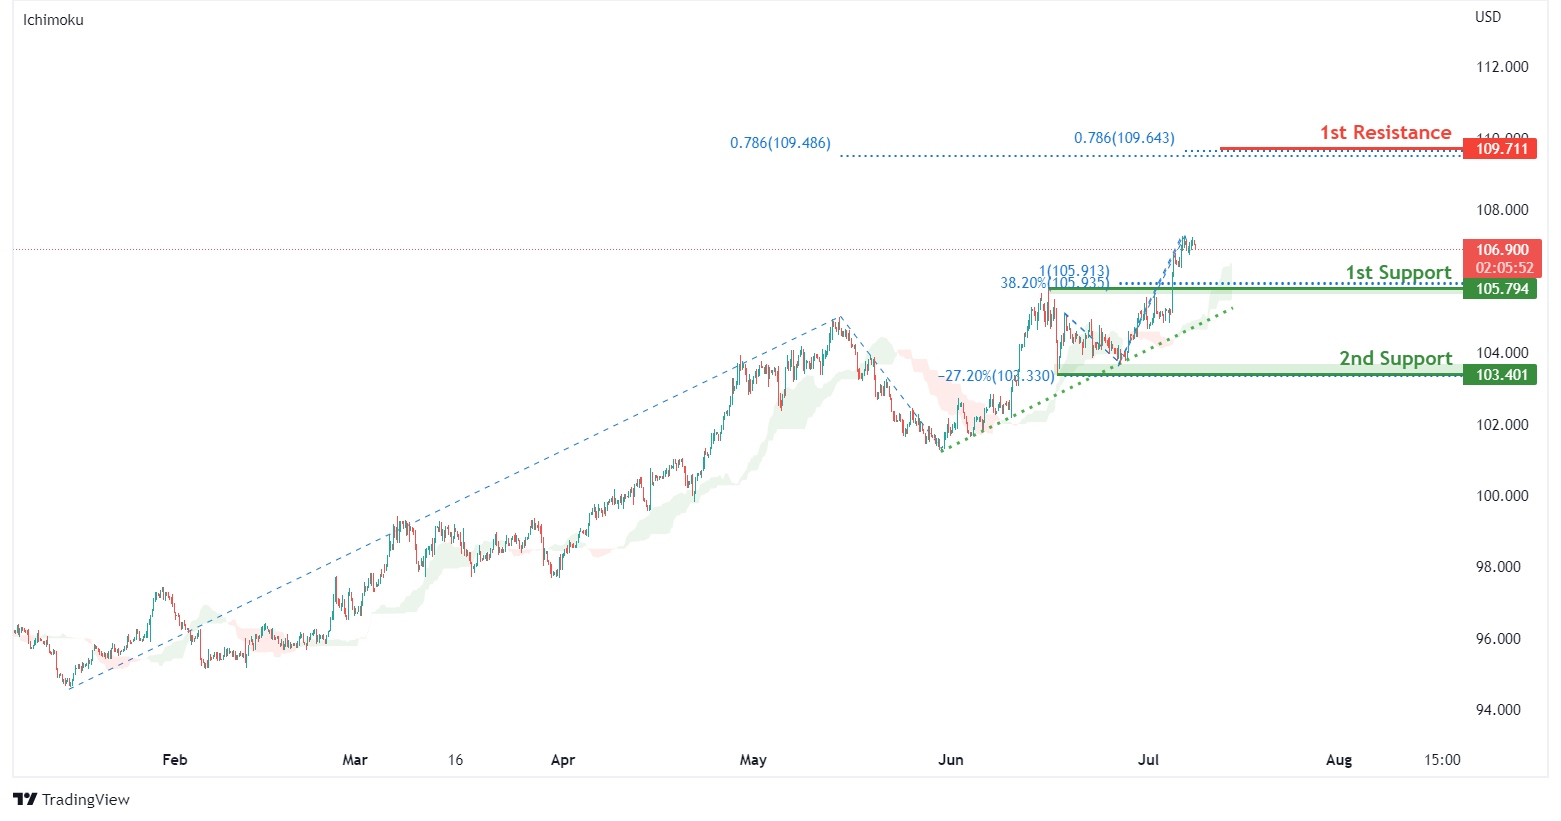
On the H4, with prices moving above the ichimoku indicator and along the ascending trendline, we have a bullish bias that prices will drop and rise from 1st support at 105.794 where the pullback support, 38.2% fibonacci retracement and 100% fibonacci projection are to 1st resistance at 109.711 in line with 78.6% fibonacci projection and 78.6% fibonacci projection. Alternatively, price may break 1st support structure and drop to 2nd support at 103.401 where the horizontal swing low support and -27.2% fibonacci expansion are.
Areas of consideration:
- H4 time frame, 1st resistance at 109.711
- H4 time frame, 1st support at 105.794
XAU/USD (GOLD):
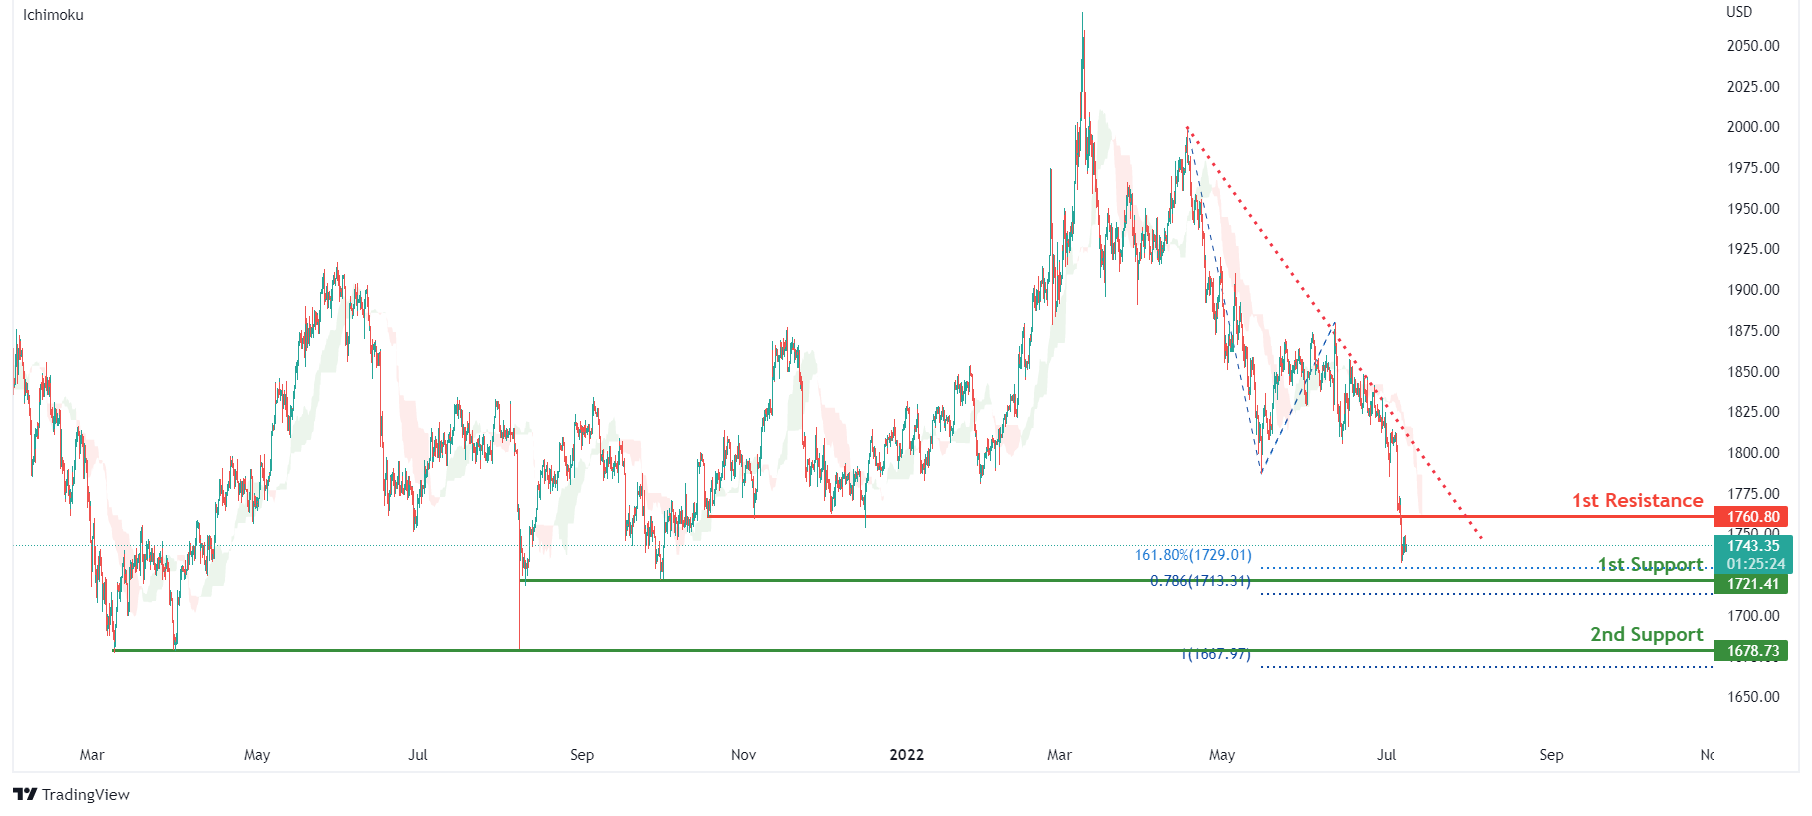
On the H4, with prices moving below the ichimoku indicator and along a descending trendline, we have a bearish bias that prices will drop to our 1st support at 1721.41 where the horizontal swing low support, 78.6% fibonacci projection and 161.8% fibonacci extension are. Once we have downside confirmation of price breaking 1st support structure, we would expect bearish momentum to carry price to 2nd support at 1678.73 in line with swing low support and 100% fibonacci projection. Alternatively, price could rise to our 1st resistance at 1760.80 in line with overlap resistance.
Areas of consideration:
- H4 time frame, 1st Resistance at 1760.80
- H4 time frame, 1st Support at 1721.41
GBP/USD:
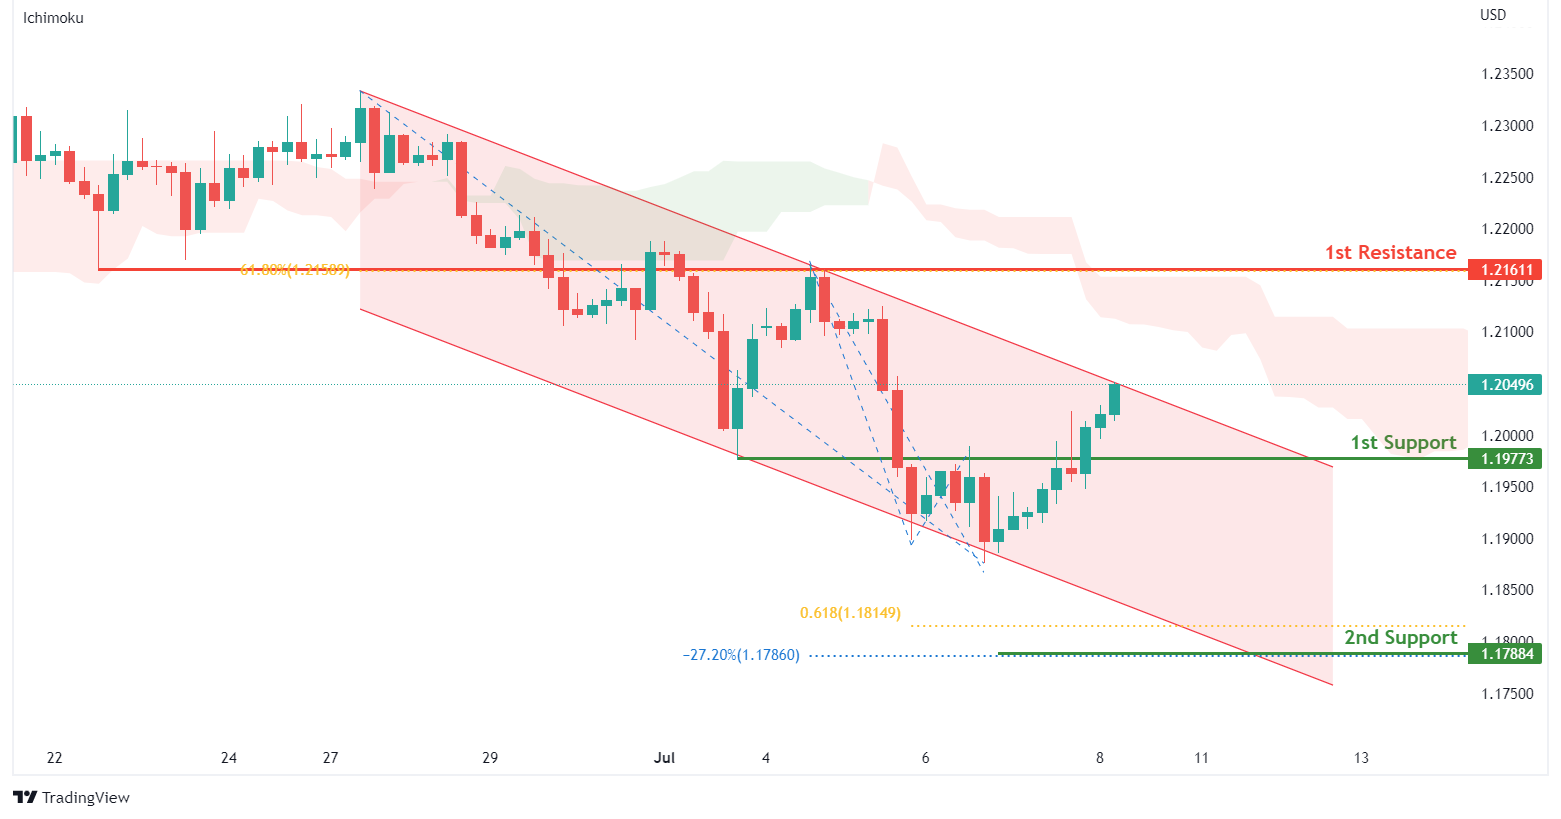
On the H4, with prices moving below the ichimoku indicator and within the descending channel, we have a bearish bias that price will drop to our 1st support at 1.19773 where the horizontal pullback is. Once there is downside confirmation of price breaking 1st support, we would expect bearish momentum to carry price to our 2nd support at 1.17884 where the -27.2% fibonacci expansion and 61.8% fibonacci projection are. Alternatively, price could rise to 1st resistance at 1.21611 in line with the pullback resistance and 61.8% fibonacci retracement.
Areas of consideration:
- H4 1st resistance at 1.21611
- H4 1st support at 1.19773
USD/CHF:
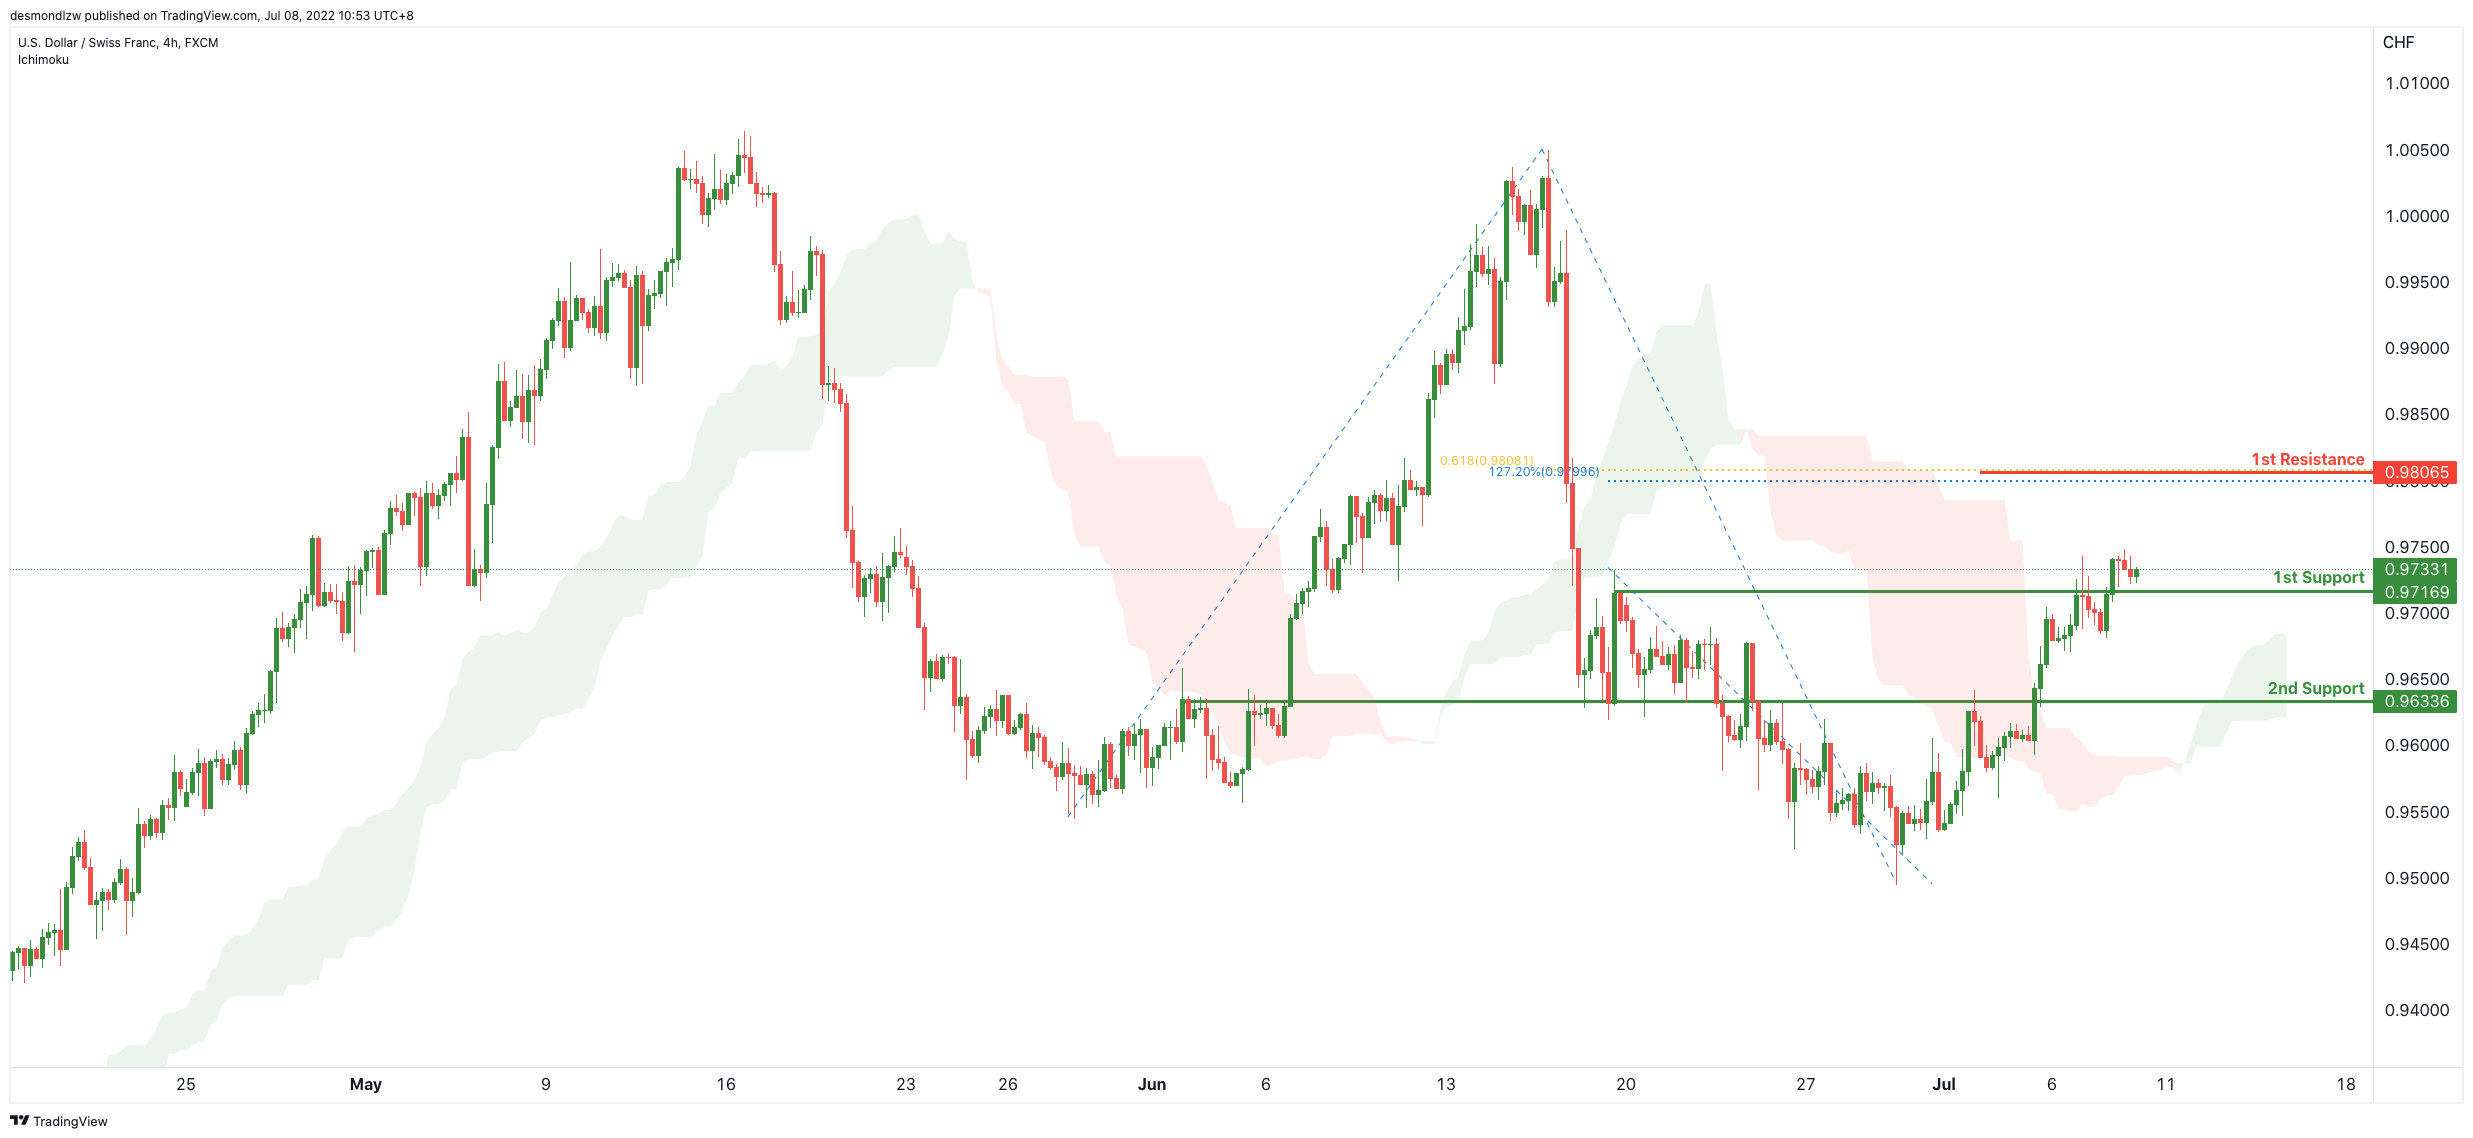
On the H4, with price moving above the ichimoku cloud, we have a bullish bias that price will rise from our 1st support at 0.97169 where the horizontal pullback support is to our 1st resistance at 0.98065 in line with the 127.2% Fibonacci extension and 61.8% Fibonacci retracement. Alternatively, price may not break 1st support and head for 2nd support at 0.96336 where the horizontal pullback support.
Areas of consideration
- 1st support level at 0.97169
- 1st resistance level at 0.98065
EUR/USD :
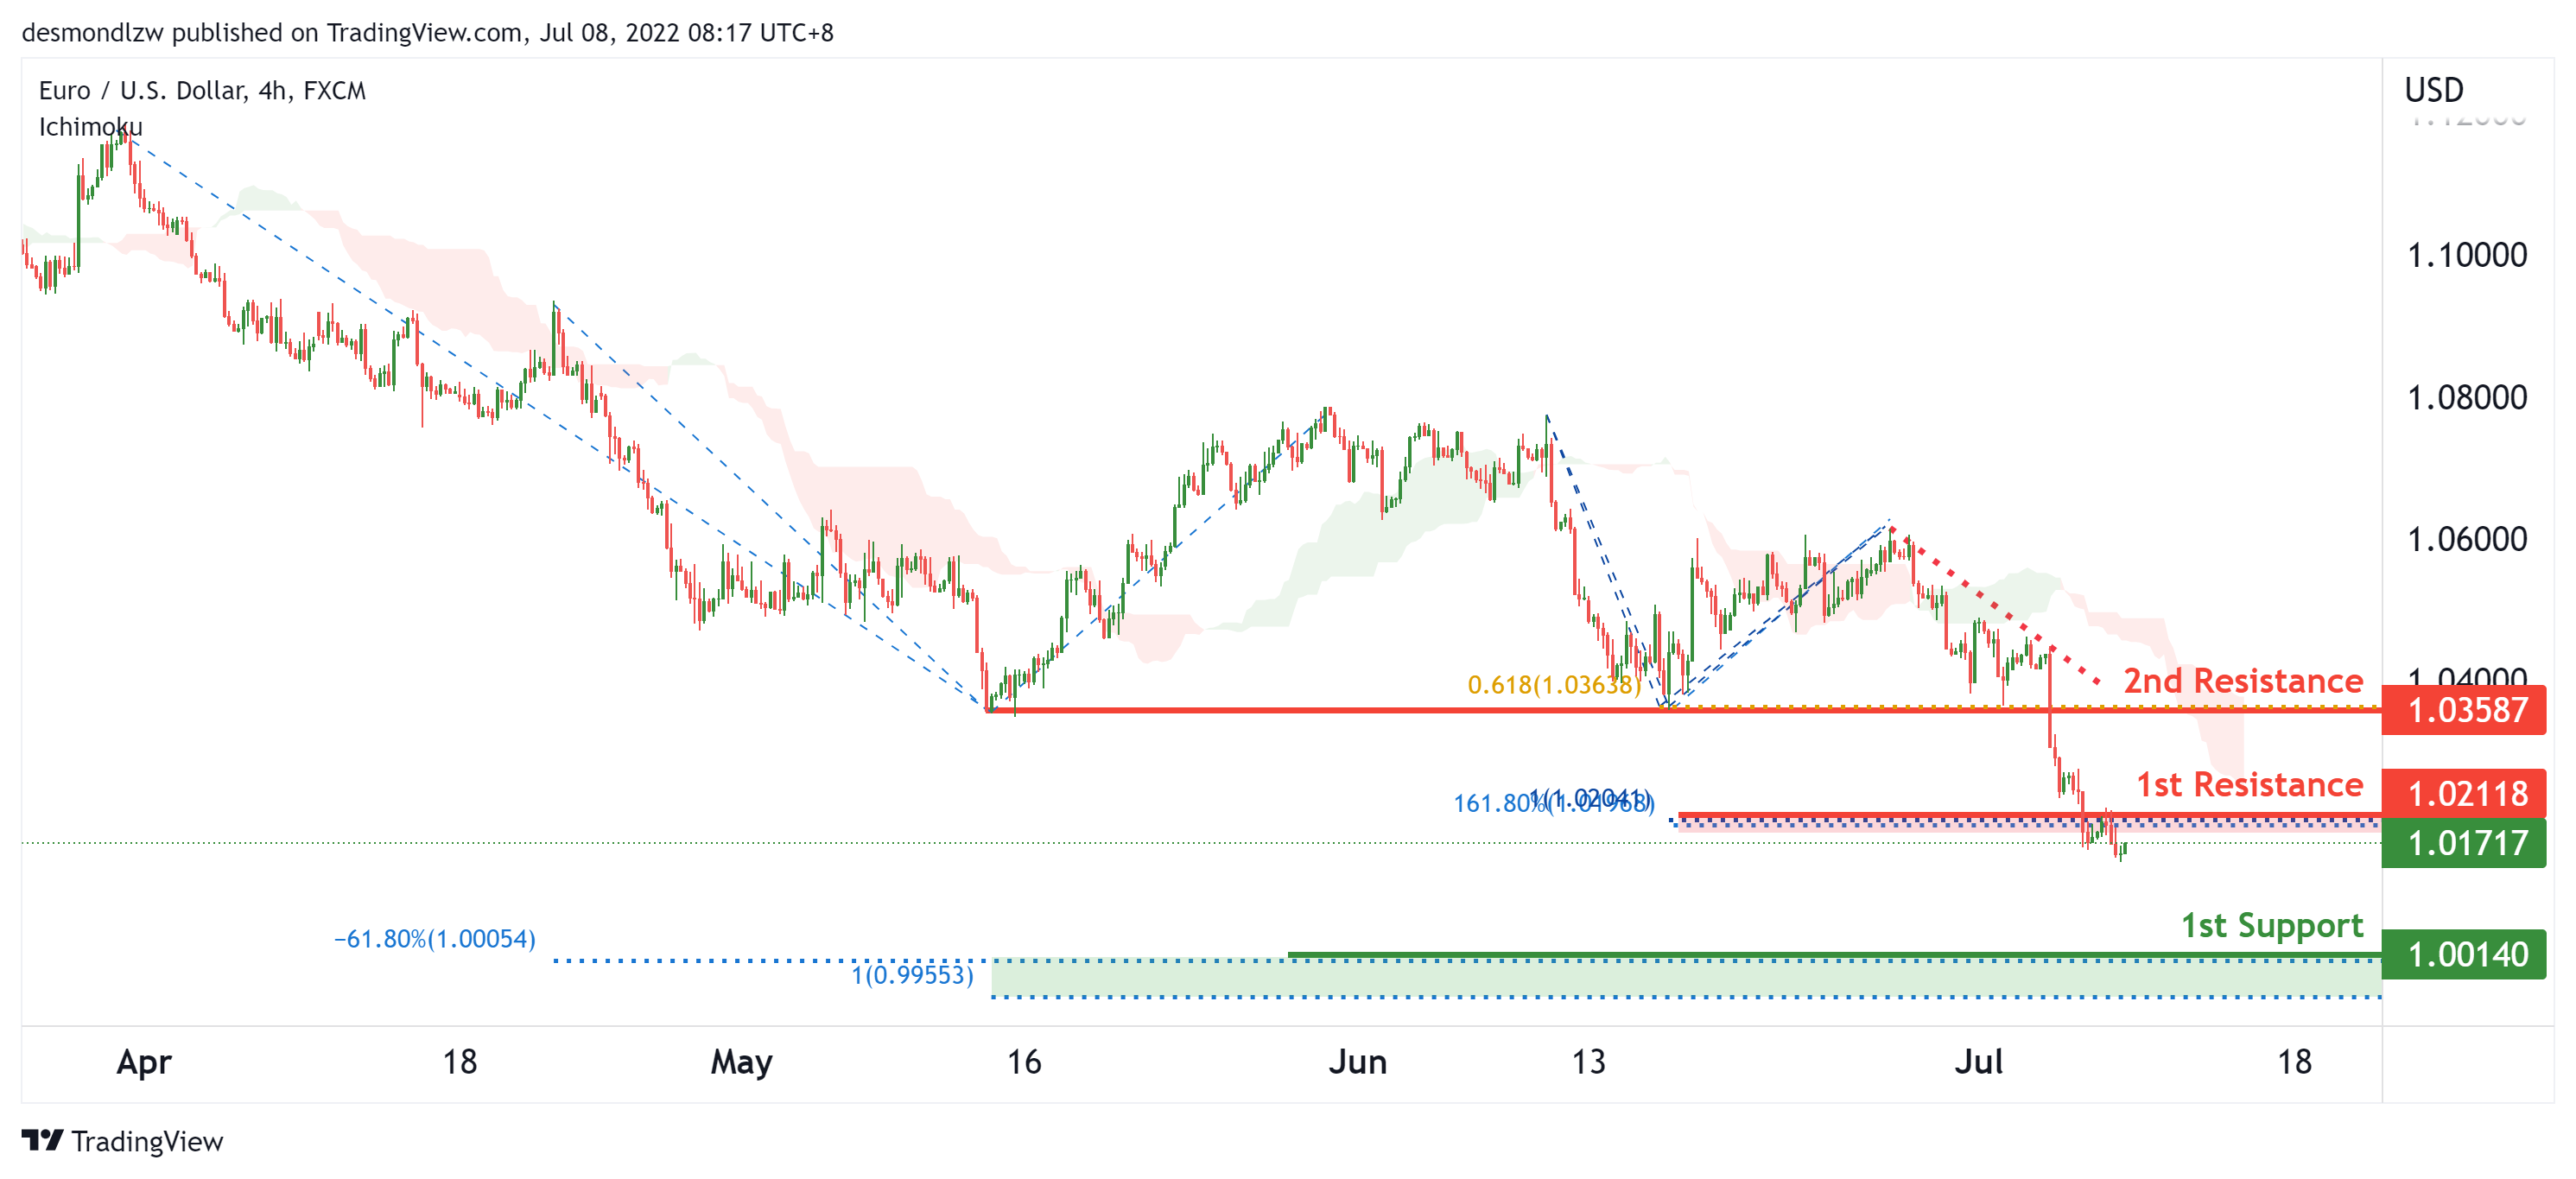
On the H4, with price moving below the ichimoku cloud and in a descending trendline, we have a bearish bias that price will continue to drop from the 1st resistance at 1.02118 in line with the 161.8% fibonacci extension and 100% fibonacci projection to the 1st support at 1.00140 in line with the 100% fibonacci projection and -61.8% fibonacci expansion. Alternatively, price may reverse off 1st resistance and rise to the 2nd resistance at 1.03587 at the pullback swing low in line with the 61.8% fibonacci projection.
Areas of consideration :
- H4 1st resistance at 1.02118
- H4 1st support at 1.00140
USD/JPY:
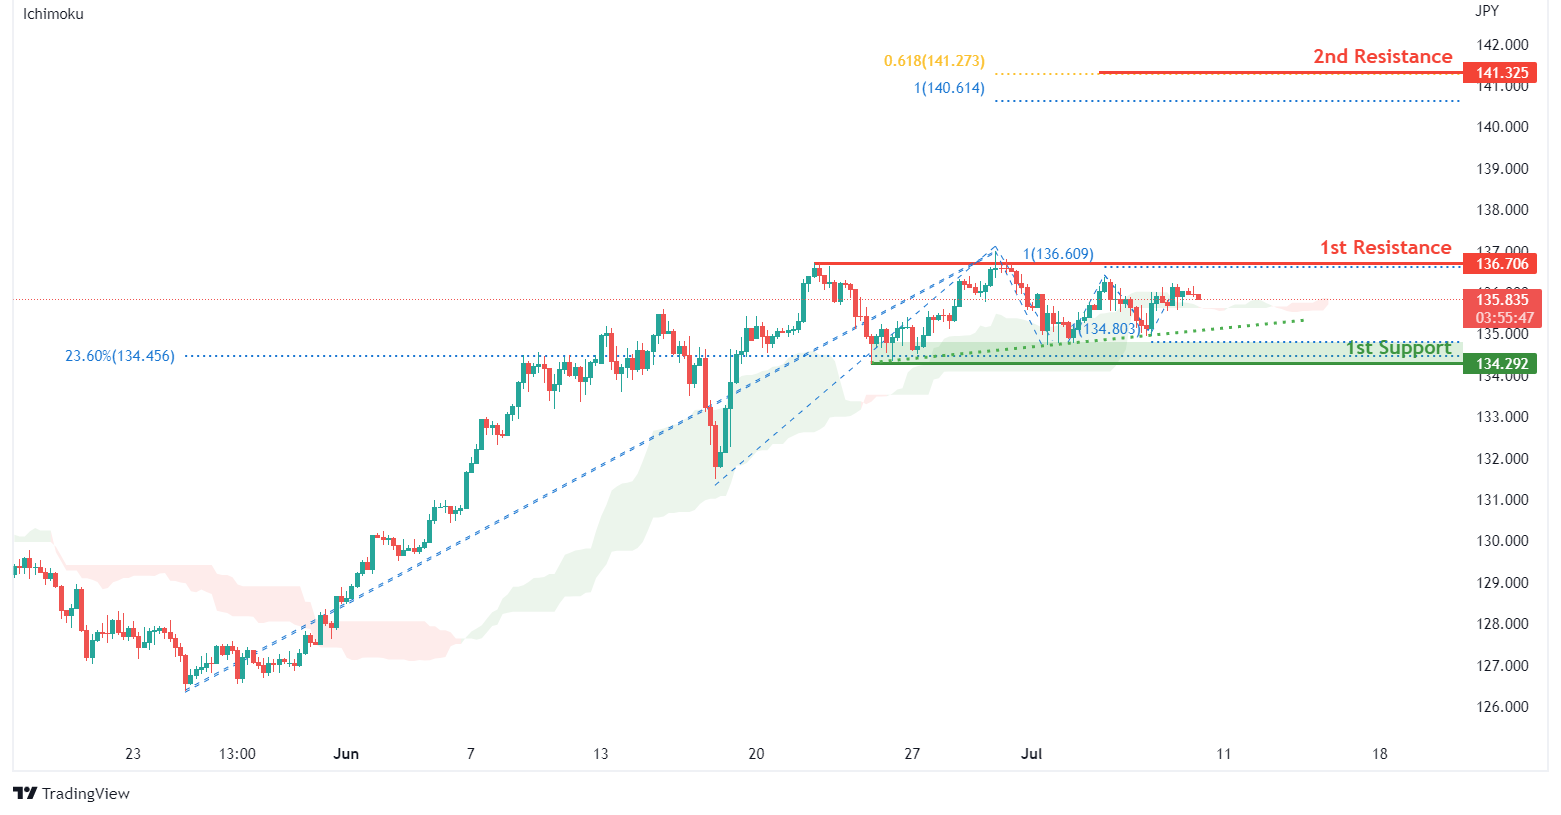
On the H4, with price moving along an ascending trendline and above the ichimoku indicator, we have a bullish bias that price will rise to our 1st resistance at 136.706 in line with the swing high resistance and 100% fibonacci projection. Once there is upside confirmation of price breaking 1st resistance, we would expect bullish momentum to carry price to 2nd resistance at 141.325 in line with 61.8% fibonacci projection and 100% fibonacci projection. Alternatively, price could drop to 1st support at 134.292 in line with the swing low support, 100% fibonacci projection and 23.6% fibonacci retracement.
Areas of consideration:
- H4 time frame, 1st resistance at 136.706
- H4 time frame, 1st support at 134.292
AUD/USD:
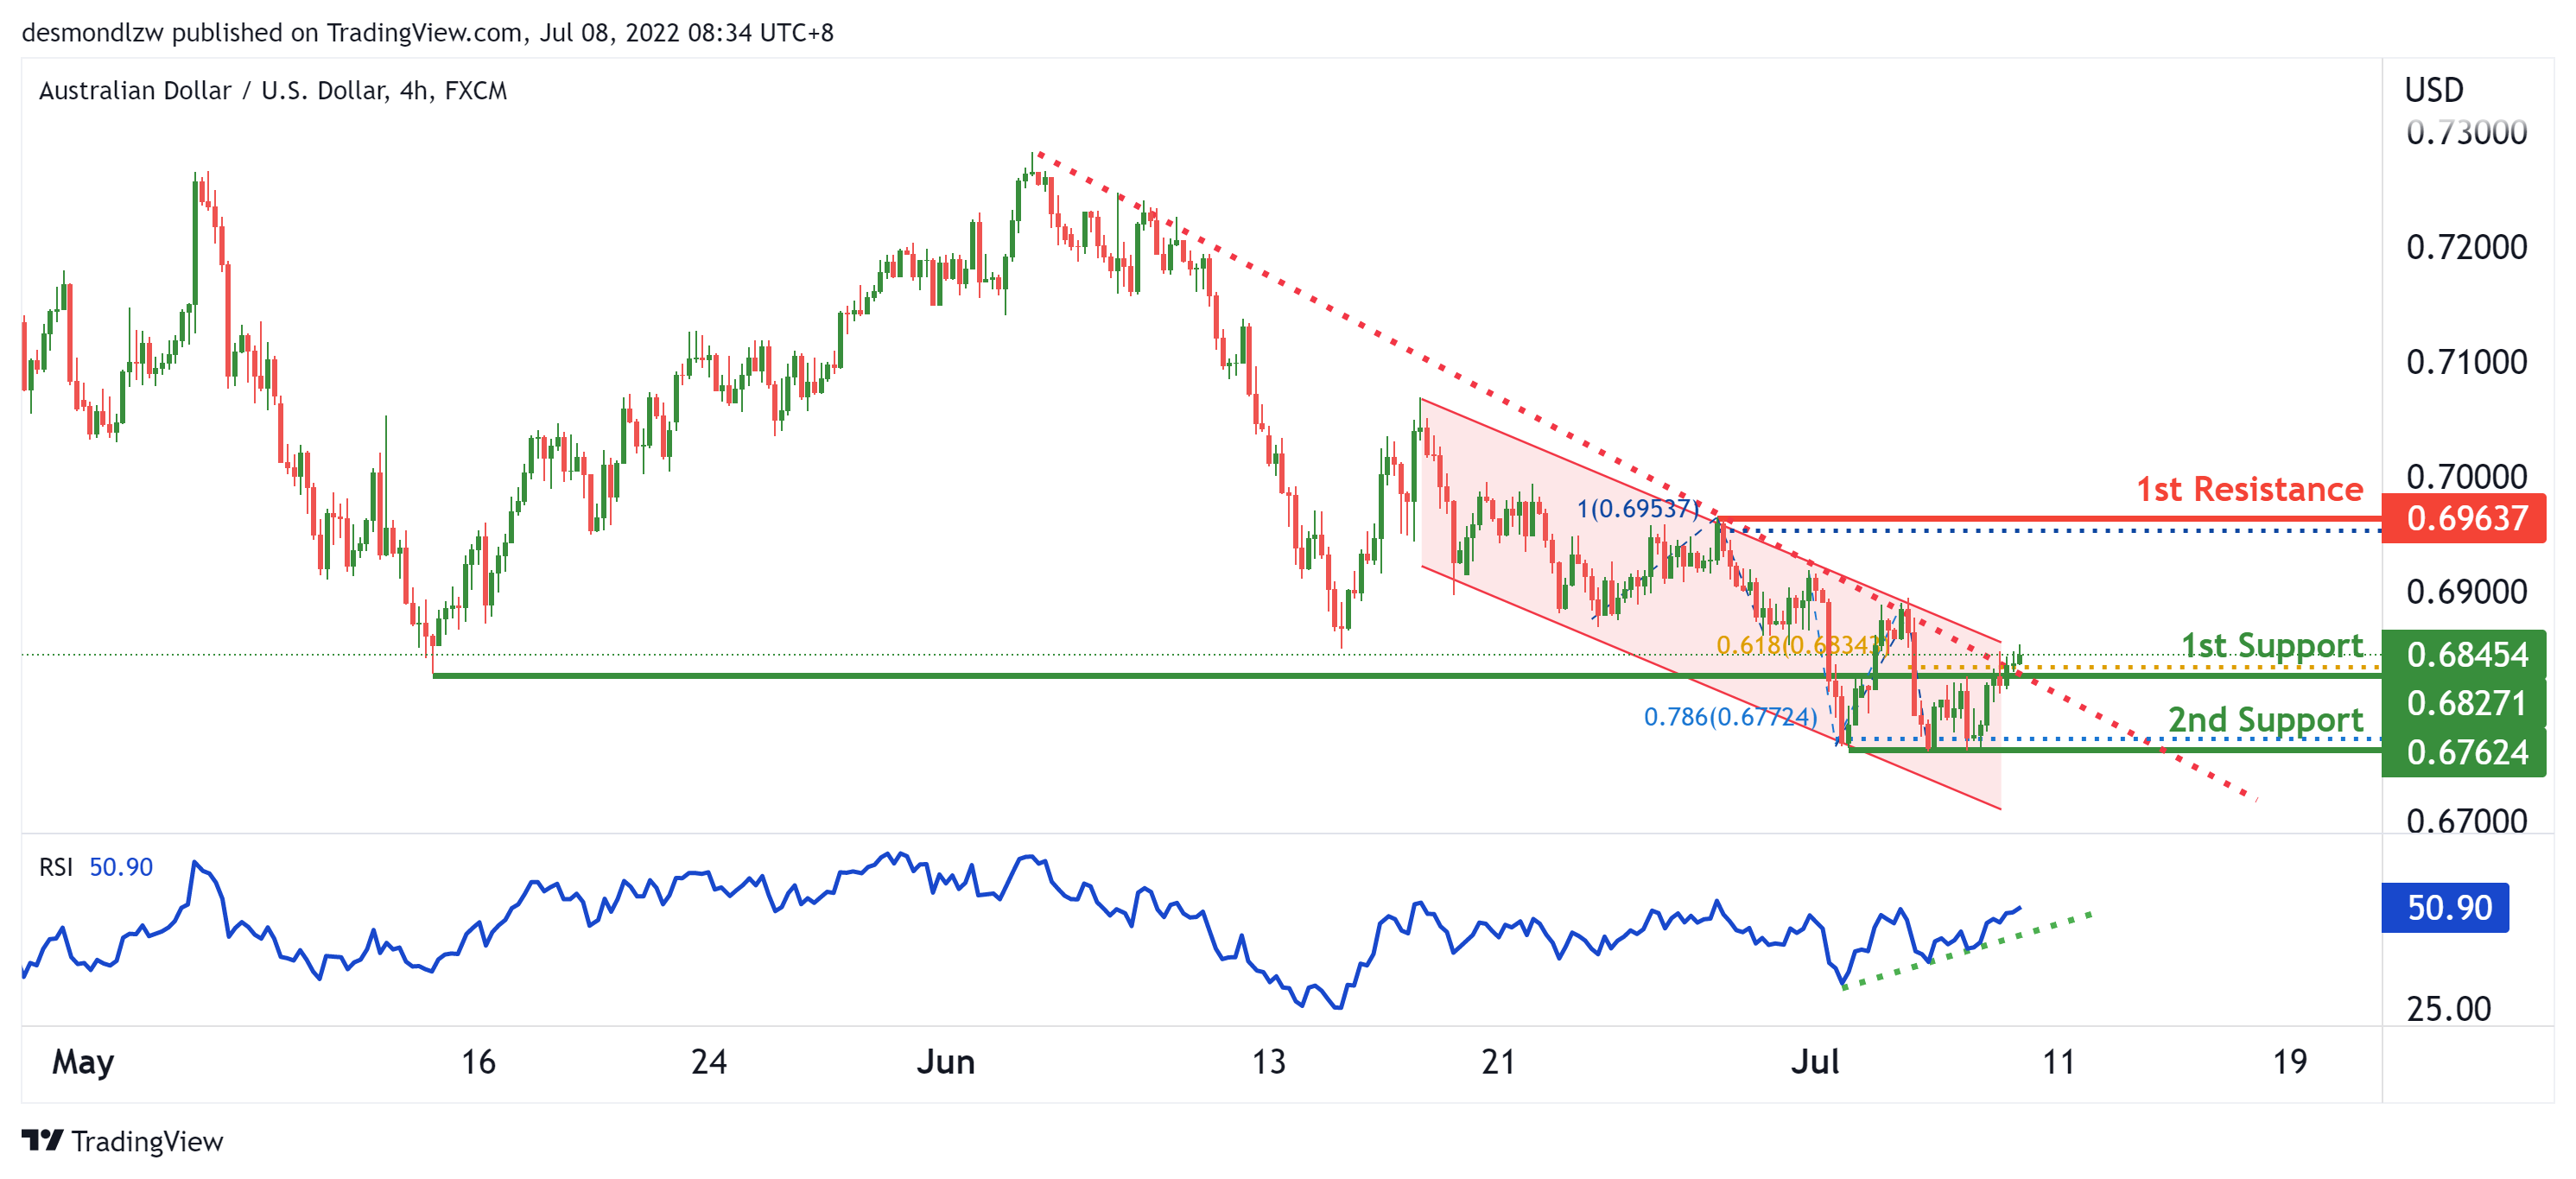
On the H4, with price recently breaking out of the descending trendline and RSI moving in an ascending trendline, we have a bullish bias that price will continue to rise from the 1st support at 0.68182 in line with the pullback support and 61.8% fibonacci projection to the 1st resistance at 0.69637 at the swing high in line with the 100% fibonacci projection. Alternatively, price may reverse off the 1st support and drop to the 2nd support at 0.6724 at the swing low in line with the 78.6% fibonacci projection.
Areas of consideration
- H4 1st resistance at 0.69637
- H4 1st support at 0.68182
NZD/USD:
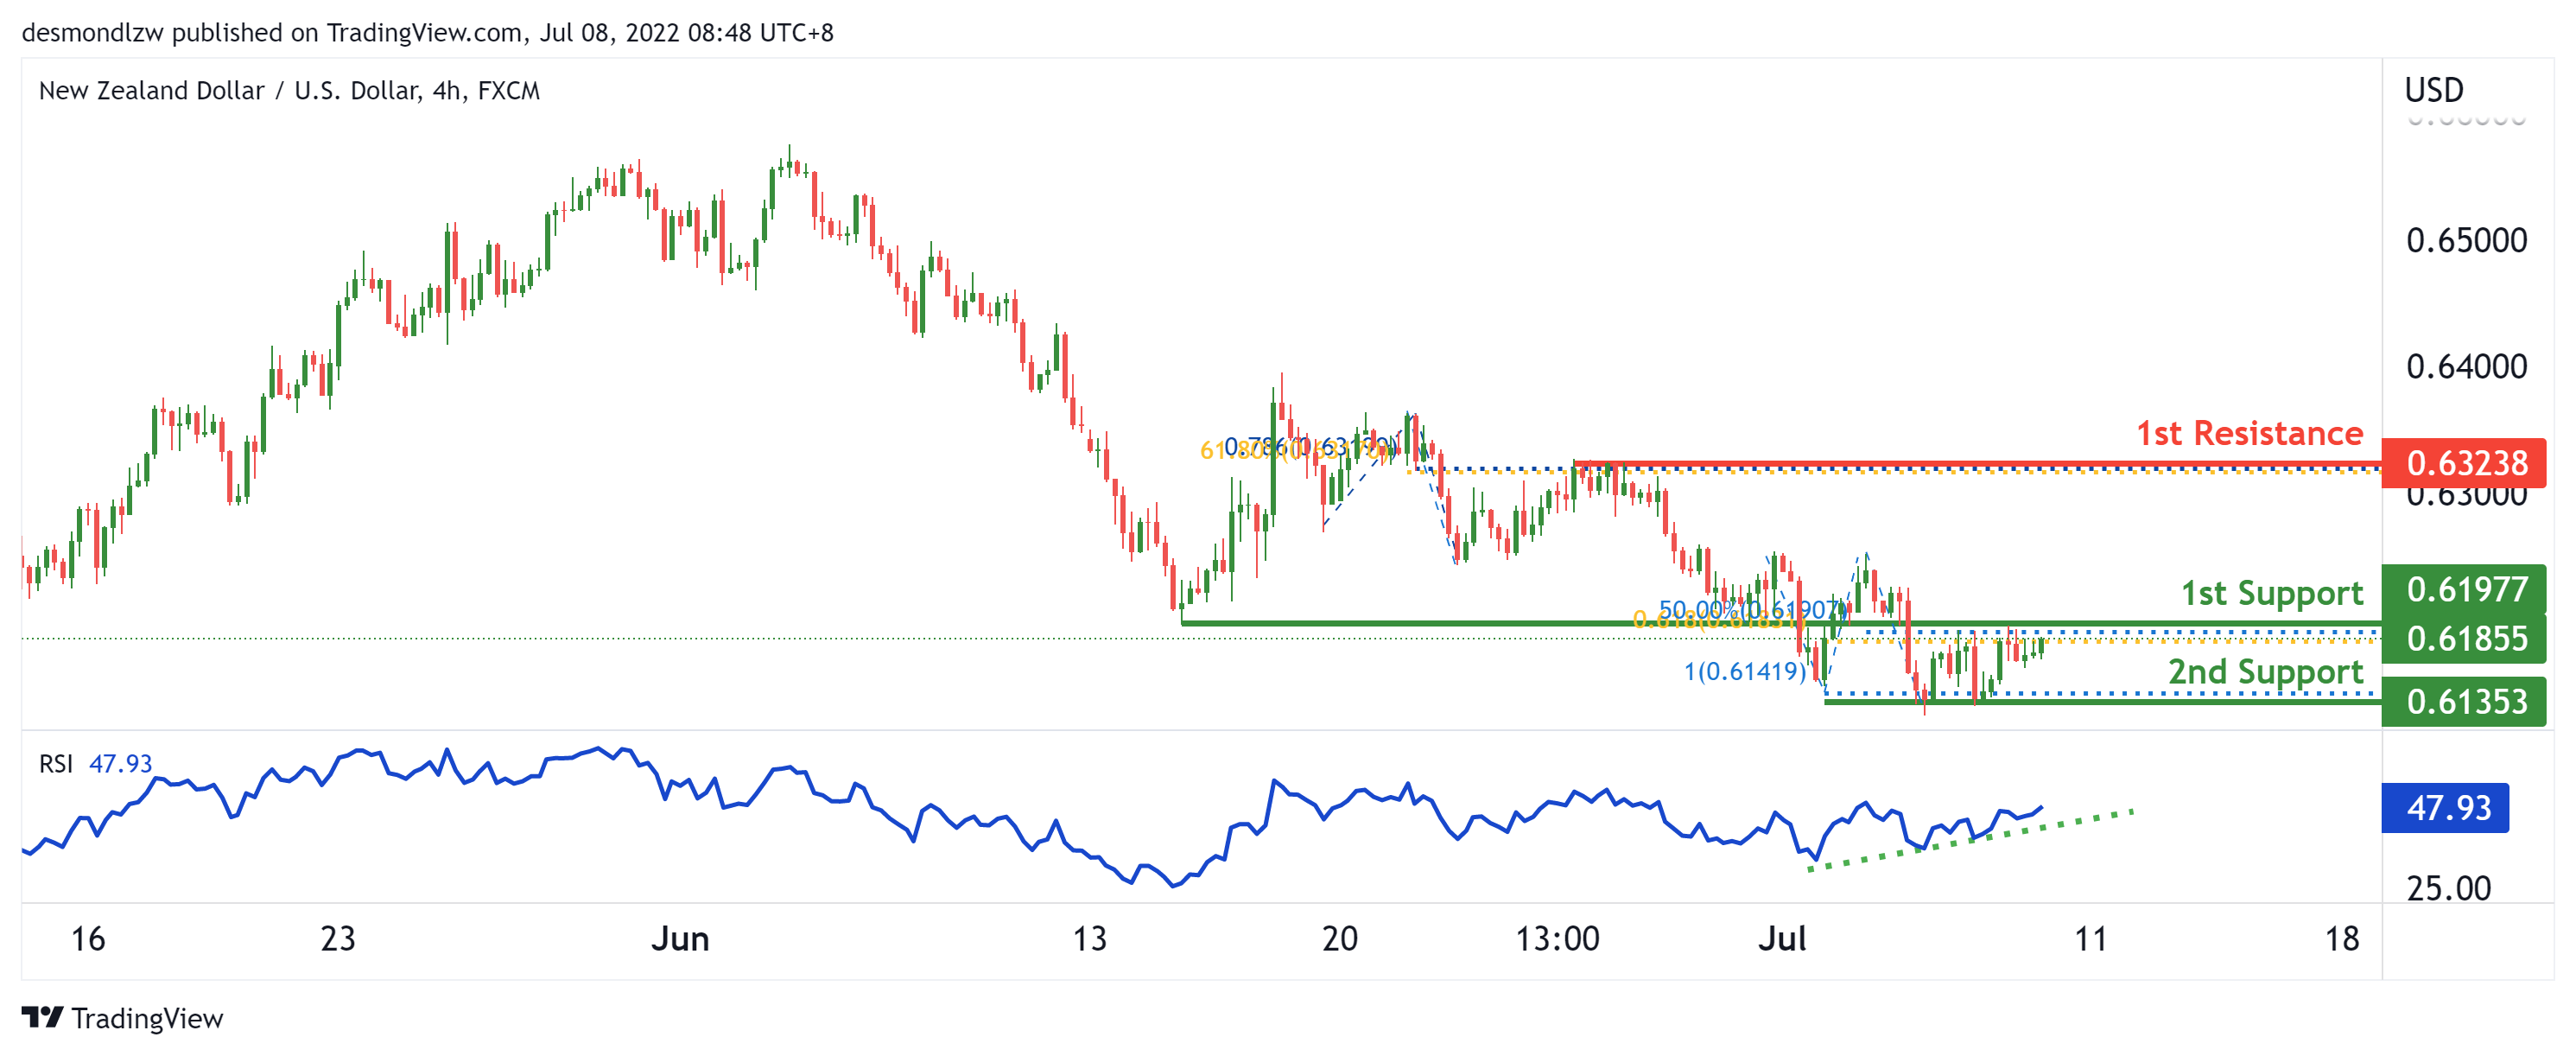
On the H4, with price moving in an ascendig trendline on the RSI, we have a bullish bias that price will continue to rise from the 1st support at 0.61977 in line with the pullback support, 50% fibonacci retracement and 61.8% fibonacci projection to the 1st resistance at 0.63238 at the swing high in line with the 78.6% fibonacci projection and 61.8% fibonacci retracement. Alternatively, price may reverse off the 1st support and drop to the 2nd support at 0.61353 at the swing low in line with th e100% fibonacci projection.
Areas of consideration:
- H4 time frame, 1st support at 0.61977
- H4 time frame, 1st resistance at 0.63238
USD/CAD:
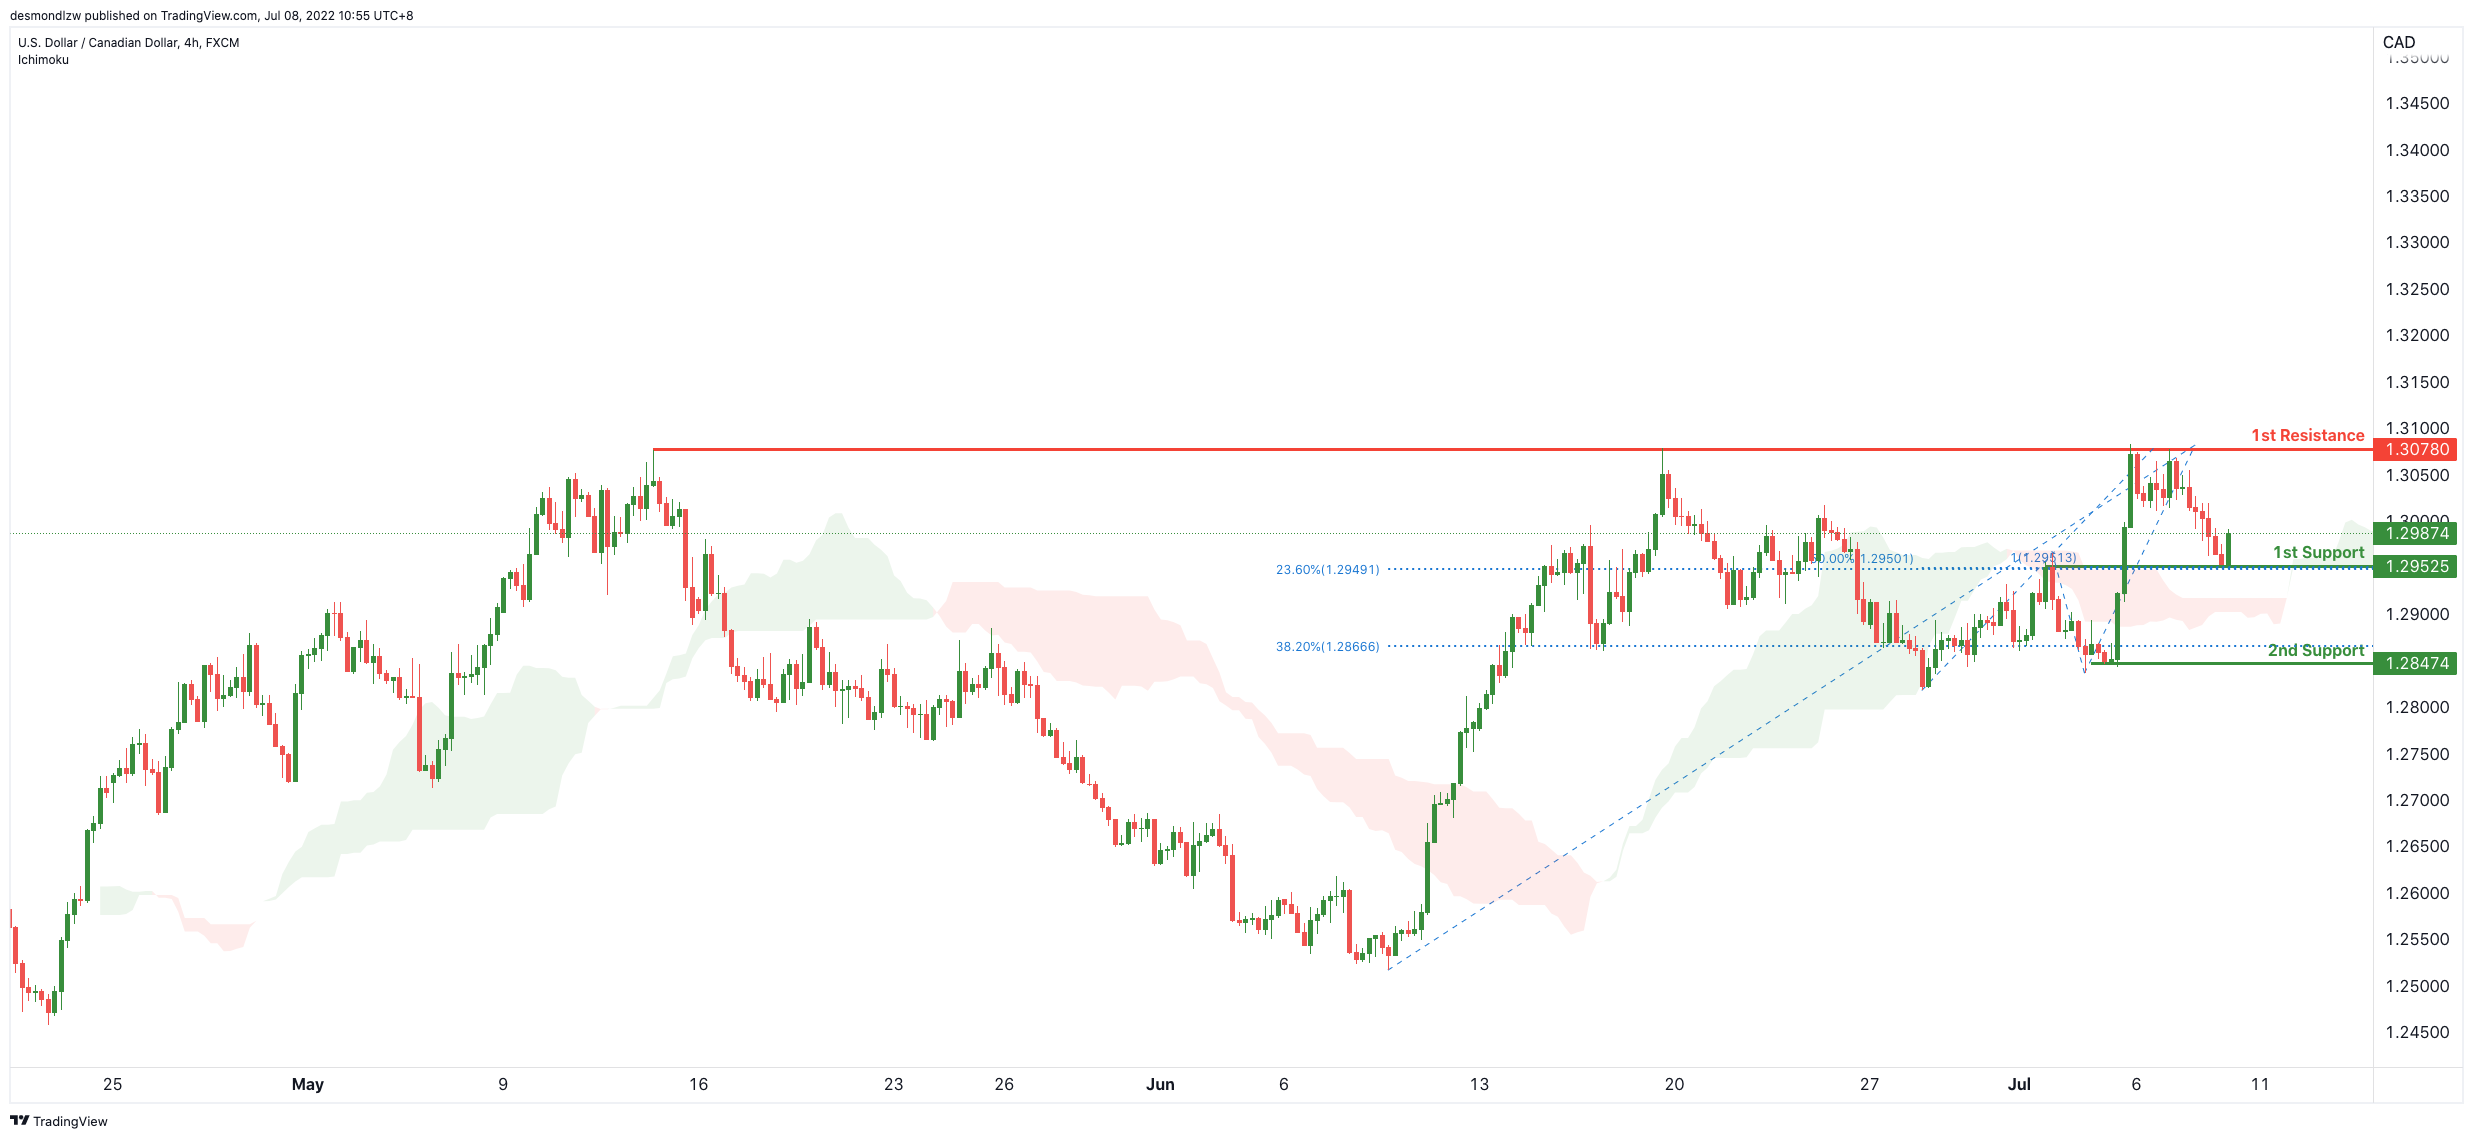
On the H4, with price moving above the ichimoku cloud, we have a bullish bias that price will rise from our 1st support at 1.29525 where the horizontal pullback support and fibonacci confluence are to our 1st resistance at 1.30780 in line with the horizontal swing high resistance. Alternatively, price may not break 1st support and head for 2nd support where the horizontal swing low support is.
Areas of consideration:
- H4 time frame, 1st resistance at 1.30780
- H4 time frame, 1st support at 1.29525
OIL:
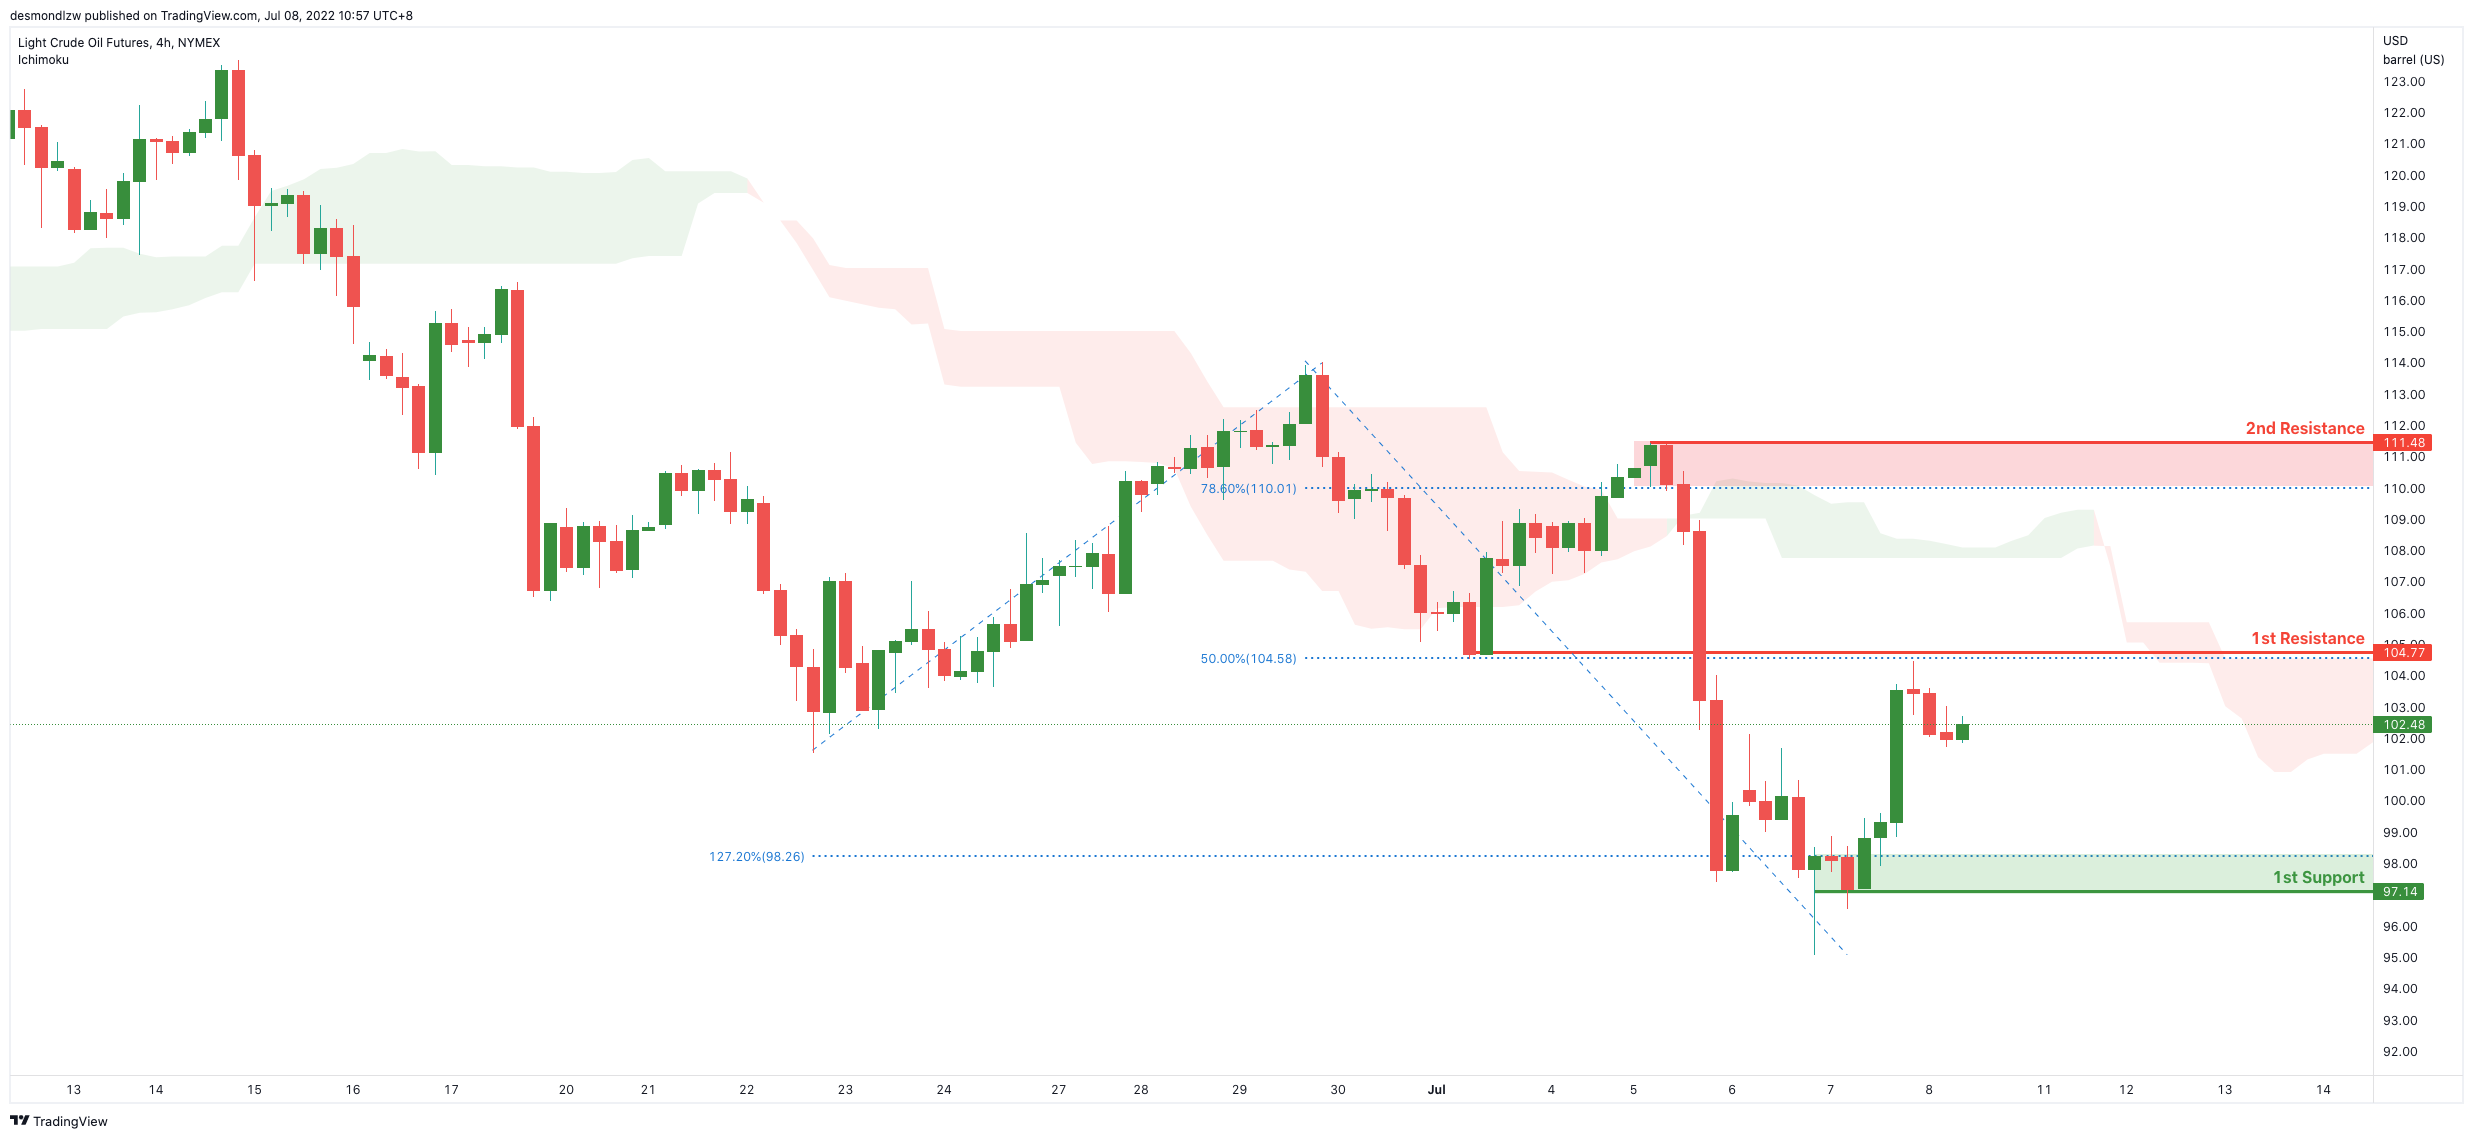
On the H4, with price moving below the ichimoku cloud, we have a bearish bias that price will drop to our 1st support at 97.1 where the horizontal swing low support is from our 1st resistance at 104.22 in line with the horizontal pullback resistance and 50% Fibonacci retracement. Alternatively, price may break 1st resistance and head for 2nd resistance at 111.34 where the horizontal swing high resistance and 78.6% Fibonacci retracement is.
Areas of consideration:
- H4 time frame, 1st resistance of 104.22
- H4 time frame, 1st support of 97.1
Dow Jones Industrial Average:
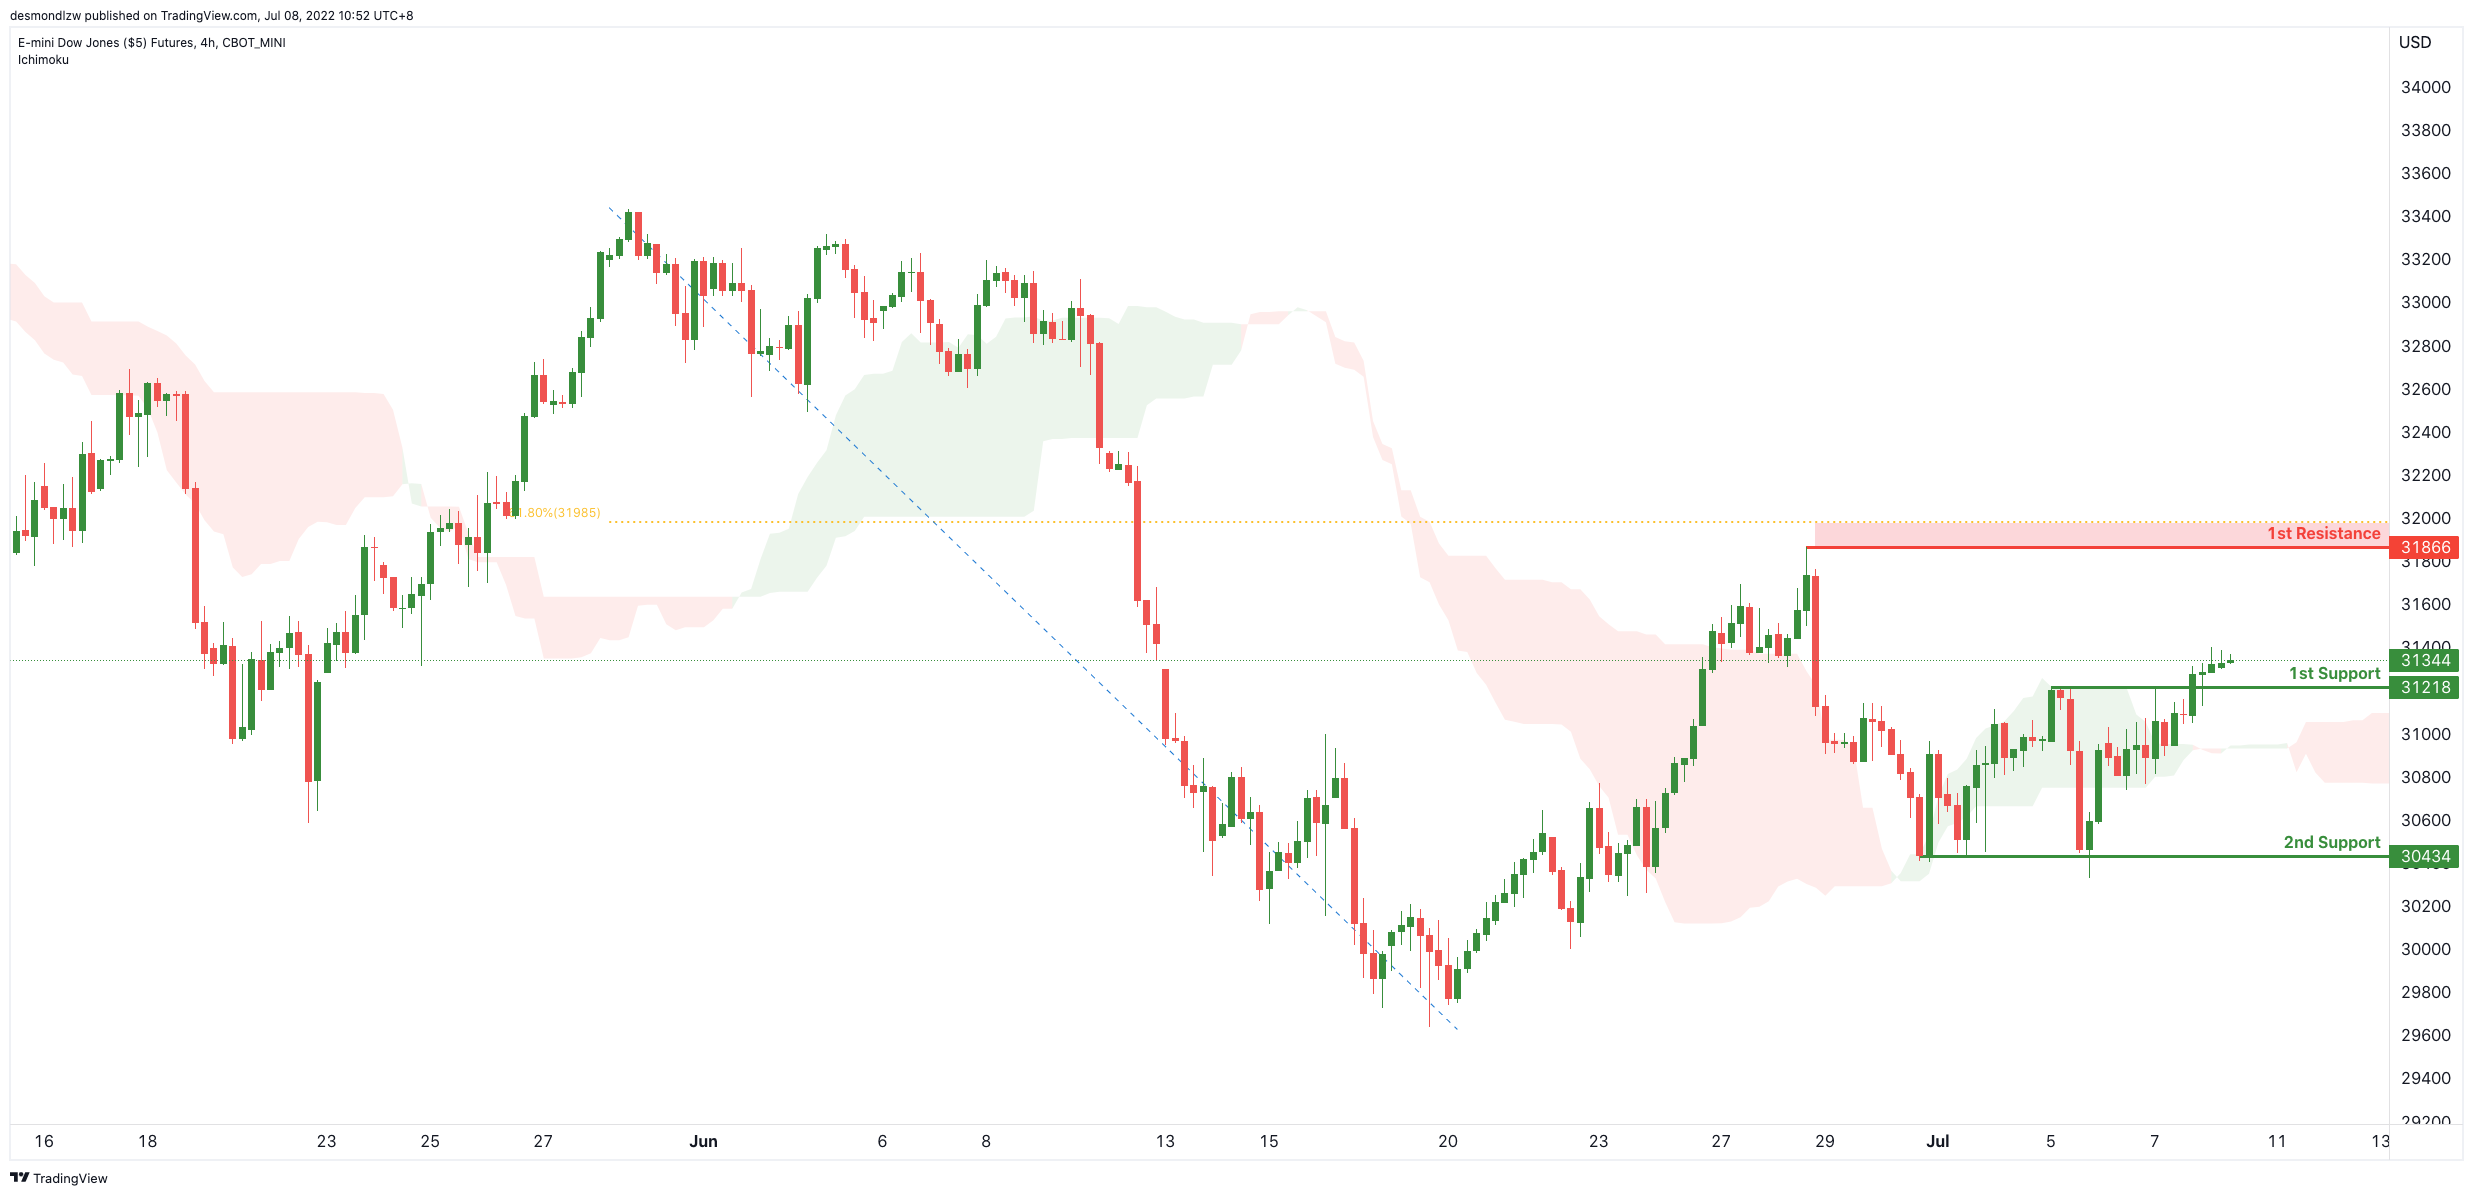
On the H4, with price moving above the ichimoku cloud, we have a bullish bias that price will rise from our 1st support at 31218 where the horizontal pullback support is to our 1st resistance at 31866 in line with the horizontal swing high resistance. Alternatively, price may not break 1st support and head for 2nd support at 30434 where the horizontal swing low support.
Areas of consideration:
- H4 time frame, 1st resistance of 31866
- H4 time frame, 1st support of 31218
Why We Expect Another 50 Basis Points in August and Then a Pause
The Reserve Bank Board decided to increase the cash rate target by 50 basis points to 1.35% at its July Board meeting. The decision was expected by Westpac and widely anticipated by the market and other analysts.
The Governor's July decision Statement provides ample flexibility for the next Board meeting on August 2. From our perspective the key objective of scrutinising the Statement is to detect whether there appeared to be any clear signal that the Board planned to scale back the sequence of 50 basis point moves which we have now seen for two consecutive months. Since the RBA began announcing the cash rate publicly in 1990 it has never raised the cash rate in two consecutive meetings by 50 basis points each. However, the Governor's statement made no reference to that historical precedent, something that may have been done if he was signalling the intention to scale back the moves. Neither did he assess that the stance of policy had moved from stimulatory to the neutral range.
He sounded more confident about the inflation outlook, noting that the Bank expected that the inflation rate would peak later in 2022. On the other hand, he did observe that the real time data on the labour market and household spending had lifted. We note that this has been despite the sharp deterioration in consumer confidence. However, the resilience of household spending to date has relied upon a strong reopening effect and the release of spending capacity as the savings rate returns to more normal levels. We see those effects fading through 2022 with spending in the December quarter and 2023 falling well short of long run trend.
The Governor stopped referring to rates as "very low" but did not substitute that term with a more moderate assessment. Of some significance was the strong emphasis in the Statement on the importance of inflationary expectations. And most importantly he implied that the June quarter Inflation Report would be pivotal to future decisions. With all this in mind and given our upbeat forecast for the June inflation report (5.8% headline; 4.5% trimmed mean), we remain comfortable with our expectation that the Board will decide on a further 50 basis point lift at the August 2 meeting. In light of that significant expected lift in inflation both headline and underlying it is appropriate for the Board to lift rates by a further 50 basis points , while the policy setting is still stimulatory, to emphasise its commitment to returning inflation to the target range of 2–3%.
However, we are expecting the Board to pause in September and October. A key to that decision to pause will be the RBA's assessment of the level of rates that constitutes a neutral policy stance. We assess that stance as being in the 1.5–2.0% range. Neutral is the rate at which policy is neither stimulatory nor contractionary.
Given the powerful transmission from the cash rate to the household sector (we assess that 90% of borrowers will be directly affected by the RBA's cash rate policy by end 2023), "neutral" has been falling as households have lifted their leverage.
But we cannot be certain of the level of neutral and many central banks have followed the Greenspan example (paraphrased), "I will tell you where neutral is when we get there!" That is the right approach and argues for a near-term pause in the RBA's tightening cycle to assess the cumulative impact of a series of out sized rate increases.
The concept that neutral is "zero real" when inflation is back at the middle of the target band might be an interesting theoretical approach for a steady state analysis but "zero real" is hardly relevant when annual inflation is trending towards 7%.
For example, if inflation was back at 2.5% the dampening impact on the economy of inflation (through the squeeze on household budgets) would be much weaker than the current situation where inflation is more than double 2.5% and rising. With inflation playing a much more prominent role in restraining real activity the level of interest rates required to align demand with supply is appropriately lower – not higher which would be the result of targeting zero real as "neutral".
Consequently, some notion that "neutral" should be 2.5% (zero real) seems misplaced in this extraordinary cycle. There have been some reports that the RBA sees neutral as 2.5% but that is likely to be a theoretical "steady state" assessment – not an approach which is relevant to the current situation.
But to support our expectation that the Board will pause in September we will need to see a significant change in the wording in the August Statement, highlighting some if not all of: how far rates have moved in such a short time; describing the rate of 1.85% as in the neutral zone; noting the much higher frequency of RBA meetings than other central banks: while firmly indicating that further increases will be required.
It will also be important to assess the Bank's revised forecasts which print on August 5, three days after the Board meeting, with the August Statement on Monetary Policy.
As we have done quite successfully through this current cycle, we have chosen to forecast the best policy rather than follow any implied guidelines from the RBA. For September, having firmly established the RBA's inflation targeting credentials over the previous four meetings, the Board's best policy option will be to pause to assess the high frequency response (confidence; house prices; new lending; housing related spending such as durables) and global developments before resuming the cycle following the September quarter Inflation Report. That Report is likely to see underlying inflation lift further to around 4.8% requiring a further, but scaled back, response of 25 basis points to emphasise that the Board remains focussed on its inflation objectives.
Our expected peak in the cycle (2.6%) is likely to be reached in February 2023, although the Board is unlikely to be able to indicate such an expectation.
A further pause in March in recognition that policy is firmly in the contractionary zone would be appropriate to again observe developments in the economy. By then we expect the very clear indications that the economy has slowed substantially with consumer spending growth well below trend; house prices well on the way to our 14% contraction target by end 2023; housing activity signalling an imminent contraction; the FOMC on hold; and the US economy losing all momentum.
But the key will be the March quarter Inflation Report where we expect to see annual inflation, both headline and underlying showing the first signs of falling (headline 6.6% to 5.6%; underlying 4.8% to 4.2%). Although annual inflation will still not be within the target band the Board will be observing a significant easing in supply side inflation pressures which are likely to continue as global demand slows and supply adjusts to elevated prices. The obvious easing in demand in the economy supplemented by increasing overseas arrivals will be closing the demand/supply gap in the labour market and provide the Board with ample justification to maintain its pause.
Cliff Notes: Recession Talk
Key insights from the week that was.
Policy actions and talk of recession have filled the headlines in Australia and across the world this week.
The July RBA meeting was as expected, with another 50bp hike decided upon by the Board. As detailed by Westpac Chief Economist Bill Evans, there was nothing in the statement to dissuade us of the view that the July hike will prove the second of three consecutive 50bp hikes June through August, necessary to combat historic inflation and associated risks. Arguing in favour of this forecast and our belief that a further 75bps of tightening will be delivered in 25bp increments November through February was the close attention paid by the RBA to the continued rise of Australian inflation as a result of global and domestic pressures; our tight labour market; and recent strength in consumer spending. Downside risks to growth here and abroad are being monitored closely but, at least for the time being, remain secondary to the inflation threat.
On the data front, regarding housing, both dwelling approvalsand housing finance surprised materially to the upside in May, largely due to idiosyncratic factors around lumpy high-rise approvals and the clearing of processing backlogs from April. The underlying detail still echoes a down-beat assessment for Australia’s housing sector however, with a broad-based decline in private detached housing approvals (-2.4%mth) and persistent weakness in owner-occupier financing due to affordability concerns (-3.7%ytd). The backdrop of rising building costs, an aggressive RBA tightening cycle and a housing market correction are set to sustain the down-trend in dwelling construction and home lending over the remainder of 2022.
Australian trade also materially beat expectations in May, the surplus widening to a record high of $16bn on strength in resource exports. Total exports gained 9.5% as resource earnings rose 12.0%. Of particular note for resources, coal export earnings soared 20% on higher prices and volumes. Smaller in scale but also of significance, service exports gained 4.8% as tourism earnings increased 10% following a 29% jump in April as border re-opening continues to take effect. Along with continued strength in domestic demand, the price of oil and a weaker Australian dollar saw imports up 5.8% in May, partially offsetting exports’ strength.
Offshore, the minutes of the FOMC’s June meeting were the focus. There was nothing new in the content or tone of the report, with a clear emphasis on the risks to the outlook for inflation and inflation expectations as well as robust belief in the health of the US economy. That said, for inflation, it was emphasised that a key driver of the current wave is supply not demand – limiting the FOMC’s ability to curb aggregate inflation with rate hikes; and regarding growth, at numerous times in the minutes evidence of building downside risks was provided. Both trends are consistent with our baseline view that another 75bp hike will be delivered in July and be followed by a 50bp hike come September; however, thereafter the pace and scale of rate increases will decrease abruptly, with only another 50bps of tightening occurring across the November and December meetings.
Of greater significance for term interest rates is that we see a series of rate cuts commencing from Q4 2023, totalling 125bps by Q4 2024. This will leave the fed funds rate at 2.125% into the medium-term, with the risk additional cuts will be required. Consequently, we see the US 10 year back at 2.00% from the end of 2024. Whereas historically high inflation in the US is proving transitory (slowly), increasingly it seems the primary risk for their economy is below-trend growth becoming an enduring force. On this risk, note that the US is already on the cusp of two consecutive negative quarters of GDP at June 2022, while the outlook for income, financial conditions and confidence is adverse. These are themes explored in depth in our July edition of Market Outlook, due for release later today on Westpac IQ.
Despite the ongoing deterioration in US economic prospects, the US dollar continues to ride high. Indeed, midweek it reached a new multi-decade high of 107.3 on a DXY basis, now 107.1. The primary trigger for the move was a gas worker strike in Norway which hit already-fragile belief in the security of Europe’s gas supply hard. The strike looks to have already ended, but the weight on Euro from global risk aversion will take a lot longer to lift. With the market effect of the Ukraine conflict receding, and given the resilience the Euro Area economy has shown to date, we believe Euro will rebound in the second half of this year and continue on this uptrend through 2023. The relative and absolute economic foundations of FX markets are also a key topic of discussion in Market Outlook.
AUD/USD: Moving Closer to the Land Down Under?
- AUD/USD has spend four consecutive weeks below 0.70
- RBA interest rate hike expectations have cooled since June
AUD/USD Under Pressure
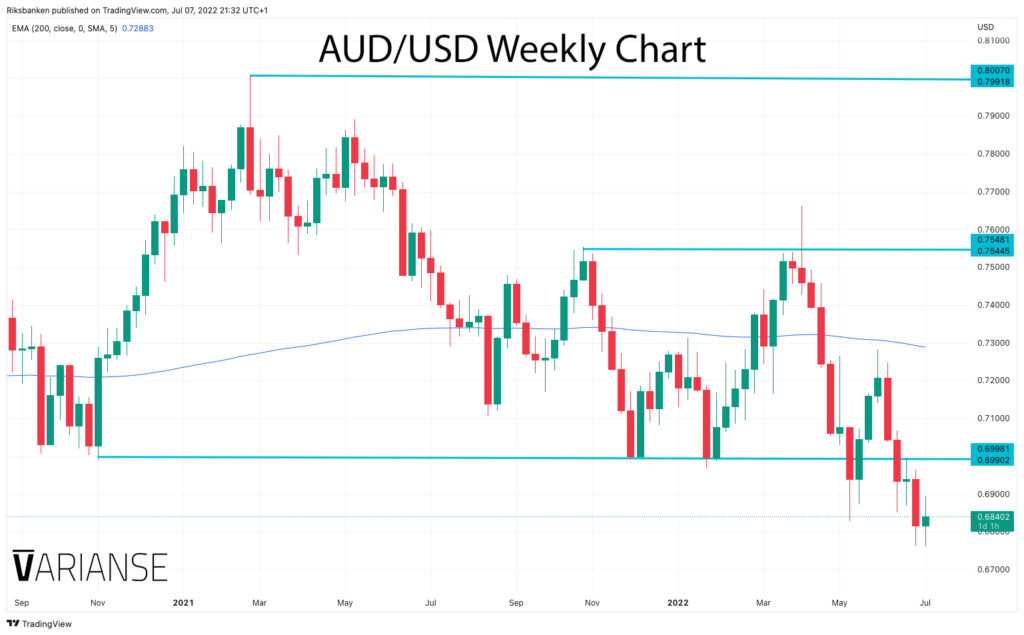
AUD/USD has spent four consecutive weeks below 0.70, a region of major support, which also marked the bottom of its longer-term structural range. The gradual pairing back in RBA interest rate hike expectations, global recessionary concerns, and the Fed talking tough on interest rates, all seem to be at play here. Potentially, that doesn’t bode well for AUD/USD in the near term. In my mind, the only fundamental path for the AUD to really outperform is if global inflation pressures ease; that Fed interest rate hike expectations drop dramatically; and global recession is avoided. The way conditions stand at the moment, that seems an unlikely trinity.
RBA Rate Expectations Fall
Only this June, interest rate markets were pricing the RBA policy rate at 4% by year end. At the time of writing, that figure was c 3.2%, while guidance from the RBA sits at 2.5%. Markets, in my opinion, risk a gradual convergence toward the RBA guidance rather than the other way around. That’s not to say the RBA is not serious about fighting inflation, which stood at 5.1% in Q1. Aside from global inflation pressures, Australia’s low unemployment rate and strong Q1 GDP number all warrant tighter monetary policy. Hence why the RBA has raised interest three times this year, most recently by 50 bps in July to 1.35%. More is also likely to come by way of a 50 bps hike in August.
Fast Paced Transmission
Instead, markets may be underestimating the relative speed of RBA monetary policy transmission. This is visible in the housing market, which is financed largely by variable rate mortgages, and is already coming under strain for the current interest rate rises. A recent article in the Guardian newspaper, does a very good job highlighting the level of mortgage stress in the Australian economy. PMI data also points to services sector activity slipping in Q2, after a relatively strong start to April. As a result, the RBA guidance may be closer reality than what's currently implied by the market.
Narratives Need to Change
On that basis, the RBA is going to have trouble keeping pace with the Fed’s advertised tightening path. That may not be a good outcome for a high yielding currency like AUD/USD. Were the Fed to switch gears after slipping the world into recession, that would likely be equally unfavourable for a growth sensitive currency such as the Australian dollar. In other words, the narrative that suits AUD/USD isn’t currently any of those circulating financial markets at the moment.
EURGBP Wave Analysis
- EURGBP broke key support level 0.8500 50
- Likely to fall to support level 0.8430
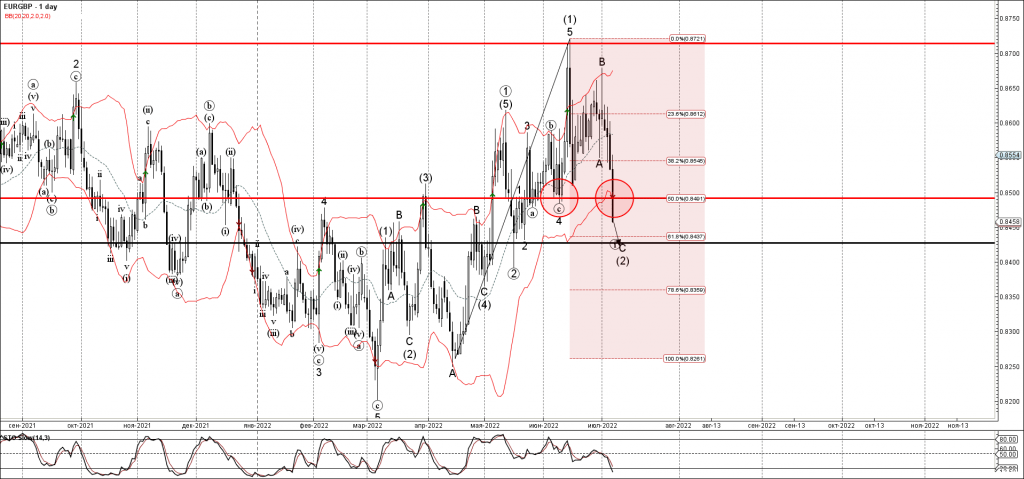
EURGBP currency pair recently broke the key support level 0.8500 (which stopped the previous waves a and (4), as can be seen below).
The breakout of the support level 0.8500 coincided with the breakout of the 50% Fibonacci correction of the upward impulse from April.
Given the strongly bullish sterling sentiment, EURGBP can be expected to fall further toward the next support level 0.8430 (target for the completion of the active ABC correction (2)).
GBPJPY Wave Analysis
- GBPJPY reversed from support level 160.50
- Likely to rise to resistance level 164.00
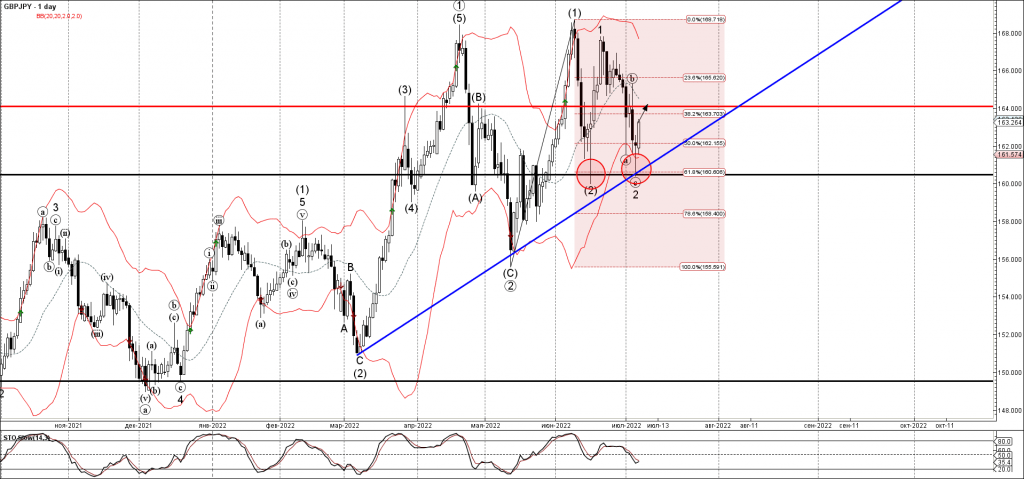
GBPJPY currency pair recently reversed up from the key support level 160.50 (which stopped the previous wave (2) in the middle of June).
The support level 160.50 was further strengthened by the nearby lower daily Bollinger Band and the support trendline from March as well as the 61.8% Fibonacci correction of the upward impulse (1) from May.
Given the clear daily uptrend, GBPJPY can be expected to rise further toward the next resistance level 164.00.
Eco Data 7/8/22
[php_everywhere instance="1"]
Oil Outlook: Below $100 WTI Raises Eyebrows
As WTI’s price plunged below $100 a barrel on the 5th of July, it raised eyebrows across the markets, as analysts are pushed to the edge of their seats, pondering on what’s to follow. Without a doubt, recession fears and slowing demand helped bring down oil at levels once seen before during May 2022, however the question is raised to whether those were indeed the catalysts responsible for the turnaround from soaring prices in recent months. In this report we aim to shed light on the current developments of oil and present various opinions alongside a technical analysis at the end.
As post pandemic lockdown restrictions were lifted earlier this year, the strong demand for oil consumption collided with the persistent supply shortages, as the world turned to normalization. Fueling the fire, the disrupted energy supply lines from the Russian invasion in Ukraine, were an additional blow to the supply side, that urged the European continent to scramble for alternative solutions. As a result, we are seeing an upshot of ever-increasing inflationary pressures worldwide and central banks tighten their monetary policies by aggressively hiking interest rates, in an attempt to contain surging prices, to slow down economic growth and cool down their economies. Nonetheless, as oil supply remains scarce and since demand significantly outweighs it at the moment, the problem persists.
The address by US President Biden towards refiners in late June, accusing them of heavy price gauging at the expense of consumers and urging them to expand capacity, may have impacted oil prices recently, accelerating the downfall. Refiners are indeed, logging impressive profits lately as the S&P Energy sector is currently the only one in positive territory year-to-date. According also to U.S. Energy Information Administration “refiners have been running at almost 94% of operable capacity, close to the 96.6% peak reached in the past decade”. Moreover, in the recent OPEC meeting at the start of July, it was agreed to stick to a planned output increase in August. They decided to raise the output by 648,000 barrels per day for both months July and August, a decision hailed by President Biden’s administration which has repeatedly pushed for the group to pump more. Those targets if met, will set an end to the historic output cuts, implemented during the pandemic.
The unexpected death of Mohammad Barkindo, the OPEC Secretary General, announced on Wednesday the 6th of July, leaves the oil cartel without a head, during ambiguous times for the markets and could spark increased uncertainty in the grander scheme of this for the energy market.
Turning towards WTI price action, the drop below the psychological $100 a barrel level on the 5th of July may ignite short term speculative trading, not necessarily reflecting fundamentals, but instead grabbing the attention of technical analysts, traders and algos, rushing to jump onto the opportunity.
Looking ahead, oil prices flirt with a third consecutive weekly decline. On the other hand, according to some analysts, oil price may face a larger correction higher, should OPEC in the next meeting on the 3rd of August, fail to meet the agreed upon output projections. Also worth looking at the is release of US Baker Hughes report tomorrow 8th of July, reporting the active drilling rigs in the US and consequently hinting towards the increase or decrease in demand for oil.
Technical Analysis
WTI H4
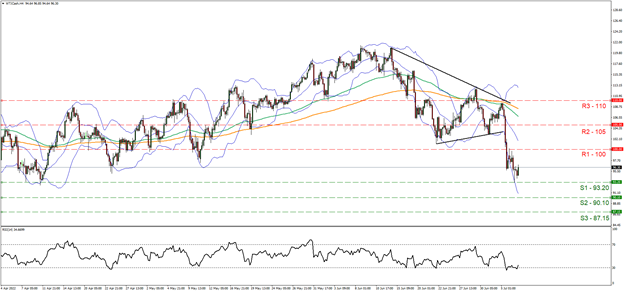
Looking at the WTI H4 chart we observe the downward trend was initiated on the 16th of June, where it dropped from the $121 level, broke below the $100 psychological level on the 5th of July and found support at the $93.20 (S1) level during yesterday’s session, the 6th of July, a level once saw before back in April 2022. In our view WTI appears overextended, having excessive selling pressure, causing the sharp decline from the $110 range to the where it is currently found, the $96 range. Thus, we believe a rebound towards the $100 level could be a possibility in the short-term horizon, followed by consolidation. Supporting our view in regard to the overextended scenario, is the RSI indicator shown below the 4-hour chart, with a reading of 26 crossing below the 30 oversold level. Should the bears continue to reign over, we may see the break of $93.20 support (S1) line and the $90.10 (S2) line as well. Should the bulls take over, we could expect a break above the $100 psychological hurdle, now serving as resistance (R1) line and move decisively towards the $105 resistance (R2) level.
Canadian Dollar Eyes Job Data in Canada, US
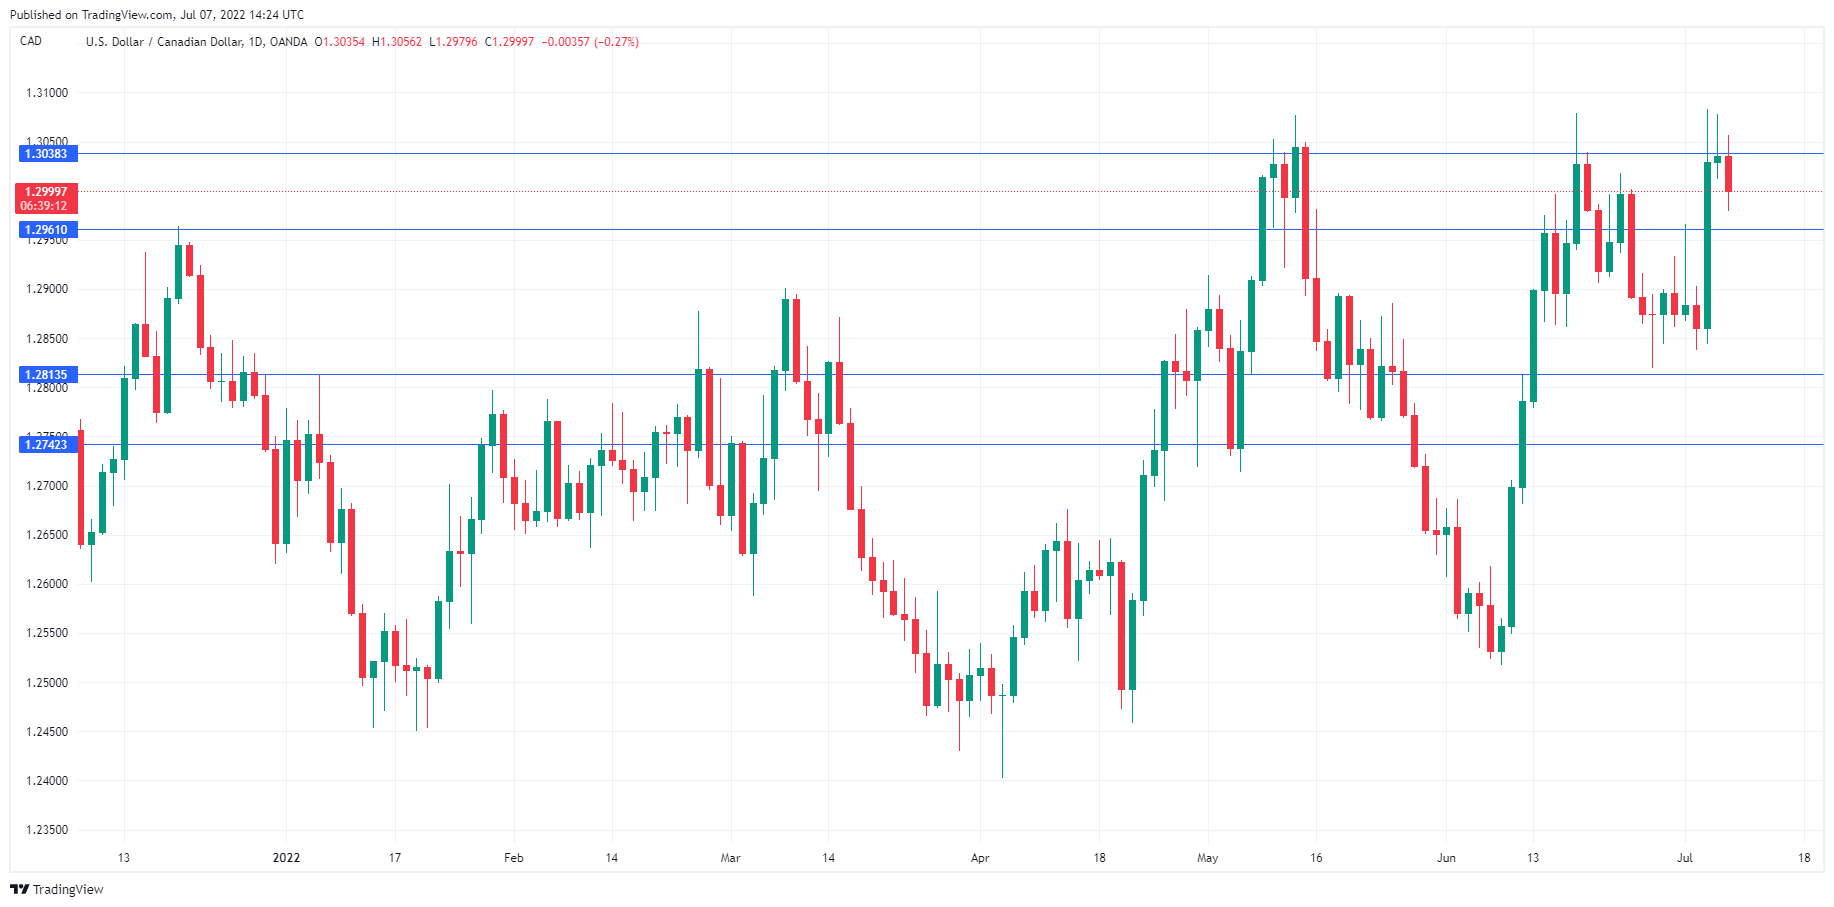
The Canadian dollar is back below the 1.3000 line today. USD/CAD is trading at 1.2987 in the North American session, down 0.37%. On the economic calendar, Canada’s Ivey PMI was a major disappointment, slowing to 62.2 in June from 72.0 in May (74.0 exp.).
US nonfarm payrolls expected to slow in June
Friday’s focus will be on job numbers, with both Canada and the US releasing employment reports for June. Canada is expecting a modest gain of 23.5 thousand new jobs, down from the 39.8 thousand gain in May. With the unemployment rate forecast to remain unchanged at 5.1%, the US numbers could prove to be more interesting to investors. US nonfarm payrolls used to be hotly anticipated as one of the most important indicators, but NFP has taken a step back as inflation and Fed rate policy have become the main focus of the markets. Still, tomorrow’s NFP could be a market-mover, as investors may rely on it for guidance on the health of the US economy.
Investors are hearing the “R” word bandied around more often, as fears of a recession in the US are rising. The economy showed negative growth in the first quarter, and another quarter of contraction would officially signify a recession. If NFP misses expectations, investors could view it as a sign that the economy is losing steam. That could well make the Fed ease up rate hikes and push the US dollar lower. The consensus for NFP stands at 275 thousand, after a gain in May of 390 thousand.
Canada has not been immune from soaring inflation, as headline CPI rose to 7.7% in May, its highest level since January 1983. Similar to the Federal Reserve, the Bank of Canada has scrambled to tighten policy in order to wrestle down inflation, which has become the central bank’s public enemy number one. There are expectations that the BoC may follow the Fed’s lead and deliver a super-size 0.75% rate hike at its July 12th meeting. Inflationary pressures are broad-based across the economy, which raises the risk of inflation and inflation expectations becoming entrenched, something the BoC is keen to avoid.
USD/CAD Technical
- 1.3038 is a weak resistance line. Above, there is resistance at 1.3109
- USD/CAD has support at 1.2961 and 1.2813