Sample Category Title
Strong Dollar Weighs on Gold
Sentiment is mixed. The S&P 500 eked out small gains after a volatile session. The FOMC minutes, released yesterday, came as a confirmation that the Federal Reserve (Fed) remains fully committed to bringing inflation down, even if it means slower growth.
But, the recession talk, lower energy prices, and the softening Fed hawks despite yesterday’s hawkish minutes weigh on the US 10-year yield, which shortly slipped below the 2.75% yesterday, then rebounded above the 2.90% mark. The 2-year yield, which is more sensitive to short term Fed decisions, hangs around 2.96%, which keeps the 2-10 year portion of the US yield curve inverted, which is read as ‘recession’ is either here, or about to hit the fan.
Gold on freefall
Gold prices are on a freefall mode. Softer US yields and limited risk appetite should normally play in favour of gold, but we see the contrary happening. The strength of the US dollar clearly overshadows gold, and prevents the yellow metal from gaining at a time it could potentially gain.
The price of an ounce dropped to $1732 yesterday. And the breakout below the long-term triangle is a sign that we could see further losses in yellow metal in the medium run.
Silver is also under a decent selling pressure below the $20 mark due to the strong dollar. And silver is relatively cheap compared to gold. The mint ratio, which is the ratio between the two precious metals, is now around 90, whereas you would normally expect it to stay between 50 and 80 by historical averages. This means that, either gold is still too expensive and could fall further, or silver has become relatively cheap and should correct to the upside. Whether the prices should go up and down will depend on the dollar’s performance.
Strong dollar, bad pain
The dollar trades at 20-year highs, and keeps pushing higher. The strong dollar doesn’t only hurt gold, and other currencies, but it also translates into higher inflationary pressures in the rest of the world. It also harms the US companies’ earnings expectations: every item sold in terms of other currencies bring less money to the US when converted back to the US dollars. So it would be a good thing to see the dollar soften a little from the actual levels.
Activity in Fed funds futures price in more than 93% chances for a 75bp hike by the end of this month. But good news is, there is little chance the hawkish pricing goes much worse than that. On the contrary, many people think that the developments since the Fed’s June decision have been so dramatic, that 1. The minutes are no more relevant as things changed too much since the last decision, and 2. The recession chatter and the morose market sentiment could even bring the Fed to hike by 50bp only instead of 75bp this month. Now, I don’t think the Fed will make a U-turn to hike by 50bp at the next meeting, but the market chatter hints that the market pricing has room to get more dovish rather than more hawkish. And that’s good news to slow the dollar rally, stop the selling in the equity markets, and allow for a rebound.
Bulls out, bears in
We now see a clear pivot in sentiment in crude oil. Investors went from rushing in to buy the dips, to rushing in to sell the top.
The barrel of crude recovered above the $100 level, then came the bears and sent the price to $95 a barrel, a touch above the 200-DMA. We could see a further meltdown toward the $85 level - if the G7 members leave Russia alone.
US and allies consider a price cap to Russian oil at around $40 to $60 per barrel, whereas the US crude trades near $100 and the Russian oil at around $80. It’s a no brainer that Russia won’t sell its oil at such a discount, even less so as they have customers that are happy to buy their oil at a discounted price. The latest data suggests that China doubled its spending in Russin oil, gas and coal during the three months that ended in May, and India multiplied its spending on Russian energy by five in the past year.
Therefore, the G7 leaders are barking to an empty space. And get Vladimir Putin angrier. To retaliate, Putin plans to cut the Kazakh supplies to the West; it is around 1.5 million barrels less per day, which could’ve been avoided if Biden and allies could simply keep calm for a while.
As such, the upside risks still exist, and we may see price rebound. But it looks like the overall attention shifts to the demand side, and that should keep the topside limited. A strong resistance will likely come in play near the 50-DMA, which stands a touch above the $110 per barrel level.
FOMC Minutes Reality Check
US markets got little solace but more clarity from the FOMC Minutes overnight. It was clear from the minutes that the committee members remained highly focused on culling inflation, even if it was at the expense of a sharp economic slowdown. For July’s meeting, a 0.50% to 0.75% Fed Funds rate hike was most likely. The minutes touched on the need for credibility and as such, I believe there will be no wimp-out by the FOMC at the end of this month, as that would achieve exactly the opposite plus interest.
That was enough to shift the US yield curve higher although most of the gains were concentrated in the two-year tenor which closed back at 3.0% overnight. Ominously, the inversion widened to around eight basis points to the 10-years which finished at 2.92%. Clearly, the street remains on recession watch, and that sentiment will only increase if the inversion across the 2s/5s/10s part of the curve increases.
Still, the US continues to deliver a mixed bag of data although I do accept that the positive releases seem to be generally showing as a series of lower highs. The ISM Non-manufacturing PMI for June edged lower from May, but still posted a healthy 55.3, with the business activity and new order sub-indexes also healthy. Ominously, the employment sub-index slumped to 47.4, contractionary territory. The US Jolts Job-Opening data for May also slowed modestly, but still came in at an impressive 11.254 million job openings, not the stuff of recessions. Still, May seems like a long time ago now and much has changed.
The US data and another night of slumping oil prices likely saved the equity market’s bacon overnight. European stock markets had a huge up day, reversing Tuesday’s losses after the Norwegian Government stepped in to impose a settlement on both sides of the oil workers’ strike. Wall Street could only manage a sliver of modest gains though, in the face of hawkish FOMC Minutes, a soaring US Dollar and rising US bond yields which also continued pricing in a recession.
The Minutes and solid US data also propelled the US Dollar to another series of powerful gains across the currency space, boosted by higher US yields. The big loser was gold which met my next downside target within one day and now threatens long-term support. Despite more credit implosions in the crypto space as the reality of concentration risk in a lending portfolio hits home to those bright young things, Bitcoin has clung to the $20,500.00 region, although it can probably thank its Nasdaq correlation for that.
Oil prices crashed another 5.0% lower overnight, with Brent crude dipping under $100.00 a barrel at one stage. The wipe-out still looks to be very much driven by a culling of speculative longs and trend-following fast money to me, with nothing changing materially in the real world vis-à-vis the supply/demand imbalance.
One part of the world absolutely loving the price slump in oil is Asia's Caligula’s of energy importing. Japan, China, South Korea, and Taiwan. I expect India to feel the same warm afterglow later today. Equity markets in the first four are rallying powerfully today as Brent nibbles at $100.00. Oil is rising in Asia as physical buyers quite rightly jump in to fill their boots with this mid-year Christmas present.
Elsewhere, Australia’s Trade Balance massively outperformed in May, leaping to just shy of AUD 16 billion. The trade balance was boosted by increased exports of natural gas and thermal coal along with accompanying price rises in both. Australian GDP has an upside risk now and will be another reason for the RBA to stay off the fence and keep tightening. Even currency markets couldn’t ignore the data from the Lucky Country today, AUD/USD has climbed 0.50% today, dragging up its feathered Kiwi friend, the New Zealand Dollar, by 0.55% also.
The news isn’t so good from China where the announcement of incentives to buy more electric cars has been tempered by rising cases in Beijing and Shanghai. Tokyo’s local government is also considering new covid restrictions, but the impact has been non-existent. In China, fears over renewed restrictions in Beijing and Shanghai are tempering the oil-induced rally there today.
There is much else on Asia’s data calendar for the rest of the day. Yesterday, Bank Negara Malaysia did what was necessary, and hiked policy rates by 0.25%, but any benefit to the Ringgit was squashed under the US Dollar juggernaut. Markets will be focused on German Industrial Production for May this afternoon, and then US ADP Employment this evening, from which they will try to derive bad guesses on tomorrow evening's US Non-Farm Payroll release.
Given the amount of conflicting noise across asset classes and in the media space now from officials here and there, it wouldn’t surprise me in the least if Asia, quite wisely, decides to sit out the last two days of the week from the side-lines and let the heavily-caffeinated gnomes of Wall Street do their thing. They won’t be able to resist $100 a barrel Brent crude though, merry early Christmas Asia!
Asian heavyweights rally on lower oil prices
The North Asian energy-importing heavyweights are booking impressive gains today as Brent crude slumped to around $100 a barrel overnight. In contrast, Wall Street had a restrained session as hawkish FOMC Minutes push US yields higher and tempered that genetically programmed urge to by the dip. Still Wall Street did manage modest gains, thanks to decent US data elsewhere. The S&P 500 gained 0.36%, the Nasdaq added 0.35%, while the Dow Jones rose 0.23%. US futures are slightly higher in Asia, the S&P and Dow adding 0.10%, with the Nasdaq futures rising by 0.35%, following the Asian heavyweights for a change.
In Asia, lower oil prices and a still-weak Yen have propelled the Nikkei 225 1.45% higher, with South Korea’s Kospi having leapt 2.0% higher. Mainland China markets are also rallying, but less so as covid restriction fears permeate. Still, the Shanghai Composite has risen by 0.50%, while the CSI 300 has climbed by 0.60%. The news is not so good in Hong Kong where virus cases are accelerating, the Hang Seng has edged 0.40% lower today.
In regional markets, Taipei has had a 2.20% oil boost, with Singapore adding 0.25%. Kuala Lumpur and Jakarta are 0.15% higher, Bangkok is 0.30%higher, and Manila has unwound some of its outperformance this week, falling by 1.10%. Australian markets are still very much sticking to the script from Wall Street, with falling resource prices offsetting an impressive trade balance print today. The All Ordinaries has climbed 0.35% higher, while the ASX 200 has added 0.45%.
European markets unwound the Norwegian oil strike sell-off yesterday and may get a further boost from slumping oil prices overnight, although European natural gas prices remain the centre of focus. European markets are unlikely to replicate yesterday’s rally though but should still book a modestly positive start.
US Dollar rally continues unabated
The US Dollar continued its upward momentum overnight after hawkish FOMC Minutes lifted US bond yields higher across the curve. Recession nerves are also serving the greenback well as haven inflows continue to boost it. The dollar index rose 0.52% to 107.04 overnight, easing to 106.87 in Asia. The technical picture remains constructive although the daily relative strength index (RSI) is flirting with overbought territory, suggesting a temporary downward correction is possible. Having broken out of a 5-year triangle at 102.50 in April, its longer-term target remains the 1.1700 area with 1.1000 immediate resistance. Support is at the 1.0585 breakout point, and then 1.0500, followed by 1.0350 and 102.50.
EUR/USD remained under pressure with recessionary woes higher there than in the US. EUR/USD fell by 0.78% to 1.0185 overnight, before edging higher to 1.0200 in Asia. Europe’s energy vulnerability continues to weigh on the single currency and the Norwegian strike settlement, ominously, had no positive impact on the Euro. Since breaking a multi-year support line at 1.0850 in April, Euro has never looked back. An oversold RSI could allow for a more extended recovery, with resistance at the 1.0300 and the 1.0350 breakout, followed by 1.0600. Support is at 1.0160 and then 1.0000.
GBP/USD coat-tailed the Euro lower overnight, with UK politics having little impact on either Sterling or UK equities. GBP/USD fell by 0.30% to 1.1925, rising to 1.1950 in Asia. Immediate support is at 1.1880 and 1.1800, with 1.1400 the medium-term target. Resistance is at 1.2000 and 1.2200.
USD/JPY tested 135.00 overnight, but the rise in US yields lifted back to 135.90, leaving it almost unchanged overnight. In Asia, it has edged 0.15% lower to 135.70. Markets appear to be waiting now to see if the rise in US yields continues, or runs out of steam, dictating the direction of the pair. USD/JPY has resistance at 136.65 and 138.00, with support at 134.25 and 132.00.
AUD/USD and NZD/USD ranged overnight, finishing slightly lower in New York. The huge Australian trade balance number has lifted AUD/USD today, rising 0.60% to 0.6825. That has dragged the Kiwi higher as well, NZD/USD rising 0.65% to 0.6190. AUD/USD has nearby resistance at 0.6850, and NZD/USD at 0.6200. Risks remain skewed to the downside.
Asian currencies faded on US Dollar strength overnight. Although the USD/CNY held steady, the KRW, THB, and PHP lost more ground after a hawkish FOMC Minutes. A raft of new rules to encourage INR inflows by the Reserve Bank of India yesterday say USD/INR trade in a wide range, but ultimately, INR strength proved temporary, and USD/INR closed almost unchanged. Lower oil prices may boost INR today and that is a pattern we are seeing across the Asian FX space, with most Asian currencies booking roughly 0.20% gains versus the greenback. Still, the bigger picture shows Asian currencies remain vulnerable to tighter US monetary conditions and a US recession and today’s strength looks temporary.
Asia buys oil after another overnight slump
Oil had another hugely volatile session overnight as hawkish FOMC minutes and recession fears prompted more long liquidation and attracted algo-driven momentum sellers. Brent crude tumbled by 4.80% to $99.75 a barrel in another mind-boggling session. WTI tested $95.00 intraday, before gaining back some losses to finish 2.80% lower at $98.10 a barrel.
In Asia, the lure of $100 a barrel of Brent crude has proved an irresistible lure to physical buyers, and oil prices have rallied today. Brent crude is 1.70% higher at 101.45 a barrel, while WTI has climbed by 1.20% to $99.20 a barrel. This perhaps highlights the disconnect between the speculative market on the futures exchanges, and the reality of the physical market where futures contracts remain heavily in backwardation, signalling immediate oil supplies are as tight as ever. I remain unconvinced that the fall in prices is anything more than an adjustment to recessionary fears and speculative noise in the futures space. We are yet to see demand destruction.
Having said that, the failure of the 2022 support lines on both contracts so comprehensively must be respected, as are looming recession risks around the world. But with Russian oil supplies set to drop as the year progresses and it runs out of Western parts to maintain fields, and with the rest of OPEC hopelessly uninvested in maintaining production capacity, I fear the days of $100 oil will be with us for some time yet.
Brent crude has resistance at $106.00 and then its 2022 trendline at $108.85, followed by the 100-day moving average (DMA) at 110.30. It has traced a double bottom at $98.60, followed by the 200- day moving average (DMA) at $96.35 a barrel. WTI has resistance at $102.00 and then its 100-DMA at $107.00 a barrel. Support is at $96.65, $95.00, and then its 200-DMA at $93.50 a barrel.
Gold is in trouble
The continuation of US strength overnight, and high US yields, delivered another kidney punch to gold which slumped ponce again, falling 1.45% to $1739.50 an ounce. In Asia, the shorter-term oversold technical picture sees a modest 0.45% bounce to $1746.00 an ounce.
Since breaking $1780.00, gold’s technical picture has deteriorated rapidly, and it is clear it remains at the mercy of the US Dollar's direction. The only positive note to be seen is that its RSI has fallen into oversold territory, allowing for a modest corrective rally to occur.
Gold has resistance at $1780.00, $1785.00, and $1820.00, its downward trendline. Support is at $1720.00, followed by $1675.00. Failure of longer-term support at $1675.00 sets in motion a much deeper correction, potentially reaching $1500.00 an ounce.
GBP/JPY Daily Outlook
Daily Pivots: (S1) 160.77; (P) 161.67; (R1) 162.95; More...
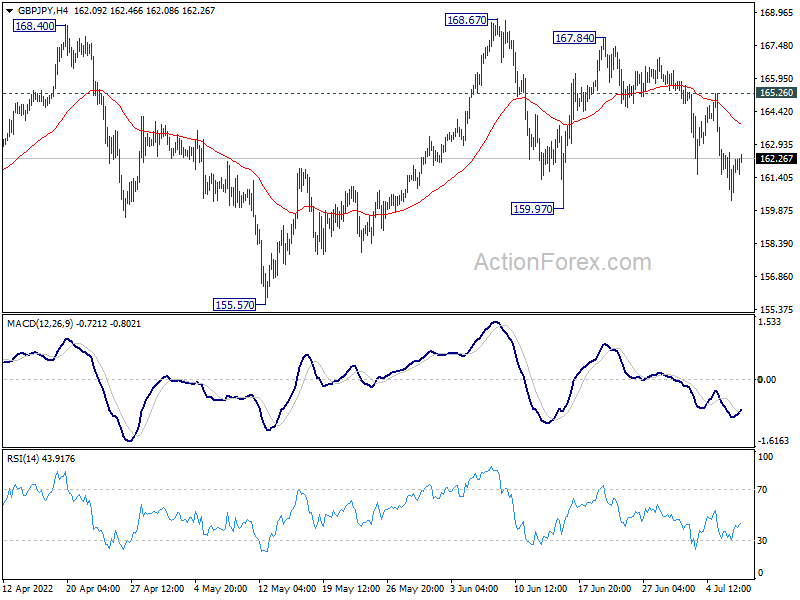
Intraday bias in GBP/JPY stays on the downside at this point. Firm break of 159.97 support will raise the chance of rejection by 167.93 long term fibonacci resistance. Deeper fall would be seen to 155.57 support for confirmation. On the upside, break of 165.26 minor resistance will turn bias back to the upside for retesting 168.67 high.
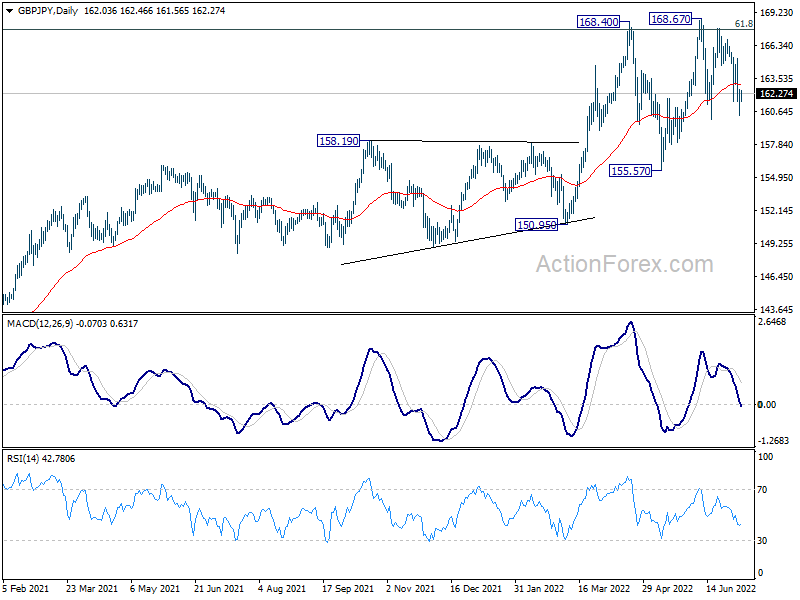
In the bigger picture, up trend from 123.94 (2020 low) is still in progress. Sustained break of 61.8% retracement of 195.86 (2015 high) to 122.75 (2016 low) at 167.93 will be a long term bullish signal, and could pave the way back to 195.86 high. This will now remain the favored case as long as 155.57 support holds, even in case of deep pull back.
EUR/JPY Daily Outlook
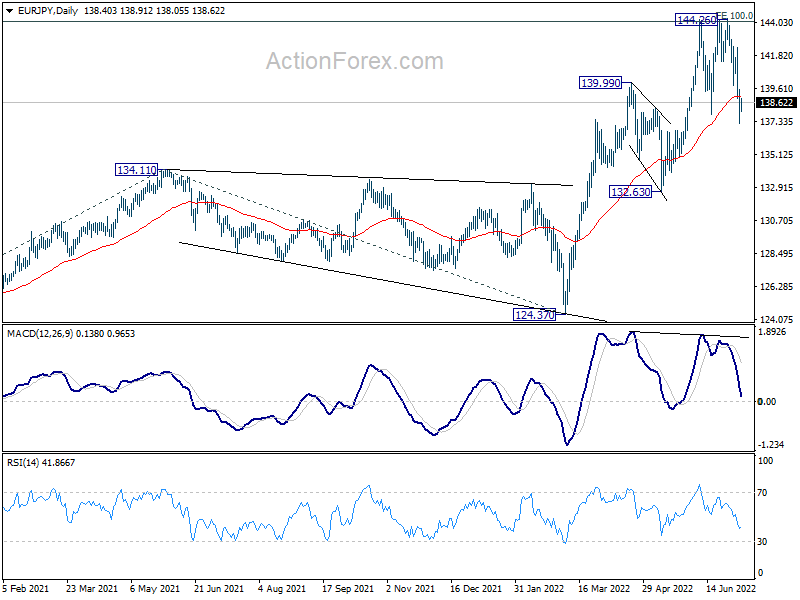
Daily Pivots: (S1) 137.31; (P) 138.40; (R1) 139.53; More....
EUR/JPY's fall from 144.26 extends lower and intraday bias remains on the downside. Sustained break of 137.83 support will raise the chance of rejection by 144.06 long term projection level and target 132.63 support. On the upside, above 139.78 minor resistance will turn intraday bias neutral first.
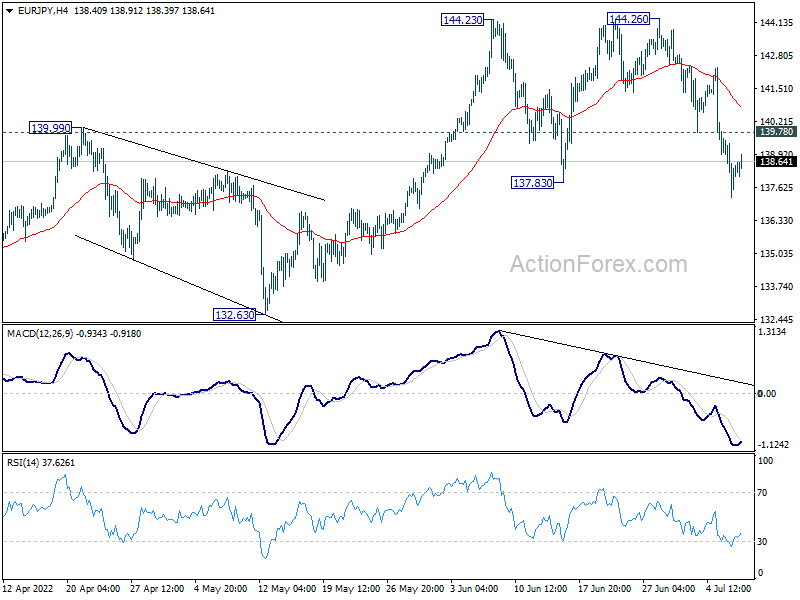
In the bigger picture, up trend from 114.42 (2020 low) is in progress. Such rise is seen as the third leg of the pattern from 109.30 (2016 low). Sustained trading above 100% projection of 114.42 to 134.11 from 124.37 at 144.06 will indicate upside acceleration and target 149.76 long term resistance (2014 high). In any case, outlook will remain bullish as long as 132.63 support holds, in case of deep pull back.
EUR/GBP Daily Outlook
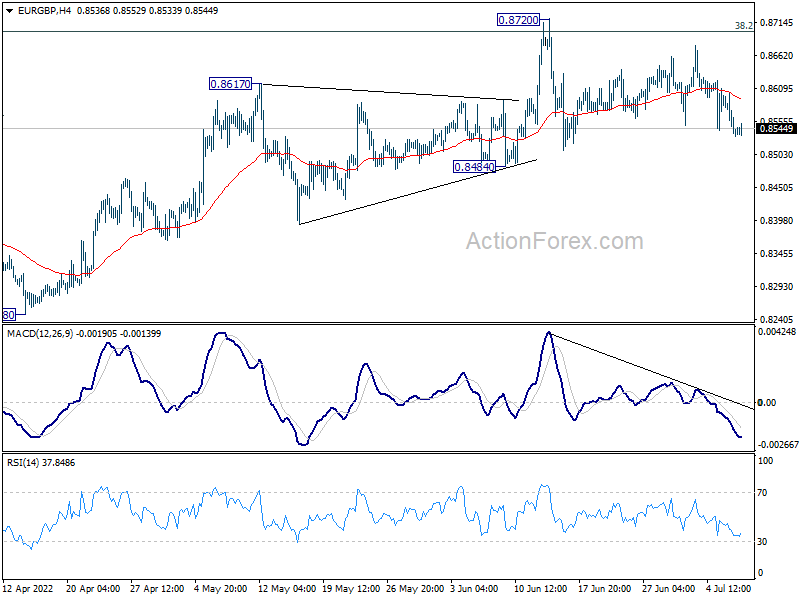
Daily Pivots: (S1) 0.8516; (P) 0.8559; (R1) 0.8586; More...
EUR/GBP is still bounded in range of 0.8484/8720 and intraday bias remains neutral. As long as 0.8484 support holds, further rise is in favor. Break of 0.8720 and sustained trading above 0.8697 medium term fibonacci level will carry larger bullish implication. Next target is 0.9003 fibonacci level. However, break of 0.8484 will indicate rejection by 0.8697 and turn near term outlook bearish.
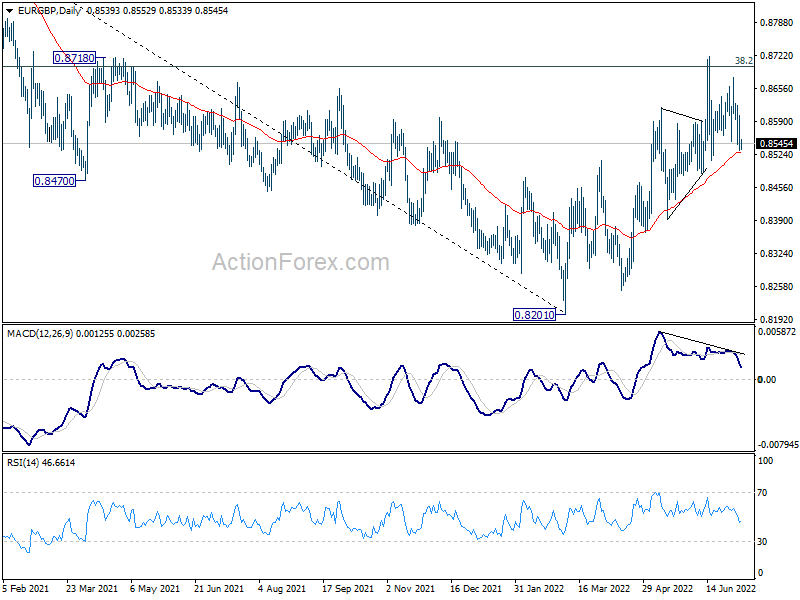
In the bigger picture, rise from 0.8201 medium term bottom could could either be a correction to the down trend from 0.9499 (2020 high), or a medium term up trend itself. Sustained break of 38.2% retracement of 0.9499 to 0.8201 at 0.8697 will affirm the latter case, and pave the way to 61.8% retracement at 0.9003. However, rejection by 0.8697 will maintain medium term bearishness.
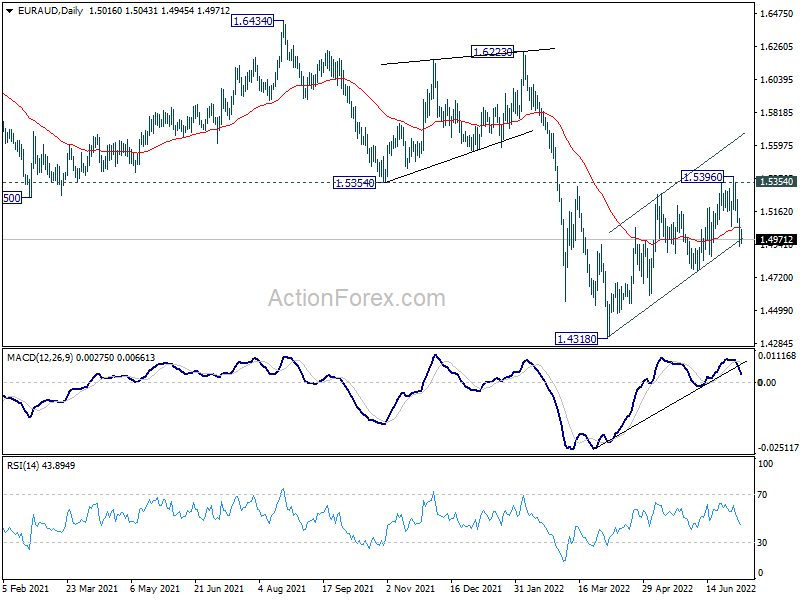
EUR/AUD Daily Outlook
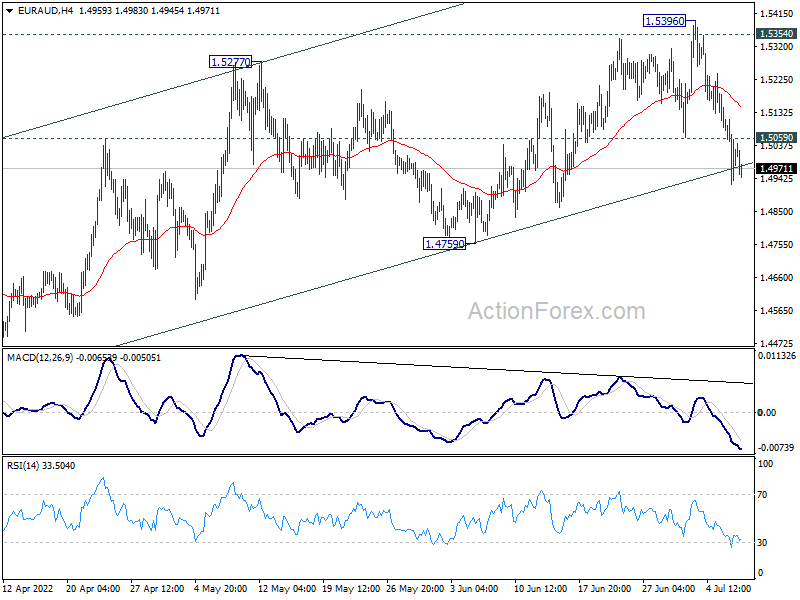
Daily Pivots: (S1) 1.4928; (P) 1.5021; (R1) 1.5113; More...
Break of 1.5059 minor support argues that EUR/AUD has formed at top at 1.5396, after failing to sustain above 1.5354 support turned resistance. Intraday bias is back on the downside for 1.4759 support first. Sustained break there will pave the way back to retest 1.4318 low. Nevertheless, on the upside, sustained trading above 1.5343 resistance should indicate medium term bottoming at 1.4318, and bring stronger rally.
In the bigger picture, sustained break of 1.5354 support turned resistance will argue that a medium term bottom was formed at 1.4318 already. It would still be too early to call for long term trend reversal. But further rise would then be seen back towards 1.6434 resistance (2021 high). However, rejection by 1.5354 will retain bearishness for extending the down trend from 1.9799 (2020 high) through 1.4318 at a later stage.
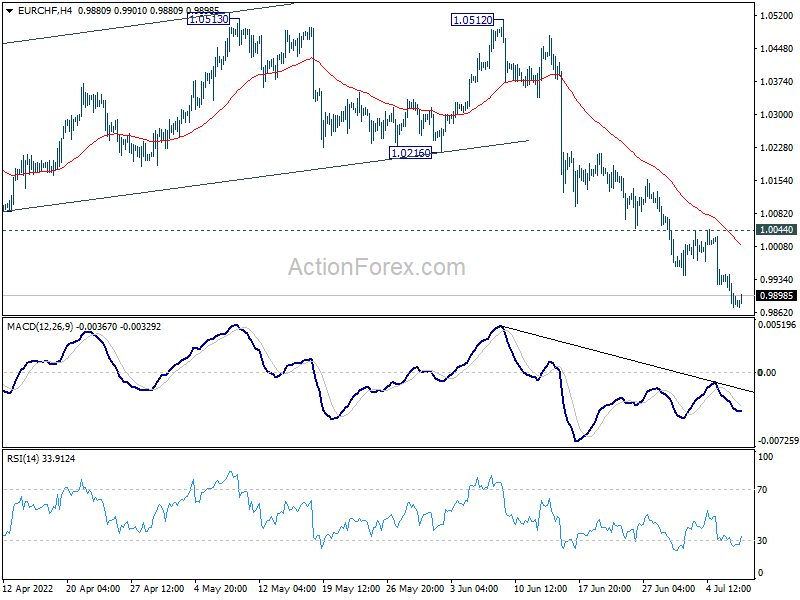
EUR/CHF Daily Outlook
Daily Pivots: (S1) 0.9859; (P) 0.9903; (R1) 0.9931; More....
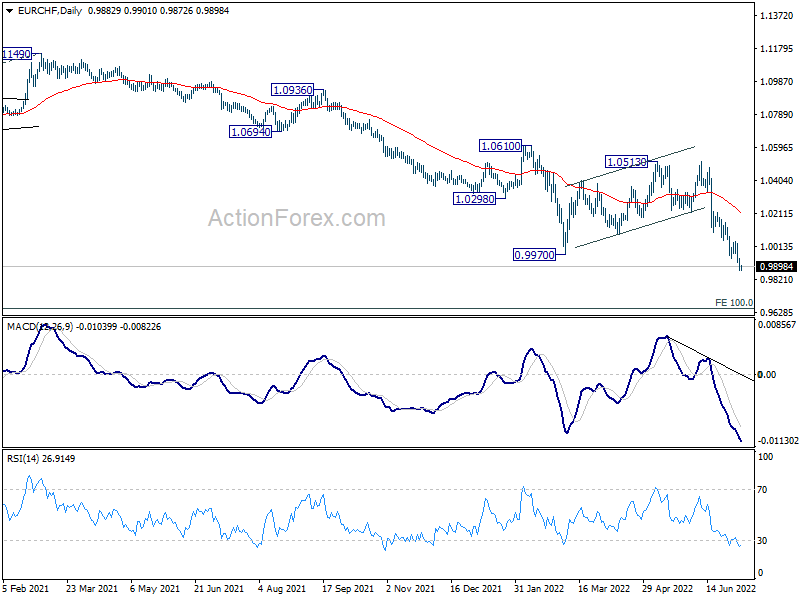
EUR/CHF's down trend is still in progress. Intraday bias stays on the downside for 0.9650 long term projection level. On the upside, break of 1.0044 minor resistance will turn intraday bias neutral and bring consolidations, before staging another decline.
In the bigger picture, rejection by 55 week EMA affirmed medium term bearishness. Long term down trend from 1.2004 (2018 high) is expected target 100% projection of 1.2004 to 1.0505 to 1.1149 at 0.9650. On the upside, break of 1.0513 resistance is needed to indicate medium term bottoming. Otherwise, outlook will stay bearish in case of strong rebound.
EUR/USD Daily Outlook
Daily Pivots: (S1) 1.0136; (P) 1.0207 (R1) 1.0251; More...
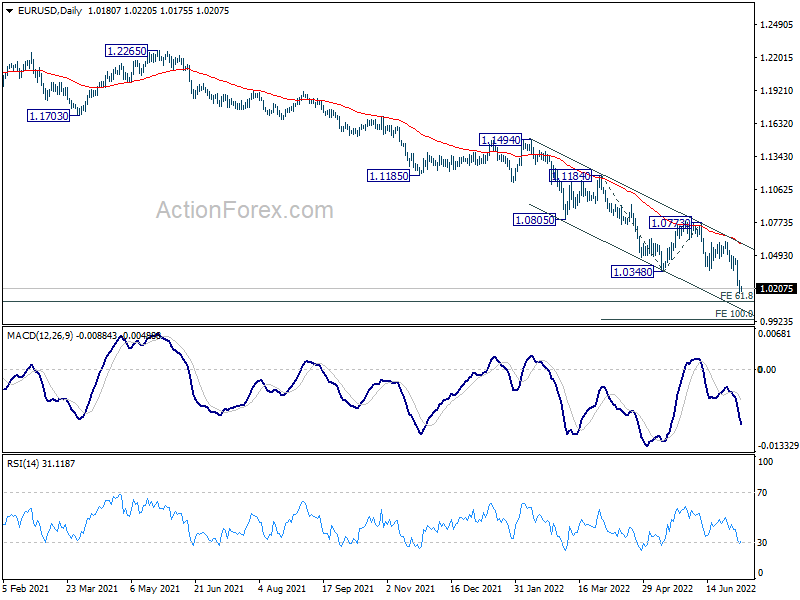
Intraday bias in EUR/USD stays on the downside and further fall should be seen to 1.0090 long term projection level. Break there will target 100% projection of 1.1184 to 1.0348 from 1.0773 at 0.9937, which is close to parity. On the upside, above 1.0276 minor resistance will turn intraday bias neutral and bring consolidations first. But recovery should be limited below 1.0614 resistance to bring another fall.
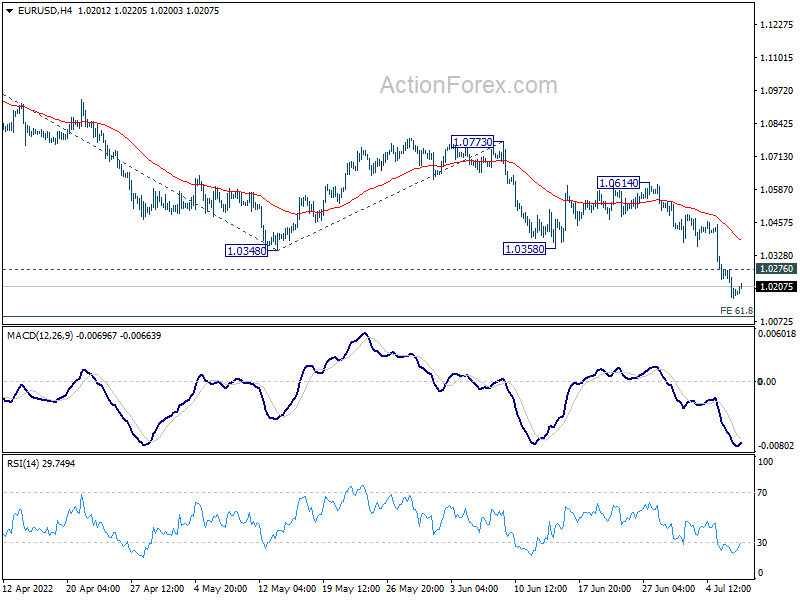
In the bigger picture, the break of 1.0339 long term support (2017 low) indicates resumption of whole down trend from 1.6039 (2008 high). Next target is 61.8% projection of 1.3993 to 1.0339 from 1.2348 at 1.0090. Sustained break there will pave the way to 100% projection at 0.8694. In any case, outlook will stay bearish as long as 1.0786 resistance holds, in case of recovery.
GBP/USD Daily Outlook
Daily Pivots: (S1) 1.1868; (P) 1.1929; (R1) 1.1982; More...
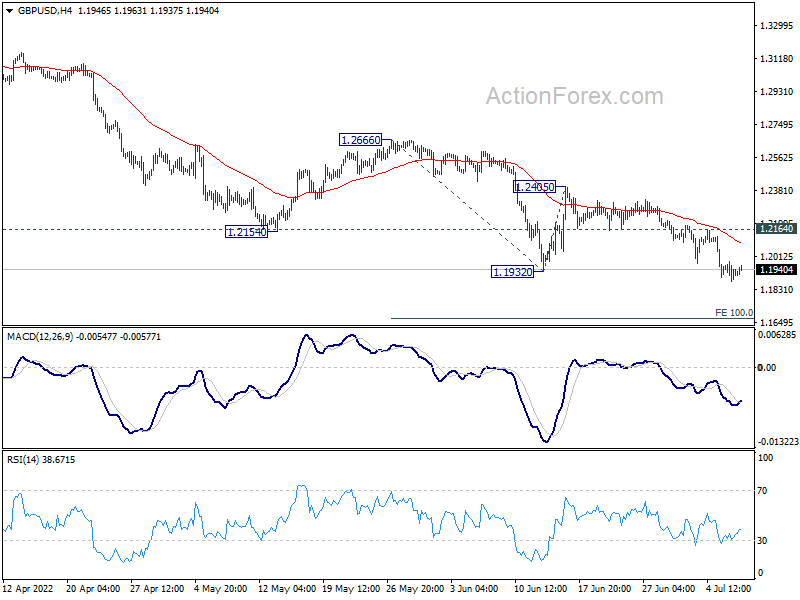
Intraday bias in GBP/USD stays mildly on the downside at this point. Current down trend should target 100% projection of 1.2666 to 1.1932 from 1.2405 at 1.1671. Break could prompt further downside acceleration to 161.8% projection at 1.1217. On the upside, break of 1.2164 minor resistance will turn intraday bias neutral first. But outlook will remain bearish as long as 1.2405 resistance holds.
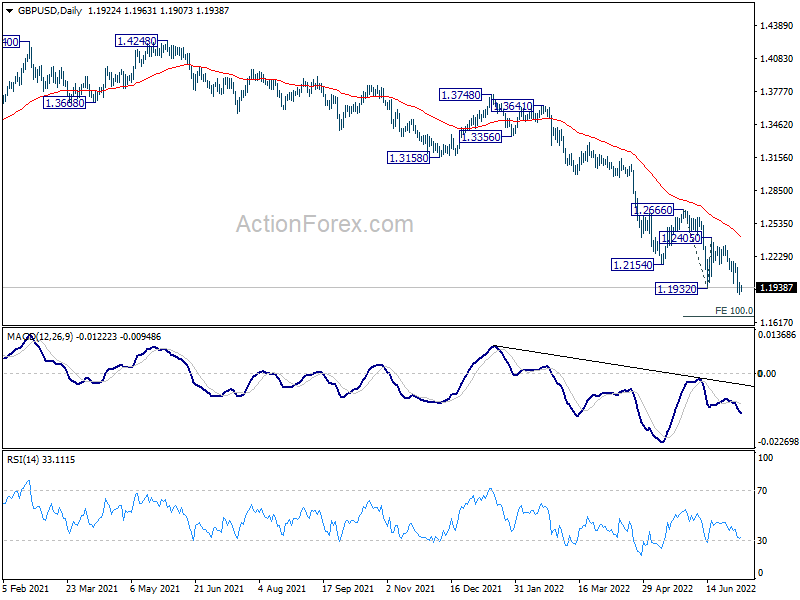
In the bigger picture, fall from 1.4248 (2018 high) could be a leg inside the pattern from 1.1409 (2020 low), or resuming the longer term down trend. Deeper decline is expected as long as 1.2666 resistance holds. Next target is 1.1409 low. However, firm break of 1.2666 will bring stronger rise back to 55 week EMA (now at 1.3103).
USD/CHF Daily Outlook
Daily Pivots: (S1) 0.9673; (P) 0.9708; (R1) 0.9745; More...
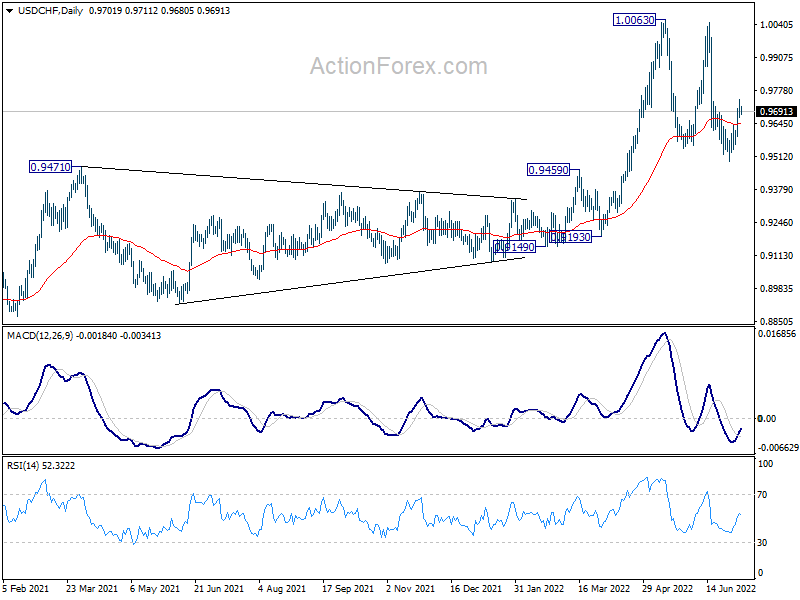
Focus is staying on 0.9731 resistance in USD/CHF. Firm break there will argue that the consolidation from 1.0063 has completed and bring stronger rally back to retest 1.0063 high. However, another fall below 0.9493 will dampen this view and target 0.9459 resistance turned support.
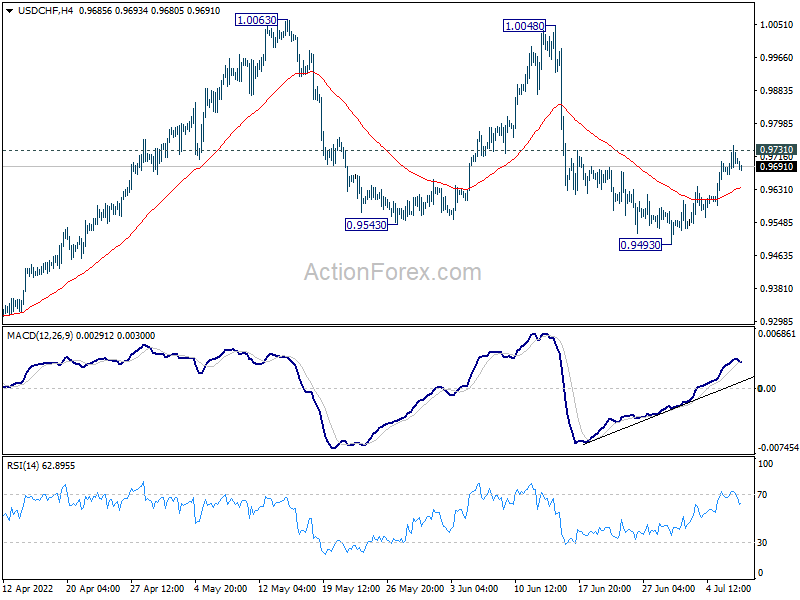
In the bigger picture, down trend from 1.0342 (2016 high) should have completed with three waves down to 0.8756 (2021 low) already. Rise from 0.8756 is likely a medium term up trend of its own. Next target is 1.0237/0342 resistance zone. This will remain the favored case as long as 0.9471 resistance turned support holds. However, sustained break of 0.9471 will extend long term range trading with another falling leg.