Sample Category Title
GBP/USD: Picking the Bottom Is Risky Business
- GBP/USD is closer to flash crash levels than ever before
- Political chaos in the UK is just one act in a long tragedy for the pound
GBP/USD's Fall Is Far From Accidental
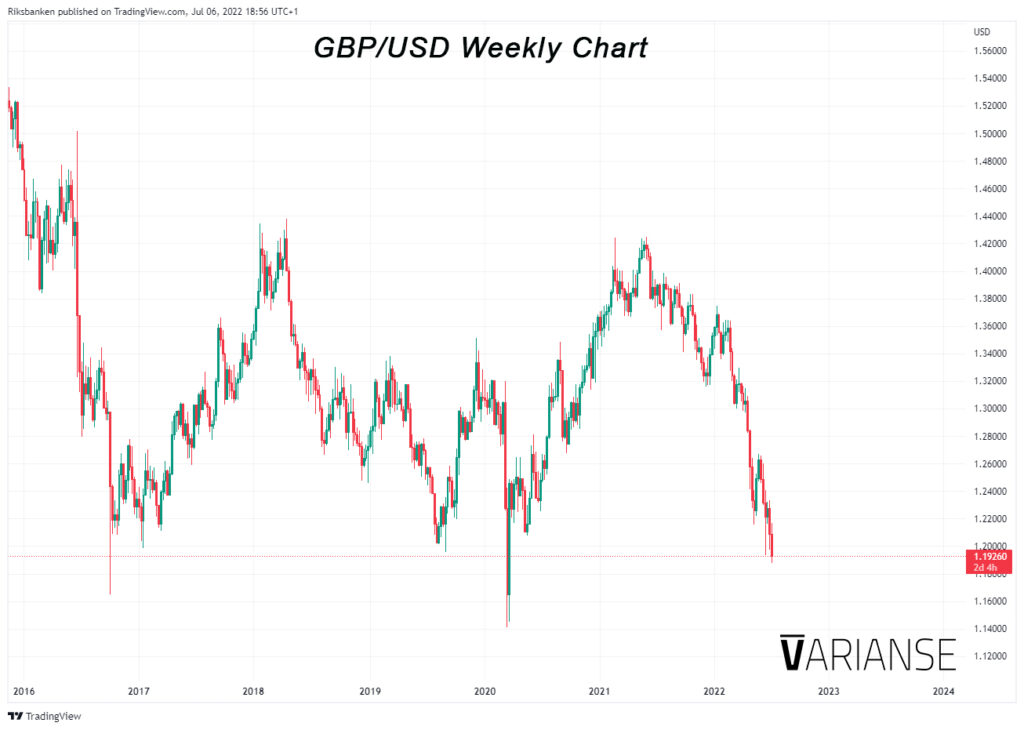
GBP/USD is closer to 2016 flash crash levels than ever before. At the time of writing, the pair was down by -1.61% so far this week to trade at 1.1895. That’s not too far from its weekly low of 1.1876. Circumstances today, however, are very different than they were during the flash crash. GBP/USD’s fall from its 21 May 2021 high of 1.4250 has been anything but accidental. The political chaos in Westminster this week is just the latest act in what has been a drawn out tragedy for the UK economy in 2022. Fears of global recession haven’t helped the British pound either.
The Narrative Is Bad
Economic contraction and record high inflation are two factors the Bank of England will need to contend at its next meeting on 4 August. A weaker pound is unlikely to help either in the near term. But even if the Bank of England does raise interest rates at a faster pace of 50 bps, how does it compete with the Fed, which is hellbent on tightening interest aggressively even at the cost of higher unemployment? These are questions traders should be asking themselves as the size up GBP/USD.
Is Positioning That Stretched?
Knowing the current context behind the GBP/USD’s latest fall, I do question whether it is sensible for big buyers to swoop in and buy up the British pound at levels south from here. The latest CFTC net speculative positions for GBP/USD certainly show the market moving less bearish than before, but given that positioning didn’t look massively stretched prior, that may just add the capacity for more shorts before the situation looks out of hand.
Trade Cautiously
GBP/USD could very well rise in the coming days, but I am personally holding out from buying until there are decent signs from the price action of either a potential reversal, or even retracement, before committing any capital. Even better if that price action is catalysed by a big shift in the narrative around GBP/USD. Until then, I am trading this pair cautiously and without much conviction.
EURCHF Wave Analysis
- EURCHF broke support level 0.9975
- Likely to fall to support level 0.9850
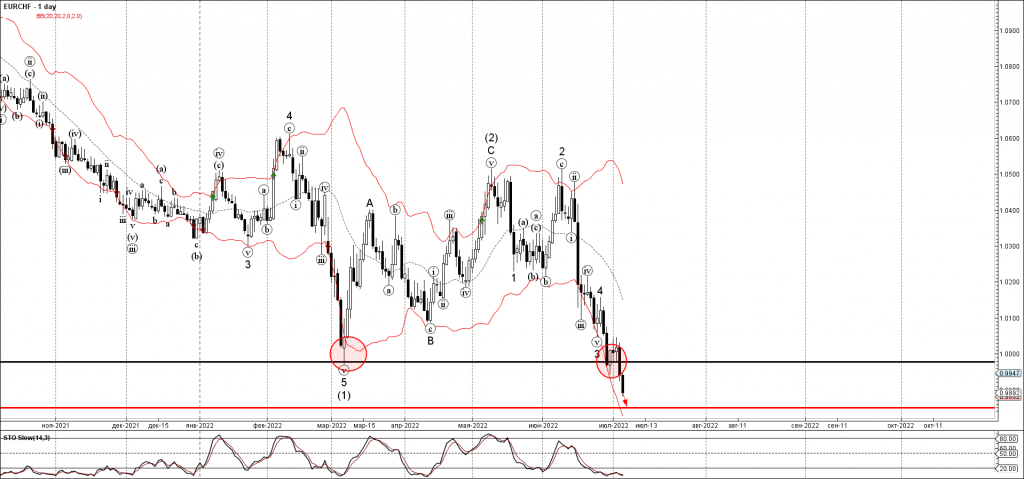
EURCHF recently broke the key support level 0.9975 (former multi-month low from the start of March).
The breakout of the support level 0.9975 continues the clear multi-month downtrend and is aligned with the active impulse waves 3 and (3).
Given the strongly bearish euro sentiment, EURCHF can be expected to fall further toward the next support level 0.9850.
USDCAD Wave Analysis
- USDCAD reversed from resistance level 1.3075
- Likely to fall to support level 1.2965
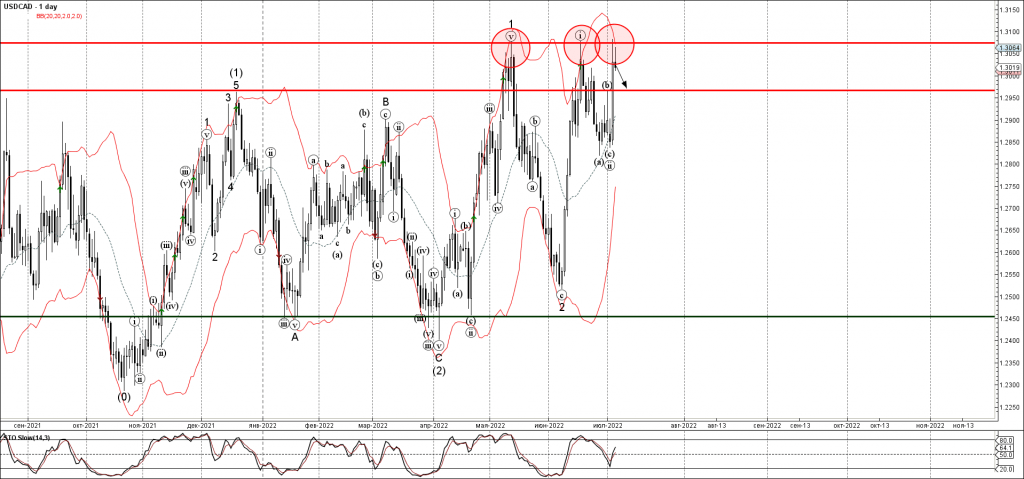
USDCAD recently reversed down from the key resistance level 1.3075 (the previous monthly high from May and June).
The resistance area near the resistance level 1.3075 was strengthened by the upper daily Bollinger Band.
Given the bearish divergence on the daily Stochastic indicator, USDCAD can be expected to fall further toward the next support level 1.2965 (former top of wave (b) from the end of last month).
Fed Reiterates its Commitment to Bringing Inflation Back to Target
The minutes from the June 14-15, 2022 Federal Open Market Committee (FOMC) meeting showed that curtailing inflation remains of paramount importance to the Fed.
On the progression of economy, the Committee members noted that "overall economic activity appeared to have picked up after edging down in the first quarter. Job gains had been robust in recent months, and the unemployment rate had remained low. Inflation remained elevated, reflecting supply and demand imbalances related to the pandemic, higher energy prices, and broader price pressures."
On the current acceleration in prices, the Committee stated that "inflation remained much too high and observed that it continued to run well above the Committee’s longer-run 2 percent objective, with total PCE prices having risen 6.3 percent over the 12 months ending in April." Additionally, participants stressed concerns that May's CPI print came in above expectations suggesting that inflation may be more persistent than originally thought.
On Russia's invasion of Ukraine, members of the Committee stated that "the invasion and related events were creating additional upward pressure on inflation and were weighing on global economic activity."
On the future pace of policy tightening, they stated that "an increase of 50 or 75 basis points would likely be appropriate at the next meeting." Moreover, committee members stated that a more restrictive policy stance may be warranted if inflation continues to surprise to the upside.
Key Implications
The minutes revealed that reestablishing price stability remains the principle objective of the Fed, with consumer prices in May having surged to 8.6% from year-ago levels. The Russia-Ukraine conflict and recent COVID lockdowns in China, only add to the upside risk. Additionally, the labor market has continued to strengthen, with employment approaching pre-pandemic levels and the unemployment rate sitting at 3.6%, just 0.1 percentage points above its February 2020 level.
The aggressive commitment from the Fed to rein in inflation has prompted fears of a recession with some surveys showing that the probability of a recession occurring over the next 12-months has increased to 44%. These fears have also been reflected in U.S. Treasury yields, with the 10-year yield having declined almost 70 basis points from its mid-June highs. We expect the Fed to continue to act swiftly until inflation is comfortably trending towards its 2% target.
Eco Data 7/7/22
[php_everywhere instance="1"]
EURCHF Exposed to Further Selloffs as it Hits 7½-Year Low
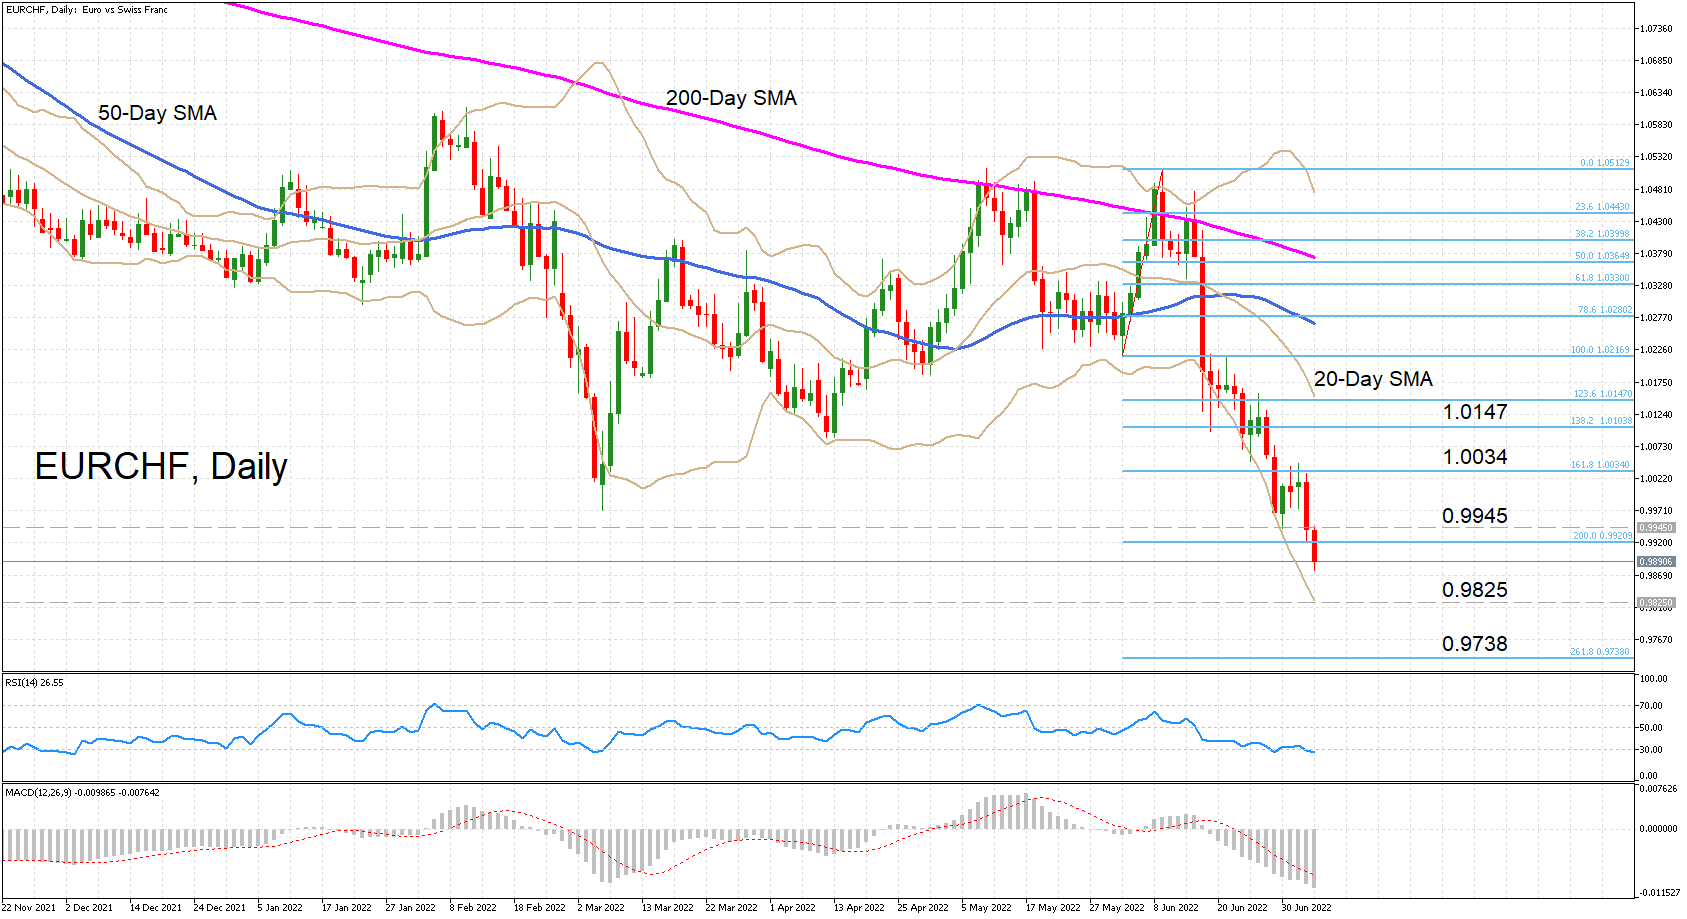
EURCHF tumbled to a fresh seven-and-a-half year low of 0.9875 on Wednesday, extending the sharp selloff that began on June 9. The momentum indicators are deep in negative territory so further losses are likely in the near term. However, there are some signs that the downside pressure may be easing, albeit very slightly.
The RSI has dipped below 30 into the oversold region, but its downward slope is getting shallower. The MACD also continues to deteriorate, with the histogram holding well below the red signal line.
But perhaps of more importance is the fact that despite the latest slide, the price has not yet reached the lower Bollinger band, indicating that there is scope for further losses in the immediate term.
Should the pair decline towards the lower Bollinger band, which currently stands near the 0.9825 mark, and is able to smash below it, the next support may not emerge until the 261.8% Fibonacci extension of the early June upleg at 0.9738. Breaking below this barrier too would shift attention to the 0.95 level.
However, if EURCHF is able to bounce off the lower Bollinger band like it has been doing since mid-June, the rebound could initially stumble at 0.9945 before the bulls aim for the 161.8% Fibonacci extension of 1.0034. A successful climb above this level could strengthen the positive momentum and stretch the gains towards the 20-day moving average (MA), which is about to intersect the 123.6% Fibonacci of 1.0147.
To sum up, the short-term bias remains very bearish and only a recovery towards the 20-day MA would significantly diminish the selling pressure. However, in the medium term, the price needs to reclaim the 50-day MA to restore the neutral outlook.
AUD/USD: Key Supports Under Pressure as Aussie Remains Weighed by Soured Risk Sentiment
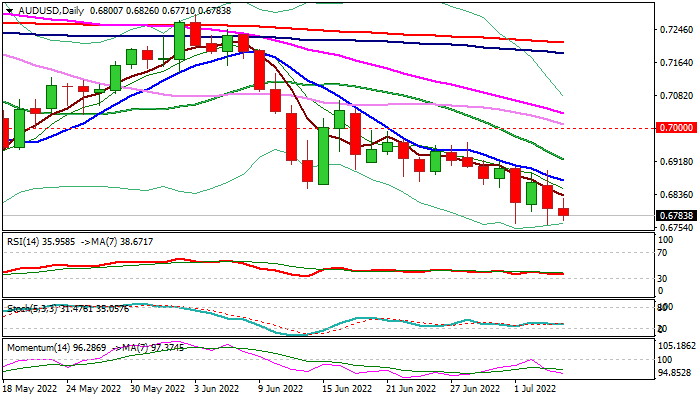
The AUDUSD remains in red and pressuring key supports at 0.6761/58 (new two-year low, posted yesterday / 50% retracement of 0.5509/0.8007 rally).
Soured risk sentiment on growing recession fears that boosted demand for safe-haven dollar, keep the Aussie dollar in defensive mode.
Bearish daily techs (rising negative momentum, south-heading indicators, MA’s in bearish setup) add to negative outlook.
Violation of 0.6761/58 pivots is likely to spark fresh bearish acceleration on negative signal and triggering stops parked below, with possible extension towards 0.6463 (Fibo 61.8% / monthly cloud base).
Near-term action should remain below falling 10DMA (0.6870) which tracks the downtrend since June 9, to keep bears intact.
Res: 0.6832; 0.6850; 0.6870; 0.6922
Sup: 0.6758; 0.6647; 0.6601; 0.6547
US: The Services Sector Continued to Grow in June, Albeit at a Slower Pace
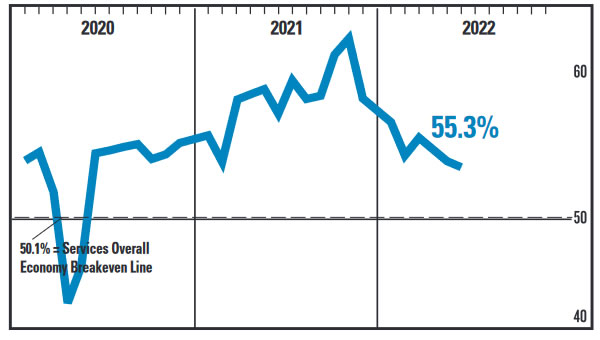
The ISM Services Index continued to grow but at slower pace, shedding 0.6 percentage points (ppts) in June with a reading of 55.3, which is higher than the 54 expected by the consensus estimate. Combined with an increase in the manufacturing reading, the ISM composite moved to 55.0 from 55.9 in May.
Business activity rose by 1.6 ppts to 56.1, while new orders declined by 2 ppts to 55.6.
Supply bottlenecks continue to create challenges. The supplier deliveries index gained 0.6 ppts to 61.9, while the backlog of orders sub-index rose by 8.5 ppts to 60.5.
Inventories contracted by 3.5 ppts from 51 in May, while inventory sentiment remained in contractionary territory with a reading of 46.2 – gaining 1.7 ppts.
Employment activity moved back in the contractionary territory losing 2.8 ppts to reach 47.4.
The prices paid component eased for the second consecutive month in June, dropping 2 ppts to 80.1 percent from 82.1 in May.
All 18 industries expanded in June.
Key Implications
The ISM services index continued to lose momentum in June, but remained in expansionary territory for the 25th consecutive month. The composition of the index makes an interesting story. Demand remained healthy with solid gains in business activity, a healthy level of new orders, and inventories too low for the level of demand. But the services sector continues to struggle with a mismatch between supply and demand, unlike the manufacturing sector where supplier delivery times normalized in June.
The employment sub-index disappointed in June. In the past six months, it has been zig-zagging in and out of contractionary territory and is unlikely to serve as a good precursor of the upcoming employment report. Indeed, the contraction is not indicative of a decline in demand for labor as managers expressed their frustration with comments like " unable to fill positions with qualified applicants".
All in all, despite the deceleration in June, the services sector remains solidly in expansionary territory, suggesting there is still some gas left in the consumption tank of the U.S. economy.
NZ Dollar Extends Losses ahead of RBNZ Report
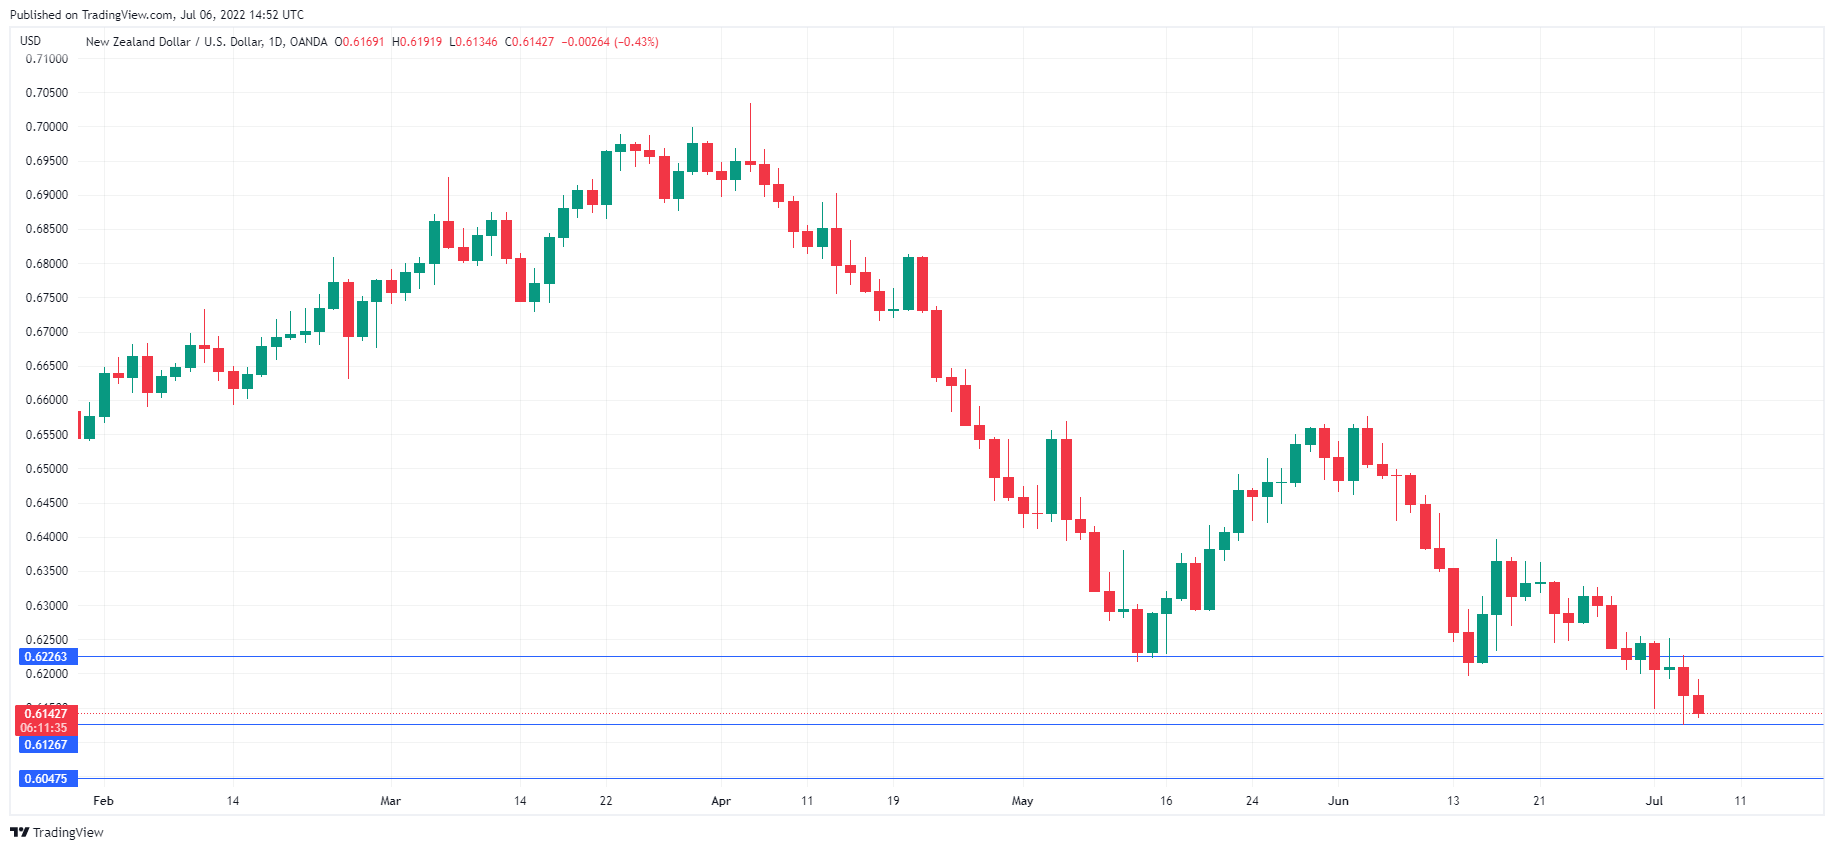
The New Zealand dollar continues to lose ground on Wednesday and is trading at 0.6139, down 0.49%. NZD/USD touched a low of 0.6124 on Tuesday, its lowest level since May 2020. The US dollar has pummelled the New Zealand currency, with NZD/USD sliding 370 points since June 1st.
RBNZ Statement of Intent next
The Reserve Bank of New Zealand has not been shy about raising rates, and the aggressive rate-hike cycle is set to continue. The RBNZ meets next Wednesday, and the markets have priced in a 50bp increase, which would bring the cash rate to 2.50%. With a peak in inflation nowhere in sight, the RBNZ can be expected to remain hawkish until inflation is contained. Interest rates could hit 3% in August and rise as high as 4% if inflation does not ease lower.
The RBNZ will release a Statement of Intent on Tuesday and should be treated as a market-mover. The report will outline the central bank’s objectives over the next three years, and investors will be looking for insights regarding upcoming rate moves.
Confidence indicators have been heading southward, raising concerns about the health of the economy. The NIEZR Business Confidence index fell ever deeper into negative territory on Monday, with a reading of -65 for Q2. Business confidence is currently at its lowest level since Q1 2020, at the start of the corona pandemic. Economic activity has been curtailed due to the acceleration of Covid cases, and businesses continue to struggle with cost pressures and higher interest rates. This follows last week’s ANZ Business Confidence in June, which fell to -62.6, down from -55.6 in May, marking a 12th straight decline and a near-record low.
Consumers are also feeling the bite of the cost of living crisis, as food and petrol prices have soared. Higher interest rates have meant higher borrowing costs and mortgage rates, leaving consumers with less disposable income and less confidence about their economic situation. The Westpac Consumer Confidence fell sharply to 78.7 in Q1, down from 92.1 in Q4 2021.
NZD/USD Technical
- NZD/USD has weak support at 0.6126, followed by 0.6047
- There is resistance at 0.6226 and 0.6305
US ISM services ticked down to 55.3, on decline in new orders and employment
US ISM Services PMI dropped from 55.9 to 55.3 in June but beat expectation of 54.5. Looking at some details, business activity/production rose 1.6 to 56.1. New orders dropped -2.0 to 55.6. Employment dropped -2.8 to 47.4. Supplier deliveries rose 0.6 to 61.9. Prices dropped -2.0 to 80.1.
ISM said: "The slight slowdown in services sector growth was due to a decline in new orders and employment.... Logistical challenges, a restricted labor pool, material shortages, inflation, the coronavirus pandemic and the war in Ukraine continue to negatively impact the services sector."