

Sample Category Title
USDJPY Appears Overbought; Neutral-to-Negative Bias
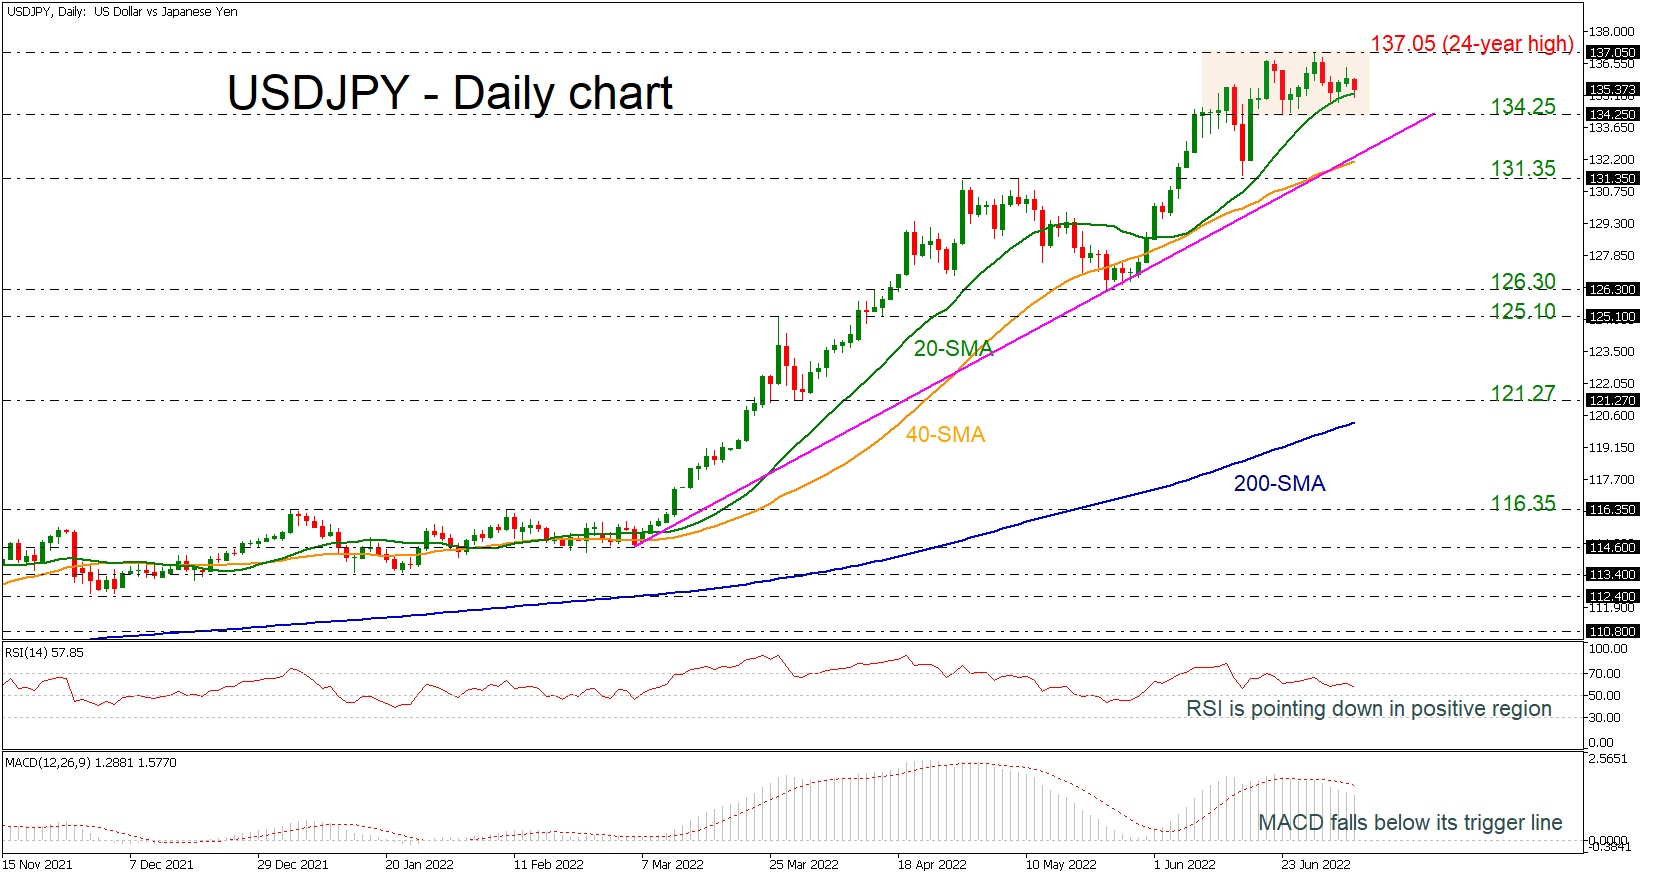
USDJPY is moving sideways within a tight range of the 134.25 support and the 24-year high of 137.05, failing to post a higher high, suggesting an overbought market.
The RSI indicator is pointing down in the positive region, while the MACD oscillator is holding below its trigger line above the zero level, indicating a weak momentum. In trend indicators, the 20-day simple moving average (SMA) is turning lower, while the 40-day SMA is still following the medium-term uptrend line.
Further declines may meet support around the lower boundary of the channel, before tumbling to the ascending trend line around 133.00 and the 40-day SMA at 132.10. Not far below, support could occur around the 131.35 barrier ahead of the 126.30 level.
On the upside, resistance could come from the 24-year high of 137.05 before rallying towards the 140.00 psychological level. Higher still, the 146.83 resistance, taken from August 1998 would increasingly come into scope.
The medium-term picture continues to look predominantly bullish, with trading activity taking place above the short-term SMAs and the 200-day SMA. However, the short-term outlook appears overstretched.
Gold Outlook: Held at Balance or Near Tipping Point?
Not much has changed in the past month as the precious metal is stuck in limbo, confined by equally strong support and resistance forces. Gold has been caught in a balancing act influenced by various complexly intricate and interconnected relationships, playing a game of tug of war. In this report we are going to shed light on those relationships, taking them apart and closely examining the components, for a fresh perspective to appear. Tying those relationships to current and future economic developments will provide us with an understanding on where gold stands, and whether the balancing act continues or whether we reached a tipping point. Let’s dive right in.
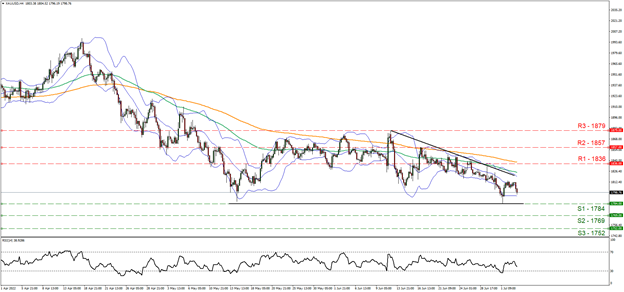
After rising to near all-time highs in the beginning of March 2022, partially due to the Russian invasion in Ukraine, gold performance has been losing steam, plunging lower over the next three months marking its biggest quarterly percentage decline in more than a year. Its price maintained a rather stable and consistent sideways action for the months of May and June, trading between the bounds of $1784 as support and $1878 as resistance. Recently however, according to our analysis, we observed a steady decline initiated at the $1878 upper bound, formulating a descending trendline and is currently edging closer to the support $1784 level.
As the overall market conditions appear to be grim at best, investors’ expectations foresee no improvement in the near horizon. “Pressures on gold seem likely to persist in the second half of the year, investors and analysts said” according to a Wall Street Journal article. As robust inflation ravishes the economic scene, spurred central banks across the world to act by aggressively hiking interest rates, some more than others, in an attempt to contain the overspilling. In broader terms, the relationship of rampant inflation urges market participants to seek refuge to gold, as historically it has shown to be a safe haven. As the US markets continue to appear beaten down, the migration to gold seems attractive, nonetheless. Market turmoil and war could also boost the price of gold and without a doubt we experienced plenty of that in the Q1. Having stated the above, the outlook for a price appreciation of gold seems imminent yet remains to be seen.
Despite the persistent inflation and market turmoil which favors it, gold is being weighed down by rising bond yields, as a consequence of aggressive hikes and the subsequent strengthening of the US dollar. More specifically, the accelerated rate increases of the Federal Reserve presents a dilemma for investors, whether to flee from the safe haven asset and choosing the higher-yield Treasuries option instead as they provide relatively steady regular payouts. On the other hand, the strengthening of the dollar sets overseas buyers in a disadvantaged position as it is more expensive to purchase gold.
Of particular importance for the future development of gold this week are the upcoming news releases on Friday the 8th of July by the US, in regard to the Non-Farm Payrolls, the Unemployment Rate and the yearly Average Earnings reports. As of today, according to preliminary results provided by the surveys, should the release of the US employment report for June actually disappoint traders and weaken the USD, we may see the precious metal actually gaining some ground, as the negative correlation of gold to the greenback could come into play. Therefore, traders will be looking closely on how to interpret the actual finalized figures of the above releases and reassess their future outlooks on gold. We tend advise caution when trading the precious metal at the time of the release as high volatility may occur. Also, before that on Wednesday the Fed is to release the minutes of its June meeting and market participants are expected to scrutinize the document for any clues regarding the Fed’s intentions. Hence once again we may see increased volatility for gold’s price.
Technical Analysis
XAUUSD H4
Gold is currently trading in a downward trend since the 13th of June where it attempted to move past the 1879 resistance (R1) line but failed to do so. As shown by the downward trendline it has been reaching lower peaks and on the 1st of July it fell to the 1784 level where it found support (S1), with similar levels seen near the end of January 2022. Having said that, we hold a bearish outlook bias for Gold for the short-term horizon. Supporting our case is the RSI indicator below our 4-hour chart, which exceeded the oversold bound of 30 on the 1st of July with a reading of 26, quickly bouncing back towards the 50 level. However, on today’s session we can see it point downwards once again. Also worth pointing out is the price action flirting with the lower bound of the Bollinger bands on July 1st. Should the bears continue to reign over, then we might see a definitive break below the 1784 support (S1) line and the price action moving towards the 1769 support (S2) line and possibly beyond, a level once seen before in December of 2021. Should the bulls take over, we would require a break of the downward trend line as first sign of a trend reversal and the 1836 resistance (R1) line and a move near the 1857 resistance (R2) level.
WTI Oil: Bears Consolidating after a 10% Acceleration on Tuesday
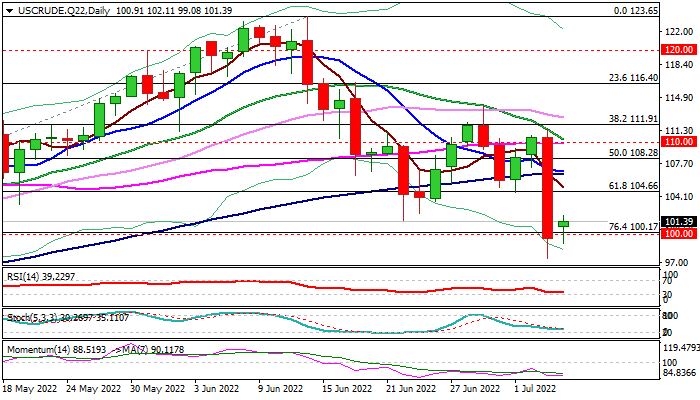
WTI oil edges higher in early Wednesday after falling nearly 10% previous day (the biggest daily loss since Mar 9), as renewed supply concerns of growing recession signals slashed oil prices.
Profit-taking pushed the price higher, though technical studies are bearish and sentiment remains weak, suggesting limited recovery before bears fully re-take control.
From technical point of view, Tuesday’s marginal close below psychological $100 level was an initial negative signal, in addition to a massive bearish candle which was left on Tuesday and weighs on near-term action, which could retest a higher base of Mar/Apr at $92.64/92, on sustained break of $100 trigger.
Fundamentals add to negative outlook as growing fears that the global economy is heading towards recession that would hurt demand and offset threats about supply shortage after OPEC refused to increase output on US request.
Upticks face solid barriers at $104.66 (broken Fibo 61.8% of $92.92/$123.65); $105.71 (daily Tenkan-sen) and $106.44 (base of thick daily cloud), where rebound should be capped to keep near-term bears in play.
Res: 102.11; 104.66; 105.71; 106.44.
Sup: 100.00; 99.08; 97.42; 95.27.
GBP/JPY Daily Outlook
Daily Pivots: (S1) 160.96; (P) 163.12; (R1) 164.65; More...
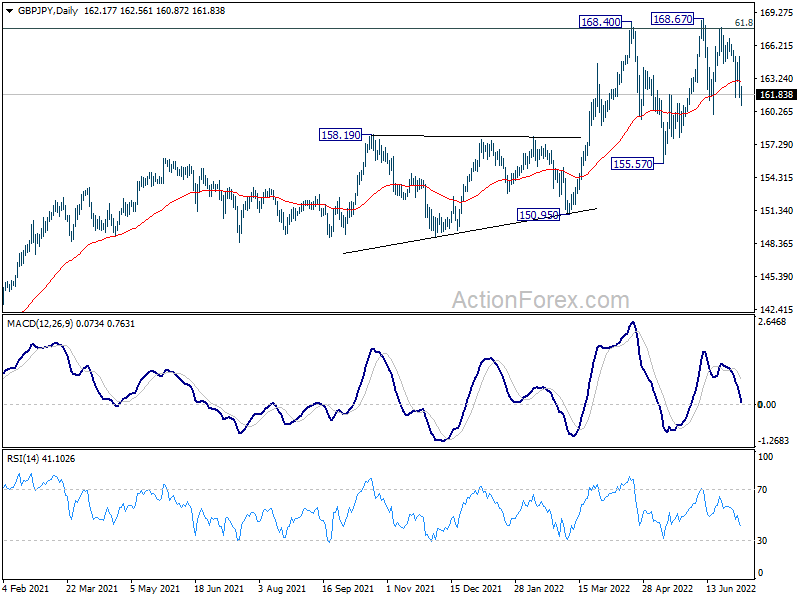
Intraday bias in GBP/JPY is back on the downside as fall from 167.84 resumes. Firm break of 159.97 support will raise the chance of rejection by 167.93 long term fibonacci resistance. Deeper fall would be seen to 155.57 support for confirmation. On the upside, break of 165.26 minor resistance will turn bias back to the upside for retesting 168.67 high.
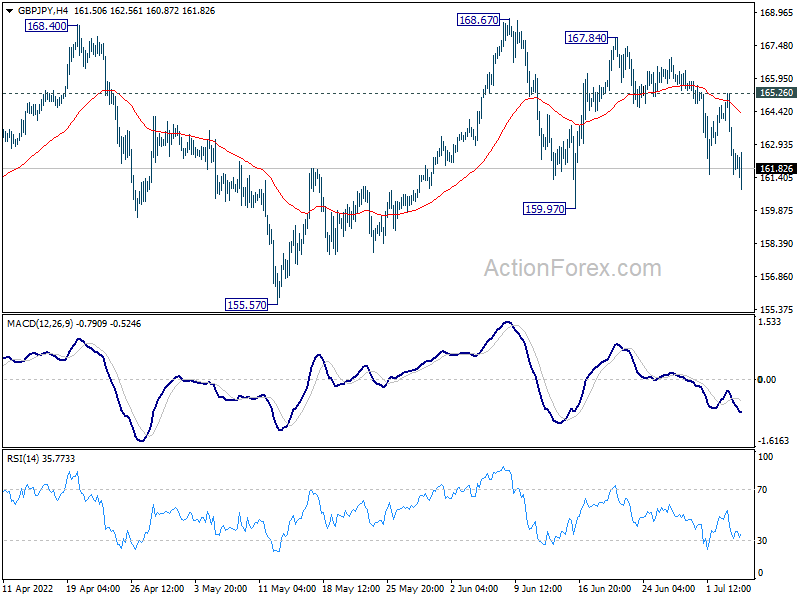
In the bigger picture, up trend from 123.94 (2020 low) is still in progress. Sustained break of 61.8% retracement of 195.86 (2015 high) to 122.75 (2016 low) at 167.93 will be a long term bullish signal, and could pave the way back to 195.86 high. This will now remain the favored case as long as 155.57 support holds, even in case of deep pull back.
EUR/JPY Daily Outlook
Daily Pivots: (S1) 138.17; (P) 140.27; (R1) 141.59; More....
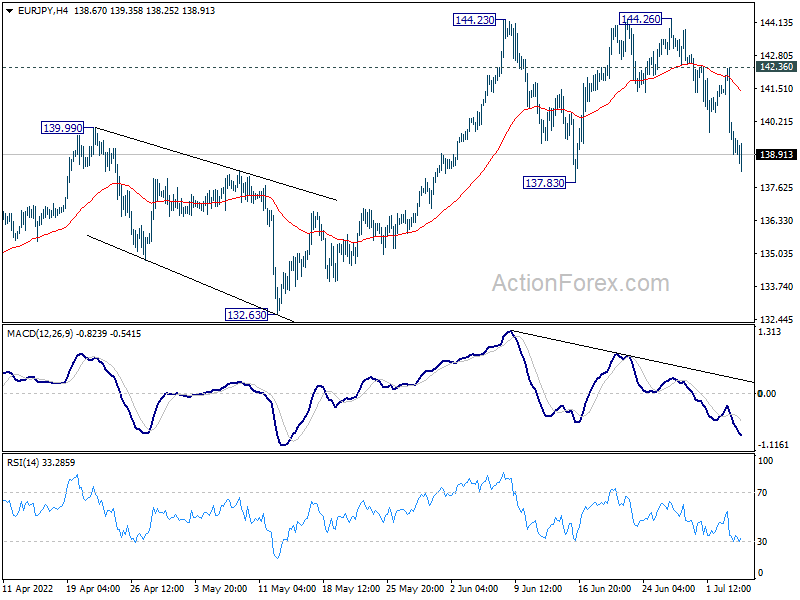
Intraday bias in EUR/JPY is back on the downside as fall from 144.26 resumes. Sustained break of 137.83 support will raise the chance of rejection by 144.06 long term projection level and target 132.63 support. On the upside, above 142.36 minor resistance will bring retest of 144.26 high instead.
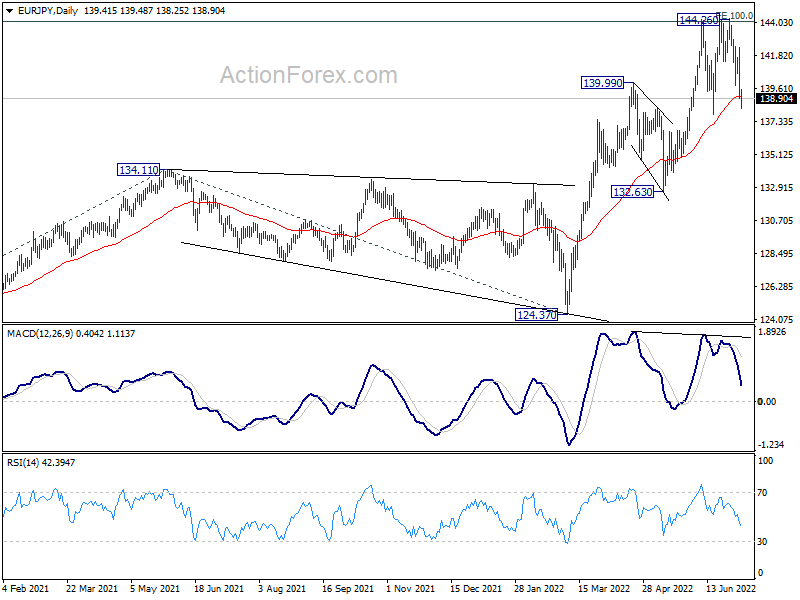
In the bigger picture, up trend from 114.42 (2020 low) is in progress. Such rise is seen as the third leg of the pattern from 109.30 (2016 low). Sustained trading above 100% projection of 114.42 to 134.11 from 124.37 at 144.06 will indicate upside acceleration and target 149.76 long term resistance (2014 high). In any case, outlook will remain bullish as long as 132.63 support holds, in case of deep pull back.
EUR/GBP Daily Outlook
Daily Pivots: (S1) 0.8545; (P) 0.8584; (R1) 0.8625; More...
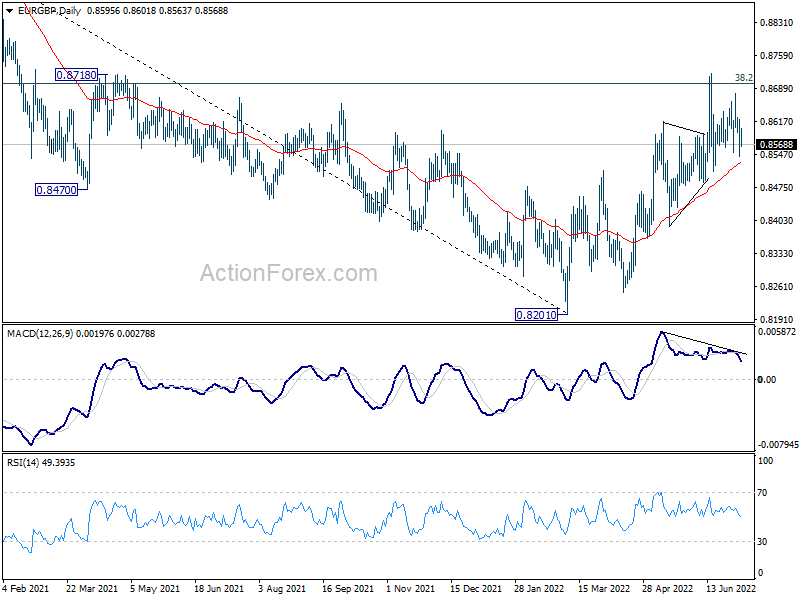
EUR/GBP is staying in range trading and intraday bias remains neutral. As long as 0.8484 support holds, further rise is in favor. Break of 0.8720 and sustained trading above 0.8697 medium term fibonacci level will carry larger bullish implication. Next target is 0.9003 fibonacci level. However, break of 0.8484 will indicate rejection by 0.8697 and turn near term outlook bearish.
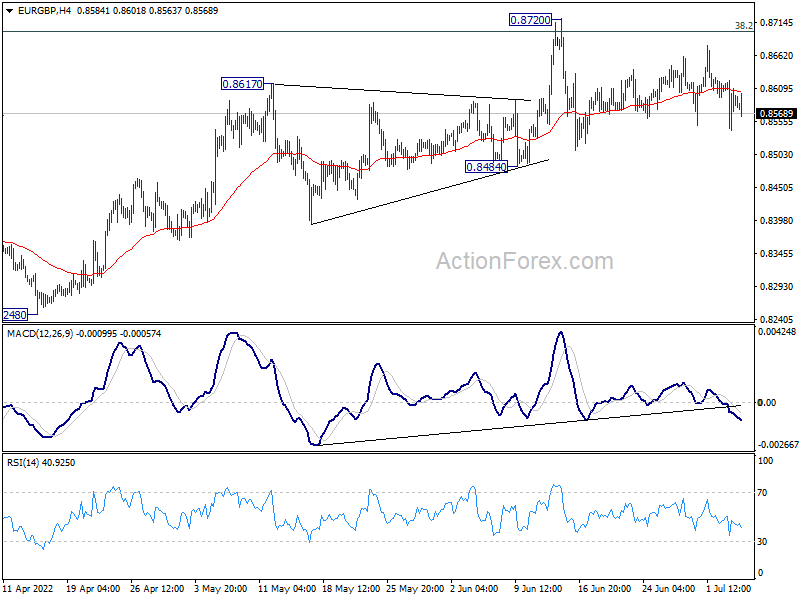
In the bigger picture, rise from 0.8201 medium term bottom could could either be a correction to the down trend from 0.9499 (2020 high), or a medium term up trend itself. Sustained break of 38.2% retracement of 0.9499 to 0.8201 at 0.8697 will affirm the latter case, and pave the way to 61.8% retracement at 0.9003. However, rejection by 0.8697 will maintain medium term bearishness.
EUR/AUD Daily Outlook
Daily Pivots: (S1) 1.5046; (P) 1.5145; (R1) 1.5198; More...
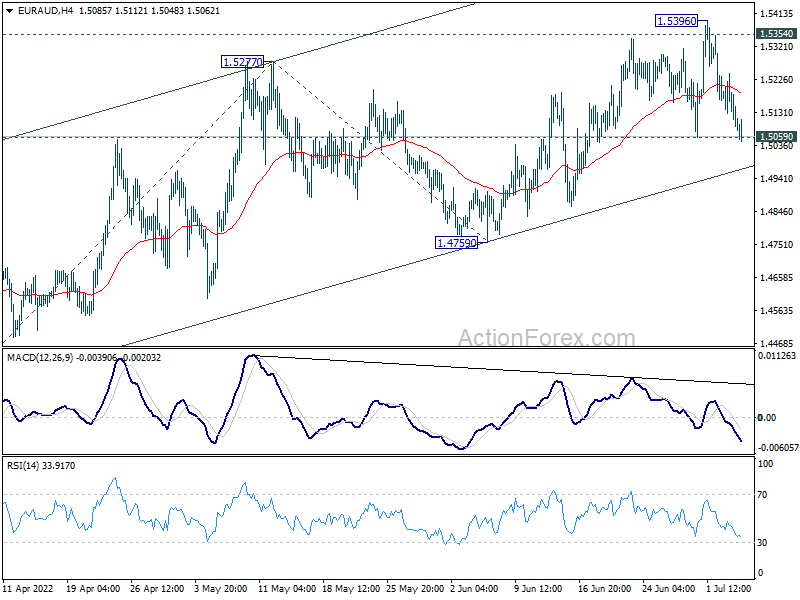
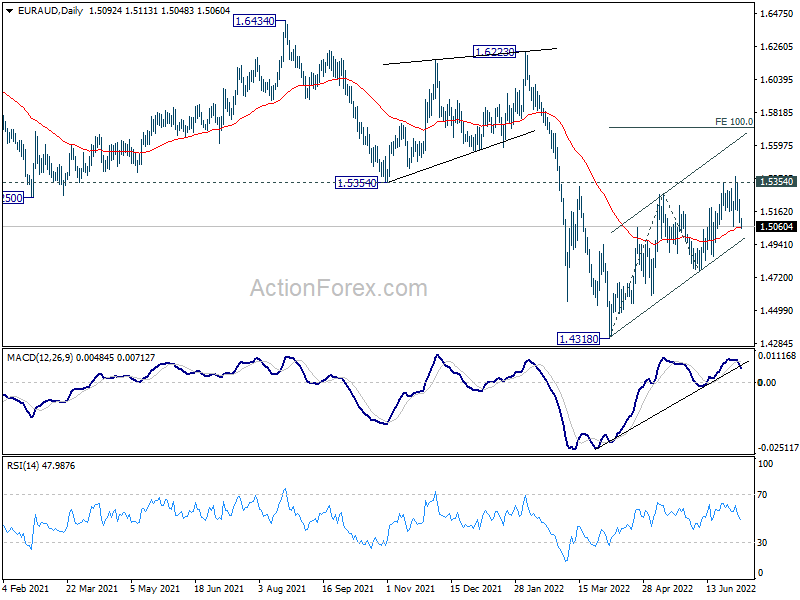
Focus is back on 1.5059 minor support in EUR/AUD. Firm break there will indicate rejection of 1.5354 support turned resistance, and revive medium term bearishness. Intraday bias will be back on the downside for 1.4759 support next. On the upside, sustained trading above 1.5343 resistance should indicate medium term bottoming at 1.4318. Stronger rally would be seen back to 100% projection of 1.4318 to 1.5277 from 1.4759 at 1.5718.
In the bigger picture, sustained break of 1.5354 support turned resistance will argue that a medium term bottom was formed at 1.4318 already. It would still be too early to call for long term trend reversal. But further rise would then be seen back towards 1.6434 resistance (2021 high). However, rejection by 1.5354 will retain bearishness for extending the down trend from 1.9799 (2020 high) through 1.4318 at a later stage.
EUR/CHF Daily Outlook
Daily Pivots: (S1) 0.9901; (P) 0.9966; (R1) 1.0008; More....
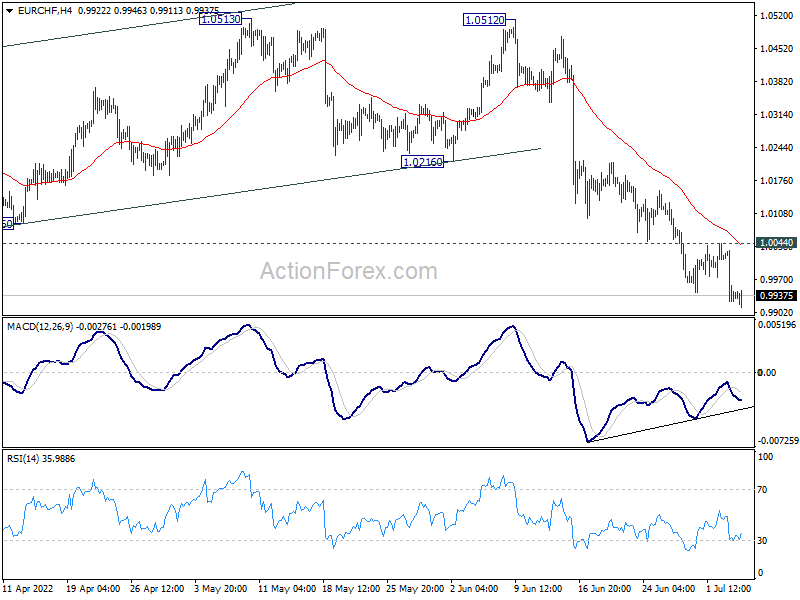
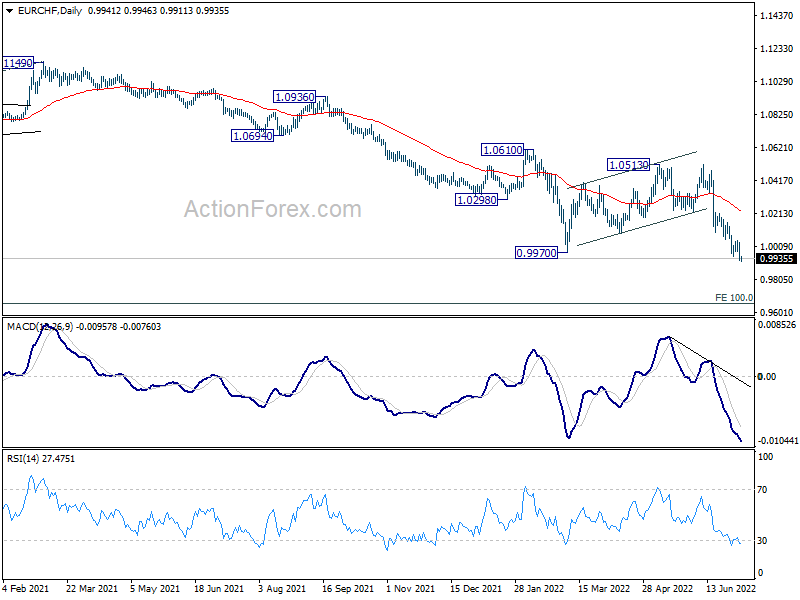
Intraday bias in EUR/CHF remains on the downside at this point. Current down trend should target 0.9650 long term projection level. On the upside, break of 1.0044 minor resistance will turn intraday bias neutral and bring consolidations, before staging another decline.
In the bigger picture, rejection by 55 week EMA affirmed medium term bearishness. Long term down trend from 1.2004 (2018 high) is expected target 100% projection of 1.2004 to 1.0505 to 1.1149 at 0.9650. On the upside, break of 1.0513 resistance is needed to indicate medium term bottoming. Otherwise, outlook will stay bearish in case of strong rebound.
Daily Technical Analysis
EUR/USD
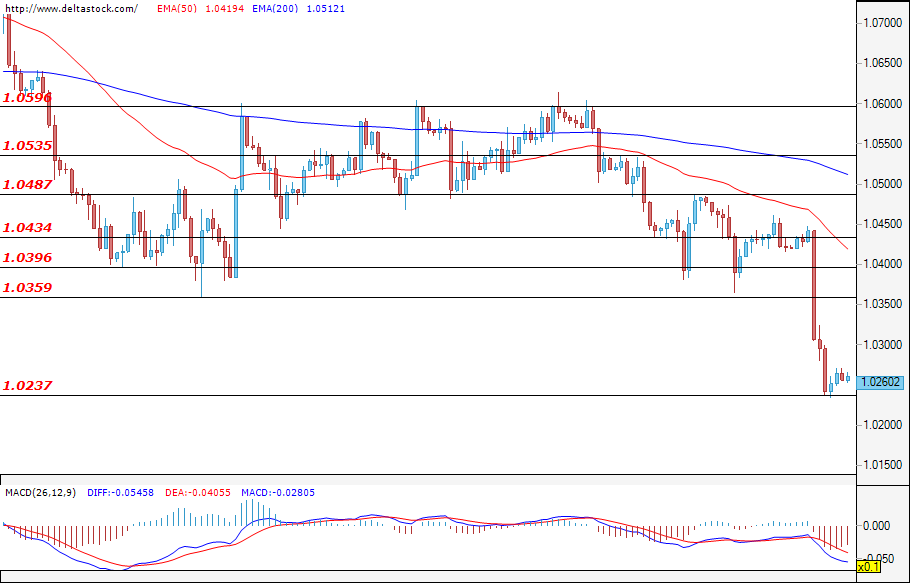
The common European currency lost quite a bit of ground against the dollar, and after the successful violation of the major support at 1.0359, the pair tested the lower zone at 1.0237 as a result of how late the ECB is in the rate hiking cycle, compared to the FED, and the impending recession. During the early hours of today, the pair is consolidating above the mentioned zone, but if the bears continue to prevail, then a new successful attack could easily lead to future losses and would strengthen the negative expectations for a parity between the euro and the greenback. The first target for the bulls is the level at 1.0359, which is currently acting as resistance, followed by the upper zone at 1.0396.
USD/JPY
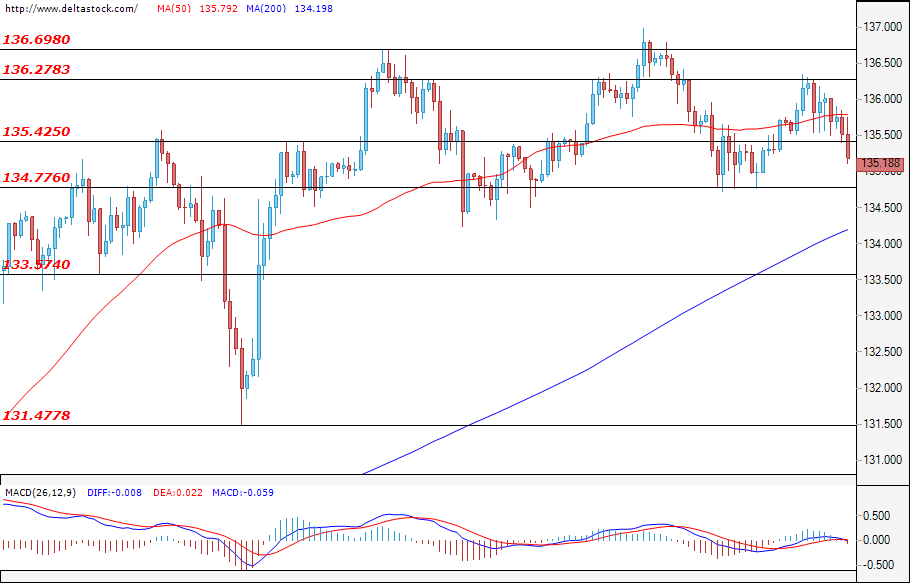
The bulls did not manage to gain enough momentum to successfully violate the resistance at 136.27 and the dollar erased some of its recent gains against the yen. At the time of writing the analysis, the pair is testing the close support at 135.42, and if the breach is confirmed, then an attack on the next target at 134.77 would be the most probable scenario. Success for the bears here could easily deepen the drop and could lead the Ninja towards the lower support at 133.57. If buyers enter the market, then a successful violation of the resistance at 136.27, followed by a breach of the zone at 136.69, could lead to a continuation of the rally and a move towards the levels at around 137.00.
GBP/USD
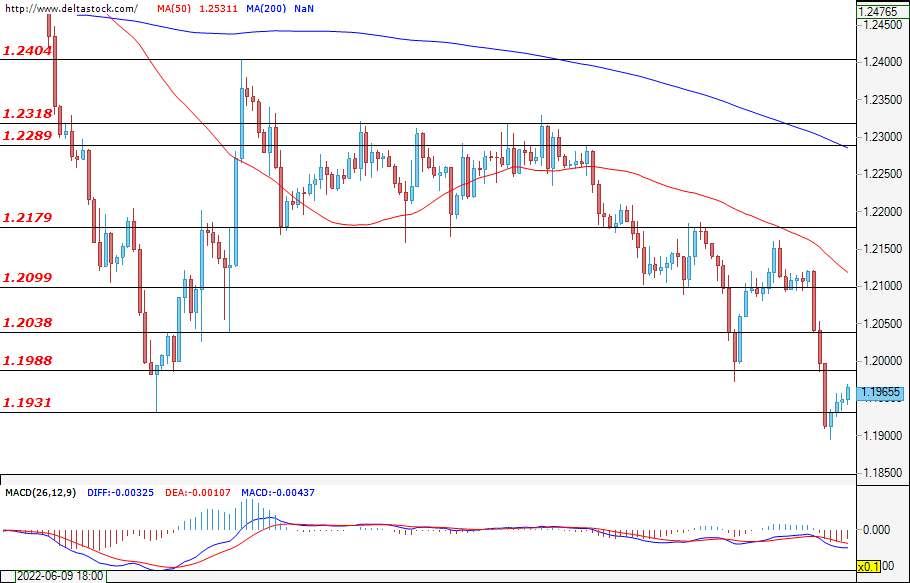
Тhe bearish attack on the support zone at 1.1931 was not successful, and the during the early hours of today`s trading, the GBP/USD is hovering above the mentioned level. If the bulls prevail and breach the resistance zone at 1.1988, then the current corrective move could continue towards the upper target at 1.2038. If the bears re-enter the market, then a breach of the zone at 1.1931 could lead to new losses and could continue the decline towards the levels at around 1.1800.
EUGERMANY40
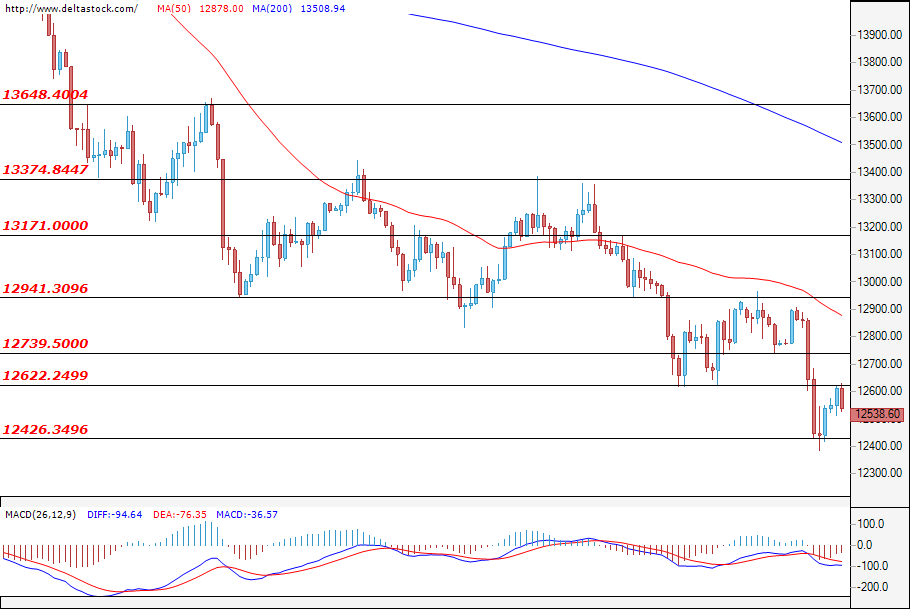
Recession fears continued and trading for the German index remained restricted under the important resistance at 12622. The current expectations are for a new test of the support at 12426, where a successful breach for the bears could easily lead to future losses and could deepen the sell-off towards levels at around 12300. If the bulls take control instead, then a violation of the mentioned resistance at 12622 could help fuel a rally towards 12739. Only a breach of the upper resistance at 12941, however, could lead to a change in the current sentiment of the market participants.
US30
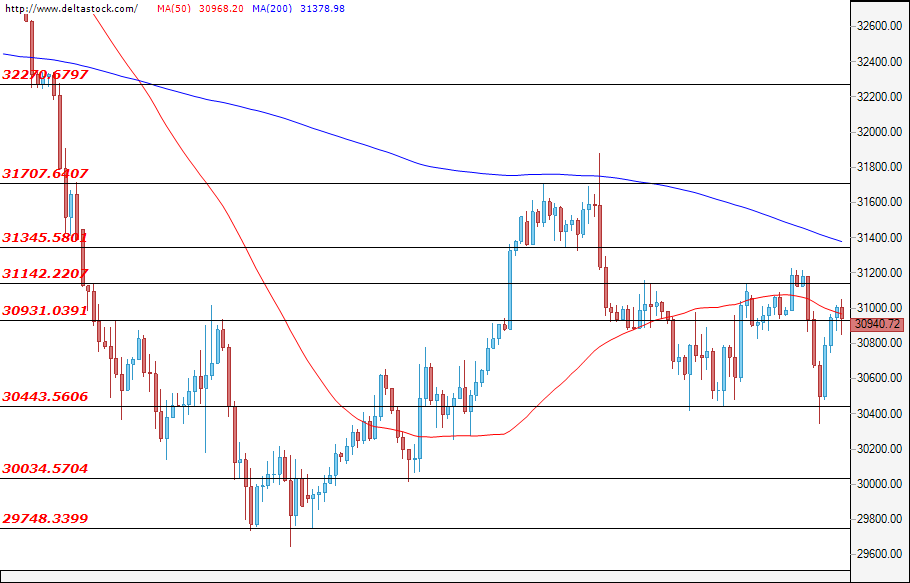
The U.S. index recovered some of its recent losses, and during the early hours of today`s trading, the price tested the resistance at 30931. A breach of the next target at 31142, followed by a violation of the upper zone at 31345, could easily lead to a rally and could continue the recovery towards 31707, but the current sentiment is not showing any signs of that happening. If the bullish momentum fades and the bears prevail, then a breach of the support at 30443 would mark the current move as corrective and the US30 could attempt to violate the major zone at 30034.
Recession Meltdown
Recession fears buffeted markets overnight, with the price action across various asset classes looking like a self-sustaining negative feedback loop, triggering more stop losses as prices slumped and dragging in trend-following momentum-hunting fast money.
Europe endured a torrid day as the Norwegian oil worker strike proved the last straw for an energy-starved Europe. European equities plummeted and rightly so, as Europe's energy-from-Russia Achilles heel was cruelly exposed. The Euro also capitulated, EUR/USD taking out 1.0350 on its way to a 1.50% loss to 1.0260. Sterling and UK equities were also hammered by the extra headwind of political instability as three senior ministers resigned overnight with immediate effect. There may be some respite for Europe today though as the Norwegian Government imposed a settlement on both sides effectively ending the strike. It is likely to be temporary.
In the US, equity markets opened much lower, but US bond yields outdid them, slumping on recession nerves overnight and sending the US 10-year down to 2.805%, leaving the 2-year 10-year yield curve teetering on inversion. Perversely, the slump in US bond yields, which might also be due to haven inflows and not just recession fears, saved the bacon of US equity markets. US stocks reversed most of their losses, and ironically, the Nasdaq actually rallied to a 1.75% gain. The still-richly-valued growth stocks of the Nasdaq are the most interest-rate sensitive on US markets, and small moves in the risk-free discount rate have outsized price impacts in these environments. Still, the Nasdaq gains looked like a mechanical rear-guard action and not a brave new dawn. A US and Europe recession won’t do their ambitious valuations any favours either.
The big winner overnight was the US Dollar, which rallied imperiously versus both developed and emerging currencies. A sign of the nerves around US Dollar strength came from China today, which set a much weaker Yuan fixing rate of 6.7346 versus the US Dollar, as it glanced around at the slump in other Asia currencies overnight. The only winner was the Japanese Yen. USD/JPY held steady overnight at 135.90, to my great surprise, as the US/Japan rate differential plummeted lower. However, it has immediately fallen by 0.50% to 135.15 in Asian trading. As I have said previously, the long USD/JPY has become a dangerous one as the primary reason for it occurring in the first place, the US/Japan rate differential narrows sharply.
Oil prices also slumped overnight on recession hype, and I’ll talk about that later. Ironically, one of the night’s outperformers was Bitcoin, which reversed intraday losses to close unchanged at $20,200.00. I can only surmise that the Nasdaq’s rally lifted Bitcoin as well so that’s the short-term correlation to watch now, although it has already fallen 1.80% to $19,800.00 this morning. My line in the sane for Bitcoin remains $17,500.00, everything above that will be noise, failure should trigger another wave of margin stop outs among the geniuses conjuring 20% returns out of thin air.
Commodities also slumped overnight on recession fears, notably copper. But as a grouping, hard and agricultural commodities look to have peaked a few weeks ago except for European natural gas for obvious reasons. Gold finally fell below $1780.00 an ounce overnight, an ominous technical development. But spare a thought for palladium. It is trading at $1909.00 an ounce this morning, it's hard to believe it traded at $3400.00 an ounce in early March.
Asian markets are starting the day on the back foot for different reasons. The PBOC USD/CNY fix today will have regional central bankers looking over their shoulders, although looking at the price action of pairs such as USD/INR and USD/IDR overnight, it looks like regional central banks are increasing their US Dollar selling. Mostly, though, it is China and covid zero that are weighing on the sentiment in Asia, which was going to be fragile anyway. As I have said till I am blue in the face, covid zero means covid zero in China, not one and down and we all live happily ever after. The City of Xi-an has enacted a series of restrictions overnight, and 9 districts of Shanghai are undergoing mass testing. Chinese authorities will try, initially, a district-by-district approach to restrictions, But nobody should be under any illusion that they won’t go harder and faster if needed. As I’ve said before, China needs to get lucky 100% of the time, omicron has to get lucky once. This remains a key risk factor too often ignored by anybody pondering China markets in 2022.
The Asian data calendar is empty today except for Malaysia’s Bank Negara policy decision. The market is locked and loaded for another 0.25% rate hike to 2.25% and I won’t disagree. With USD/MYR testing 4.4200 this morning, they won’t have a choice. No rate hikes likely see USD/MYR starting with 4.50 in double time. South Korea, the Philippines and Indonesia all face the same unsavoury choice in the weeks ahead at their policy meetings, especially with another Federal Reserve hike looming at the end of the month.
On the subject of the Fed, the noise will increase that Fed will now have to mollify the pace and size of its rate hikes. Unfortunately, inflation in the US, like elsewhere, is showing no signs of abating and the data recently has really been that bad, much like Australia. This is more likely to be a story for Q4. If the US JOLTs Job Openings remain at 11 million or above, and the US Non-Farm Payrolls is comfortably above 250,000, there will be no sensible reason for the Fed to blink. Most of all, it is a credibility issue. Having got transitory inflation so utterly wrong and stubbornly clung to a dogma past its sell-by date, if the FOMC blinks now, they may as well do an Elvis and leave the building. Puppies and kittens don’t need to be trained to chase their tails, we certainly don’t need it from our central banks, who aren’t even cute to boot.
This afternoon we get German Factory Orders and Pan-Europe Retail Sales. The releases won’t make good reading and could heap more pressure on the Euro and European equities, although I don’t discount the Norwegian oil strike settlement giving both a temporary reprieve. US JOLTs Job Openings will cause recession head-scratching above 11 million, but June’s ISM Manufacturing PMI for June and its activity, prices, new orders, and employment sub-indexes will probably decide the direction of travel in the short-term. The FOMC Minutes afterwards will probably be discounted somewhat given market developments over the past two weeks.
Asian equities slump on China lockdown fears
US equities endured a torrid session overnight, dropping initially, but then rallying hard as US yields fell across the curve. With markets racing to price in a US recession, the US equity performance was somewhat counterintuitive with the rate-sensitive Nasdaq outperforming. If US yields find a floor after the US data released tonight, Wall Street’s recovery could find itself flagging. The S&P 500 finished 0.16% higher, the Nasdaq stormed to a 1.75% gain, while the value-centric Dow Jones closed 0.42% lower. In Asia, US futures are steady, with the S&P 500 and Dow almost unchanged, while the Nasdaq futures have booked a 0.28% gain.
Asian markets are mostly having a bad day at the office as they race to price in both a US recession overnight and also the potential for wider virus restrictions in China following overnight developments. The prospect of more covid zero restrictions in China is an unwelcome dose of reality for Asia and is certainly carrying more weight, although Asian currency weakness is also in play.
Japan’s Nikkei 225 is 1.20% lower, with South Korea’s Kospi dropping by 1.10%. In Mainland China, the Shanghai Composite has slumped by 1.25%, with the CSI 300 close behind, falling by 1.10%. In Hong Kong, Hang Seng has lost 1.40%.
Across regional Asia, on Manila is defying the odds once again, jumping by 1.40% this morning. Elsewhere, it is a sea of red. Singapore is relatively steady, down just 0.05%, while Kuala Lumpur is 0.50% lower, Jakarta has lost 1.05%, Taipei has slumped by 1.75%, and Bangkok has eased by 0.20%. Australian markets have been spared the worst of the selloff, despite resource prices tumbling overnight, thanks to its Wall Street correlation of late. The ASX 200 and All Ordinaries are down by 0.30%.
European equities had a terrible day yesterday thanks to natural gas supply fears and political instability in the UK’s case as well. With the Norwegian government stepping in to impose a settlement between the striking oil workers and employers, European markets may gain a temporary reprieve this afternoon.
US Dollar soars on haven demand
The US Dollar soared versus both developed and emerging market currencies overnight, as recession fears saw a spike in haven demand for US Dollars. Quite a bit of that looks to have been recycled into US bond markets as well, adding to the recessionary downward pressure on yields. The dollar index leapt 1.26% to 106.49, a two0decade high. It remains there in Asia and the next technical target is the 109.00 area. Having broken out of a 5-year triangle at 102.50 in April, its longer-term target remains in the 1.1700 area. Support is at 1.0585, the overnight breakout point, and then 1.0500, followed by 1.0350 and 102.50.
The Norwegian oil strike deepened recession fears and broke Euro yesterday, EUR/USD plummeting 1.51% to 1.0265, a multiyear low. In Asia, it has eased another 0.10% to 1.0253. The overnight low at 1.0235 is initial support, followed by 1.0130 ahead of 1.0000. As I have said before, any deeper interruption of Europe’s natural gas supplies will mean a move below parity and a European recession. Since breaking a multi-year support line at 1.0850 in April, Euro has never looked back. Although risks are skewed to the downside now, the Norwegian strike settlement may allow EUR/USD to find some friends this afternoon. It has resistance at 1.0300, and then the 1.0350 breakout, followed by 1.0600.
GBP/USD fell by 1.18% to 1.1960 overnight, easing to 1.1945 in Asia. Recession fears are also complicated by political instability in London now following multiple ministers resigning overnight, with eh Bank of England also sounding a loud economic warning as well. That makes constructing a bullish case for Sterling challenging and a move back towards the March 2020 lows near 1.1400 can’t be discounted. It has immediate support at the overnight low at 1.1900, followed by 1.1800. Resistance is at 1.2000 and 1.2200.
USD/JPY, rather surprisingly, finished almost unchanged at 135.86 overnight but has immediately moved 0.30% lower to 135.45 in Asia today. With the US/Japan rate differential narrowing sharply, long USD/JPY becomes more dangerous by the day and the risks increase of an ugly correction lower to wash out the speculative longs. If US yields find a floor, USD/JPY may cling to its gains for now though. USD/JPY has resistance at 136.65 and 138.00, with support at 134.25 and 132.00.
AUD/USD and NZD/USD have also fallen sharply overnight to 0.6800 and 0.6160, where they remain in Asia. The overnight fall in resource prices will be an additional headwind for the Australian Dollar in particular, but both remain at the mercy of international investors who use them to express risk sentiment. AUD/USD is in danger of testing 0.6700 this week, and NZD/USD 0.6000. Failure will signal a deeper move lower is in progress.
Asian currencies retreated overnight, led by USD/KRW, which gained 1.0% to $1308.00, and USD/PHP, USD/INR, and USD/IDR, which all rose around 0.50%. A weaker Chinese Yuan fixing by the PBOC today has kept the pressure up on Asian currencies, as has fears of more China lockdowns. Notably, USD/IDR has breached 15,000.00 this morning and rates hikes from Seoul, Jakarta, Manila, and New Delhi are now a certainty. The price action overnight and this morning does suggest that Asian central banks are around selling US Dollars, but with Asian currencies gaining no solace from lower US yields, this looks very much like a risk aversion move that will keep the pressure up on local currencies. Bank Negara should hike by 0.25% this afternoon, but if they don’t, look for extended MYR weakness.
Oil plummets overnight on recession fears
Recession fears saw oil markets plummet overnight, with both Brent crude and WTI taking out their 2022 rising support lines in no uncertain terms. Brent crude slumped by 7.90% to $104.75, having tested $101.00 a barrel intraday. WTI slumped by 8.75% to 100.90, trading as low as $97.50 a barrel intraday. In Asia, both contracts remain under pressure as China lockdown nerves sweep the region. Brent crude has fallen 0.90% to $103.85 a barrel, and WTI is 0.60% lower at $100.00 a barrel.
The price action overnight, with both contracts trading in near fifteen dollar ranges, hints more at panic and forced liquidation, than a structural change in the tight supply/demand situation globally. Although I acknowledge recession risks in the US, and covid zero ones in China, the world’s two largest consumers, the futures markets in both Brent crude and WTI remain in heavy backwardation. That says that in the physical market, supplies remained as constrained as ever, and despite the noise seen overnight, oil prices may be in danger of overshooting to the downside.
Having said that, the failure of the 2022 support lines on both contracts so comprehensively must be respected, as are looming recession risks around the world. But with Russian oil supplies set to drop as the year progresses and it runs out of Western parts to maintain fields, and with the rest of OPEC hopelessly uninvested in maintaining production capacity, I fear the days of $100 oil will be with us for some time yet. That said, Brent crude and WTI are likely moving into a new $95.00 to $110.00 barrel range.
Brent crude has resistance at its 2022 trendline at $108.85 a barrel, followed by the 100-day moving average (DMA) at 110.30. Support is at $101.00, $100.00, and then $96.25 a barrel, it's 200-DMA. WTI has resistance at its 100-DMA at $106.95, followed by the 2022 trendline at $108.50 a barrel. Support is at $99.60, $97.50, and then its 200-DMA at $93.40 a barrel.
Gold capitulates
The massive strength of the US Dollar across asset classes overnight was more than gold could withstand, despite lower US yields. It wilted in the face of US Dollar strength and finished the overnight session 2.40% lower at $1765.00 an ounce. In Asia, it has eked out a tiny gain to $1767.40 an ounce.
With gold moving inversely to the US Dollar and no other inputs driving the price, gold’s only salvation from here is entirely reliant on a sudden reversal of course by the greenback. Having finally broken out lower from its multi-month $1780.00 to $1880.00 range, the failure of $1780.00 is an important technical development. Assuming the Dollar rally continues, the technical picture suggests a move lower to $1720.00 an ounce in the days ahead.
Gold has resistance at $1780.00, $1785.00, and $1820.00, its downward trendline. Support is at $1764.00 and then $1720.00, followed by $1675.00. Failure of the latter sets in motion a much deeper correction, potentially reaching $1500.00 an ounce.