

Sample Category Title
Technical Outlook and Review
DXY:
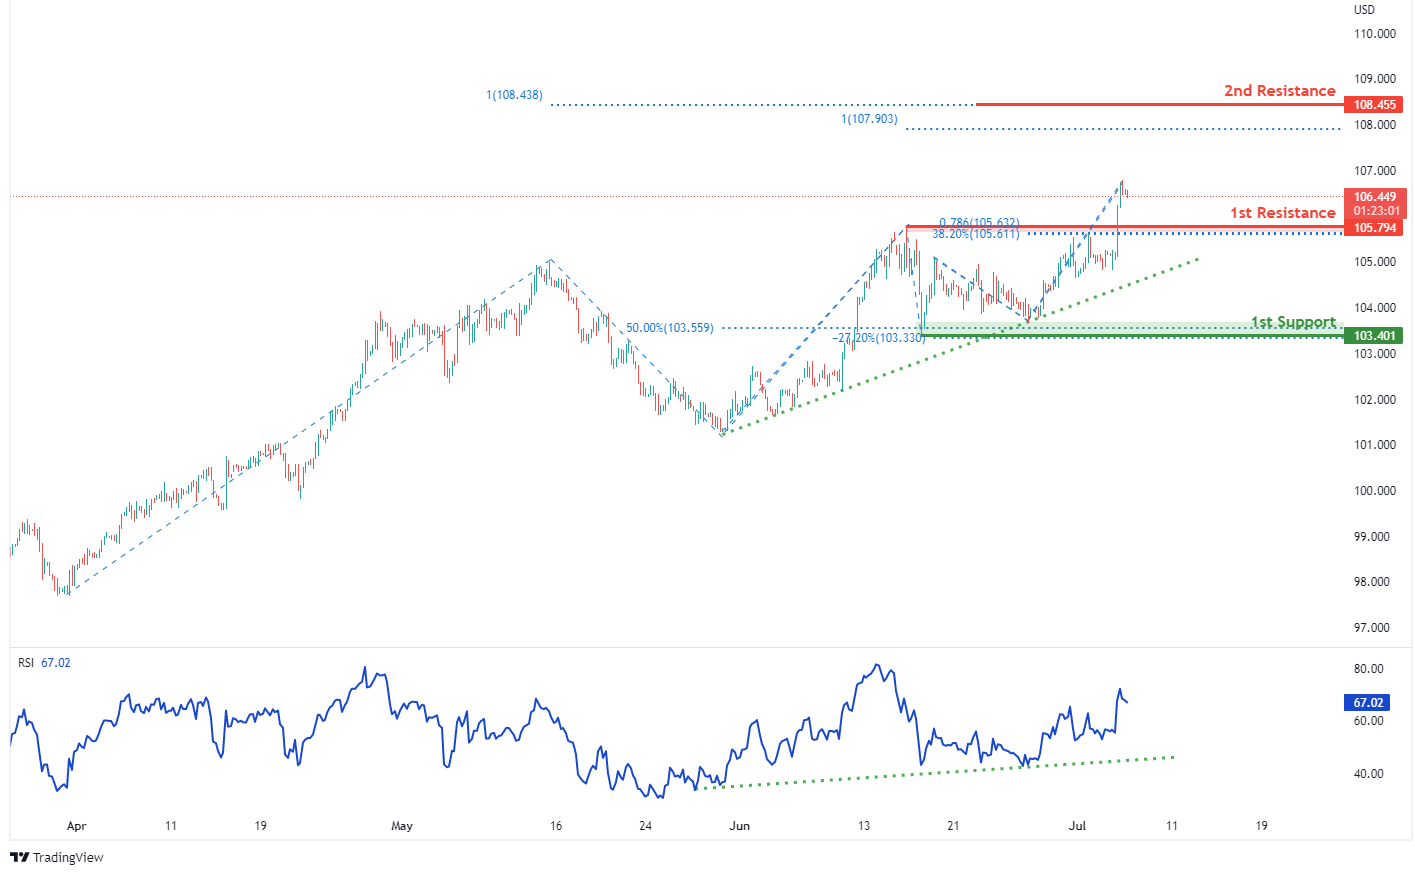
On the H4, with RSI moving along an ascending trendline and prices moving along the ascending trendline, we have a bullish bias that prices will drop and rise from 1st resistance at 105.794 where the pullback resistance, 38.2% fibonacci retracement and 78.6% fibonacci projection are to 2nd resistance at 108.455 in line with 100% fibonacci projection and 100% fibonacci projection. Alternatively, price may break 1st resistance structure and drop to 1st support at 103.401 where the horizontal swing low support, -27.2% fibonacci expansion and 50% fibonacci retracement are.
Areas of consideration:
- H4 time frame, 1st resistance at 105.794
- H4 time frame, 1st support at 103.401
XAU/USD (GOLD):
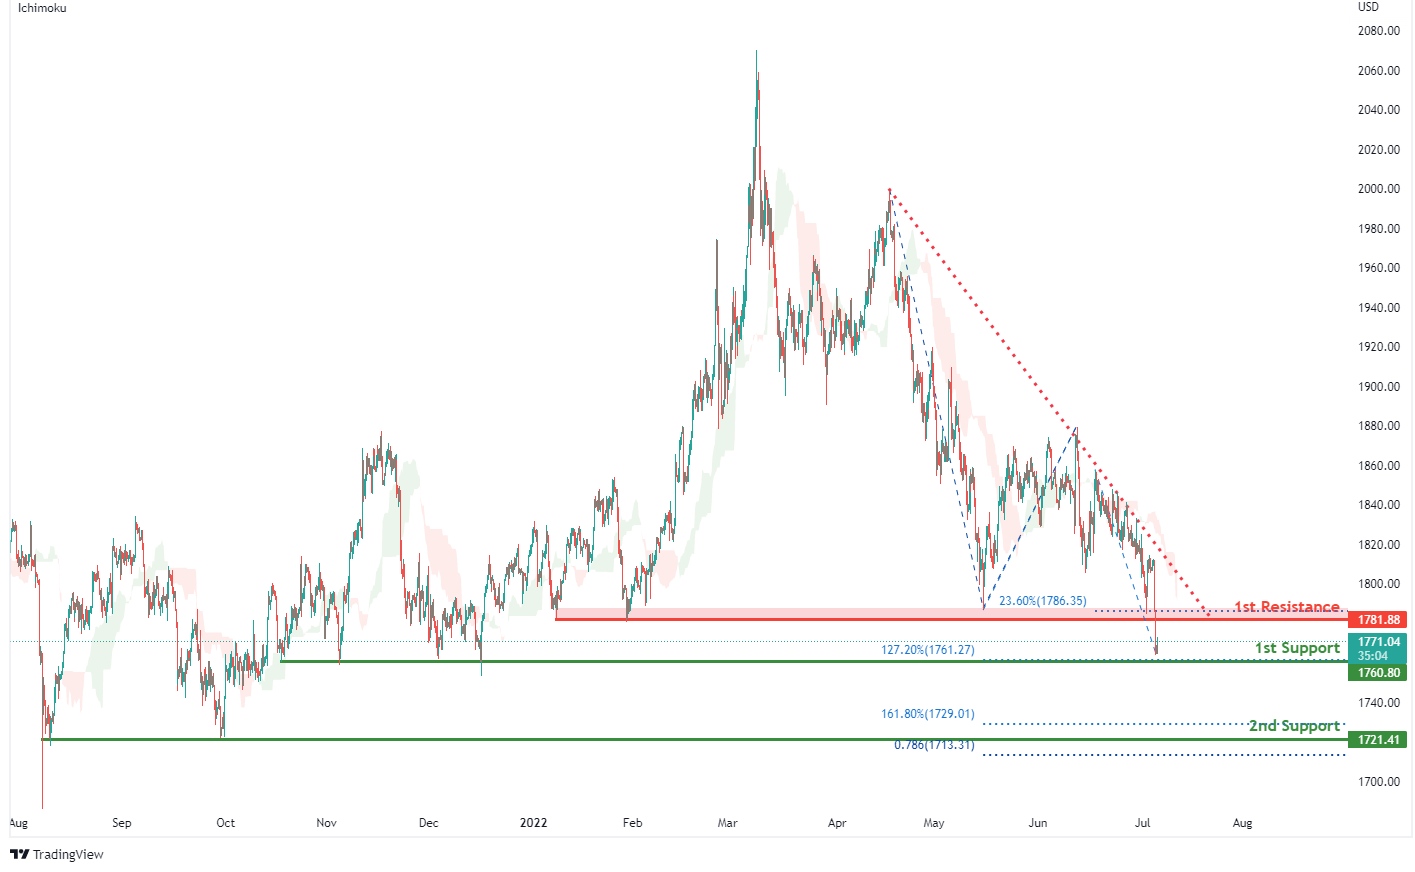
On the H4, with prices moving below the ichimoku indicator and along a descending trendline, we have a bearish bias that prices will drop to our 1st support at 1760.80 where the horizontal swing low support and 127.2% fibonacci extension are. Once we have downside confirmation of price breaking 1st support structure, we would expect bearish momentum to carry price to 2nd support at 1721.41 in line with swing low support, 78.6% fibonacci projection and 161.8% fibonacci extension. Alternatively, price could rise to our 1st resistance at 1781.88 in line with overlap resistance and 23.6% fibonacci retracement.
Areas of consideration:
- H4 time frame, 1st Resistance at 1781.88
- H4 time frame, 1st Support at 1760.80
GBP/USD:
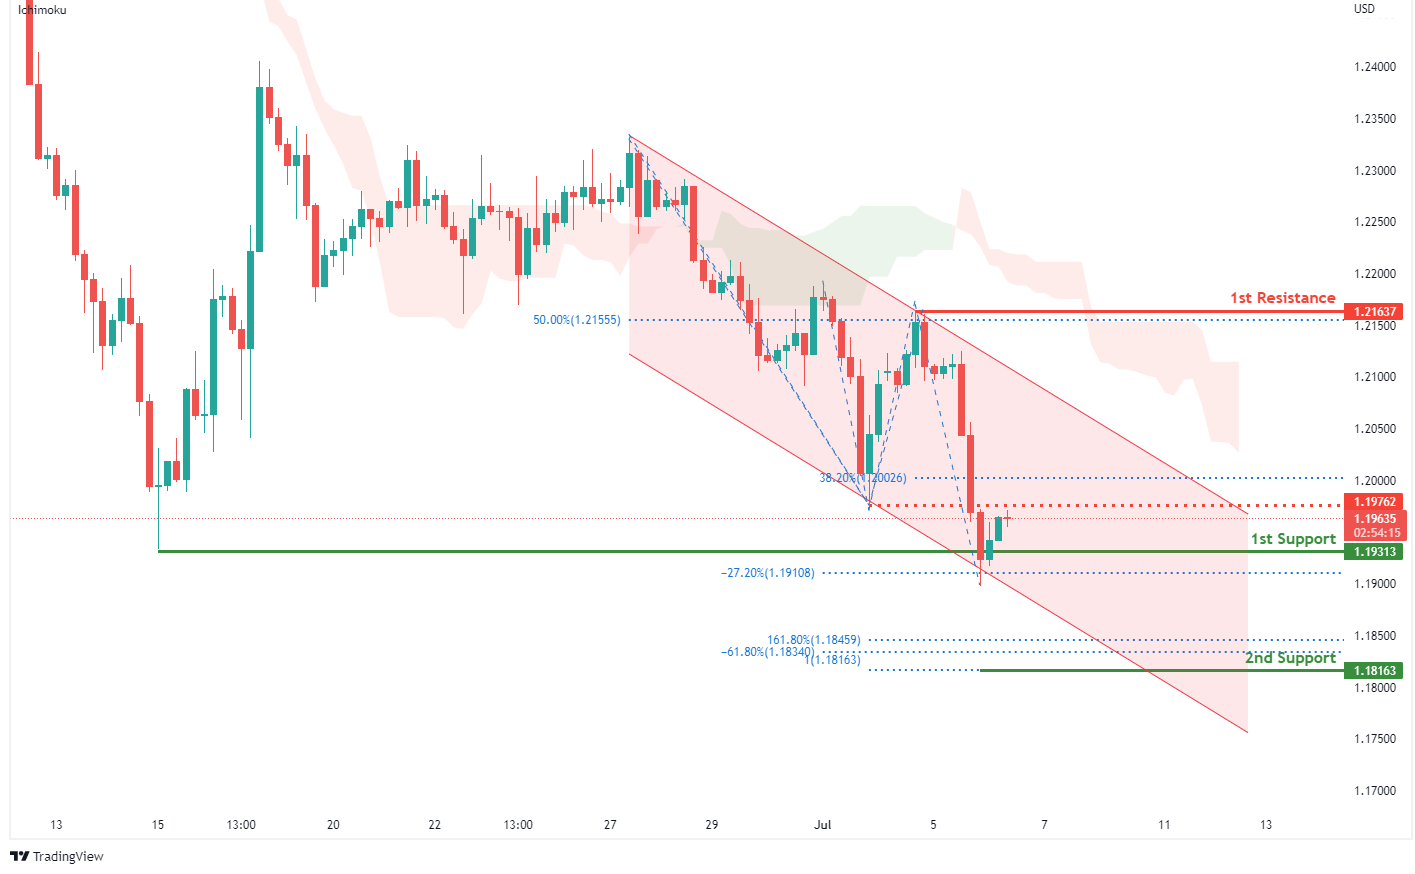
On the H4, with prices moving below the ichimoku indicator and within the descending channel, we have a bearish bias that price will drop to our 1st support at 1.19313 where the horizontal pullback support and -27.2% fibonacci expansion are. Once we have downside confirmation that price has broken 1st support structure, we would expect bearish momentum to carry price to our 2nd support at 1.18163 where the 161.8% fibonacci extension, -61.8% fibonacci expansion and 100% fibonacci projection are. Alternatively, price could rise to intermediate resistance at 1.19762 in line with the pullback resistance and 38.2% fibonacci retracement. Should price break intermediate resistance structure, we would have a bullish bias that price will rise to 1st resistance at 1.21637 where the 50% fibonacci retracement and swing high resistance are.
Areas of consideration:
- H4 1st resistance at 1.21637
- H4 1st support at 1.19313
USD/CHF:
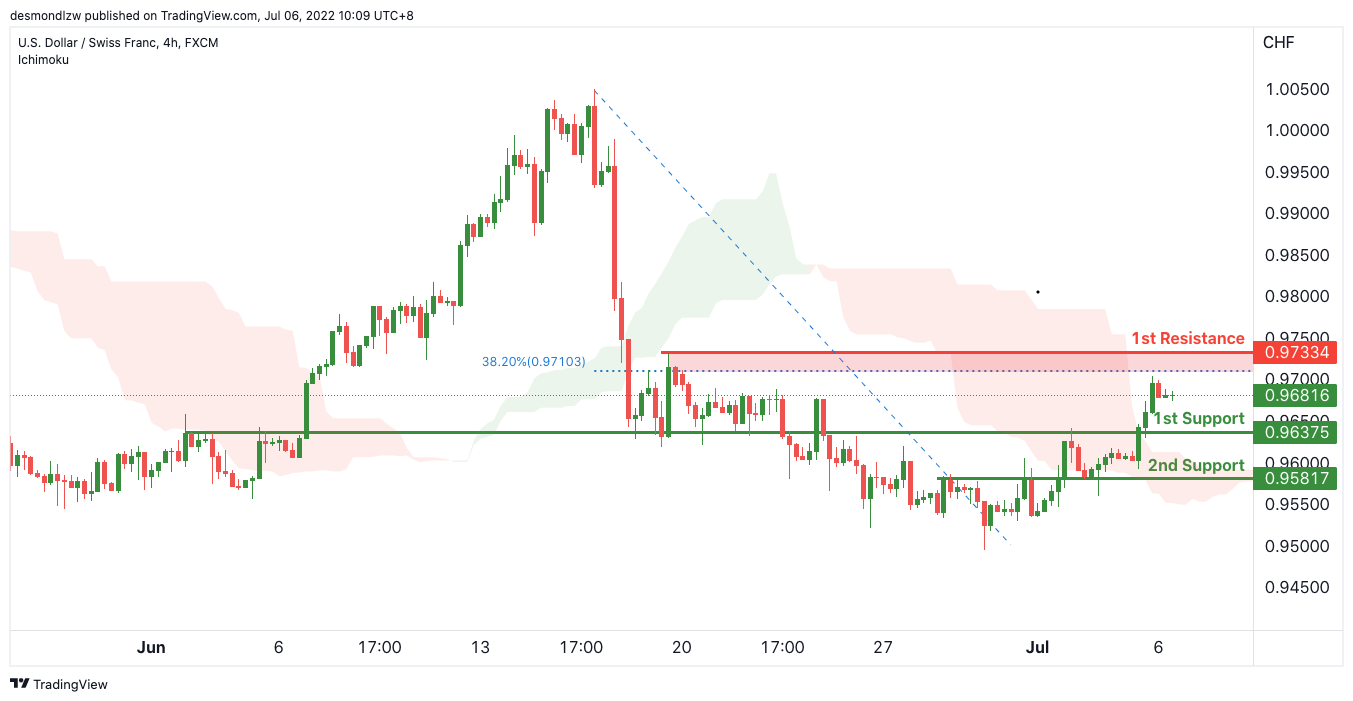
On the H4, with price moving above the ichimoku cloud, we have a bullish bias that price will rise from our 1st support at 0.96375 where the horizontal pullback support is to our 1st resistance at 0.97334 in line with the horizontal swing high resistance and 38.2% Fibonacci retracement. Alternatively, price may break 1st support and head for 2nd support at 0.95817 where the horizontal pullback support.
Areas of consideration
- 1st support level at 0.96375
- 1st resistance level at 0.97334
EUR/USD :
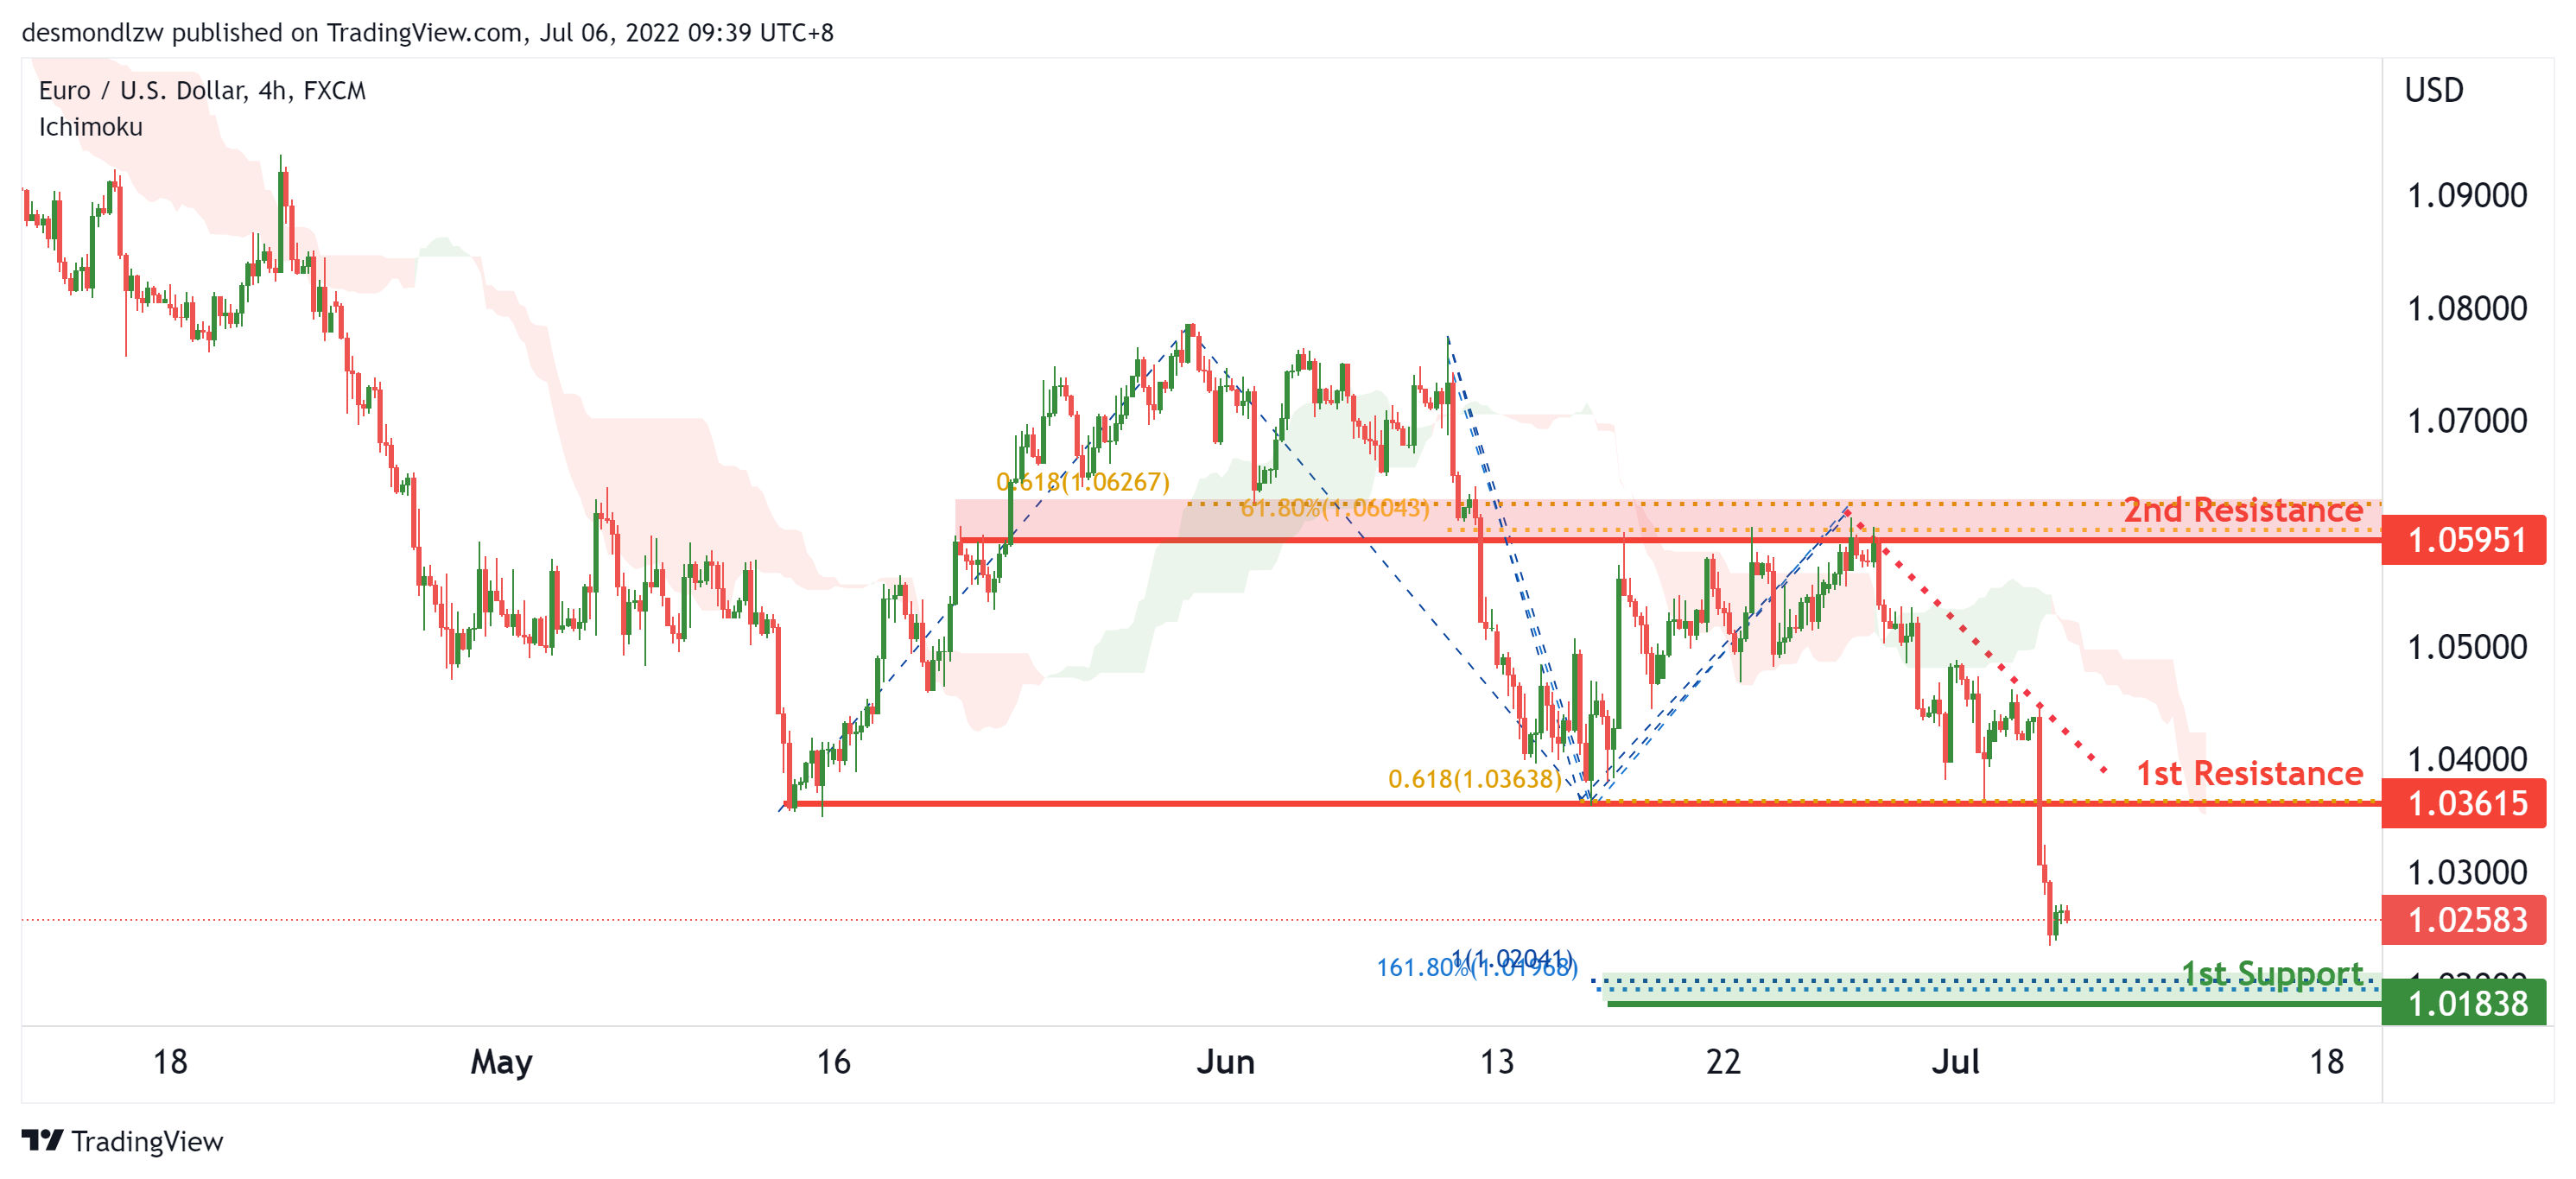
On the H4, with price moving in a descending trendline and below the ichimoku cloud, we have a bearish bias that price will continue to drop from the 1st resistance at 1.03615 at the pullback resistance in line with the 61.8% fibonacci projection to the 1st support at 1.01838 in line with the 161.8% fibonacci extension and 100% fibonacci projection. Alternatively, price may reverse and break the resistance to rise to the 2nd resistance at 1.05951 at the pullback swing high in line with the 61.8% fibonacci retracement and 61.8% fibonacci projection.
Areas of consideration :
- H4 1st resistance at 1.03615
- H4 1st support at 1.01838
USD/JPY:
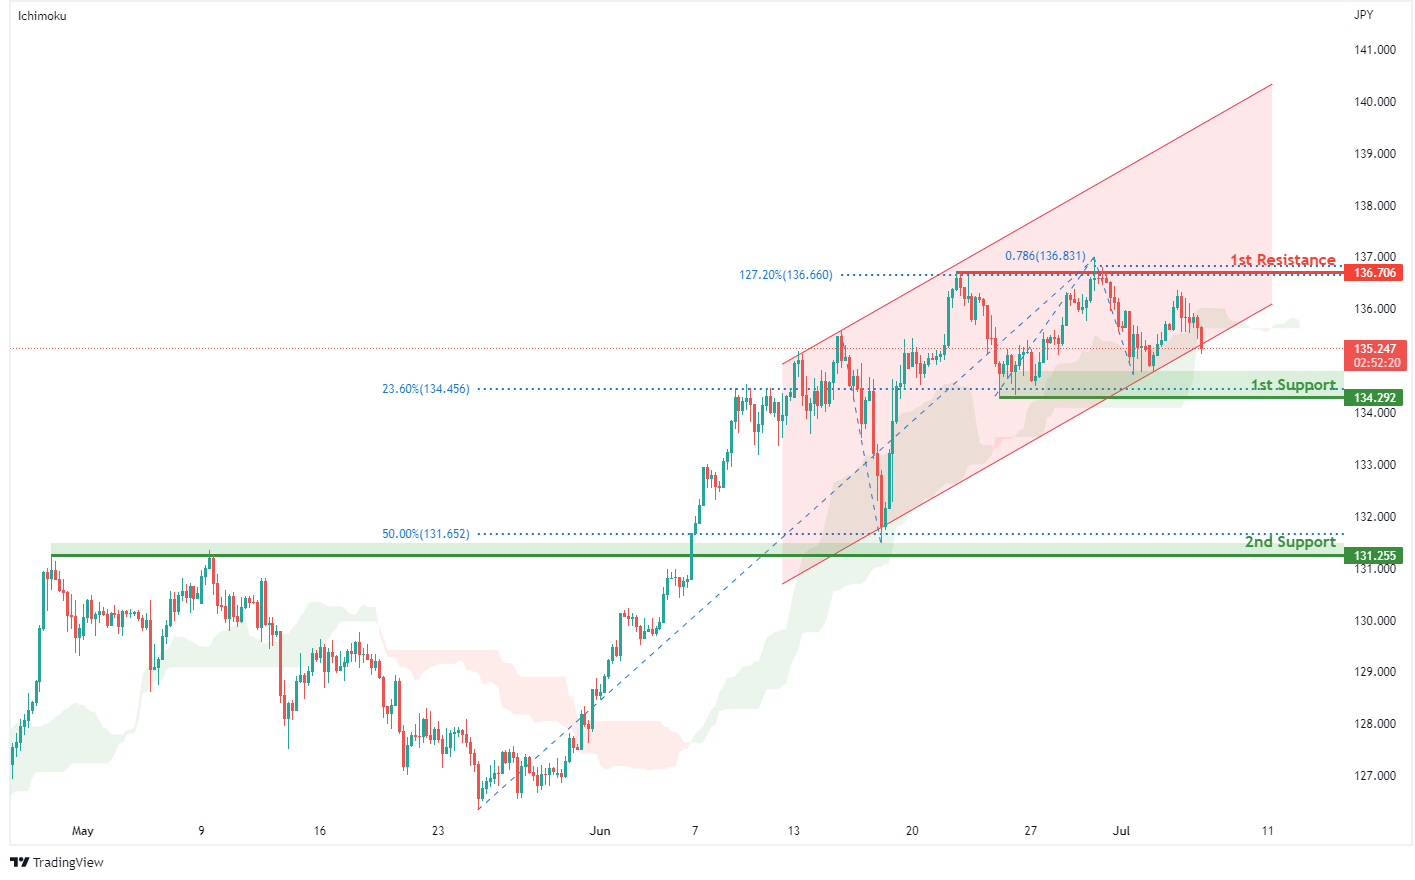
On the H4, with price breaking out from an ascending channel and moving below the ichimoku indicator, we have a bearish bias that price will drop to our 1st support at 134.292 in line with the swing low support and 23.6% fibonacci retracement. Once there is downside confirmation that price has broken past the 1st support, we would expect bearish momentum to carry price to our 2nd support at 131.255 where the 50% fibonacci retracement and overlap support are. Alternatively, price may rise to 1st resistance at 136.706 in line with the swing high resistance, 127.2% fibonacci extension and 78.6% fibonacci projection.
Areas of consideration:
- H4 time frame, 1st resistance at 136.706
- H4 time frame, 1st support at 134.292
AUD/USD:
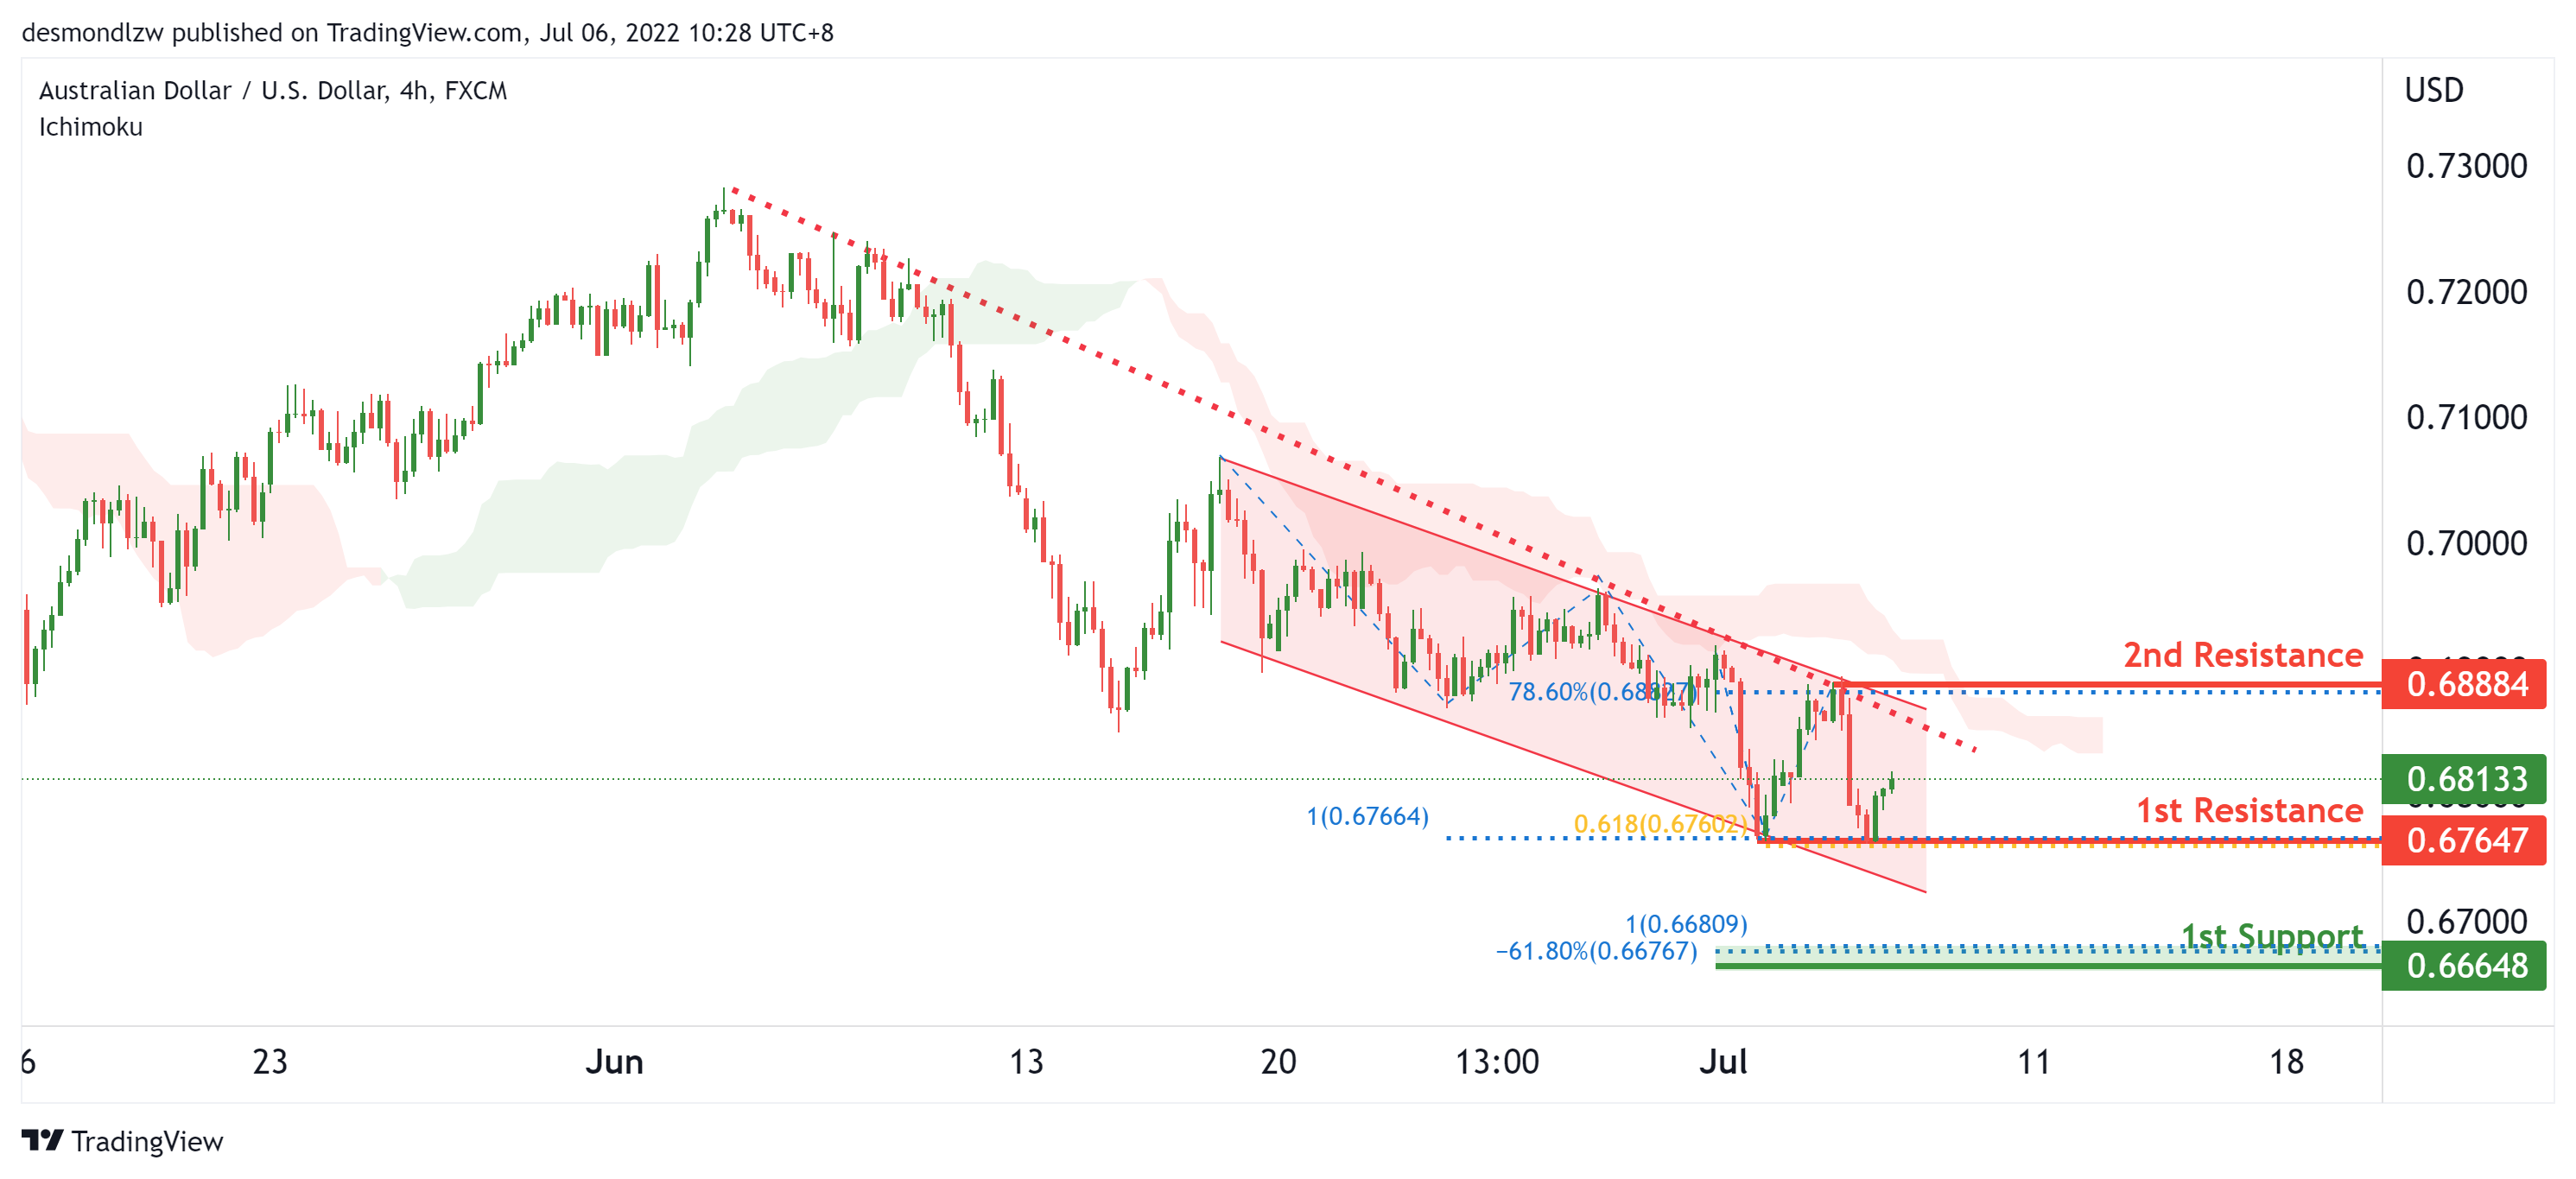
On the H4, with price moving below the ichimoku cloud, ina descending trendline and in a descending trend channel, we have a bearish bias that price will drop from the 1st resistance at 0.67647 at the swing low in line with the 100% and 61.8% fibonacci projections to the 1st support at 0.66648 in line with the -61.8% fibonacci extension and 100% fibonacci projection. Alternatively, price may reverse off the 1st resistance and rise to the 2nd resistance at 0.68884 in line with the swing high and 78.6% fibonacci retracement.
Areas of consideration
- H4 1st resistance at 0.67647
- H4 1st support at 0.66648
NZD/USD:
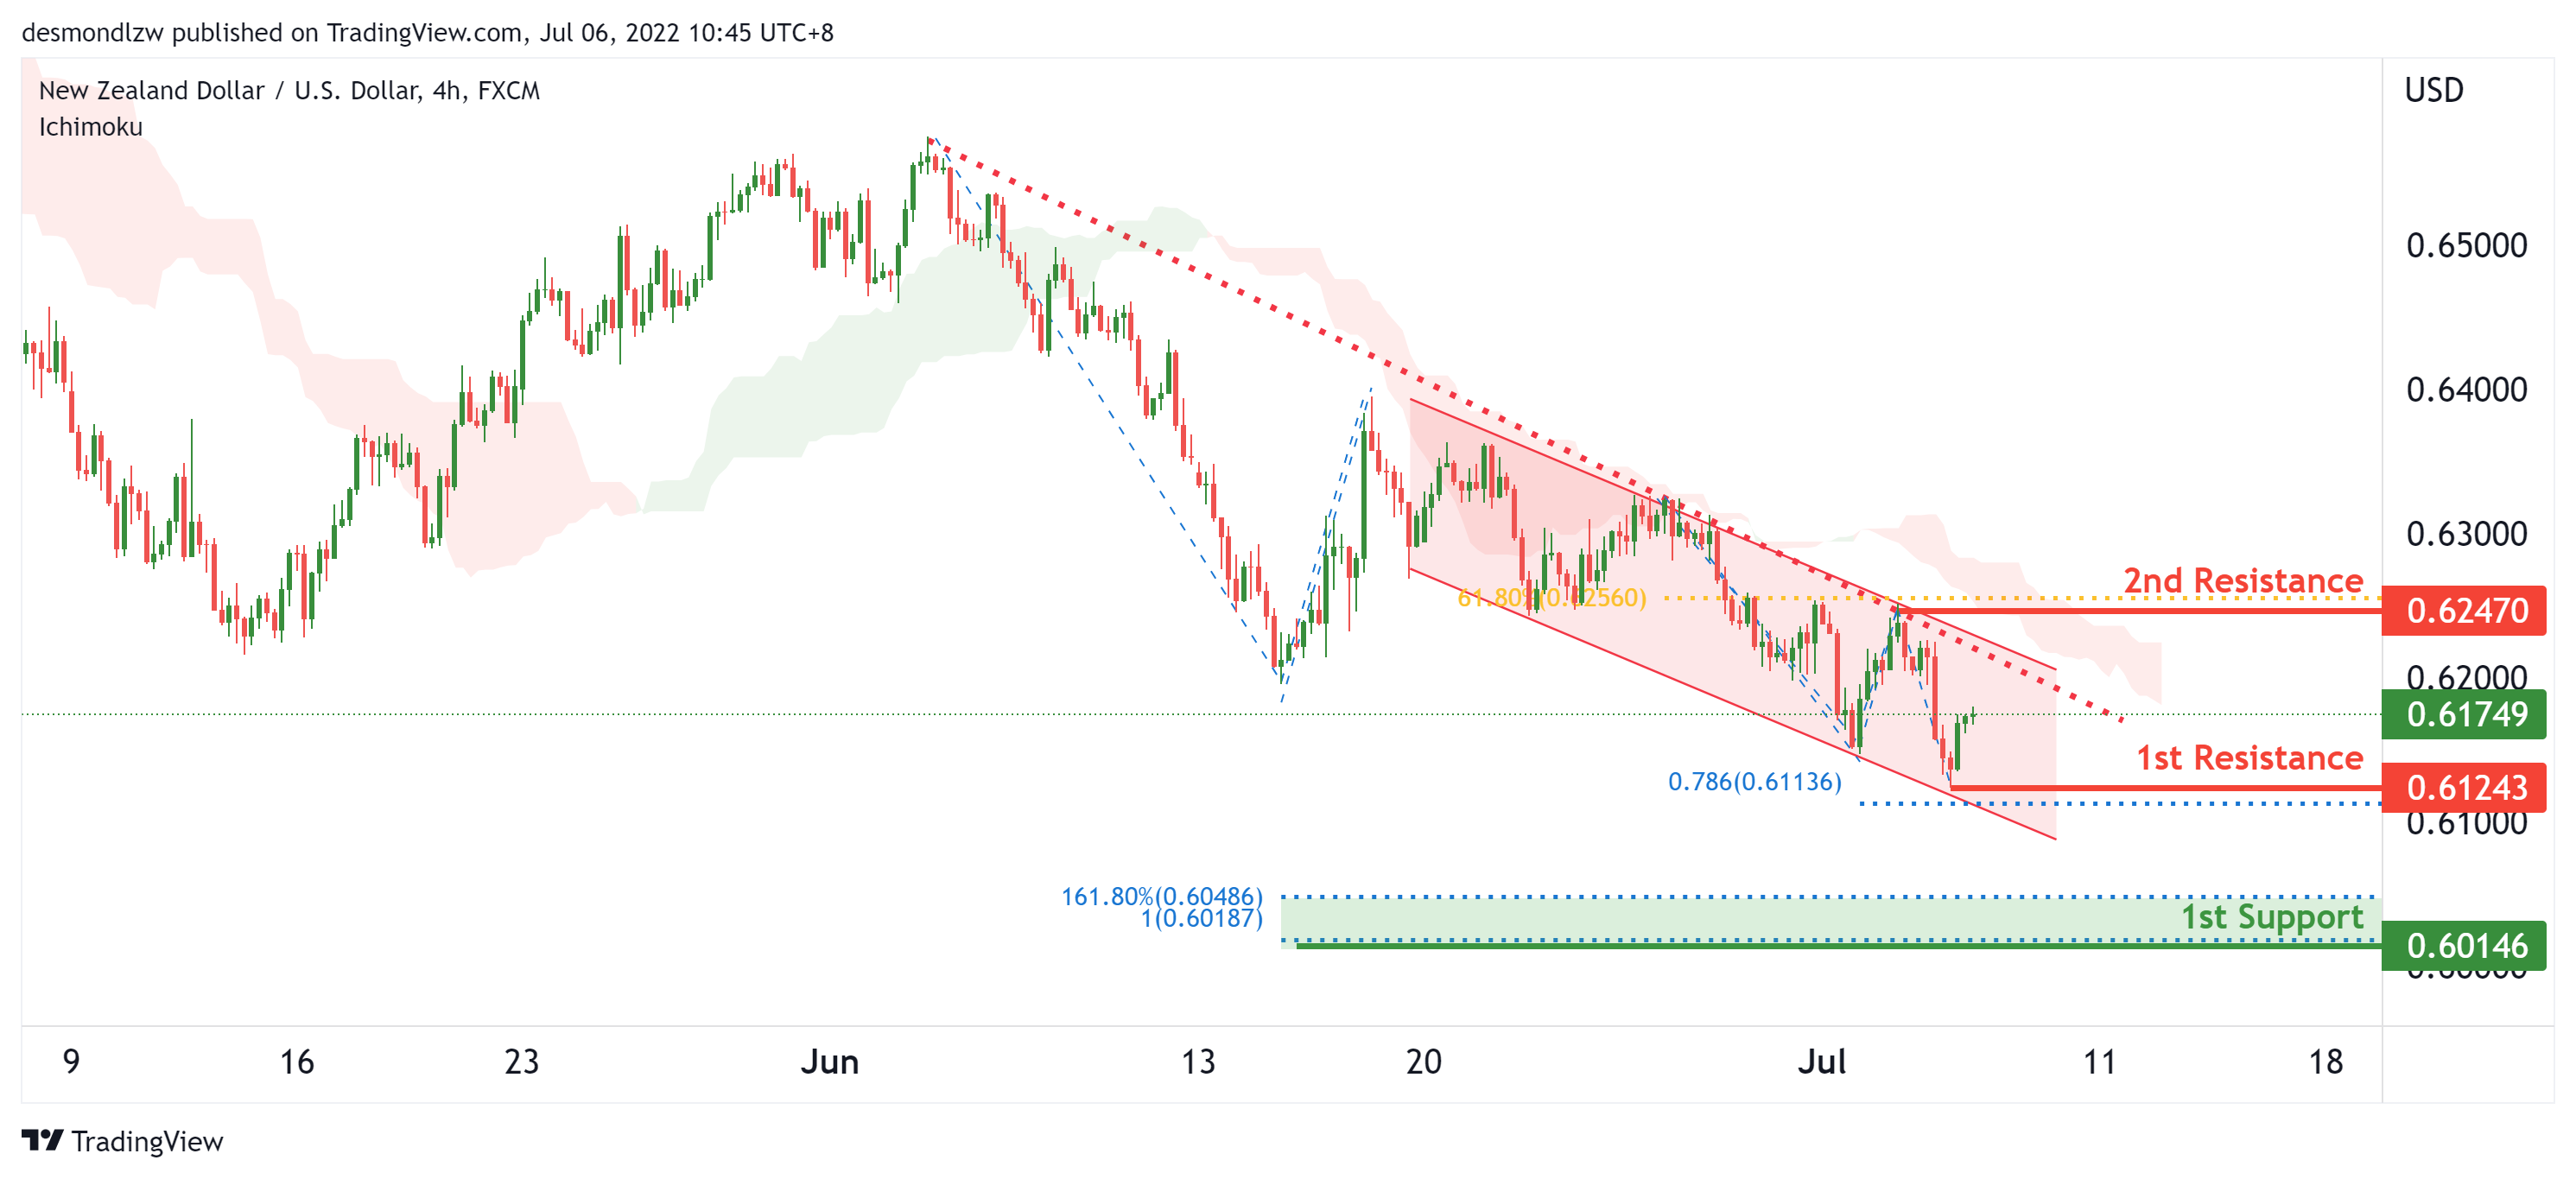
On the H4, with price moving below the ichimoku cloud, in a descending trendline and in a descending trend channel, we have a bearish bias that price will drop from the 1st resistance at 0.61243 at the swing low in line with the 78.6% fibonacci projection to the 1st support at 0.60146 in line with the 161.8% fibonacci extension and 100% fibonacci projection. Alternatively, price may reverse off the 1st resistance and rise to the 2nd resistance at 0.62470 in line with the swing high and 61.8% fibonacci retracement.
Areas of consideration:
- H4 time frame, 1st support at 0.60146
- H4 time frame, 1st resistance at 0.61243
USD/CAD:
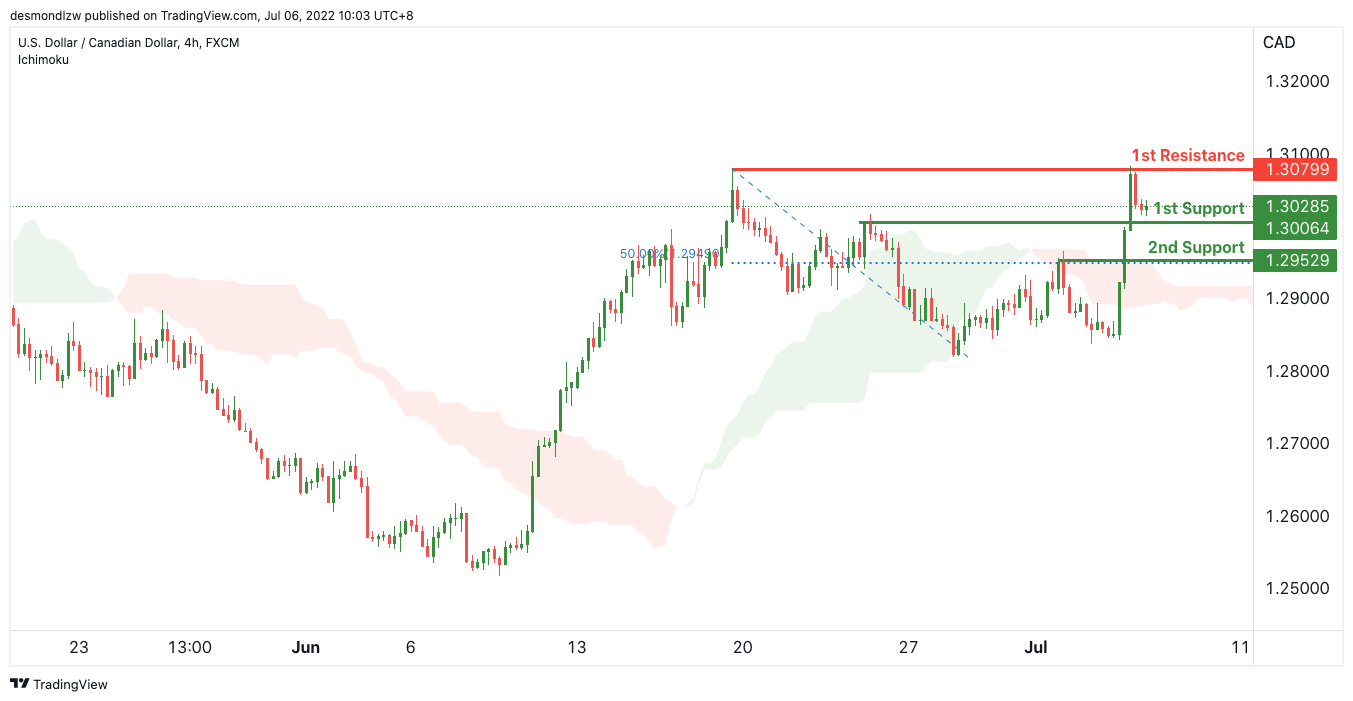
On the H4, with price moving above the ichimoku cloud, we have a bullish bias that price will rise from our 1st support at 1.30064 where the horizontal pullback support is to our 1st resistance at 1.30799 in line with the horizontal swing high resistance. Alternatively, price may break 1st support and head for 2nd support at 1.29529 where the horizontal pullback support and 50% Fibonacci retracement.
Areas of consideration:
- H4 time frame, 1st resistance at 1.30799
- H4 time frame, 1st support at 1.30064
OIL:
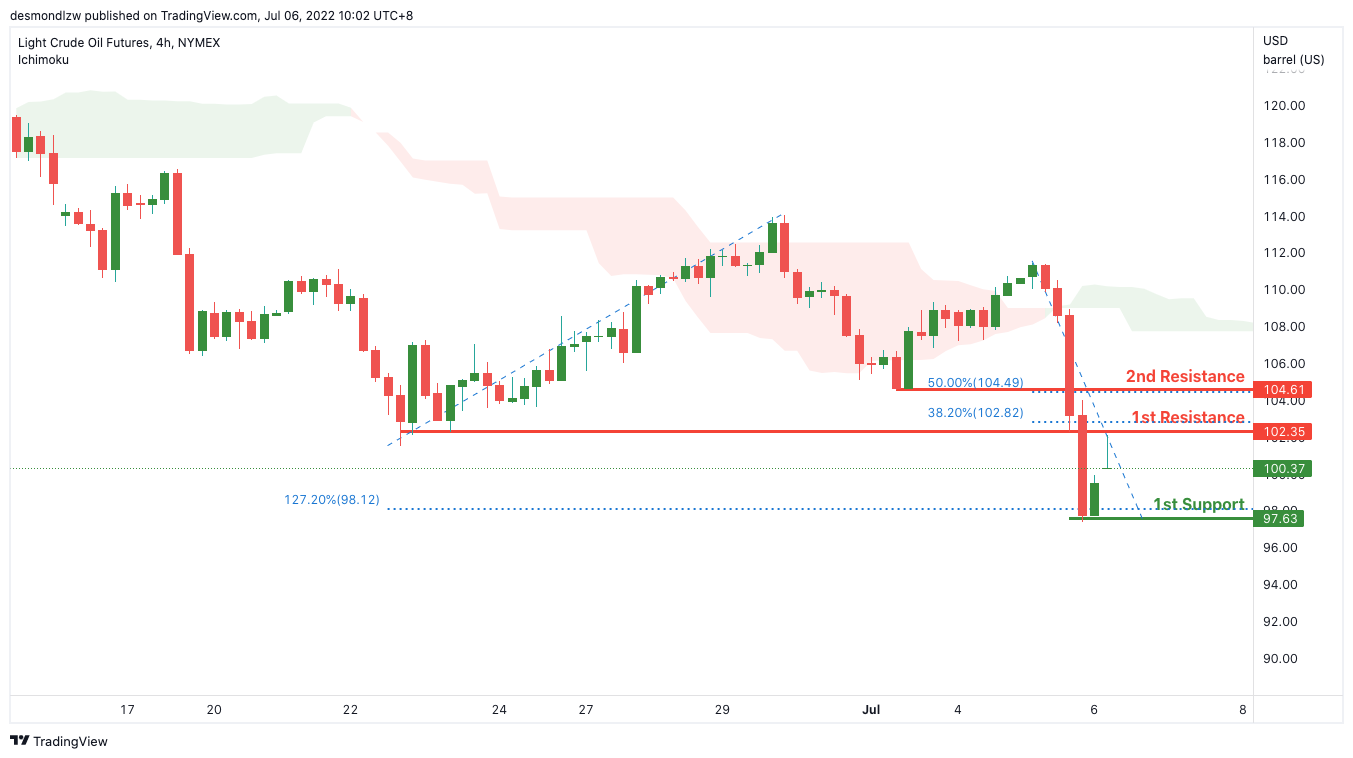
On the H4, with price moving below the ichimoku cloud, we have a bearish bias that price will drop to our 1st support at 97.63 where the horizontal swing low support and 127.2% Fibonacci extension are from our 1st resistance at 114.09 in line with the horizontal pullback resistance and 38.2% Fibonacci retracement. Alternatively, price may break 1st resistance and head for 2nd resistance at 104.61 where the horizontal pullback resistance and 50% Fibonacci retracement is.
Areas of consideration:
- H4 time frame, 1st resistance of 114.09
- H4 time frame, 1st support of 97.63
Dow Jones Industrial Average:
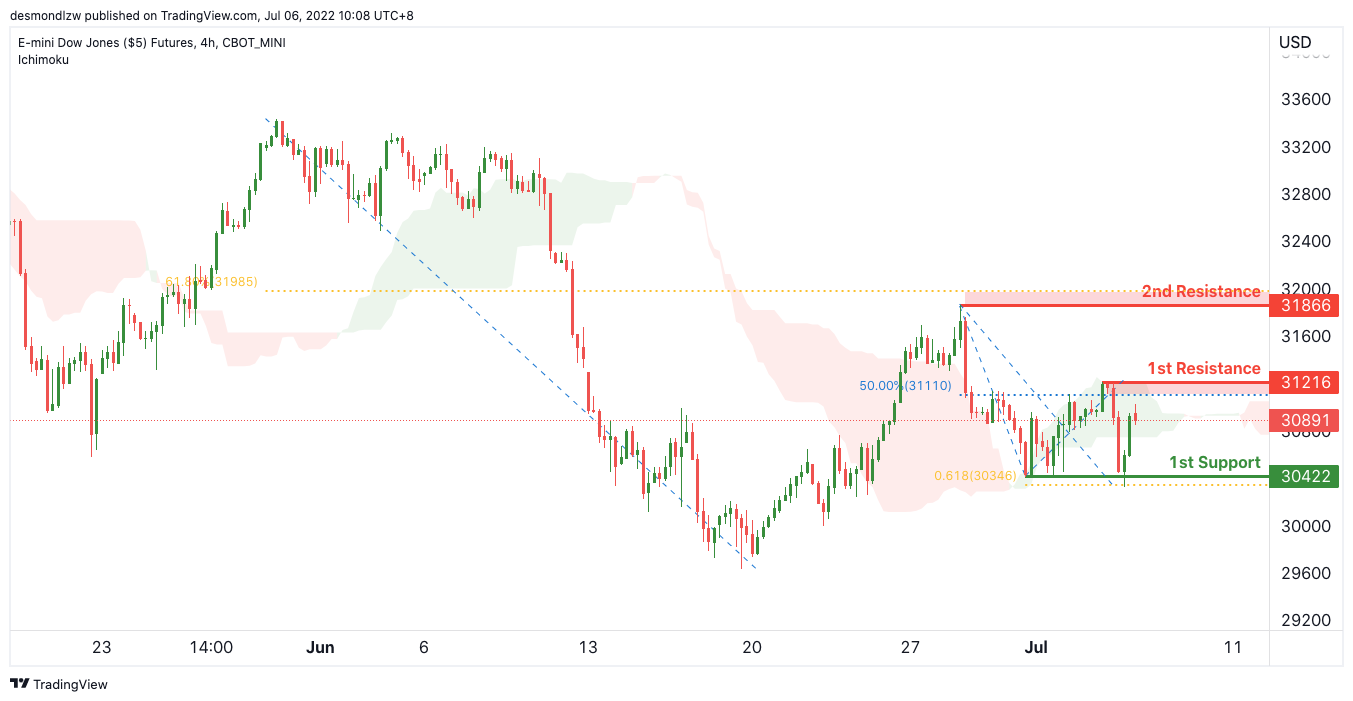
On the H4, with price expected to reverse off the ichimoku cloud, we have a bearish bias that price will drop to our 1st support at 30422 where the horizontal swing low support and 61.8% Fibonacci retracement are from our 1st resistance at 31216 in line with the horizontal swing high resistance and 50% Fibonacci retracement. Alternatively, price may break 1st resistance and head for 2nd resistance at 31866 where the horizontal swing high resistance and 61.8% Fibonacci retracement is.
Areas of consideration:
- H4 time frame, 1st resistance of 31216
- H4 time frame, 1st support of 30422
Elliott Wave View: Nasdaq Rally Remains Corrective
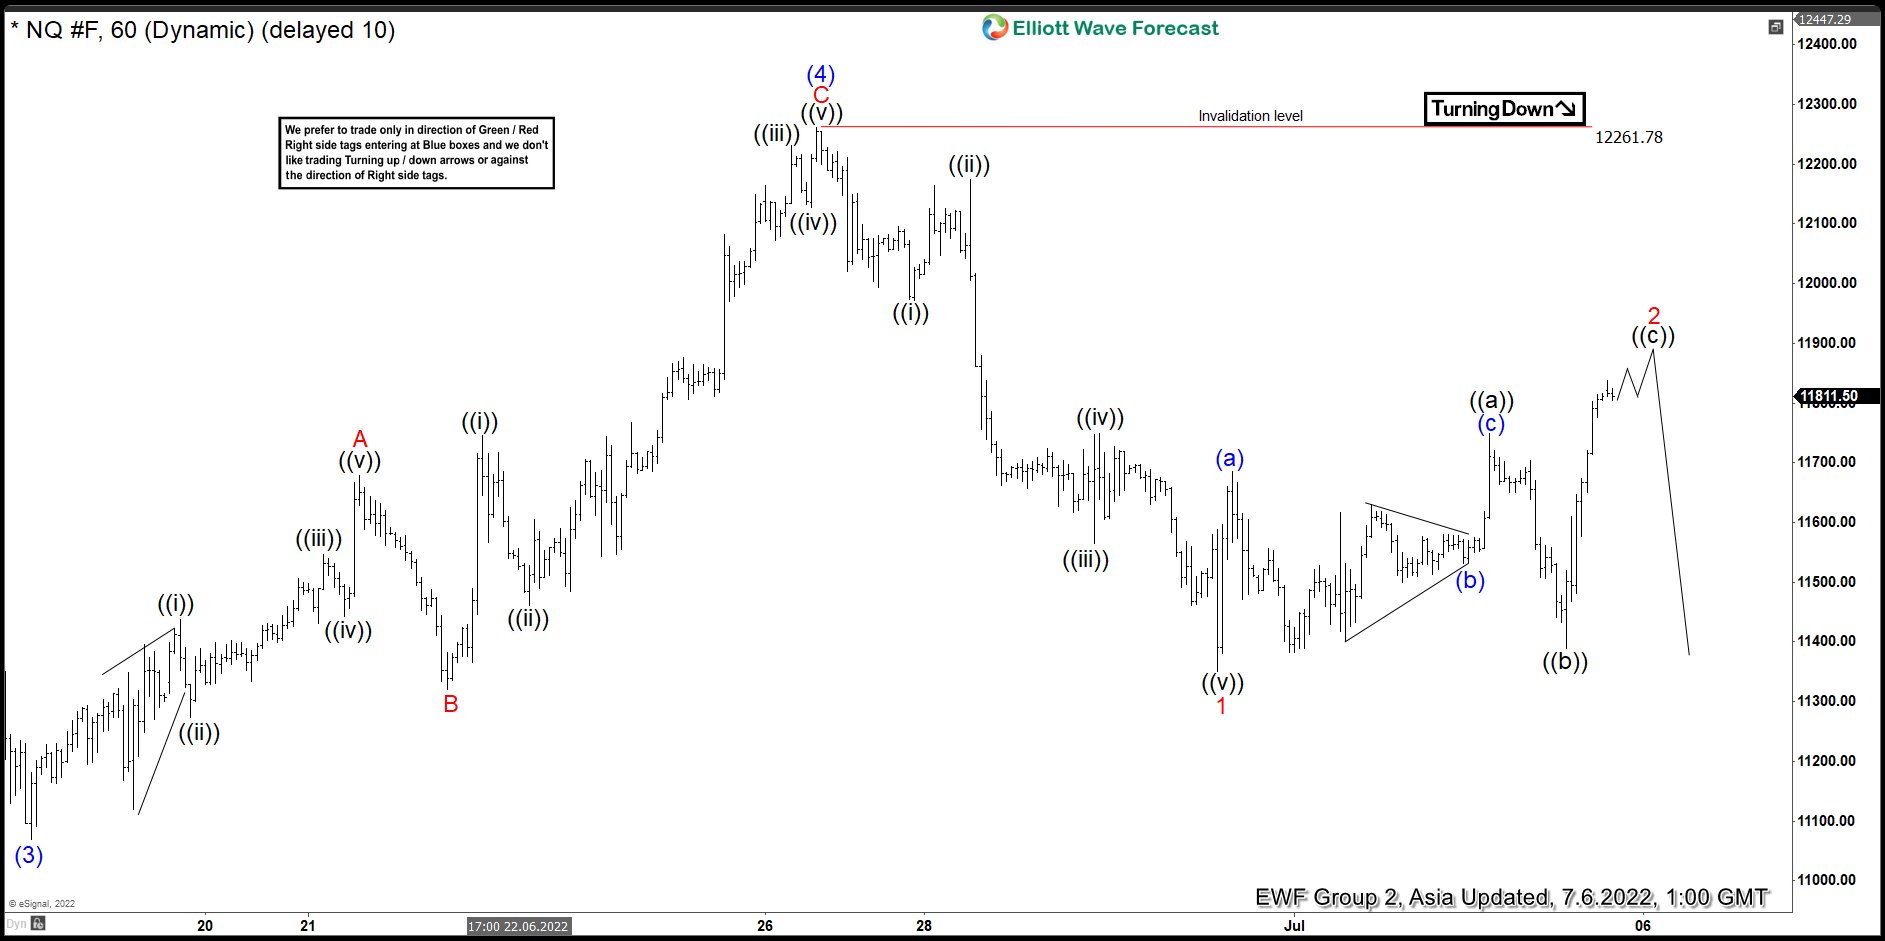
Short term Elliott Wave view in Nasdaq suggests the decline to 11068.5 ended wave (3). Wave (4) corrective rally ended at 12261.78 with internal subdivision as a zigzag Elliott Wave structure. Up from wave (3), wave A ended at 11678.25 and pullback in wave B ended at 11320.50. Final leg higher wave C ended at 12261.78 which also completed wave (4). The Index has turned lower in wave (5), but it still needs to break below wave (3) at 11068.5 to rule out a double correction.
Internal subdivision of wave (5) is unfolding as a 5 waves impulse structure. Down from wave (4), wave ((i)) ended at 11971 and wave ((ii)) rally ended at 12174.25. Index then resumes lower in wave ((iii)) towards 11564.50 and wave ((iv)) rally ended at 11749. Final leg lower wave ((v)) ended at 11351 and this completed wave 1. Wave 2 rally is now in progress to correct cycle from 6/26/2022 high before it resumes lower. Up from wave 1, wave ((a)) ended at 11749 and pullback in wave ((b)) ended at 11389.25. Expect wave ((c)) of 2 to end soon and Index to turn lower. Near term, as far as pivot at 12261.78 stays intact, expect rally to fail in 3, 7, 11 swing for further downside.
Nasdaq 60 Minutes Elliott Wave Chart
Eco Data 7/6/22
[php_everywhere instance="1"]
Gold breaks down again on Dollar strength
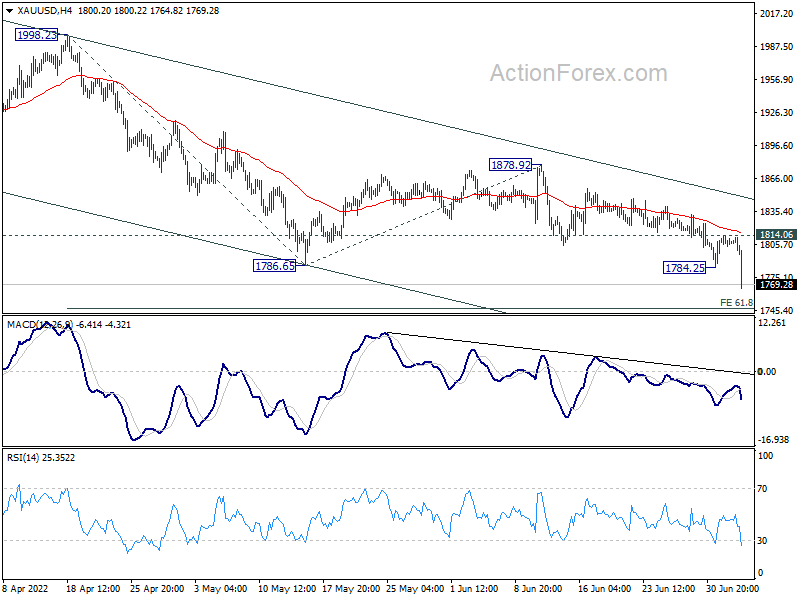
Gold's decline resumes today on broad based Dollar strength. Next target is 61.8% projection of 1998.23 to 1786.65 from 1878.92 at 1748.16. Outlook will stay bearish as long as 1814.06 minor resistance holds, in case of recovery.
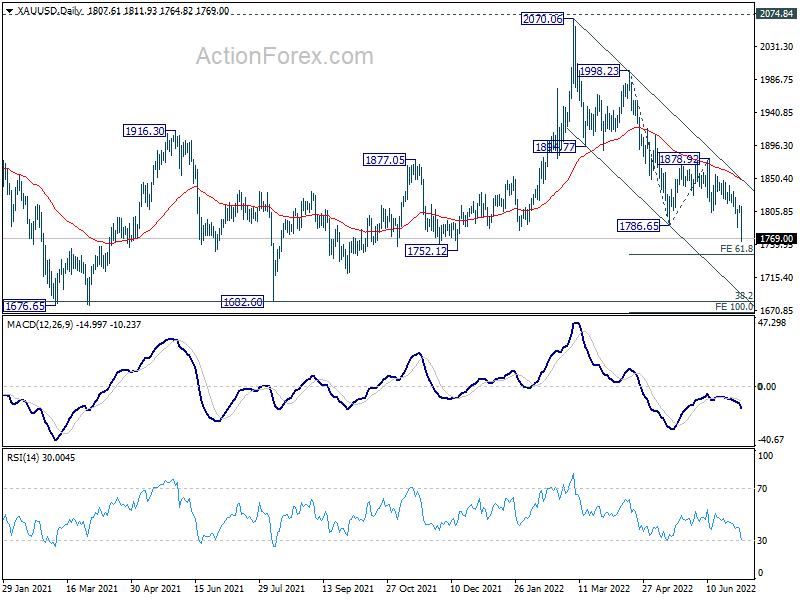
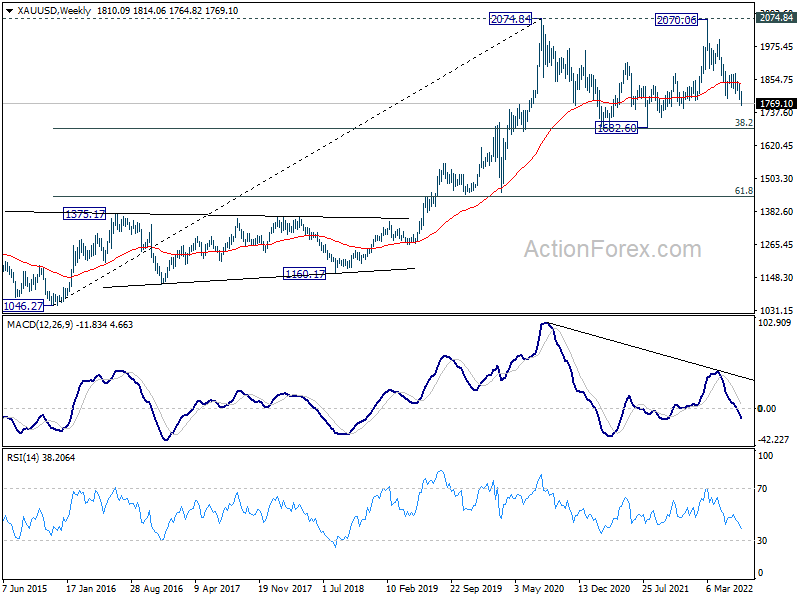
Fall from 2070.06 is seen as the third leg of the corrective pattern from 2074.84 (2020 high). Based on current structure, while break of 1748.16 cannot be ruled out, downside should be contained above 1682.60 support (38.2% retracement of 1046.27 to 2074.84 at 1681.92).
Dollar Re-Energized ahead of Fed Minutes, NFP Report Amid Recession Jitters
Speculation that the US economy may already be in a recession is running rife so the latest jobs report released on Friday (12:30 GMT) will play a crucial role in heightening or allaying those concerns. Ahead of that, the Federal Reserve is more likely than not to stoke recession anxiety as the minutes of the June FOMC meeting out on Wednesday (18:00 GMT) are expected to reinforce policymakers’ resolve to get a grip on soaring inflation. All the panic about an economic downturn is bolstering the safe-haven US dollar, though its rally versus the Japanese yen has cooled lately.
A slowdown or a recession?
It wasn’t that long ago that a recession in America was merely a low-risk threat and a mild slowdown was the more realistic scenario. But key economic pointers have started to deteriorate rather rapidly lately and the ISM non-manufacturing PMI due Wednesday could be the next data point to turn ugly in June. Serious doubts are now emerging about whether the Fed can bring inflation under control without triggering a recession.
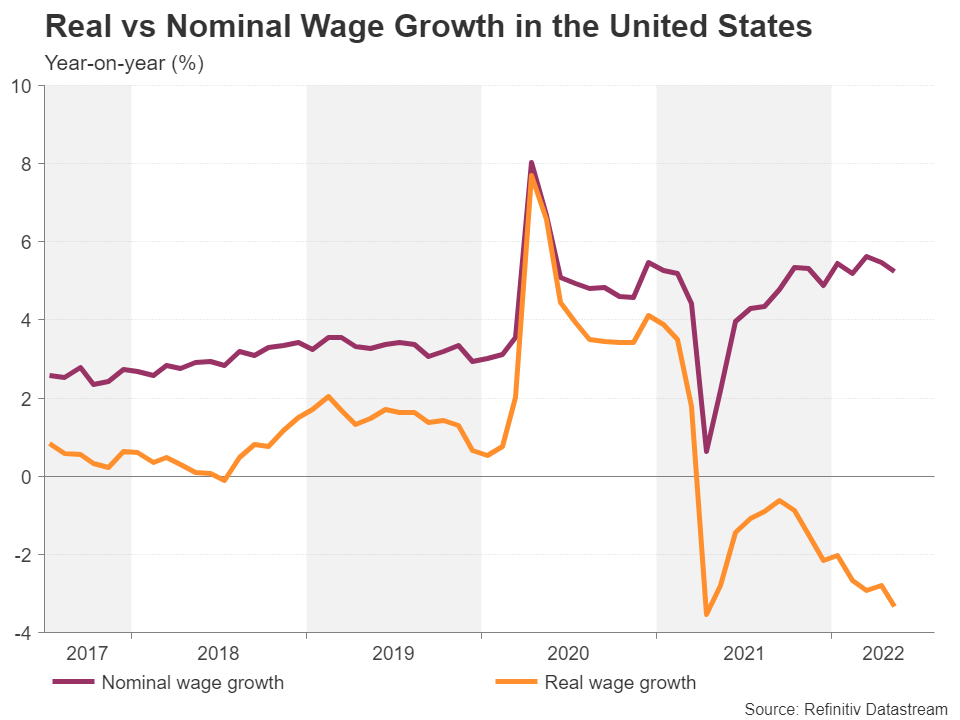
Personal consumption – long considered the primary growth engine of the US economy – appears to be slowing, and in real terms, it fell by 0.4% m/m in May. What is more worrying is that real wage growth has been negative for the past year and without any fresh stimulus checks, Americans have been drawing down on their savings as the price spikes of gasoline and other essential goods have started to bite. Exacerbating the squeeze on consumers are the mounting year-to-date losses on Wall Street and the slowdown in the housing market, which are eroding household wealth for many Americans.
Wage growth not keeping up with inflation
A pickup in wage growth could go a significant way in restoring consumer confidence (a closely watched gauge slumped to a 16-month low in June). But despite the ongoing shortages in some sectors and an overall still very tight labour market, there has been no out-of-control wage-price spiral and the rise in average hourly earnings has been relatively contained, averaging around 5.5% y/y in the first five months of the year. In fact, wage growth seems to be losing some steam and is expected to have moderated for the third straight month to 5.0% y/y in June.
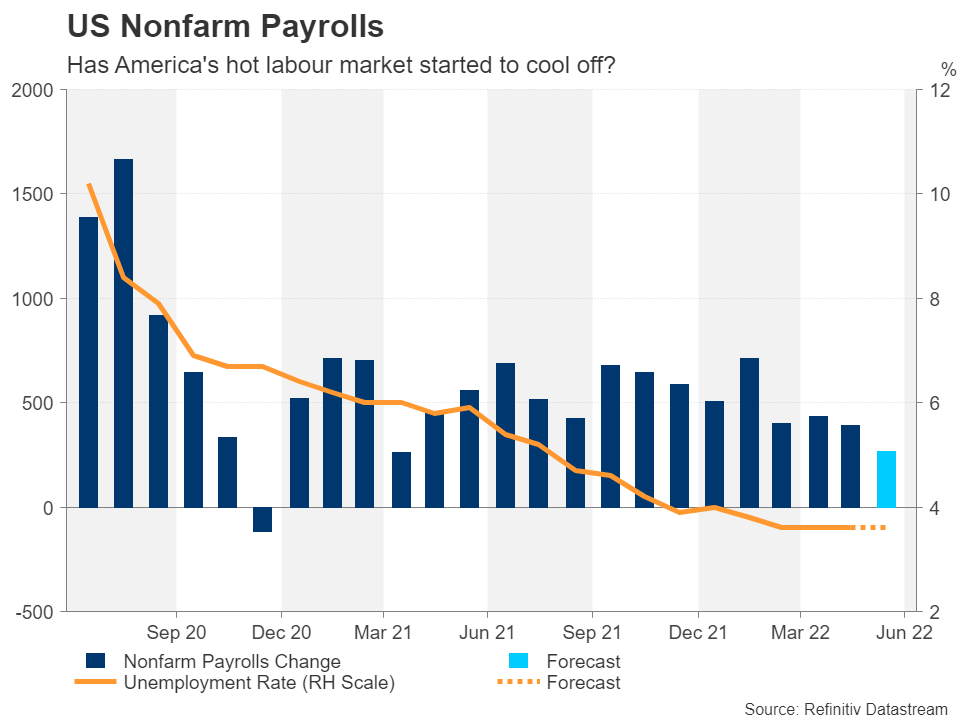
On the plus side, the economy continues to churn out jobs at a healthy clip and nonfarm payrolls are expected to have risen by 268k in June, down from 390k in May. The unemployment rate likely held steady at 3.6% during the month.
Fed tightening expectations are being pared back
Any disappointment in the headline NFP figure would add to worries about the health of the economy, further dampening Fed rate hike expectations, which have been sharply scaled back since mid-June. Investors have roughly priced out about 75 basis points of rate increases for next year and are even betting that the Fed will begin slashing rates in the second half. The recent easing in oil and other commodity prices and subsequent drop in inflation expectations back the markets’ reassessment of central bank tightening amid all the alarm of a looming recession.
But as far as the Fed is concerned, Powell & Co have signalled that they won’t be altering course unless inflation is on a sure path towards falling to their 2% target. Hence, the June meeting minutes pose an upside risk for the dollar on Wednesday as the Fed will probably reiterate its message that it remains committed to reducing inflation.
Is there more fuel in the dollar rally?
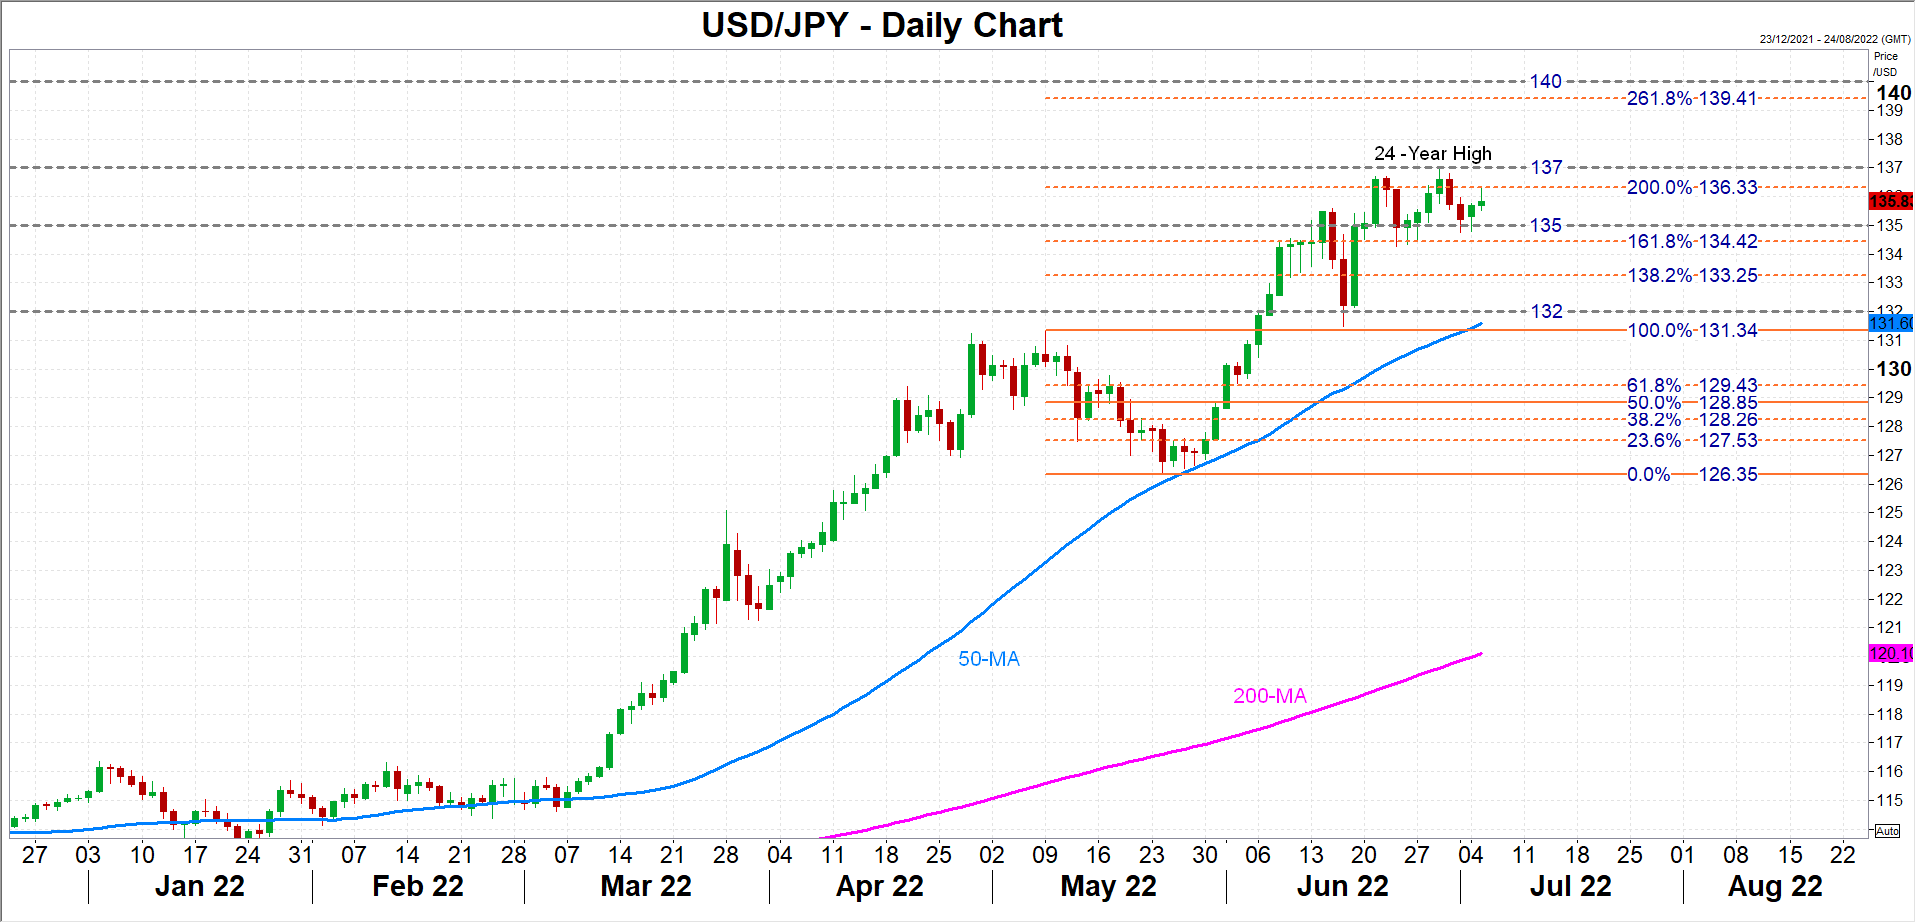
The greenback brushed a 24-year high of 136.99 yen last week but has since eased back a little. Renewed positive momentum would bring the 137-yen handle back within scope, while a successful crack above it would revive market talk of the 140 level being breached, especially if the lift comes from surprisingly strong jobs numbers.
But with investors on edge about a faltering outlook, a smaller-than-expected increase in payrolls could pressure the dollar versus the safe-haven yen, though it may boost it against other riskier currencies. A big jobs miss would likely fuel recession fears, sparking a flight to safety and dragging Treasury yields lower.
Narrowing spreads between US and Japanese government bonds could push the dollar below the recent support of the 161.8% Fibonacci extension of the May downtrend at 134.42 yen, paving the way for the 132-yen level. This would consequently take the pair dangerously close to the 50-day moving average, which lies slightly below the 132 mark.
Gold Falls to New 2022 Low as Dollar Surges on Risk Aversion and Rate Hike Bets
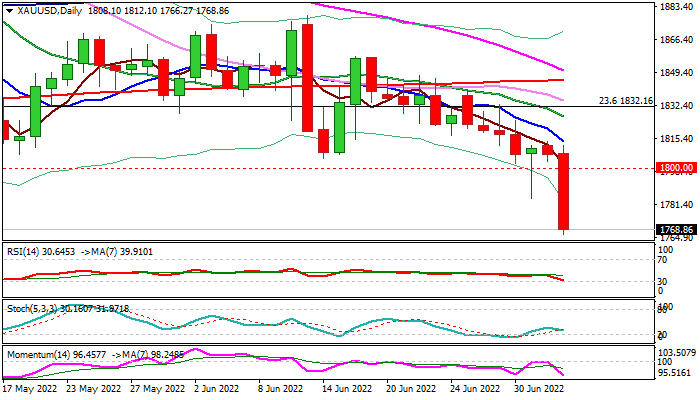
Spot gold lost ground on Tuesday and fell through psychological $1800 support (after two rejections on May 16 and July 1) hitting new 2022 low in the biggest one-day loss since Jun 13.
Growing expectations on aggressive rate hikes in the near future, with the US Federal Reserve being particularly hawkish, due to the situation of soaring inflation that caused the domino-effect on the entire economy.
Rising uncertainty on signals that major economies are sliding into recession, fueled demand for US dollar and additionally pressure the yellow metal.
Fresh weakness adds to signals of a double-top ($2070/74) and pressure key monthly higher base at $1680 zone (also Fibo 38.2% of $1046/$2074 rally), loss of which would undermine a larger bullish structure on confirmation of a double-top pattern and reversal of the uptrend from $1046 (Dec 2015 low).
Negative daily techs and today’s massive bearish daily candle are expected to weigh heavily on near-term action, with $1800 level now acting as solid resistance.
Res: 1784; 1800; 1805; 1812
Sup: 1766; 1721; 1700; 1680
Gold Wave Analysis
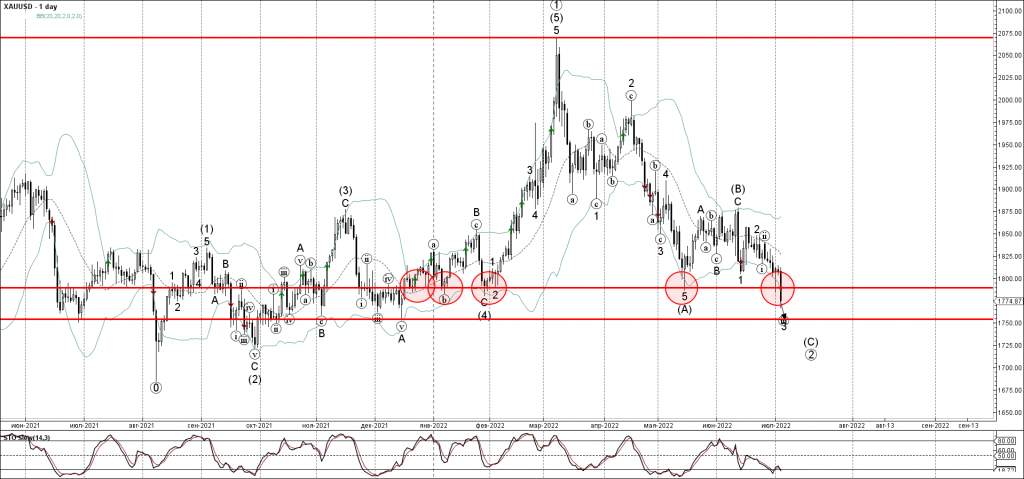
- Gold broke pivotal support level 1790.00
- Likely to fall to support level 1755.00
Gold is under strong bearish pressure after the price broke the pivotal support level 1790.00 (which has been repeatedly reversing the price from last December).
The breakout of the support level 1790.00 accelerated the active impulse waves (iii) and 3 – which belong to the higher-order impulse wave (C) from last month.
Gold can be expected to fall further toward the next support level 1755.00 (former monthly low from November and December, target for the completion of the active impulse wave 3).
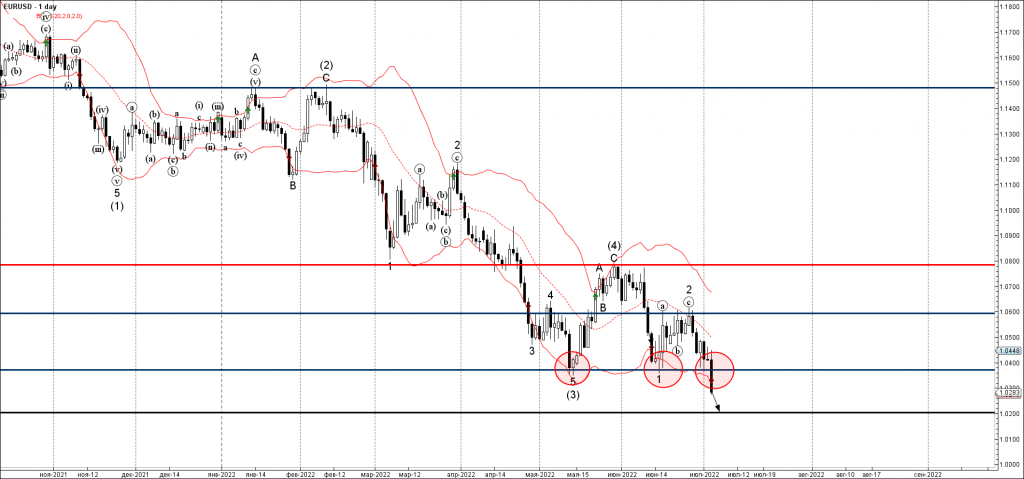
EURUSD Wave Analysis
- EURUSD broke multi-year support level 1.034
- Likely to fall to support level 1.020
EURUSD recently broke through the key support level 1.037 (which stopped the previous impulse waves (3) and 1, as can be seen below).
The breakout of the support level 1.037 led to the breakout of the major multi-year support level 1.034 from 2017.
Given the strong weekly and daily downtrend, EURUSD can be expected to fall further toward the next support level 1.020.
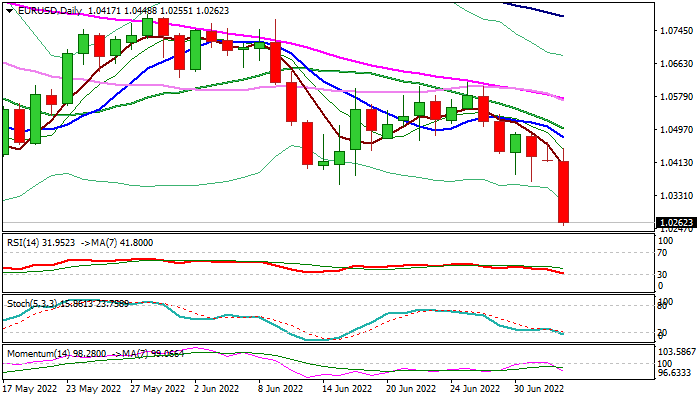
EUR/USD: Euro Slumps to 20-Year Low on Growing Recession Fears
The Euro collapsed through key support zone on Tuesday and hit the lowest in almost two decades, in the biggest daily fall since Jun 16, 2021.
Fresh weakness was sparked by renewed risk aversion on rising gas prices that fueled fears of recession, with data released today, showed that Eurozone business growth slowed significantly in June, adding to negative signals.
Strong demand for US dollar also contributed to Euro’s weakness.
Technical picture on all larger timeframes is firmly bearish and supports the price action, with close below key supports at 1.0358/49/40 (Jun 15/May 13/2017 lows) to generate strong bearish signal of continuation of larger downtrend from 1.6039 (2008 peak).
Bears eye next targets and pivotal supports at 1.0069/1.00 (Fibo 76.4% of 0.8225/1.6039/psychological, violation of which would risk sub-parity level extension and unmask Sep 2002 low (0.9607).
Price adjustments on profit-taking are expected to be limited and to provide better selling opportunities, with former key supports (1.0340/58 zone) reverting to strong resistances which should ideally cap, but extended upticks should not exceed falling daily Tenkan-sen (1.0435) to keep bears intact.
Res: 1.0298; 1.0340; 1.0358; 1.0435.
Sup: 1.0200; 1.0182; 1.0100; 1.0069.
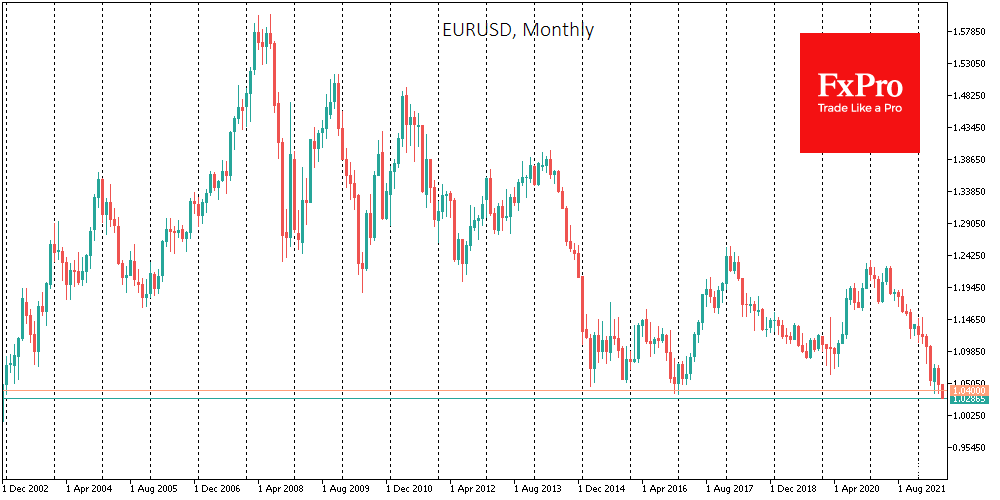
Euro Has Lost its Latest Deep-Pocketed Buyer
The single currency collapsed below 1.03 for the first time since December 2002. The 1.0350 area euro buyers have managed to defend three times in the last month and a half and at the end of 2016.
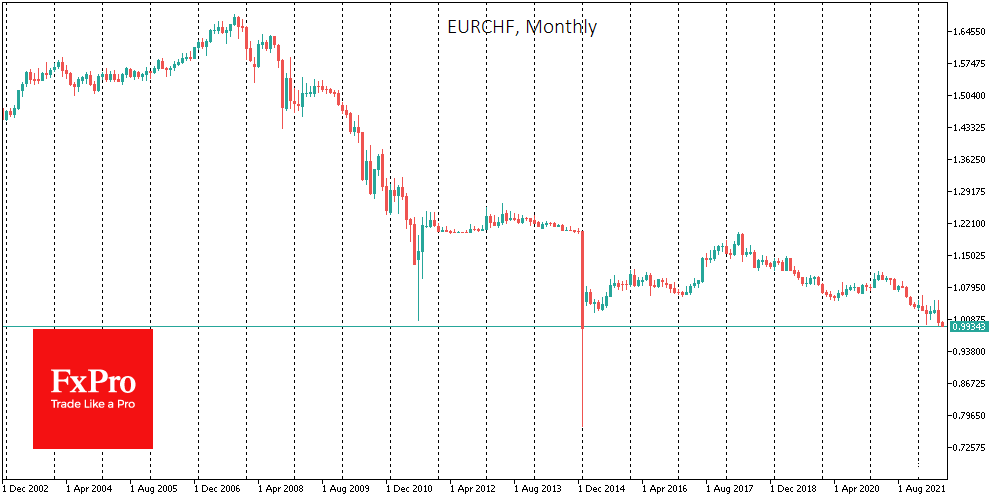
In our view, we should look for traces of the changed approach of the Swiss National Bank in that the euro has broken the dam. For the past seven years, the SNB has been active in the forex market as soon as the EURCHF weakening trend became sustained.
The SNB did not disclose any details, but in late February, it probably stopped the euro from falling below parity against the franc, at the end of last year, reversed it near 1.0370, and in March 2020, hedged it from declining below 1.05.
The rate hike last month was a public step in the fight against inflation, while the revision of the FX interventions policy was another covert turnaround by the SNB. Indeed, it would be naive to assume that the central bank would raise rates to fight inflation without abandoning the interventions that have protected Switzerland from deflation in previous years.
The SNB is thus no longer the last line of defence for the euro, leaving it alone with a melting trade balance and a widening gap between real and nominal interest rates.
And in this situation, euro buyers have nothing to cling to now other than expectations of weak US labour market data. The currency market may avoid a further sell-off in the euro until Friday’s statistics release. However, if it comes without unpleasant surprises, the next big stop for EURUSD could be around 0.99.