

Sample Category Title
USD/CHF Mid-Day Outlook
Daily Pivots: (S1) 0.9699; (P) 0.9724; (R1) 0.9766; More...
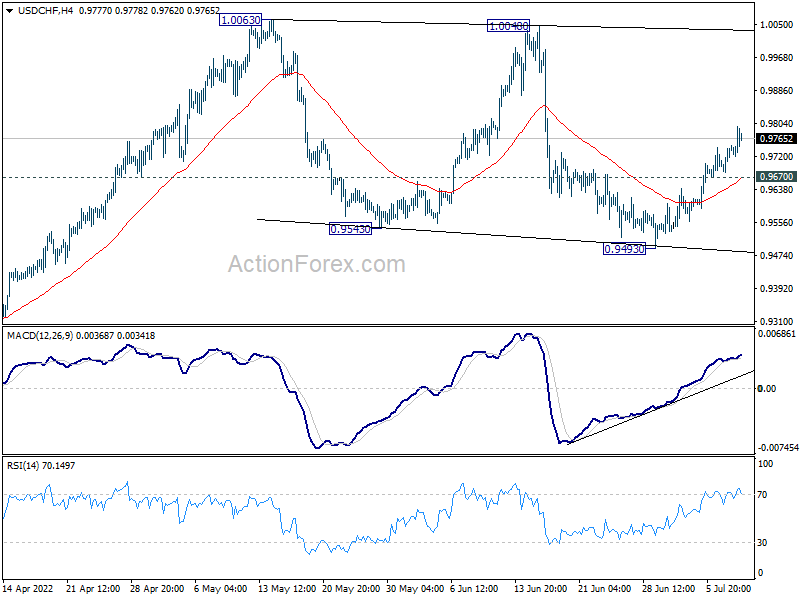
USD/CHF's break of 0.9731 resistance now suggests that consolidation pattern from 1.0063 has completed with three waves down to 0.9493. Intraday bias is back on the upside for retest 1.0063 high. Firm break there will resume larger up trend. On the downside, below 0.9670 minor support will dampen the bullish view and turn intraday bias neutral first.
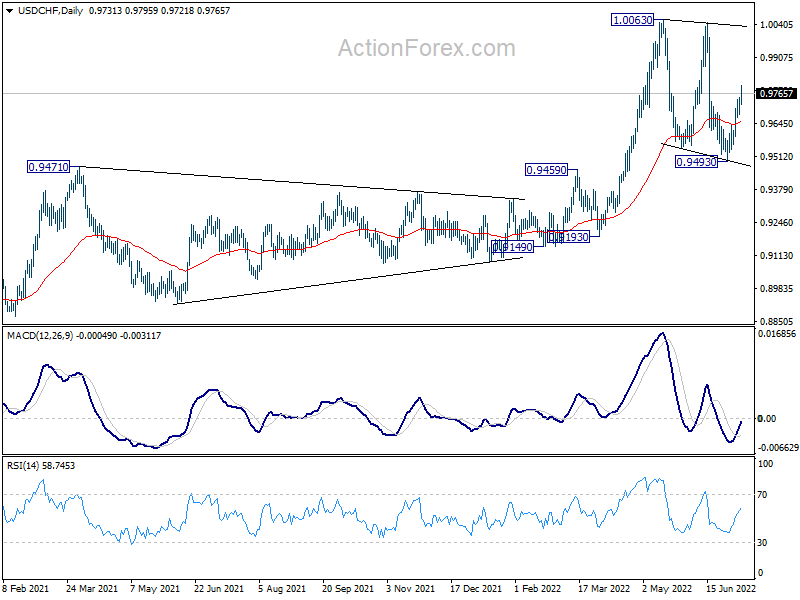
In the bigger picture, down trend from 1.0342 (2016 high) should have completed with three waves down to 0.8756 (2021 low) already. Rise from 0.8756 is likely a medium term up trend of its own. Next target is 1.0237/0342 resistance zone. This will remain the favored case as long as 0.9471 resistance turned support holds. However, sustained break of 0.9471 will extend long term range trading with another falling leg.
USD/JPY Mid-Day Outlook
Daily Pivots: (S1) 135.62; (P) 135.92; (R1) 136.29; More...
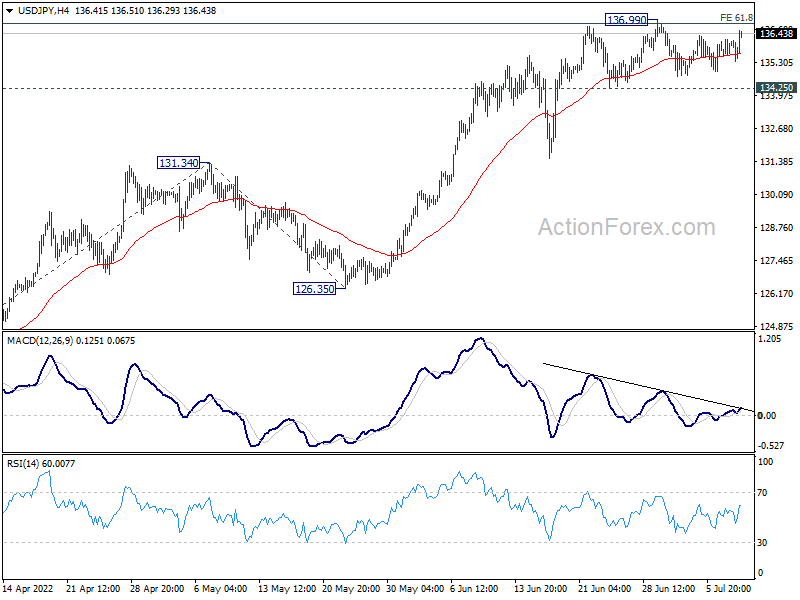
USD/JPY recovers but stays below 136.99 resistance. Intraday bias remains neutral first. On the upside, sustained break of 136.99 will resume larger up trend to 100% projection of 114.40 to 131.34 from 126.35 at 143.29. On the downside, however, break of 134.25 will turn bias to the downside for deeper pull back to 131.34 resistance turned support.
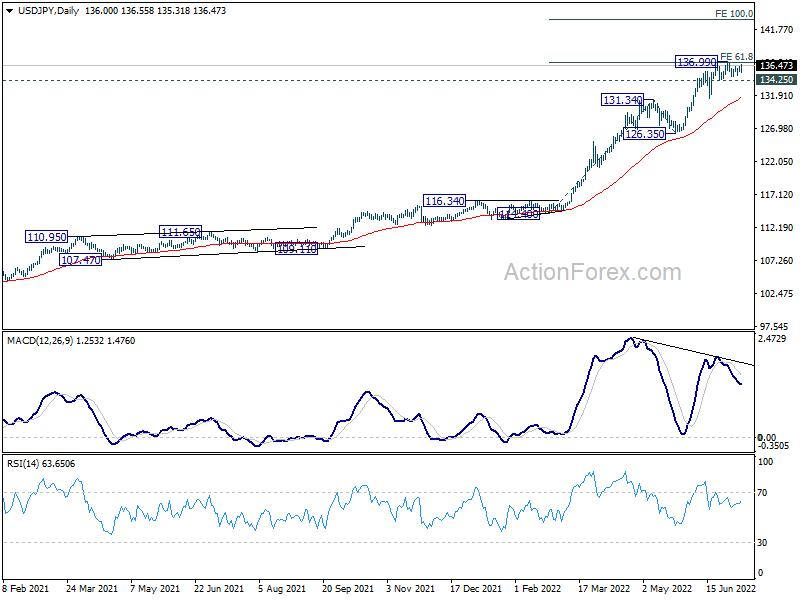
In the bigger picture, current rally is seen as part of the long term up trend from 75.56 (2011 low). Next target is 100% projection of 75.56 (2011 low) to 125.85 (2015 high) from 98.97 at 149.26, which is close to 147.68 (1998 high). This will remain the favored case as long as 126.35 support holds.
Dollar Rising Again on Strong NFP Data
Dollar rises in early US session after stronger than expected non-farm payroll data. It's also supported by extended rebound in 10-year yield, which reclaims 3%. Euro also follows German yield higher. On the other hand, Canadian Dollar turns softer after poor employment data. Yen is mixed after the tragic death of former Prime Minister Shinzo Abe.
In Europe, at the time of writing, FTSE is down -0.35%. DAX is up 0.65%. CAC is down -0.09%. Germany 10-year yield is up 0.033 at 1.298. Earlier in Asia, Nikkei rose 0.10%. Hong Kong HSI rose 0.38%. China Shanghai SSE dropped -0.25%. Singapore Strait Times rose 0.06%. Japan 10-year JGB yield dropped -0.0053 to 0.251.
US non-farm payroll grew 372k, unemployment rate unchanged at 3.6%
US non-farm payroll employment rose 372k in June, well above expectation of 250k. That's in line with the average monthly gain over the prior three months at 383k. Total non-farm employment was still down by 524k, or -0.3%, from pre-pandemic level in February 2020.
Unemployment rate was unchanged at 3.6%, matched expectations. Number of unemployed persons was essentially unchanged at 5.9m, comparing to prepandemic level at 5.7m in February 2020. Labor force participation rate ticked down form 62.3% to 62.2%.
Average hourly earnings rose 0.3% mom, matched expectations.
Canada employment dropped -43k, unemployment rate dropped to 4.9%
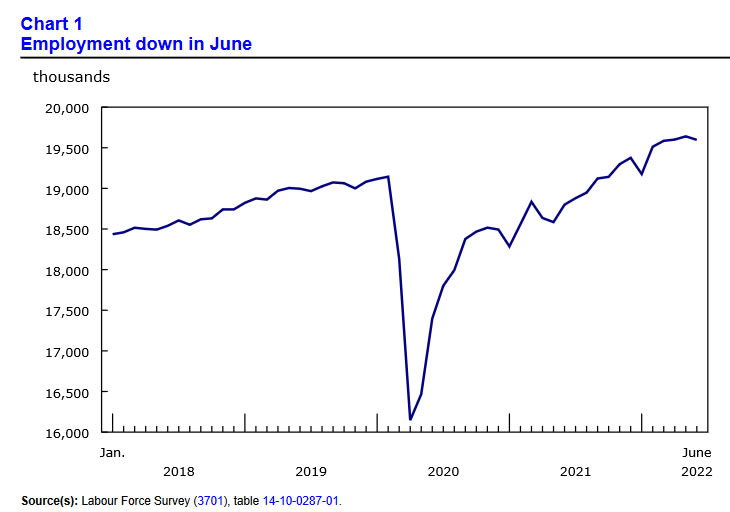
Canada employment dropped -43k, or -0.2% in June, much worse than expectation of 20k growth. Services-producing jobs dropped -76k while goods-producing jobs rose 33k.
Unemployment rate dropped from 5.1% to 4.9%, below expectation of 5.1%. Participation rate dropped -0.4% to 64.9%.
Total hours worked rose 1.3%. Average hourly waves rose 5.2% yoy.
USD/JPY Mid-Day Outlook
Daily Pivots: (S1) 135.62; (P) 135.92; (R1) 136.29; More...
USD/JPY recovers but stays below 136.99 resistance. Intraday bias remains neutral first. On the upside, sustained break of 136.99 will resume larger up trend to 100% projection of 114.40 to 131.34 from 126.35 at 143.29. On the downside, however, break of 134.25 will turn bias to the downside for deeper pull back to 131.34 resistance turned support.
In the bigger picture, current rally is seen as part of the long term up trend from 75.56 (2011 low). Next target is 100% projection of 75.56 (2011 low) to 125.85 (2015 high) from 98.97 at 149.26, which is close to 147.68 (1998 high). This will remain the favored case as long as 126.35 support holds.
Economic Indicators Update
| GMT | Ccy | Events | Actual | Forecast | Previous | Revised |
|---|---|---|---|---|---|---|
| 23:50 | JPY | Bank Lending Y/Y Jun | -0.50% | 0.90% | 0.70% | |
| 23:50 | JPY | Current Account (JPY) May | 0.01T | 0.16T | 0.51T | |
| 05:00 | JPY | Eco Watchers Survey: Current Jun | 52.9 | 55 | 54 | |
| 06:45 | EUR | France Trade Balance (EUR) May | -13.0B | -12.5B | -12.2B | -12.7B |
| 08:00 | EUR | Italy Industrial Output M/M May | -1.10% | -1.10% | 1.60% | 1.40% |
| 12:30 | CAD | Net Change in Employment Jun | -43.2K | 20.0K | 39.8K | |
| 12:30 | CAD | Unemployment Rate Jun | 4.90% | 5.10% | 5.10% | |
| 12:30 | USD | Nonfarm Payrolls Jun | 372K | 250K | 390K | 384K |
| 12:30 | USD | Unemployment Rate Jun | 3.60% | 3.60% | 3.60% | |
| 12:30 | USD | Average Hourly Earnings M/M Jun | 0.30% | 0.30% | 0.30% | 0.40% |
| 14:00 | USD | Wholesale Inventories May F | 2.00% | 2.00% |
Canada employment dropped -43k, unemployment rate dropped to 4.9%
Canada employment dropped -43k, or -0.2% in June, much worse than expectation of 20k growth. Services-producing jobs dropped -76k while goods-producing jobs rose 33k.
Unemployment rate dropped from 5.1% to 4.9%, below expectation of 5.1%. Participation rate dropped -0.4% to 64.9%.
Total hours worked rose 1.3%. Average hourly waves rose 5.2% yoy.
US non-farm payroll grew 372k, unemployment rate unchanged at 3.6%
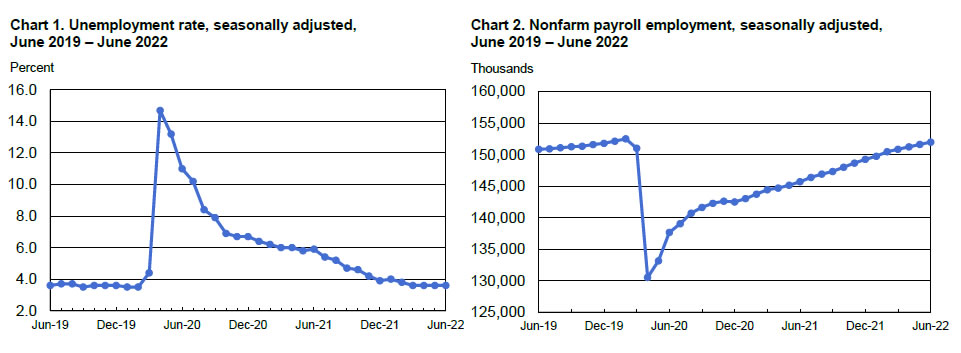
US non-farm payroll employment rose 372k in June, well above expectation of 250k. That's in line with the average monthly gain over the prior three months at 383k. Total non-farm employment was still down by 524k, or -0.3%, from pre-pandemic level in February 2020.
Unemployment rate was unchanged at 3.6%, matched expectations. Number of unemployed persons was essentially unchanged at 5.9m, comparing to prepandemic level at 5.7m in February 2020. Labor force participation rate ticked down form 62.3% to 62.2%.
Average hourly earnings rose 0.3% mom, matched expectations.
Euro Oversold, But Far from a Final Sell-off
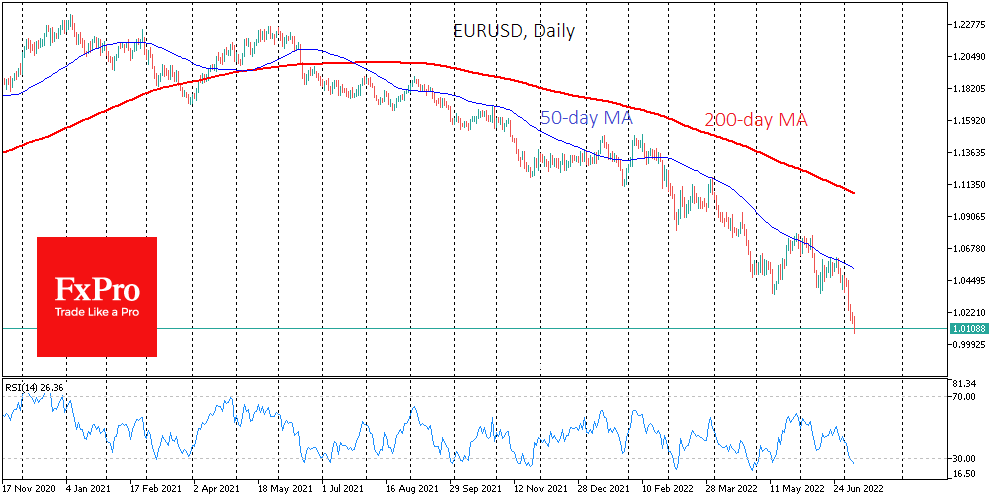
The single currency fell to 1.0071 in the early European session on Friday. For EURUSD, it is a new low since December 2002 and a continuation of the massive sell-off that started last Tuesday.
Looking solely at the technical picture, the pressure on the EURUSD intensified after touching the 50-day average last Monday – the informal resistance line for the previous 13 months. The pair has been selling after several touches of this line since late February.
The parity is in a couple of steps, and so far, it is difficult to find any reason why the Euro might not fall below this psychological level. Furthermore, although the weaker Euro is pro-inflationary, policymakers in the Eurozone may see it as a tool for boosting export competitiveness.
Although EURUSD is over-sold in the short term on the daily charts, the pair’s break away from the trend has not been anything out of the ordinary in recent months, suggesting a relatively orderly sell-off.
The RSI index has entered oversold territory at weekly and monthly intervals. Contrary to the indicator’s logic, historically, we have seen an acceleration of the sell-off and not the rebound.
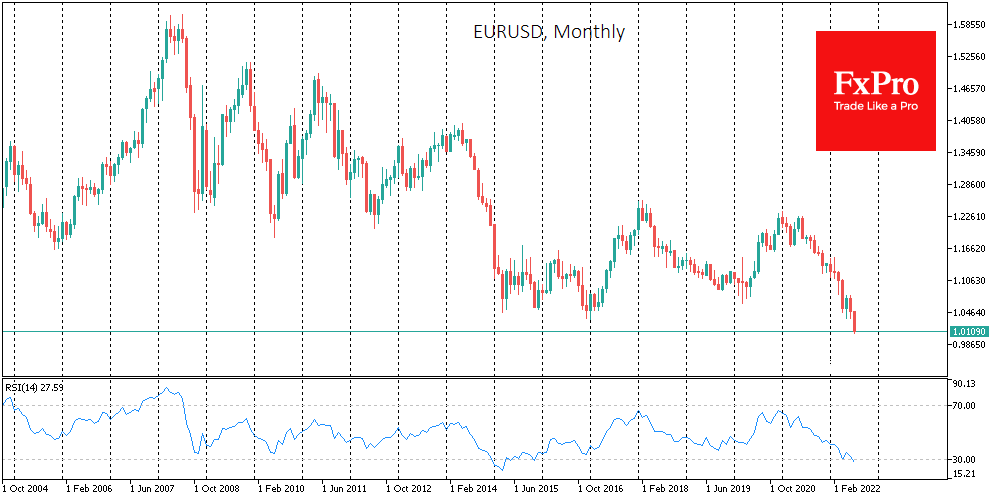
The Euro remains a falling knife, which is very dangerous to catch despite seeming oversold. The current strong trend is one of those cases where it is more prudent to wait for reliable signs of a reversal and not rush to “catch the bottom”.
EURUSD does not recover sharply from such devastating falls, as it is the most liquid pair, with tens of trillions of dollars in turnover. In 2000 and 2015, it took more than two years for the EURUSD to recover above levels where it fell into oversold territory on the RSI monthly charts in a month. A reliable signal, in this case, was the divergence of the price chart and the said index.
The following important stop for the EURUSD looks like the area of 0.97, where the pair might find itself before the end of the month. However, we should not be surprised if the decline continues up to 0.85-0.87 and lasts for another 2-4 quarters.
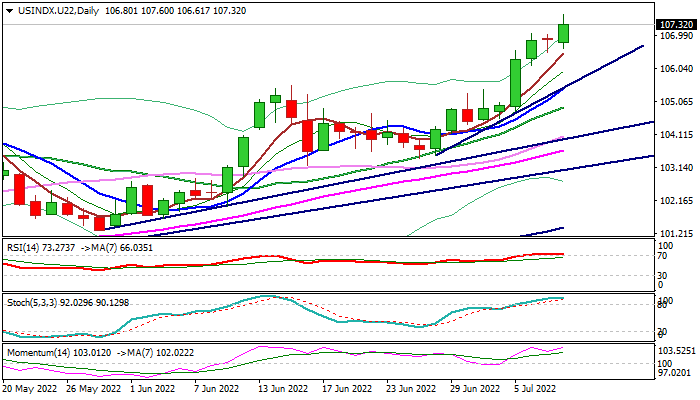
Dollar Index: Dollar Accelerates Higher, Eyes Fresh Support from US Job Report
The dollar index resumes a steep ascend after a brief pause on Thursday, boosted by strong safe-haven demand on economic and political uncertainty.
The index hit new highest since Oct 2002 and eyes pivotal Fibo barrier at 109.14 (76.4% of 121.02/70.69, 2001/2008 fall).
Close above this level would generate fresh bullish signal for acceleration through psychological 110 barrier.
The dollar index is on track for the biggest weekly rally since mid-June 2021 that adds to positive signals, although studies on all larger timeframes are overbought and warn of adjustment in the near future.
Traders focus US jobs report which is likely to add to Fed’s argument for more hawkish approach in policy tightening, as unemployment is expected to remain low, pointing to tight conditions in job market, while expected drop in hiring is seen as temporary phenomenon, driven by seasonal factors and so far not so harmful for overall positive picture.
Res: 107.60; 108.74; 109.14; 110.00.
Sup: 106.58; 105.54; 104.56; 103.96.
XAU/USD: Bears Taking a Breather but Gold On Track for the Fourth Straight Weekly Drop
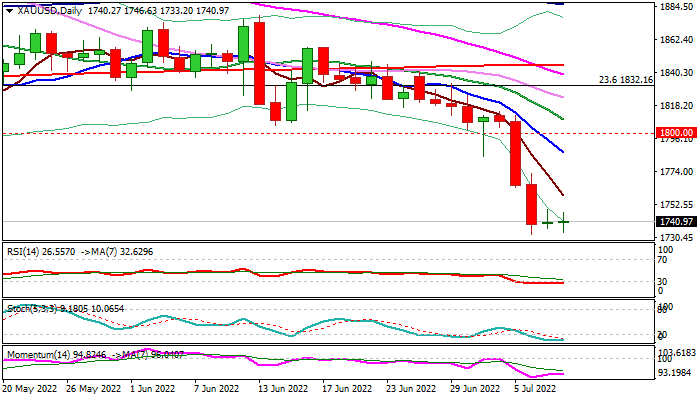
Spot gold stands at the back foot on Friday and holding in extended consolidation above new multi-month low ($1732) but holding bearish bias.
The metal is on track for the fourth consecutive weekly drop, with this week’s fall being the biggest since the second week of June 2021.
Gold came under increased pressure on growing expectations that the US Federal Reserve will remain aggressive in policy tightening in continuing efforts to put soaring inflation under control.
The dollar benefited from these expectations, along with increased safe haven demand on uncertainty and signals that the US economy is heading into recession.
US jobs data are in focus today and expected to show solid condition of the labor market that would add to Fed’s argument for another 0.75% rate hike in the central bank’s July policy meeting.
In addition, US inflation data are due next week and likely to show further rise that would additionally support Fed’s hawkishness and add to negative outlook for the yellow metal.
Bearish daily technical studies contribute to the action, although oversold conditions suggest bears may take a breather for consolidation / correction, before resuming.
Upticks should stay below resistances at $1786/$1800 (falling 10DMA / former low of May 16 / psychological) to keep larger bears intact.
Res: 1749; 1758; 1772; 1786.
Sup: 1732; 1721; 1700; 1680.
Post-Boris Era in the UK Means a Lot for GBP
“I want you to know how sad I am to be giving up the best job in the world,” – Boris Johnson said in front of the paparazzi and his colleagues before leaving the UK Prime Minister chair. He held the post for three years after Theresa May left in 2019 due to Brexit contradictions. Changes of such scale aren’t often seen in Europe, so it’s wise to break the situation down.
Why did Boris Johnson leave the post?
It all started with a no-confidence vote at the beginning of June. The UK Conservative party (Tory) criticized Johnson’s job for “perceived incompetency as a leader,” beginning the most significant turmoil in the newest history of Britain. Also, Johnson had a party during Covid-19 pandemic, which was totally unacceptable for a Prime Minister.
If Tory had been successful, Boris would have left much earlier. Here’s how the process works:
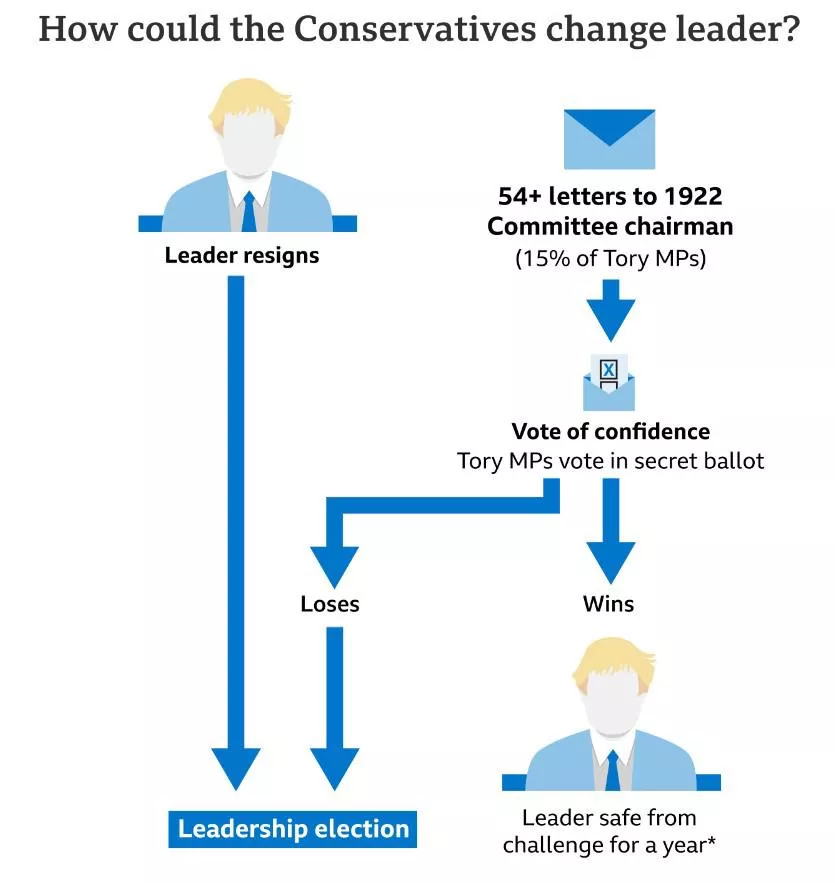
Source: BBC
However, Mr. Johnson received the support of 211 out of 359 members of the House of Commons (lower chamber of the UK parliament). The result means 59% of his members (MPs) supported Mr. Johnson.
The story doesn’t end here, though. Another round of problems for Boris started as he hired Chris Pincher as a deputy coordinator of the parliamentary faction. Earlier, Pinches was accused of sexual harassment, and Johnson knew it.
After the Chris designation, a 24-hour period of political turbulence began. Over 40 government resignations happened before Johnson decided to give up and leave the chair of Premier Minister. The general public supported the decision: Twitter is filled with cheers and glees ahead of the next PM election in autumn.
Mr. Boris and Tory in a nutshell
Boris Johnson was the UK Prime Minister and head of the conservative party for three years. The Tories, in turn, are the leading party in the UK, with the Liberal Democrats as the main rival. Usually, elections in the UK need to happen no more than five years apart. Unless an earlier one is called, the next election isn’t due until January 2025.
Boris Johnson could call an early election if he wanted (the law permits this), but now Mr. Johnson has resigned. After the conservative party chooses a new leader, he (or she) can call an early election if he (or she) wishes.
The pound feels sailed off on the news
Pound Sterling is rallying at the time of writing, although it is hard to ascertain just how much of the move is linked to the domestic political news or the broadly supportive global market.
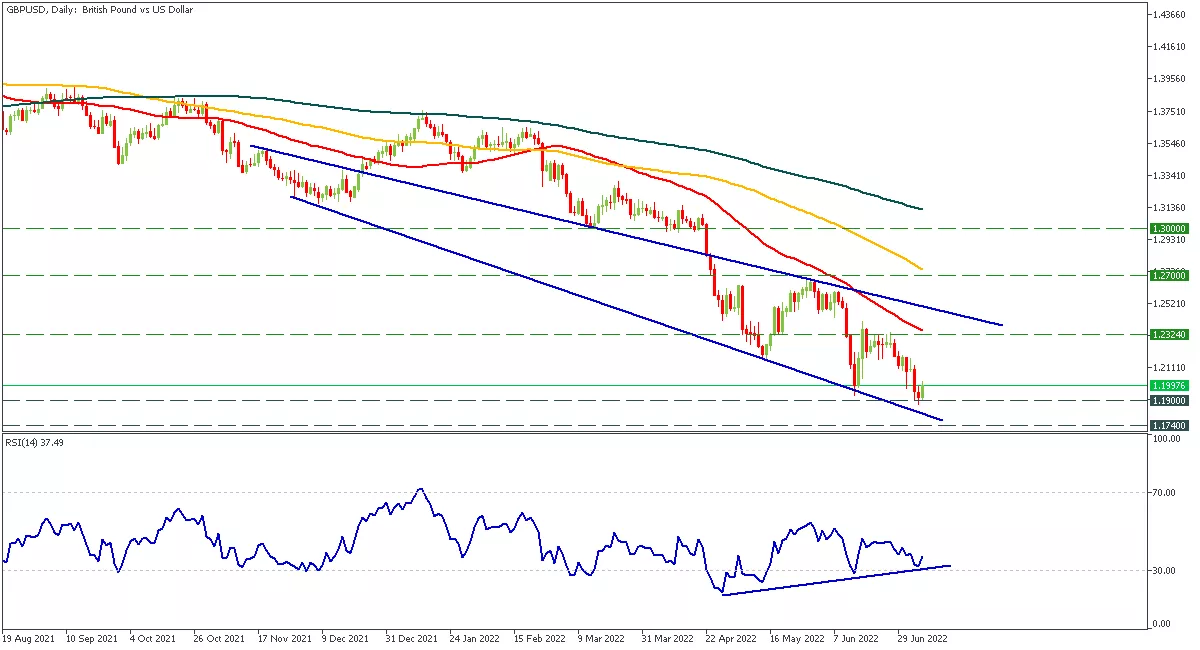
The pair made a double divergence on the RSI. Also, we are close to the support trendline. Our outlook on the British pound is bullish. The currency may rise to the 1.2324 resistance. Also, it may soar higher if the next PM chair candidate is met with glee from the market participants.
GBPUSD daily chart
- Resistance: 1.2324, 1.2700, 1.3000
- Support: 1.1900, 1.1740
Bitcoin Benefiting from Gains in Equities
Bitcoin gained 6% on Thursday, ending the day around $21,600 and developing gains on Friday to $22,400, pulling back to 21,800 (+7.2% in 24 hours) at the time of writing. Ethereum added 6.5% to $1240, while other leading altcoins gained between 1.9% (BNB) and 3.2% (Solana).
Total crypto market capitalisation, according to CoinMarketCap, rose 5% overnight to $962bn. The Cryptocurrency Fear and Greed Index was up 2 points to 20 by Friday and remains in “extreme fear” mode.
As we can see, the first and second cryptocurrencies outperform the rest of the market, indicating a recovery in demand among professional investors following the strengthening of stock indices.
Since the beginning of the month, BTCUSD has gained more than 17%, which looks like an impressive result but only at first glance. The thing is, bitcoin was driven as low as possible by the end of June, and the current remarkable rise is just a recovery to the levels of 3 weeks ago.
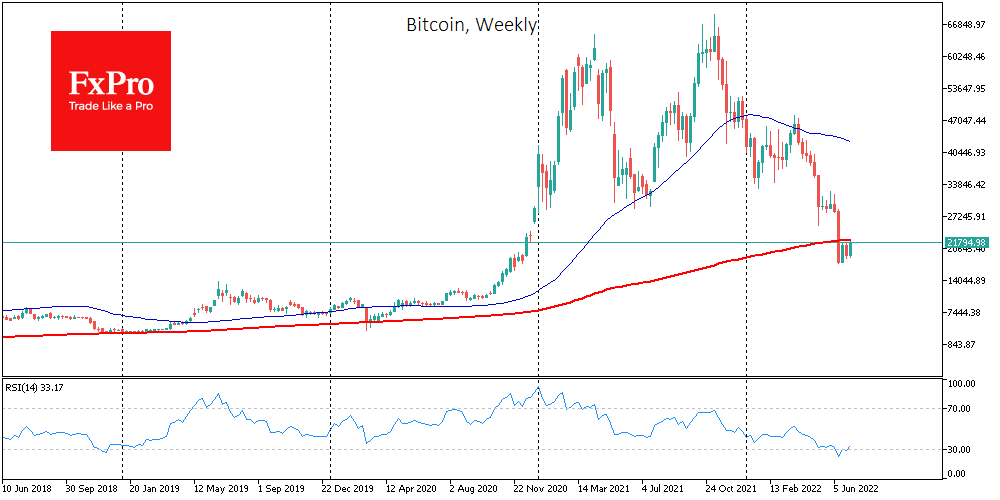
BTCUSD is still below its 200-week average and sold off again today on its approaches, indicating a significant supply overhang from sellers.
Bloomberg believes the crypto market has bottomed out, and BTC will resume its offensive in the next six months.
According to Bank of America, the number of active cryptocurrency users is down more than 50% from its peak in November last year. At the same time, consumer interest in digital assets remains at a reasonably high level.
A US investor has filed a class-action lawsuit in California court against Solana and its partners, accusing them of illegally profiting from selling SOL tokens as a security.
The developers of Ethereum continue to test the transition to the Proof-of-Stake consensus algorithm. They announced the successful migration of the Sepolia test network to PoS.
The developers of Shiba Inu reported on the current state of development of new ecosystem components and announced the launch of its stablecoin.