

Sample Category Title
USD/CAD Weekly Outlook
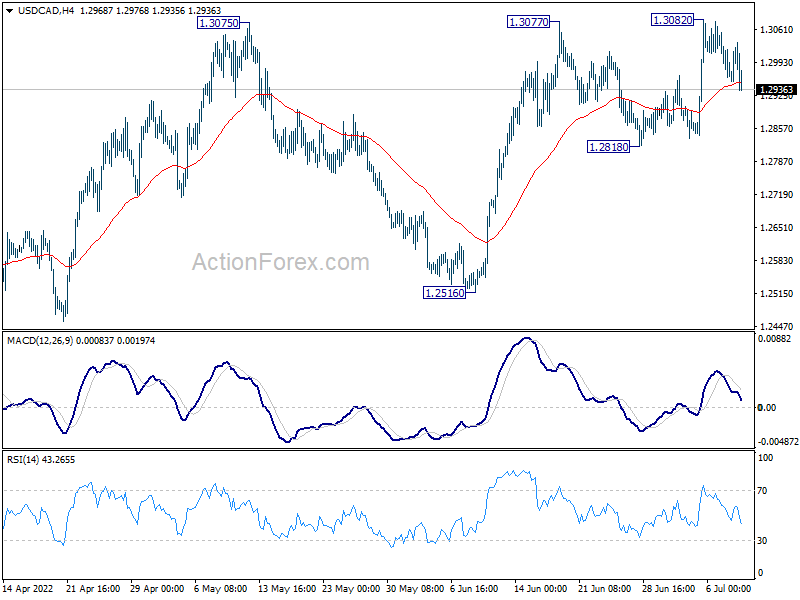
USD/CAD edged higher to 1.3082 last week but retreated since then. Initial bias stays neutral this week first. Further rise is mildly in favor with 1.2818 support intact. On the upside, break of 1.3082 and sustained trading above 1.3022 fibonacci level will carry larger bullish implications, and bring up trend resumption. Next target is 100% projection of 1.2005 to 1.2947 from 1.2401 at 1.3343. On the downside, break of 1.2818 minor support will bring deeper fall back to 1.2516 support instead.
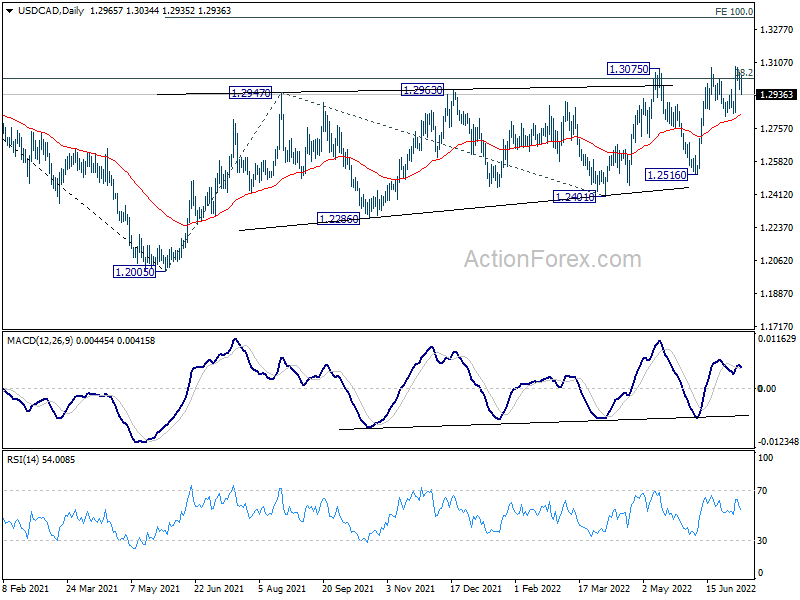
In the bigger picture, focus stays on 38.2% retracement of 1.4667 (2020 high) to 1.2005 (2021 low) at 1.3022. Sustained break there should confirm that the down trend from 1.4667 has completed after defending 1.2061 long term cluster support. Further rise would then be seen towards 61.8% retracement at 1.3650. However, rejection by 1.3022 will maintain medium term bearishness.
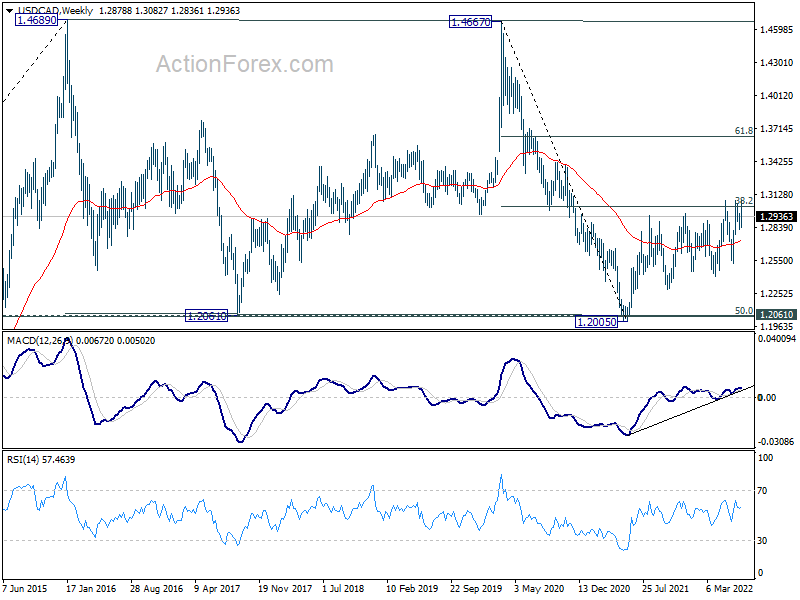
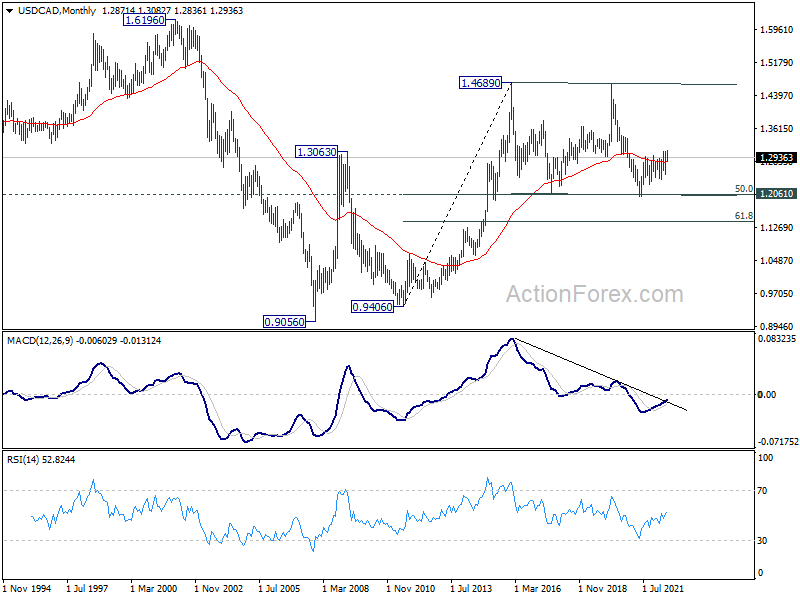
In the longer term picture, price actions from 1.4689 (2016 high) are seen as a consolidation pattern only. That is, up trend from 0.9506 (2007 low) is still expected to resume at a later stage. This will remain the favored case as long as 1.2061 support holds, which is close to 50% retracement of 0.9406 to 1.4689 at 1.2048. However, firm break of 1.2061 support will argue that USD/CAD has already started a long term down trend. Next target is 61.8% retracement of 0.9406 to 1.4689 at 1.1424.
GBP/JPY Weekly Outlook
GBP/JPY dropped to 160.37 last week but recovered. Initial bias is neutral this week first. On the downside, below 160.37 support will target 155.57 key support level next. On the upside, above 165.26 minor resistance will turn bias back to the upside and bring retest of 168.67 high instead.
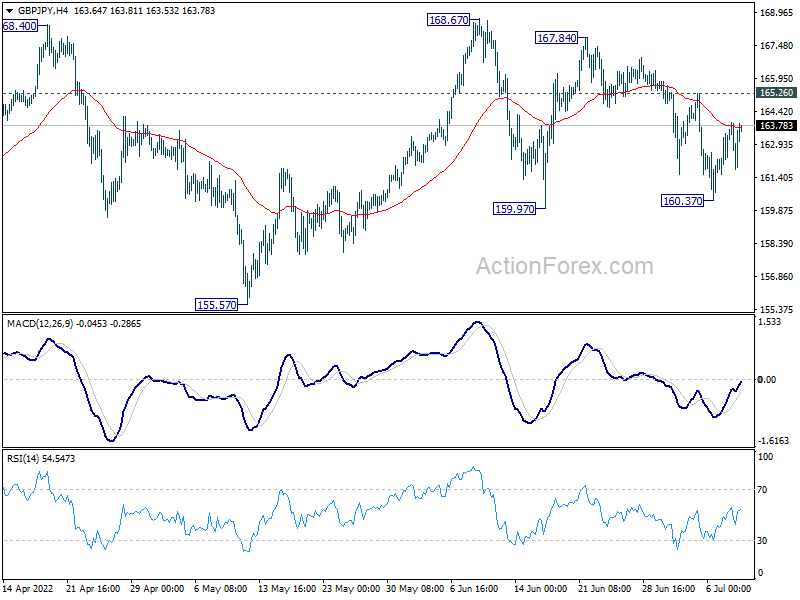
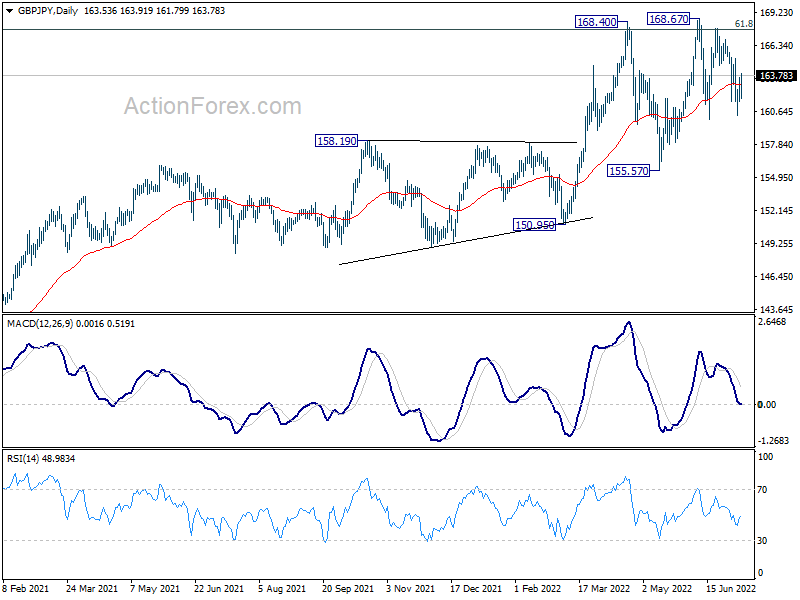
In the bigger picture, up trend from 123.94 (2020 low) is still in progress. Sustained break of 61.8% retracement of 195.86 (2015 high) to 122.75 (2016 low) at 167.93 will be a long term bullish signal, and could pave the way back to 195.86 high. This will now remain the favored case as long as 155.57 support holds, even in case of deep pull back.
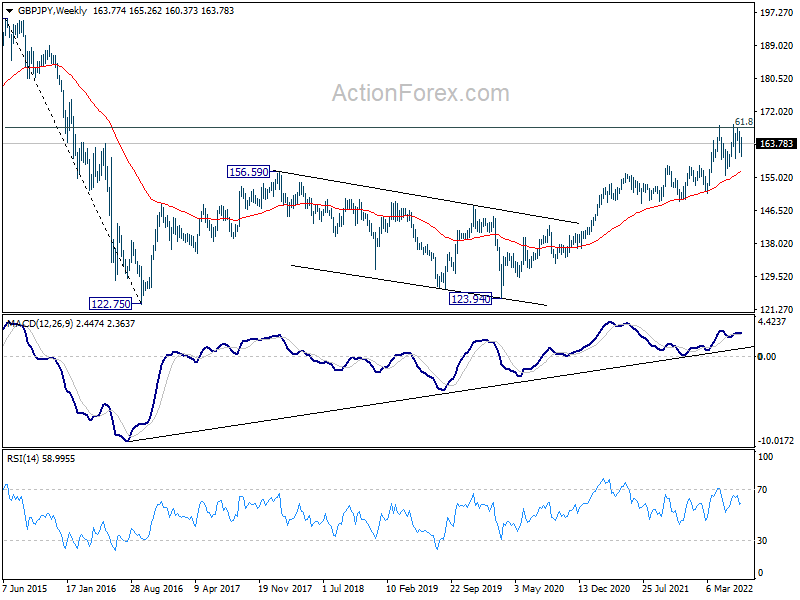
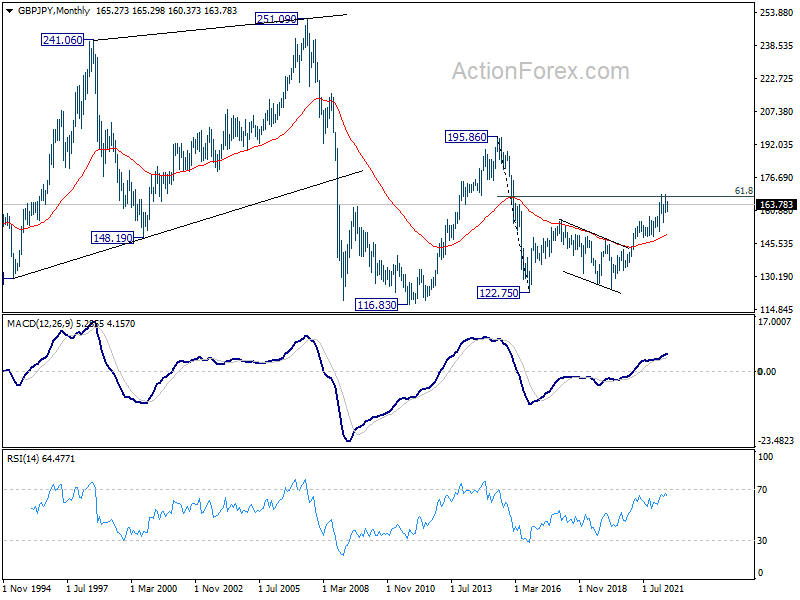
In the longer term picture, rise from 122.75 could be the third leg the the pattern from 116.83 (2011 low). Further rise will remain in favor as long as 55 month EMA (now at 149.84) holds. Sustained break of 61.8% retracement of 195.86 to 122.75 at 167.93. will pave the way to 195.86 (2015 high).
EUR/JPY Weekly Outlook
EUR/JPY dropped sharply to as low as 136.85 last week but recovered since then. Initial bias is neutral this week first. On the downside, below 136.86 will target 132.63 support. Decisive break will turn outlook bearish for 124.37 support. On the upside, above 139.78 minor resistance will turn bias to the upside for stronger recovery.
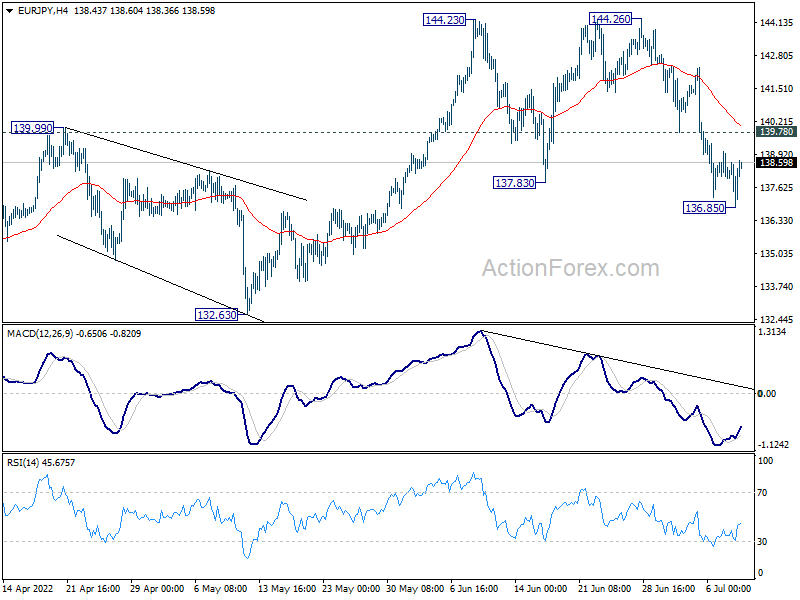
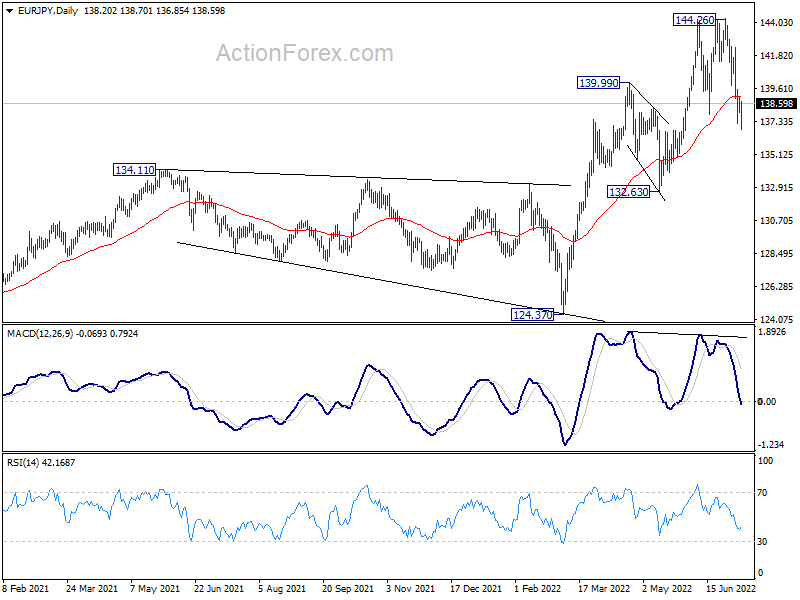
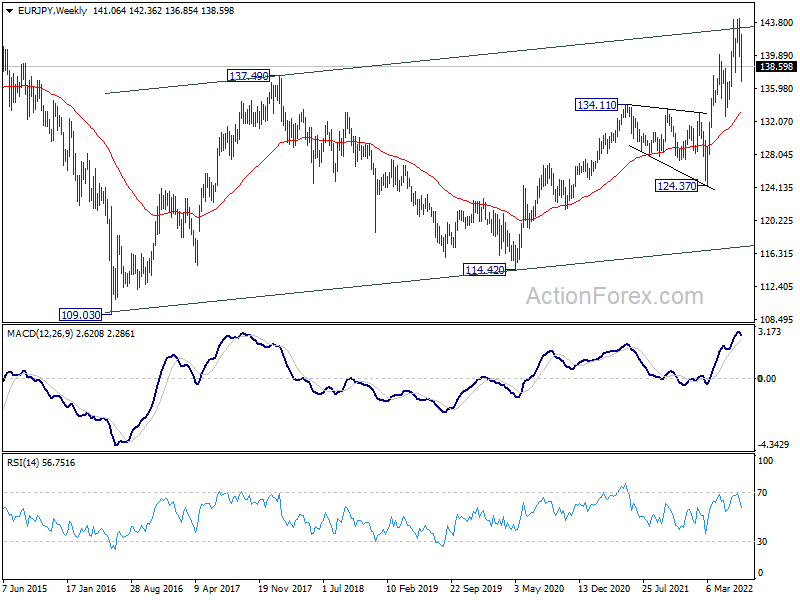
In the bigger picture, up trend from 114.42 (2020 low) is seen as the third leg of the pattern from 109.30 (2016 low). Further rally is in favor as long as 134.11 resistance turned support holds, even in case of deep pull back. Firm break of 139.78 will target 149.76 (2015 high. However, sustained break of 134.11 will be a sign of medium term bearish reversal and turn focus to 124.37 support for confirmation.
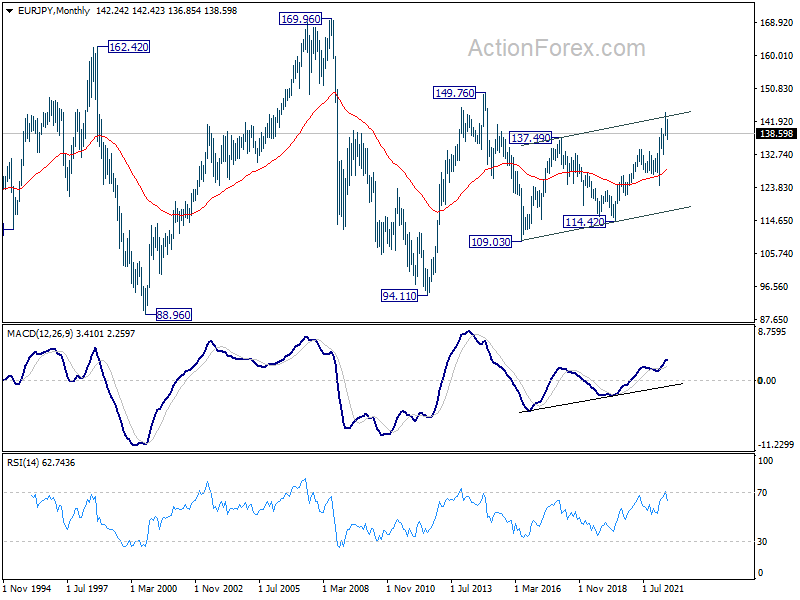
In the long term picture, current rally could be resuming whole rise from 94.11 (2012 low). Further rally would be seen to 149.76 resistance (2014 high) and above. This will remain the favored case as long as 134.11 resistance turned support holds.
EUR/GBP Weekly Outlook
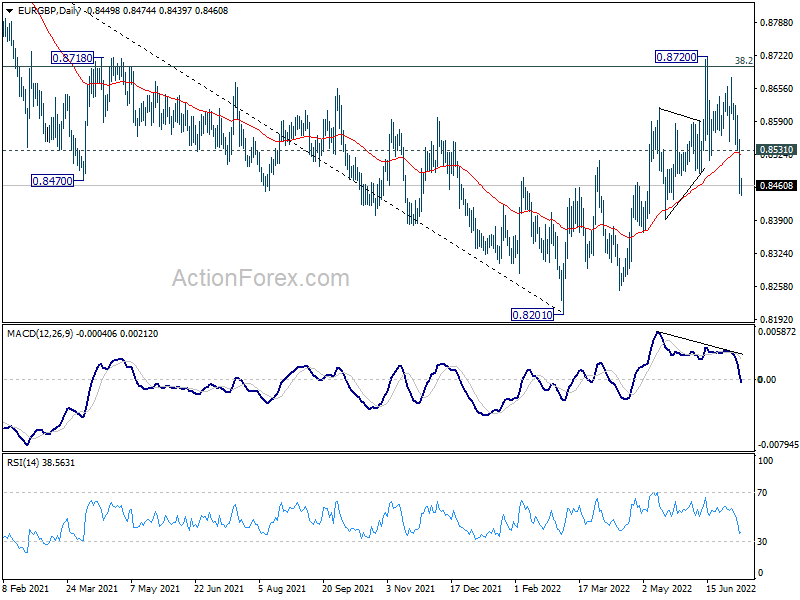
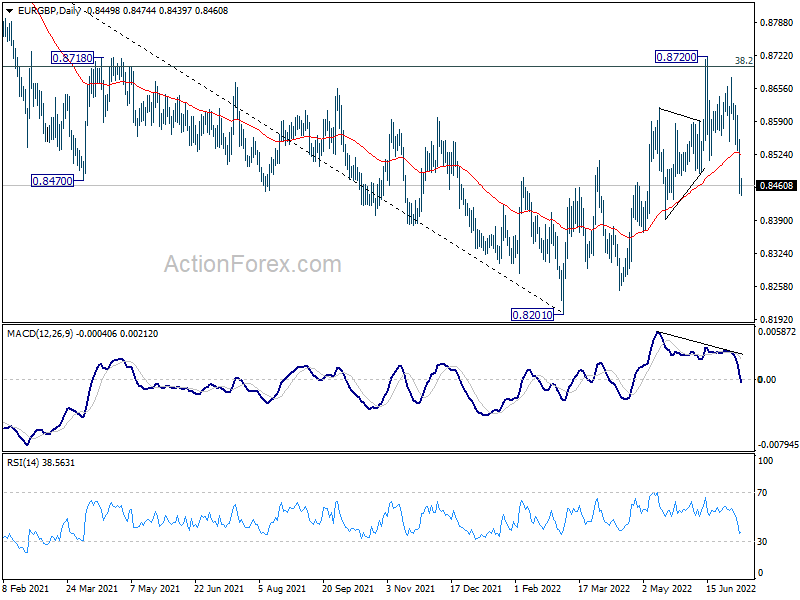
EUR/GBP's steep decline last week argues that rebound from 0.8201 has completed at 0.8720 already, after rejection by 0.8697 medium term fibonacci level. The development maintains medium term bearishness. Initial bias stays on the downside this week for retesting 0.8201/48 support zone next. On the upside, above 0.8531 minor resistance will turn intraday bias neutral first.
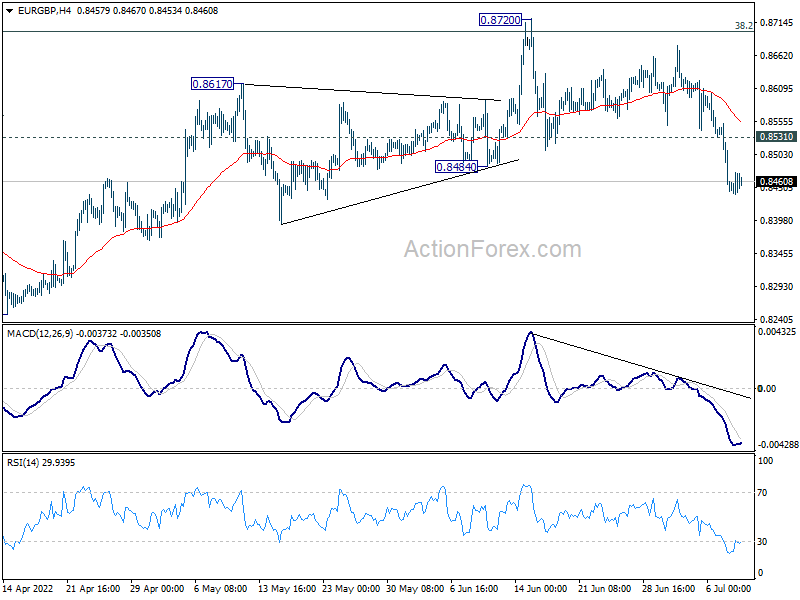
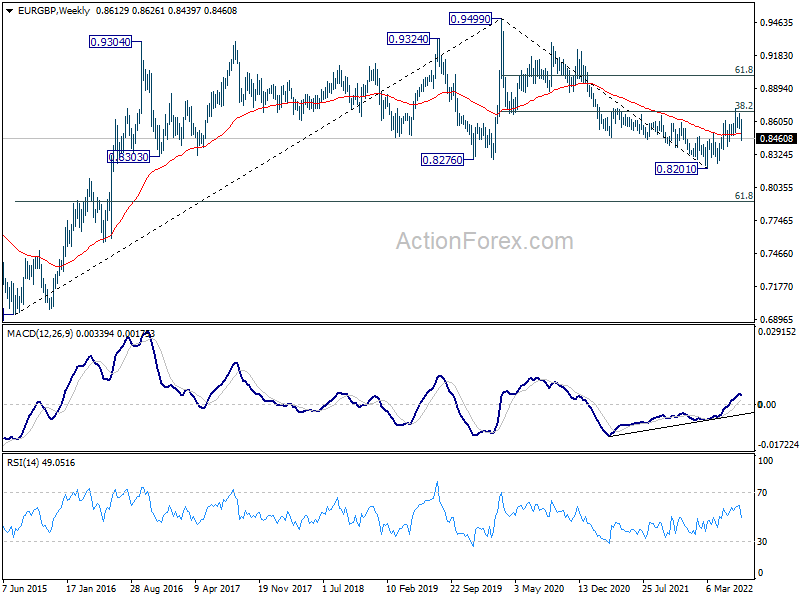
In the bigger picture, rejection by 38.2% retracement of 0.9499 to 0.8201 at 0.8697 argues that rebound from 0.8201 is merely a corrective move. That is, down trend from 0.9499 (2020 high) is now over. Sustained break of 0.8201 will resume such decline and target 61.8% retracement of 0.6935 to 0.9499 at 0.7917. This will now remain the favored case as long as 0.8720 resistance holds.
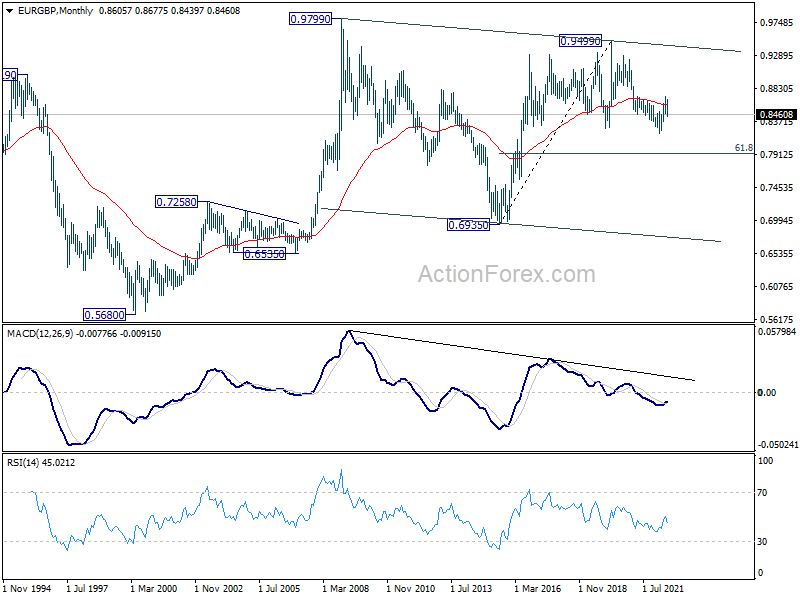
In the long term picture, the lack of medium term downside momentum suggests that fall from 0.9499 (2020 high) is merely a correction to rise from 0.6935 (2015 high). In case of another fall, downside should be contained by 61.8% retracement of 0.6935 to 0.9499 at 0.7917 to bring rebound. Sustained trading above 55 month EMA (now at 0.8604) will indicate that the correction has completed and bring retest of 0.9499.
EUR/AUD Weekly Outlook
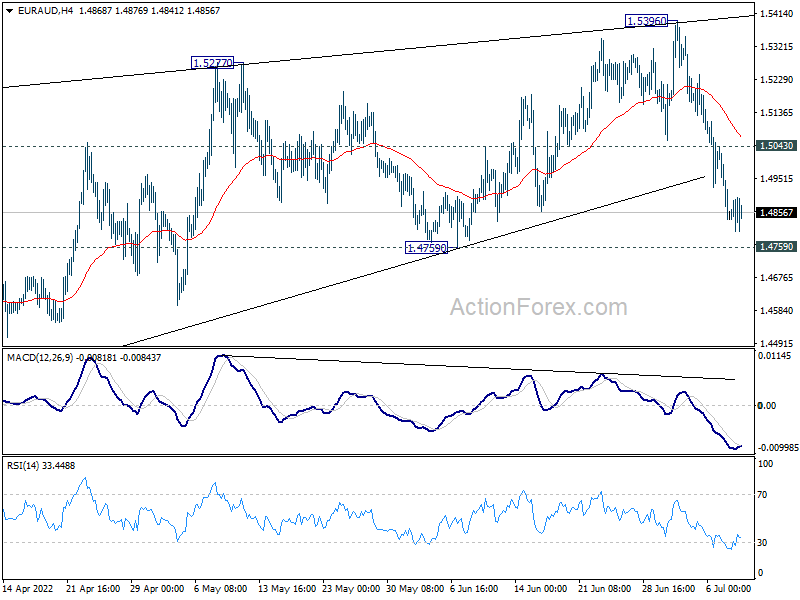
EUR/AUD's steep decline last week suggests that rebound from 1.4318 has completed as a corrective move to 1.5396, after rejection by 1.5354 resistance turned support. Initial bias stays on the downside this week for 1.4759 support first. Sustained break there will affirm this bearish case and bring retest of 1.4318 low. On the upside, above 1.5043 minor resistance will turn intraday bias neutral first.
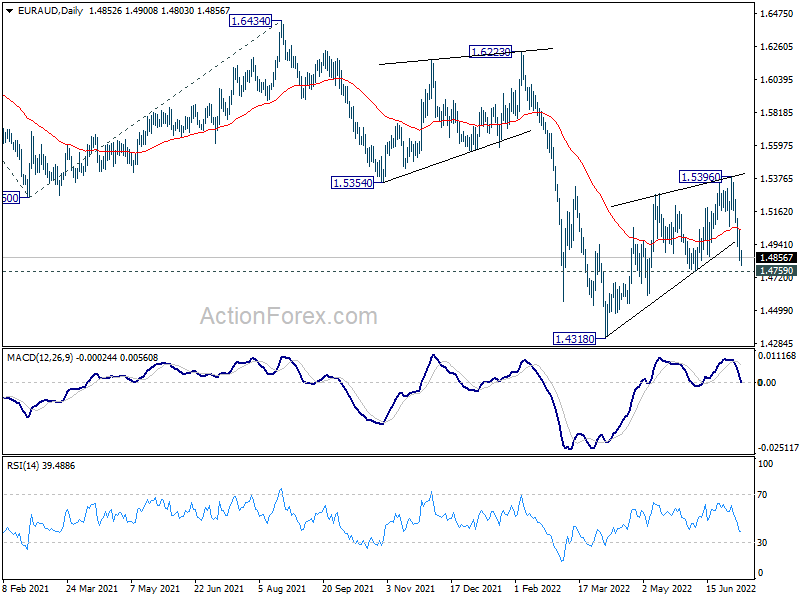
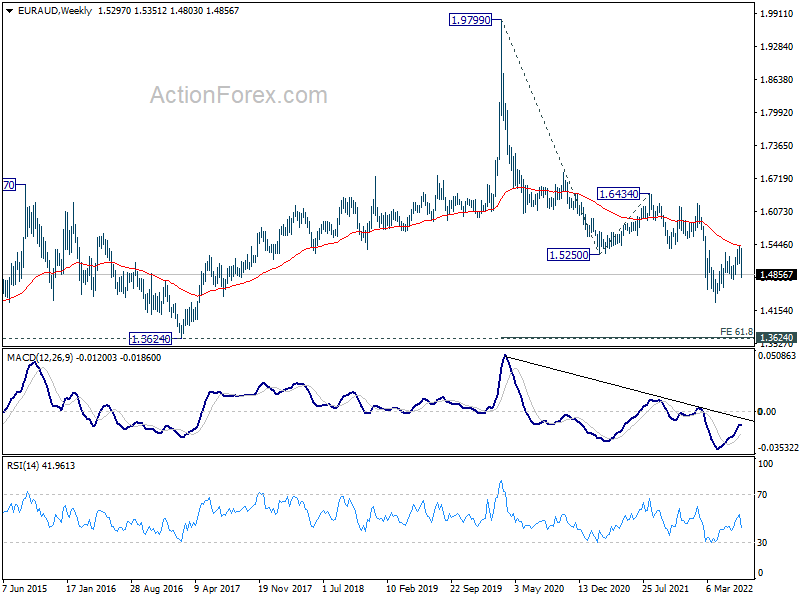
In the bigger picture, rejection by 1.5354 support turned resistance, as well as 55 week EMA (now at 1.5398), maintain medium term bearishness. That is, larger down trend from 1.9799 is not completed yet. Break of 1.4318 low will target 61.8% projection of 1.9799 to 1.5250 from 1.6434 at 1.3623, which is close to 1.3624 long term support (2017 low). This will remain the favored case now as long as 1.5396 resistance holds.
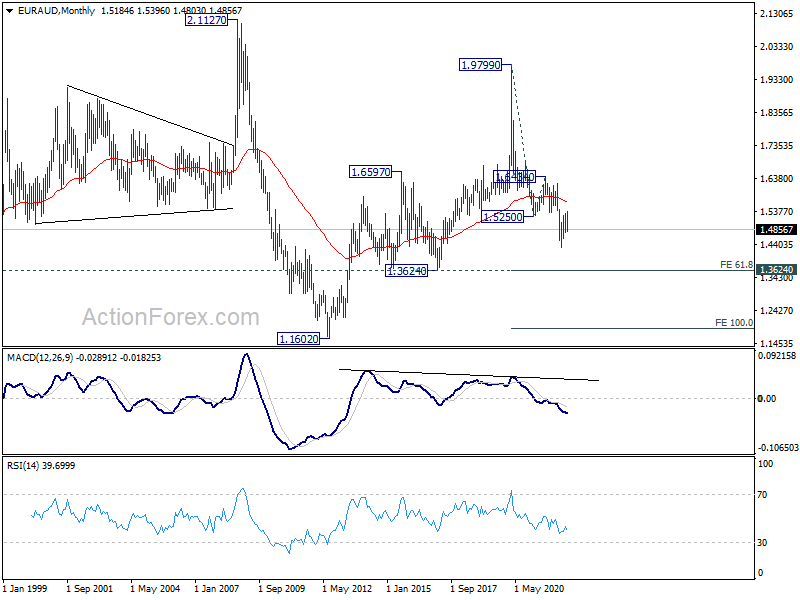
In the longer term picture, fall from 1.9799 (2020 high) is seen as the third leg of the pattern from 2.1127 (2008 high). Deeper fall should be seen to 1.3624 support. Decisive break there would pave the way back to 1.1602 (2012 low). This will remain the favored case as long as 55 month EMA (now at 1.5694) holds.
EUR/CHF Weekly Outlook
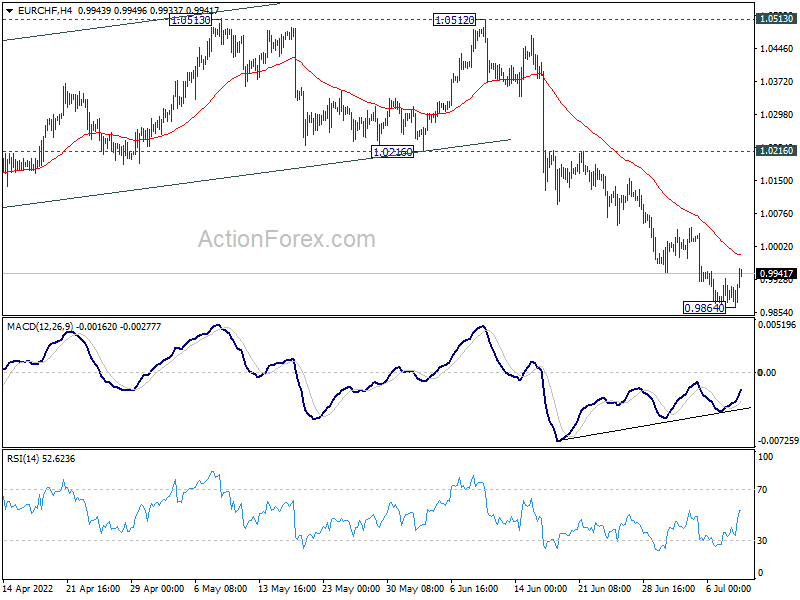
EUR/CHF's down trend continued last week and hit as low as 0.9864. But a temporary low was formed with subsequent recovery. Initial bias is neutral this week for some consolidations first. Upside of recovery should be limited well below 1.0216 support turned resistance to bring another fall. Below 0.9864 will target 0.9650 long term projection level.
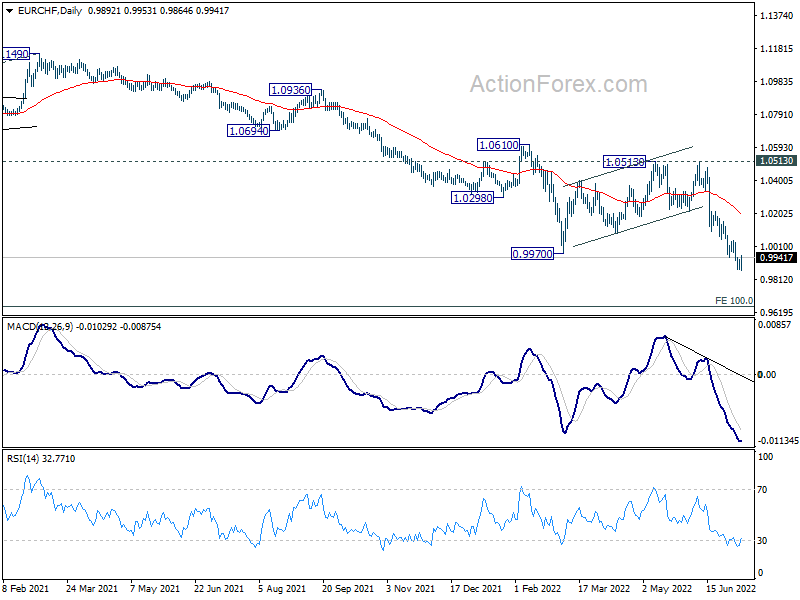
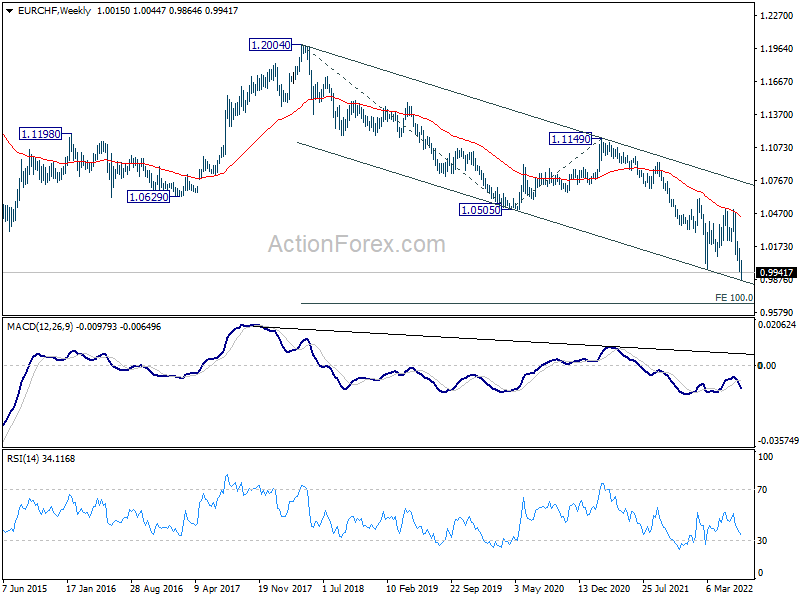
In the bigger picture, rejection by 55 week EMA affirmed medium term bearishness. Long term down trend from 1.2004 (2018 high) is expected to target 100% projection of 1.2004 to 1.0505 to 1.1149 at 0.9650. On the upside, break of 1.0513 resistance is needed to indicate medium term bottoming. Otherwise, outlook will stay bearish in case of strong rebound.
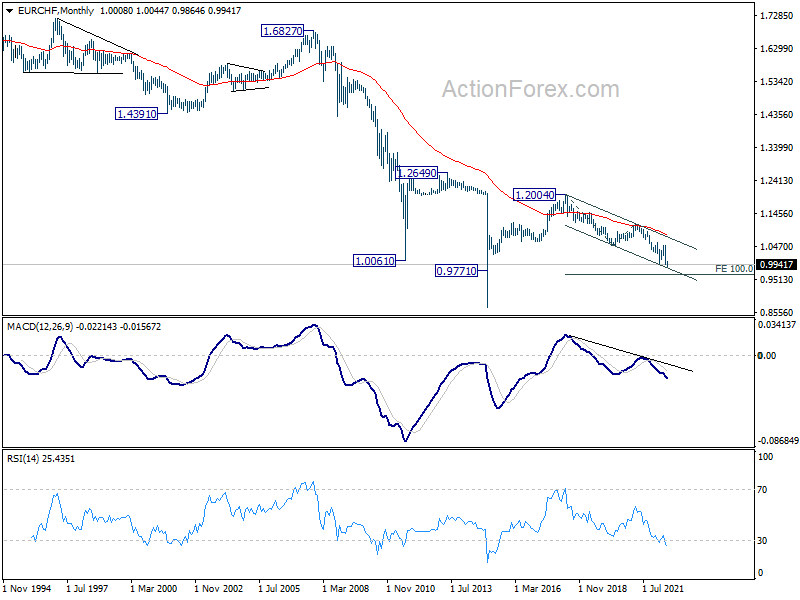
In the long term picture, capped below 55 month EMA, EUR/CHF is seen as extending the multi-decade down trend. There is no prospect of a bullish reversal until some sustained trading above the 55 month EMA (now at 1.0808).
Euro Down on Recession Worries, Could Parity Against Dollar Provide Support for Long?
Euro ended as the worst performer last week on increasing worries of a deeper and longer recession. Selloff in the common currency also dragged down Swiss Franc, which ended as the second worst.
Sterling was originally pressured by stabilized after UK Prime Minister Boris Johnson announced to step down after another scandal. But Yen was even weaker because of rebound in US benchmark yield. The tragic death of former Japanese Prime Minister Shinzo Abe was mourned, but hasn't affected the markets.
On the other hand, Dollar surged around the broad, with help from solid economic data. But Aussie was slightly stronger while Kiwi was not too far away. Canadian Dollar ended mixed.
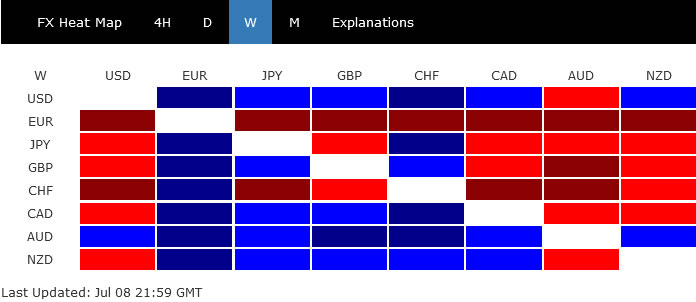
Euro in broad based selloff, EUR/USD approaches parity
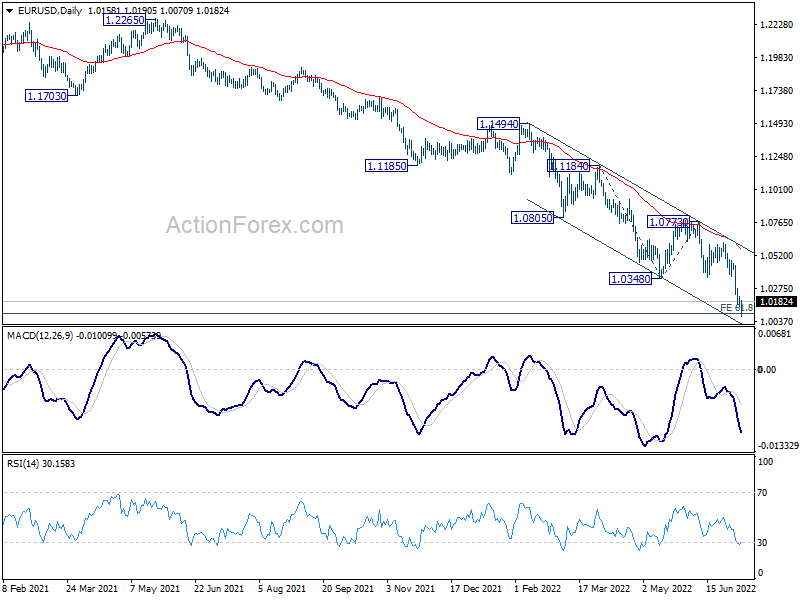
Euro's broad-based decline resumed last week and and marched towards parity against Dollar. The trigger was the renewed selloff was gas and energy crisis on the prolonged invasion of Russia to Ukraine. Europe is facing the risk of longer and deeper recession than other major economies.
The gloomy outlook is tieing up ECB's hand on monetary policy normalization to combat inflation. ECB is clear that it will hike by 25bps this month. But by the end of July, Fed should have delivered another 75bps, bringing interest rate to 2.25-2.50%, comparing to 0-0.25% at the start of the year. Other major central banks, even SNB and with the exception of BoJ, have already started their tightening cycle.
At the same time, Eurozone is facing risk of broadening fragmentation. Borrowing costs of more indebted Eurozone states could risk spiraling out of control, because of ECB's tightening. There is no detail regarding ECB's anti-fragmentation tools. Before these tools are proven effect, room for swift normalization of ECB policy would remain limited.
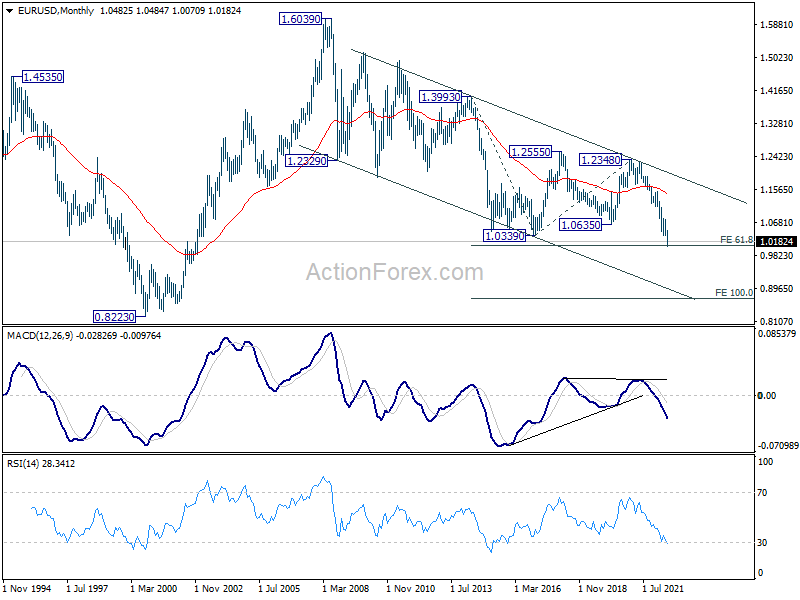
EUR/USD's long term down trend from 1.6039 (2008 high) finally resumed by breaking through 1.0339 (2017 low). Initial target of 61.8% projection of 1.3993 to 1.0339 from 1.2348 at 1.0090 was already met. There might be some support from this level to bring rebound. But, from a medium term point of view, firm break of 1.773 resistance is needed to be the first sign of bottoming. Otherwise, risk will stay heavily on the downside. Sustained trading below 1.0090 and parity could bring further downside acceleration towards 100% projection at 0.8694.
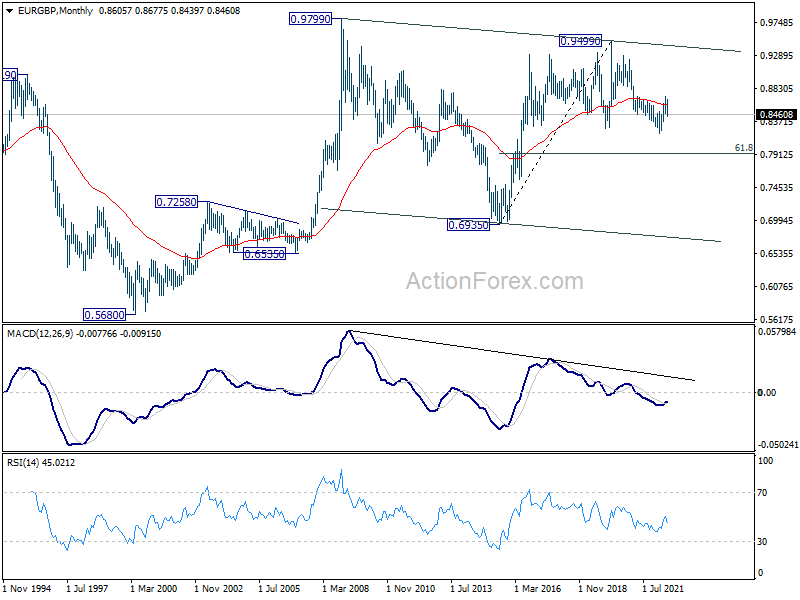
EUR/GBP's steep decline last week argues that rebound from 0.8201 has completed at 0.8720. The rejection by 38.2% retracement of 0.9499 to 0.8201 at 0.8697 maintains medium term bearishness. This is supported by the corrective structure of the price actions from 0.8201, and probably the rejection by 55 month EMA too. Risk will now stay on the downside as long as 0.8720 resistance holds. Firm break of 0.8201 will target 61.8% retracement of 0.6935 to 0.9499 at 0.7917, either as correction to rise from 0.6935 (2015 low), or as the third leg of the pattern from 0.9799 (2009 high).
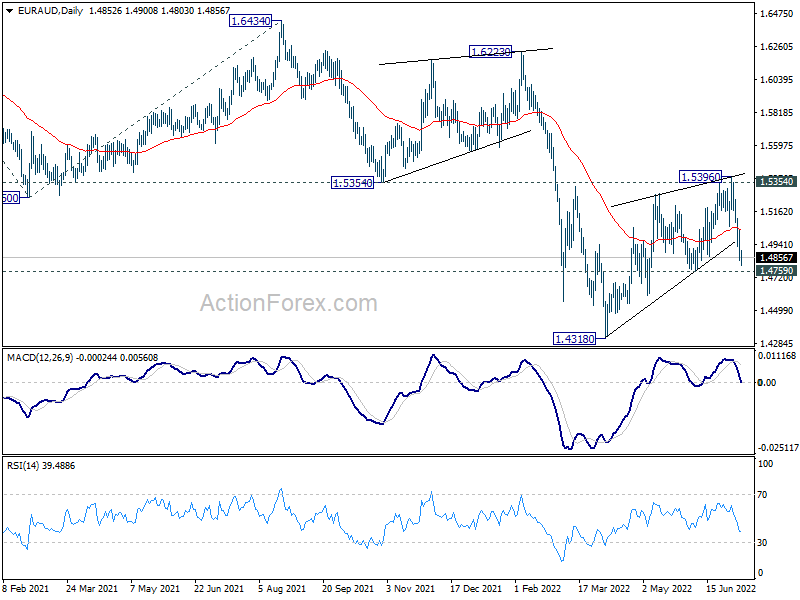
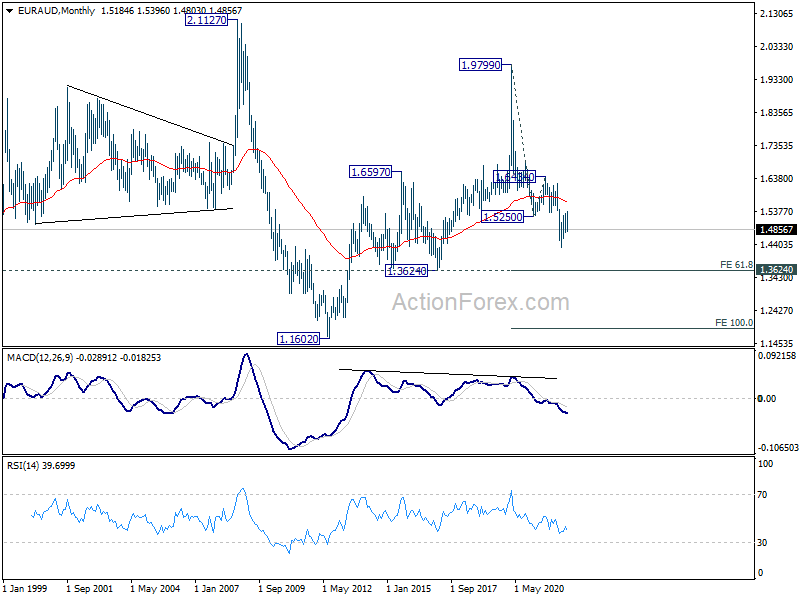
Similar to EUR/GBP, EUR/AUD's corrective rebound from 1.4318 could have completed at 1.5396, after rejection by 1.5354 support turned resistance. Break of 1.4759 support will further affirm this bearish case. When that happens, EUR/AUD should be ready to resume the down trend from 1.9799 (2020 high), towards 61.8% projection of 1.9799 to 1.5250 from 1.6434 at 1.3623, which is close to 1.3624 long term support (2017 low).
Dollar index extends up trend, 108.43 may cap upside
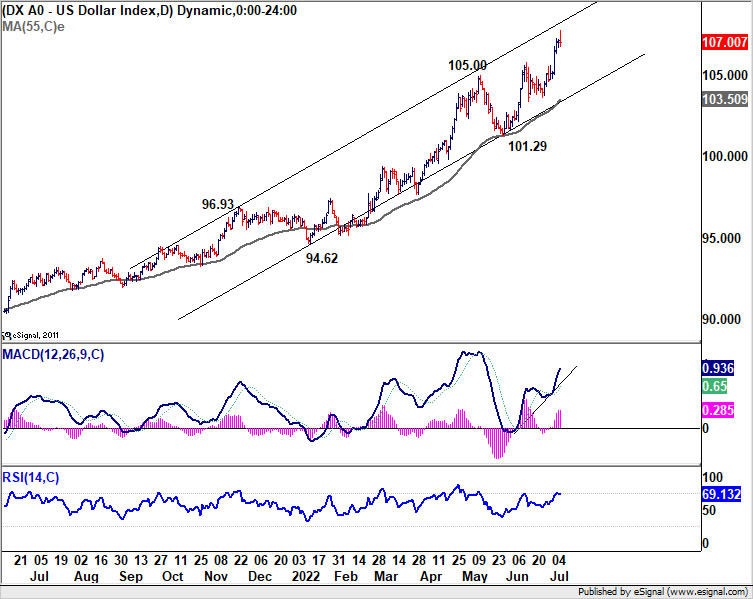
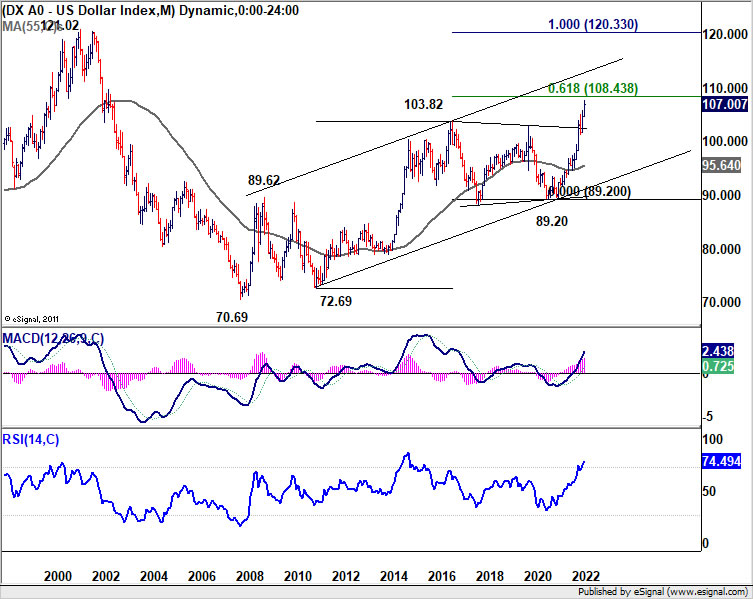
Dollar index's up trend also resumed last week and hit as high as 107.78. It's now facing an important long term projection level, at 61.8% projection of 72.69 to 103.82 from 89.20 at 108.43. There might be some strong resistance from this level to limit upside at first attempt. But outlook will stay bullish as long as 101.29 support holds. To power through 108.43, Dollar would need extra help from rise in treasury yields and extended risk-off sentiment. That might not happen for the near term yet. Though, firm break of 108.43, which would be accompanied by sustained break of parity in EUR/USD, would set the stage for 100% projection at 120.33, which is close to 121.02 (2001 high).
10-year yield to extend sideway consolidation
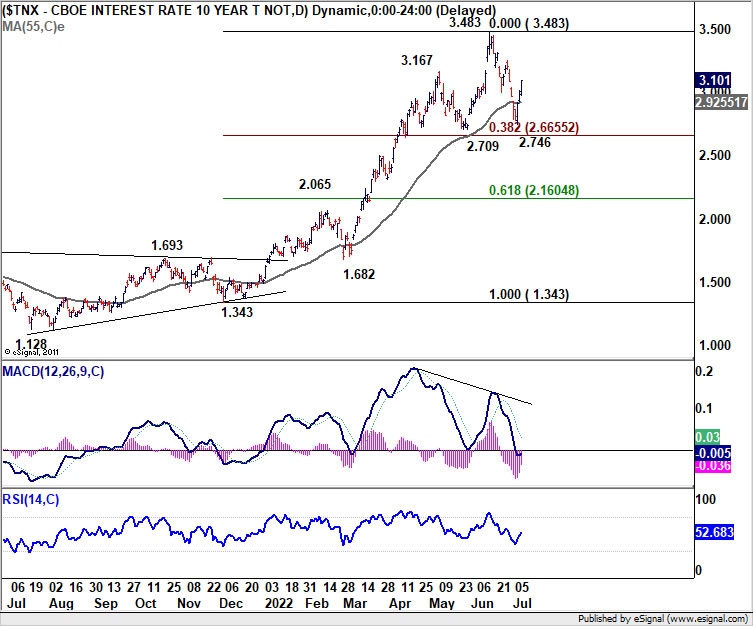
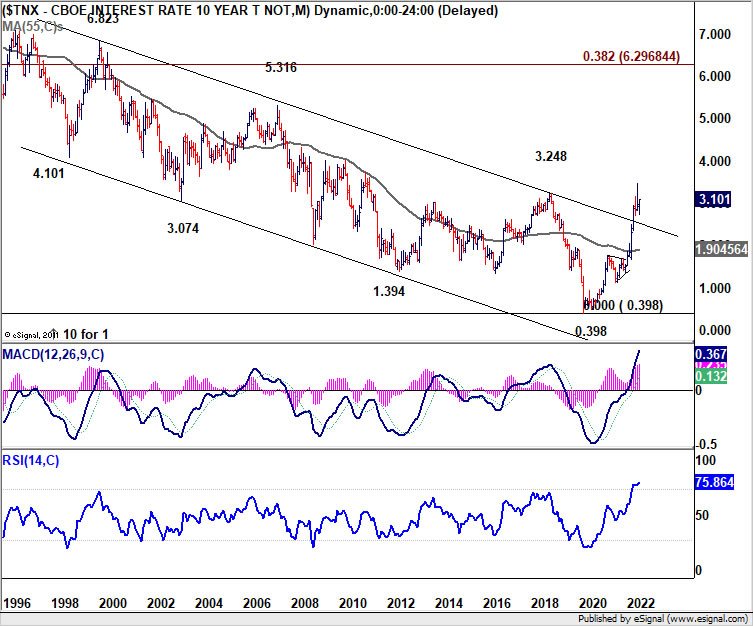
As for 10-year yield, it rebounded strongly, after dipping to 2.746 last week. The first leg of the consolidation pattern from 3.483 should be completed and further rally is mildly in favor for the near term. But upside should be limited by 3.483 to bring another decline. Nevertheless, even in this case, downside should be contained by 2.709, which is close to 38.2% retracement of 1.343 to 3.483 at 2.665. Up trend resumption should happen at a later stage.
USD/CHF Weekly Outlook
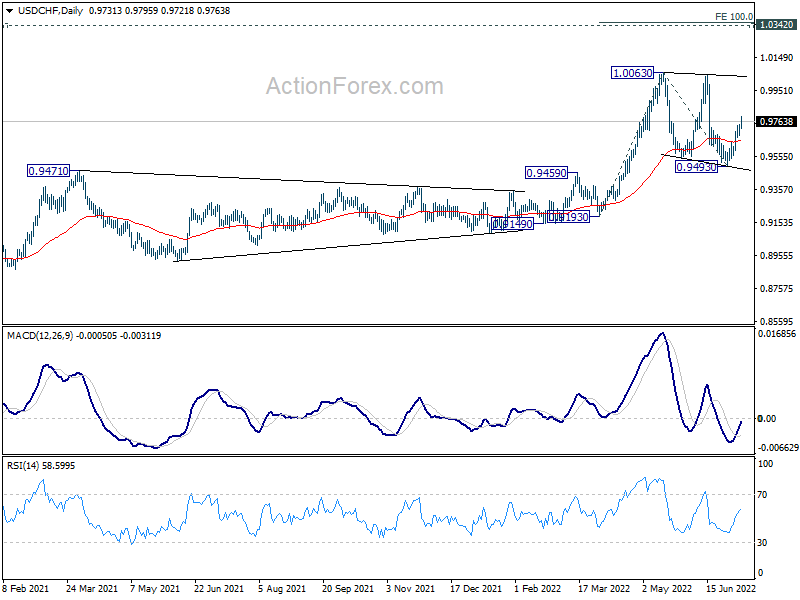
USD/CHF's rebound from 0.9493 extended higher last week. The development argues that consolidation pattern from 1.0063 high has completed with three waves down to 0.9493 already. Initial bias stays on the upside this week for retesting 1.0063 first. Decisive break there will resume larger up trend. On the downside, break of 0.9670 minor support will dampen this bullish view and turn intraday bias neutral first.
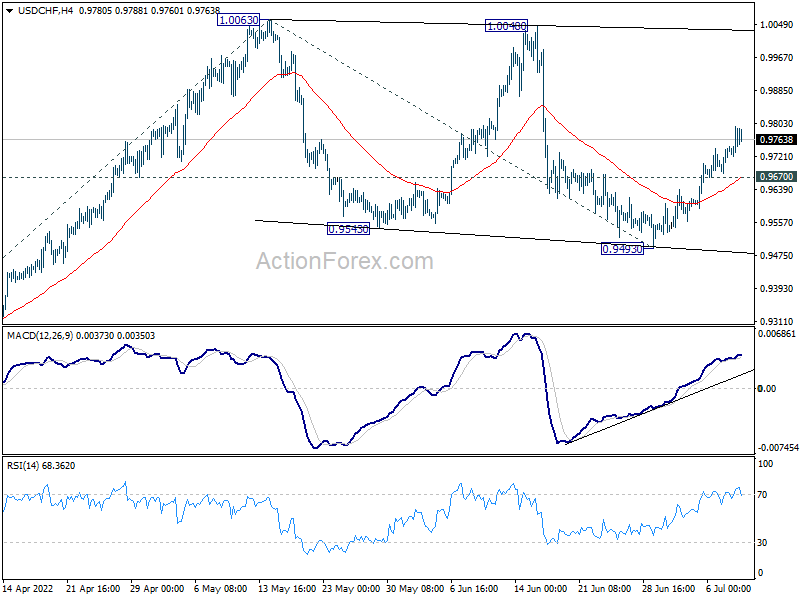
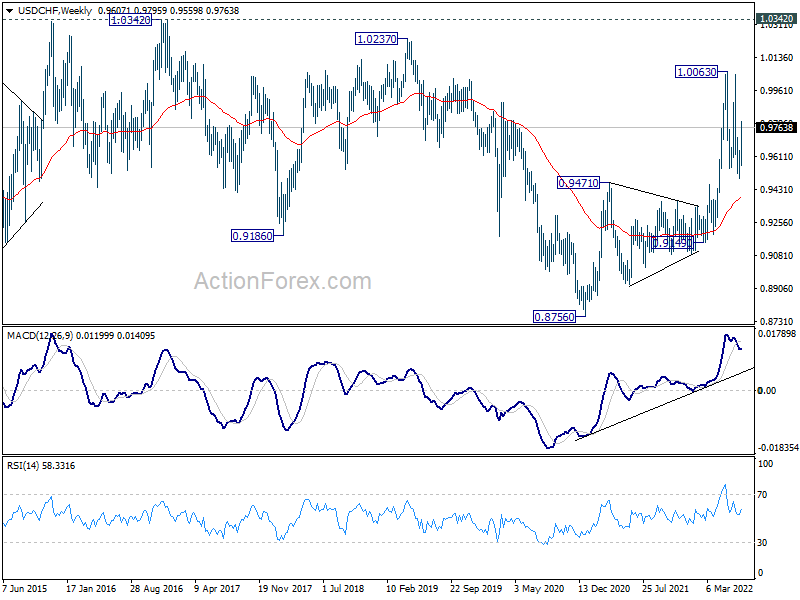
In the bigger picture, medium term up trend from 0.8756 (2021 low) is still in progress. Next target is 1.0342 (2016 high). Sustained break there will resume long term up trend from 0.7065 (2011 low). This will remain the favored case as long as 0.9471 resistance turned support holds.
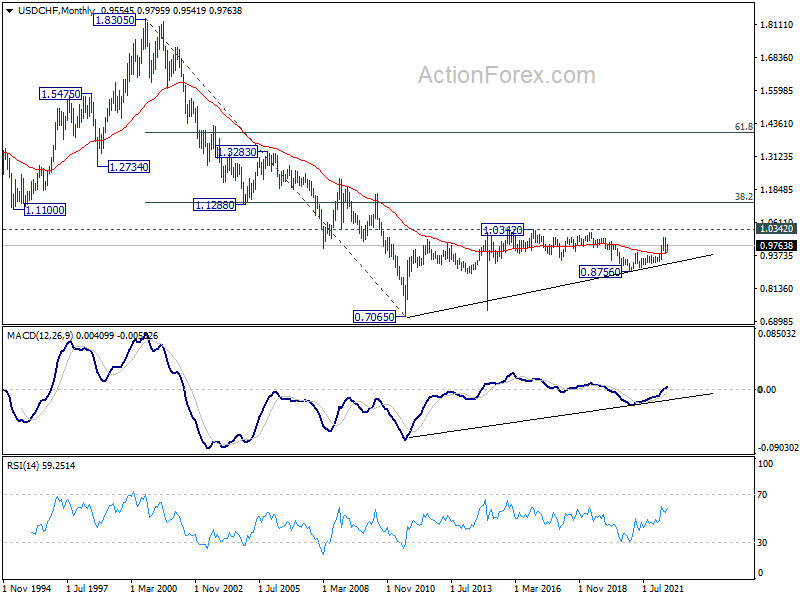
In the long term picture, current development argues that the correction from 1.0342 (2016 high) has completed at 0.8756 (2020 low) already. Rise from 0.7065 (2011 low) might be ready to resume. Firm break of 1.0342 will confirm and target 38.2% retracement of 1.8305 (2000 high) to 0.7065 at 1.1359.
Summary 7/11 – 7/15
Monday, Jul 11, 2022
[php_everywhere instance="1"]
Tuesday, Jul 12, 2022
[php_everywhere instance="2"]
Wednesday, Jul 13, 2022
[php_everywhere instance="3"]
Thursday, Jul 14, 2022
[php_everywhere instance="4"]
Friday, Jul 15, 2022
[php_everywhere instance="5"]
Weekly Economic & Financial Commentary: Yield Curve Signals Recession on the Horizon
Summary
United States: Payroll Growth Sizzles in June Despite Recession Fears
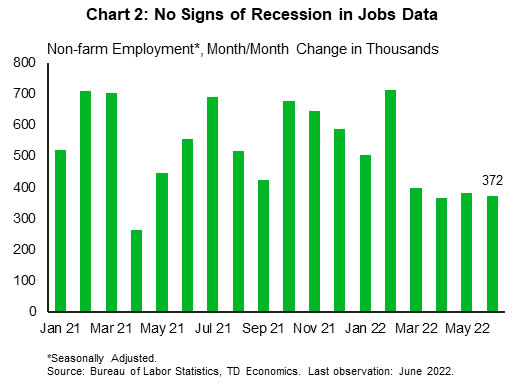
- June brought a strong 372K payroll gain, beating the consensus and calming recession concerns. The unemployment rate held at 3.6%. Total job openings remain highly elevated but fell by 427K to 11.3 million in May. The ISM services index edged down to 55.3 during June, marking a two-year low. The trade gap narrowed to $85.5 billion in May as exports rose at a slightly faster pace than imports.
- Next week: Consumer Price Index (Wed.), Retail Sales (Fri.), Industrial Production (Fri.)
International: Some Cracks in Canada's Economic Outlook
- The past week saw some underwhelming news from Canada. June employment unexpectedly fell by 43,200, and while the Bank of Canada's Business Outlook Survey reported solid sales over the past three months, it also signaled a slowing in sales going forward. We expect Canadian GDP growth of 3.9% in 2022, but growth of just 1.5% in 2023. In Scandinavia, Sweden's GDP rose in May, while Norway's mainland GDP fell. Finally, the Reserve Bank of Australia raised its policy rate 50 bps at this week's monetary policy meeting, as expected.
- Next week: U.K. GDP (Wed.), Bank of Canada Policy Announcement (Wed.), China GDP (Fri.)
Interest Rate Watch: Yield Curve Signals Recession on the Horizon
- The yield on the two-year Treasury note moved above the yield on the 10-year Treasury security this week. An inverted yield curve has historically been a reliable indicator of a looming recession.
Topic of the Week: Collapse Goes the Commodities
- The Commodity Research Bureau's All Commodities Index ended Thursday down 1.9% over the week, while Bloomberg's measure slid 1.6% over the same period. The slide has been broad-based, with major declines in products stretching from copper to soybean oil.
The Weekly Bottom Line: Job Gains Defy Recession Calls
U.S. Highlights
- Recession calls increased this week, but the job market begged to differ. The U.S. added 372k jobs in June, keeping the unemployment rate at its historic low of 3.6% and amplifying fears about inflation.
- In contrast, leading business indicators slipped modestly in June, while remaining above the 50 threshold, which suggests that both manufacturing and services sectors continue to expand.
- The FOMC minutes from the June meeting showed significant worries about the possibility that high inflation is becoming entrenched in consumer expectations. The Fed is positioned for another supersized rate hike at the end of the month.
Canadian Highlights
- Canada’s housing market continued to cool in June, with home sales down in Calgary (-5% m/m), Vancouver (-10%), and Toronto (-4.7%).
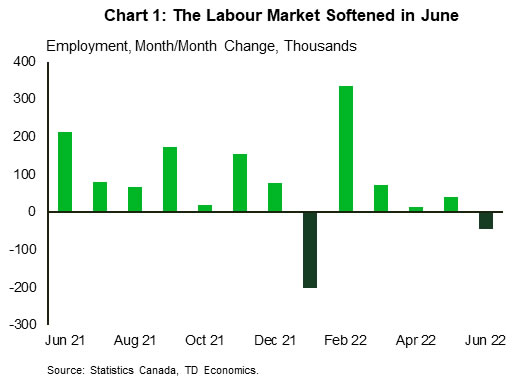
- The labour market shed 43k jobs in June, primarily due to significant job losses in retail trade. Even so, the unemployment rate declined by 0.2 percentage points falling to a new low of 4.9%, while wage growth accelerated.
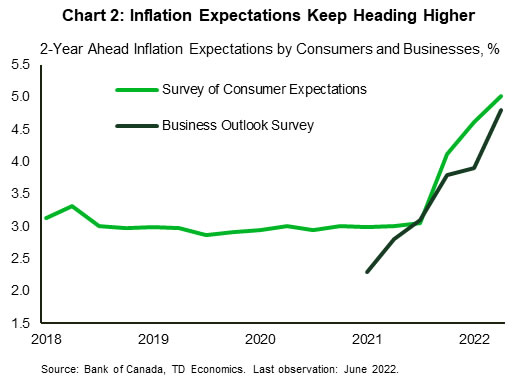
- The Bank of Canada’s Business Outlook Survey and the Survey of Consumer Expectations released this week showed that inflation expectations continued to trend higher in Q2 among both businesses and consumers.
U.S. - Job Gains Defy Recession Calls
Recession became a much more popular word on the street this week. Revisions to first quarter GDP data and a weak spending report for May which came out at the end of last week revealed much softer consumer momentum in the first half of the year. This led many forecasters to downgrade their outlooks, with some calling for recession. TD Economics is not calling for a recession, but we acknowledge the downside risks have risen. As such, we have formulated an alternate economic profile on how a U.S. recession might unfold.
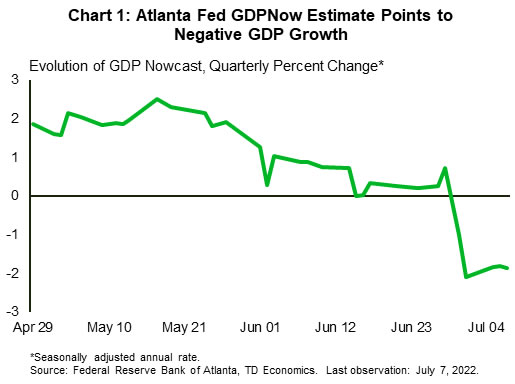
The Atlanta Fed’s GDP Nowcast is pointing to a second quarter of contraction in GDP in Q2 (Chart 1). However, two quarters of contraction in GDP is not enough to qualify as a recession according to NBER criteria – the economic body that defines recessions. In addition to economic output, it places a heavy importance on payrolls employment and real personal incomes less transfers. The income measure has certainly softened with high inflation in recent months but remains in expansionary territory. And the impressive June payrolls report confirmed that employment remained strong (Chart 2). The unemployment rate remained low at 3.6%, and average hourly wages were up a healthy 5.1% year-on-year, both pointing to tight labor market conditions.
Putting aside healthy hiring through June, sentiment indicators are showing some softness. The Institute for Supply Managements’ (ISM) readings for the manufacturing and services sectors both slipped modestly. However, both sectors remained above the 50 threshold, which suggests that both remained in expansionary territory. The underlying details paint a slightly more nuanced picture. Both sectors showed an increase in current business activity, but in the manufacturing sector, the new orders index slipped into contractionary territory, while in the services sector it eased but remained solidly expansionary.
Another important message of the ISM reports is that prices paid by businesses continue to ease – a trend that corresponds with a recent reduction in supply chain bottlenecks. Indeed, the supplier delivery times have improved since the beginning of the year, especially in the manufacturing sector. According to the San Francisco Fed’s research, the distribution of price gains as measured by core PCE inflation is equally split between supply and demand factors, suggesting that cooling on the supply side should help ease inflation going forward.
In the meantime, minutes from the FOMC meeting in June showed that members are worried about the level of stickiness in price gains, and the rising possibility that high inflation is becoming entrenched in consumers expectations. This fear clearly overshadowed any concern the members might have had about prospects for economic growth, resulting in a rare consensus when deciding to supersize the rate hike to 75 basis points. The Fed is positioned for another supersized rate hike at the end of the month, as it focuses on tempering demand.
Canada - Taming Inflation Expectations
While the weather outside is hot, the temperature dial of the Canadian housing market continued to fall in June. Preliminary sales data from the regional real estate boards confirmed that higher interest rates are rapidly cooling Canada's housing market. Home sales declined by varying degrees across the Vancouver (-10% m/m/), Calgary (8% m/m), and Toronto (-5% m/m) markets. From our perspective, there's still more downside to the housing market through the second half of the year. This is particularly true across Ontario and British Columbia, where affordability remains exceptionally low and is likely to only worsen over the near-term amid quickly rising borrowing costs (forecast).
At first blush, things were also a bit cooler across Canada's labour market in June, with employment falling by 43k jobs – more than reversing the gain in May (Chart 1). This marked the first monthly decline since January when hiring was impacted by Omicron. Job losses were concentrated in the service sector, mainly in retail trade (-58k). Despite the decline, the labour market remained extremely tight. The unemployment rate fell further in June, declining by 0.2 percentage points and reaching a new low of 4.9%. All in all, the job market in June is likely the victim of its own success: given the historically low unemployment and elevated participation rate, hiring was bound to slow at some point.
Amid the dearth of workers, wage growth continued to accelerate. Hourly earnings were up 5.2% on a year-over-year basis – a noticeable acceleration from the 3.9% y/y recorded in May. This echoes the results from the Bank of Canada Business Outlook Survey (BOS) released earlier this week, which showed that businesses were expecting to raise wages by 5.8% over the next twelve months, with the rising cost-of-living cited as an important driver of future wage gains. Indeed, both the BOS and its consumer-focused counterpart – Survey of Consumer Expectations – showed 2-year ahead inflation expectations moving notably higher in the second quarter to 4.8% and 5%, respectively (Chart 2). This implies that businesses and consumers expect inflation to be both higher and more persistent.
Rising inflation expectations and wages – the wage inflation spiral – are posing a challenge for the Bank of Canada, increasing the urgency to slay the inflation dragon before inflation expectations become even more unhinged. Falling home prices will likely help to revert some of the inflationary mindset among consumers. This week the average gasoline prices also edged lower, falling below $2/liter for the first time since the end of May. Still, with demand outstripping supply and the economy bumping up against labour constraints, we expect the Bank of Canada to stay the course of aggressive rate hikes and raise the policy rate by 75 basis points next week.