Sample Category Title
GBPJPY Seeks an Upside Reversal, But Bears Still Present
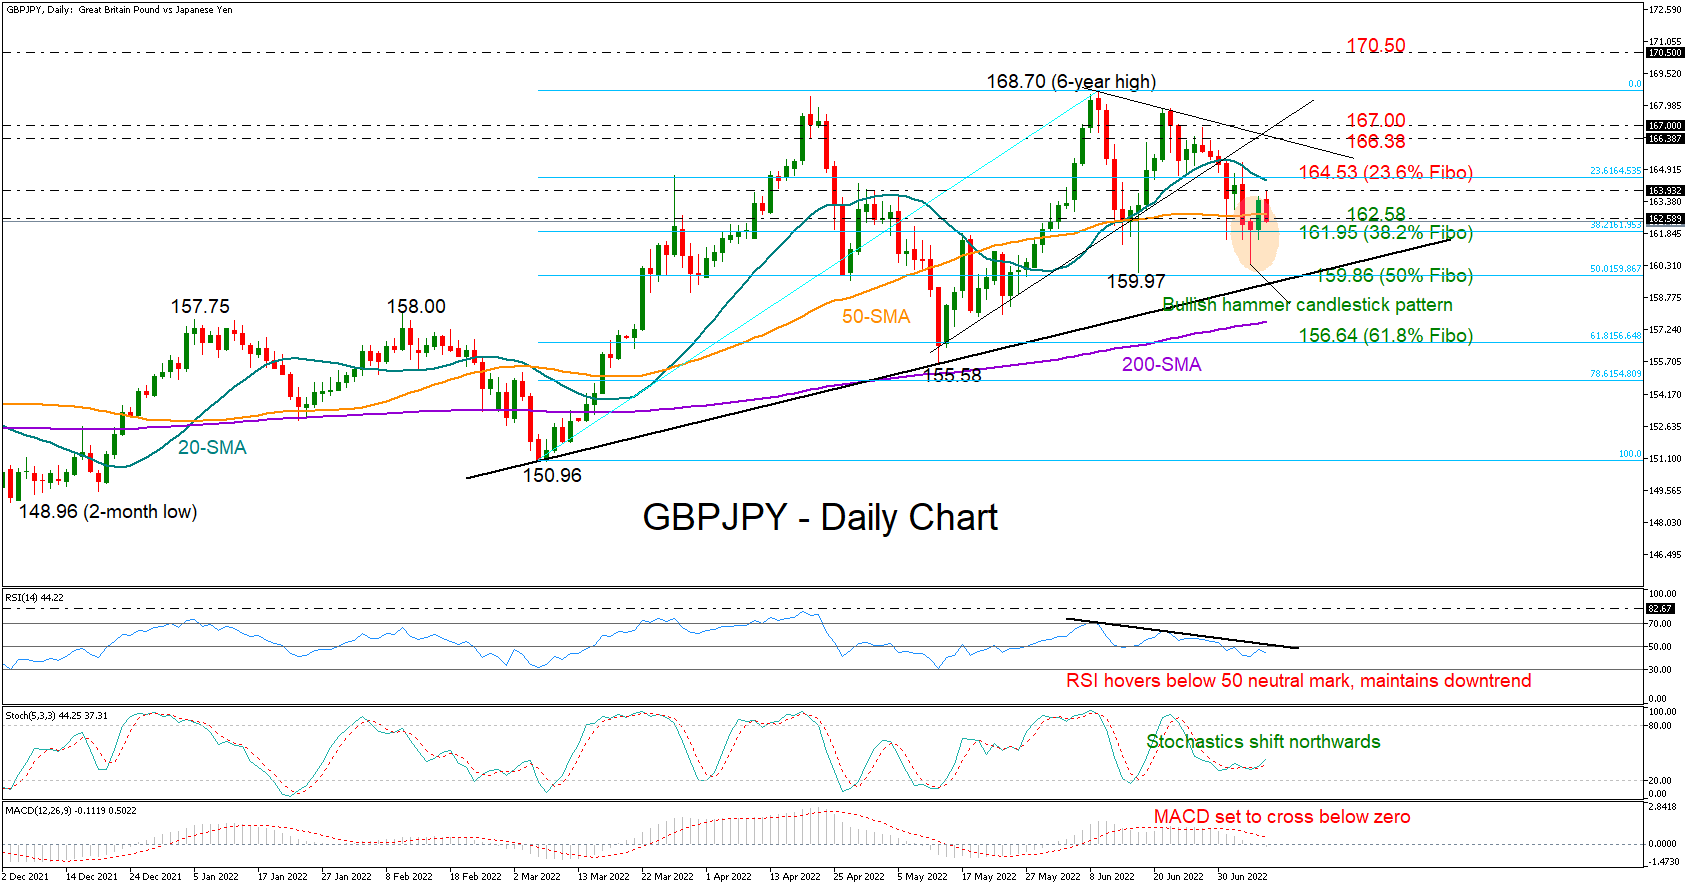
GBPJPY finished Thursday’s session comfortably in the green zone after refusing to close below the 162.00 round level once again. Simultaneously, the bullish action seems to have confirmed Wednesday’s hammer candlestick pattern – an encouraging sign that the balance may change in the favor of the bulls, potentially causing an upside reversal in the price.
Consulting other technical indicators, however, some patience might still be required. Despite the soft upturn in the Stochastics, the RSI is still consolidating its downtrend below its 50 neutral mark. The MACD is also lacking bullish signs, testing a cross below its zero line instead.
The 50-day simple moving average (SMA), where the 20-period SMA is also positioned in the four-hour chart, is currently buffering bearish forces around 162.58. If the price secures a floor around that level, it may rotate towards the 20-day SMA at 164.53 once today’s ceiling of 163.93 (200-period SMA in the four-hour chart) gives way. The 23.6% Fibonacci retracement of the 150.96 – 168.70 upleg is in the neighborhood as well. Hence, any additional gains from here are expected to drive the pair straight up to the tentative short-term falling trendline seen at 166.38, while a close above the 167.00 number could be a prerequisite to visit the topline at 168.70.
On the downside, traders will keep a close eye on the 162.58 – 161.95 support zone, which encapsulates the 38.2% Fibonacci too. If that base collapses, the bears may again attempt to reach the 50% Fibonacci of 159.86 and the tentative ascending trendline from the low of 150.96. Another failure here could see the price initially seeking shelter around the 200-day SMA and then near the 61.8% Fibonacci of 156.64.
In brief, GBPJPY is still exposed to sellers’ dominance despite the latest positive candlestick formation. A decisive move above the 163.93 – 164.53 area could raise confidence in the latest price upturn, while a break below 162.58 – 161.95 is expected to worsen market sentiment.
USDCAD Forms Triple Top Near 1.2960; Positive Bias
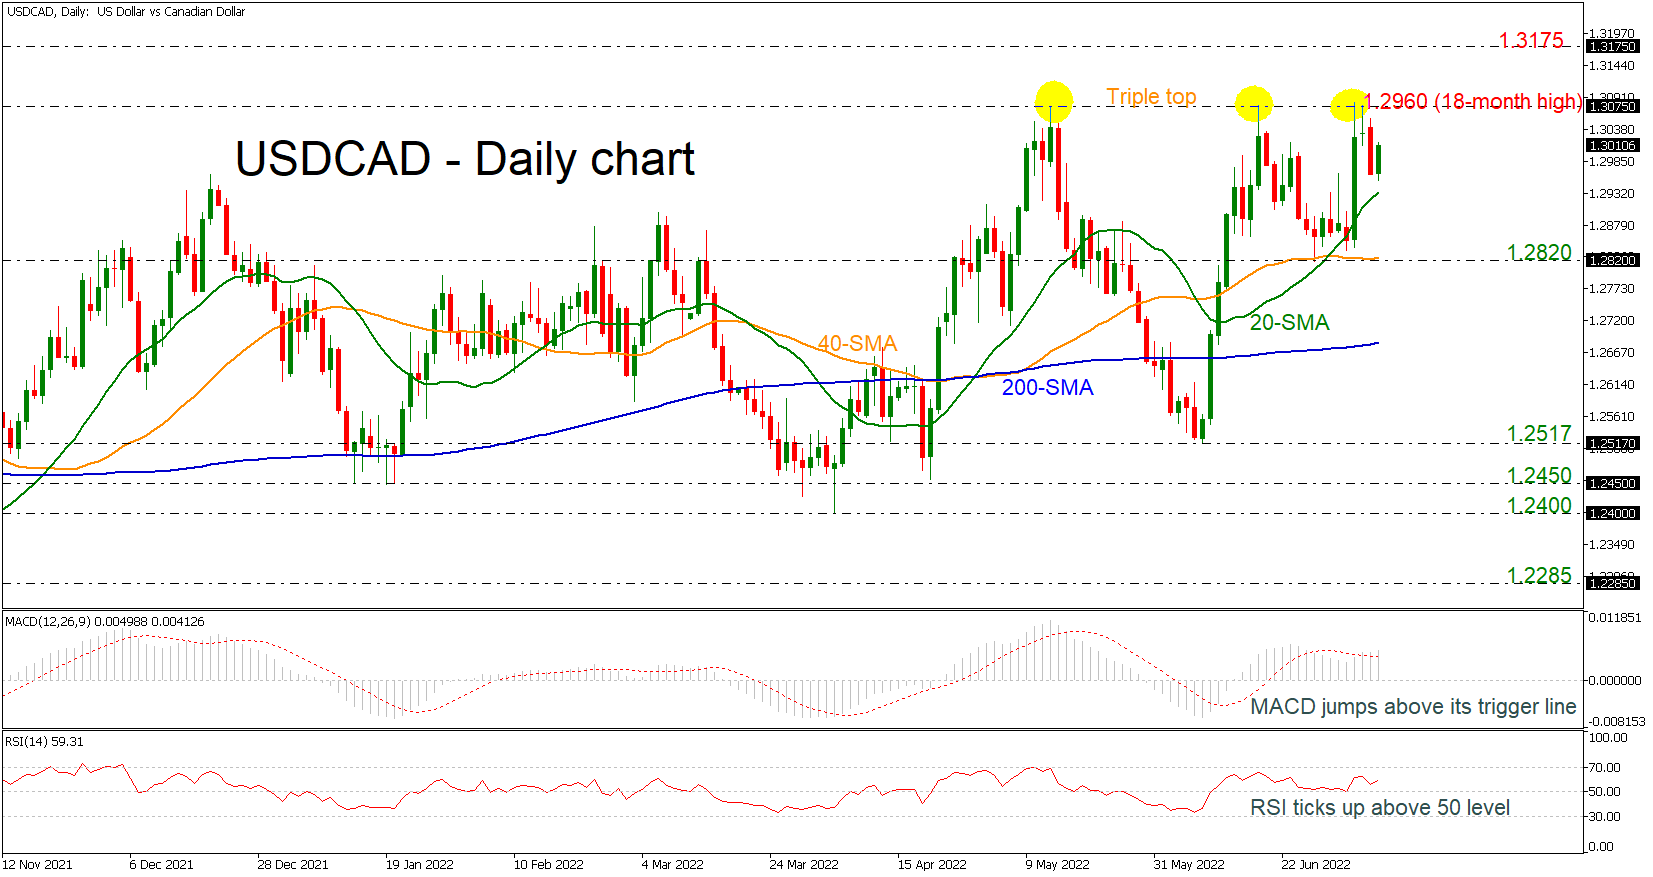
USDCAD posted a triple top around the 18-month high of 1.2960, failing to create a higher high to continue the buying interest. However, the MACD oscillator surpassed its trigger and zero lines, while the RSI is sloping upwards in the positive region. Both are suggesting that the structure is still bullish in the near-term.
In the positive scenario, traders would be eagerly looking for a break above the recent top of 1.2960 to increase buying orders. If that’s the case, the rally could last until 1.3175, the highest level marked in November 2020. If bullish forces appear even stronger, 1.3385 should be another resistance to keep in mind.
Should the price retreat, the 20-day simple moving average (SMA) which the bears were unable to break over the last month could provide immediate support. Moving lower, the focus will shift to the 1.2820 restrictive area, which overlaps with the 40-day SMA, while lower still, a violation of the 200-day SMA at 1.2685 would increase speculation that the bullish phase has ended, and a downtrend is in progress.
Summarizing, the recent bullish action may turn the biggest picture more positive if the market overcomes the triple top pattern.
Daily Technical Analysis
EUR/USD
The bears managed to violate the psychological level at 1.0200, but the pair formed a support zone at 1.0150, which limited the sell-offs. At the time of writing this analysis, the pair is hovering just above the mentioned support and the expectations for today’s trading session are for a correction towards the resistance at 1.0270. Only a successful breach of the support at 1.0150 would pave the way for the pair towards the critical support at 1.0100. During today's session, market participants will closely follow the announcement of the non-farm payroll change data for the U.S. (12:30 GMT), together with the unemployment rate change data, again for the U.S. (12:30 GMT).
USD/JPY
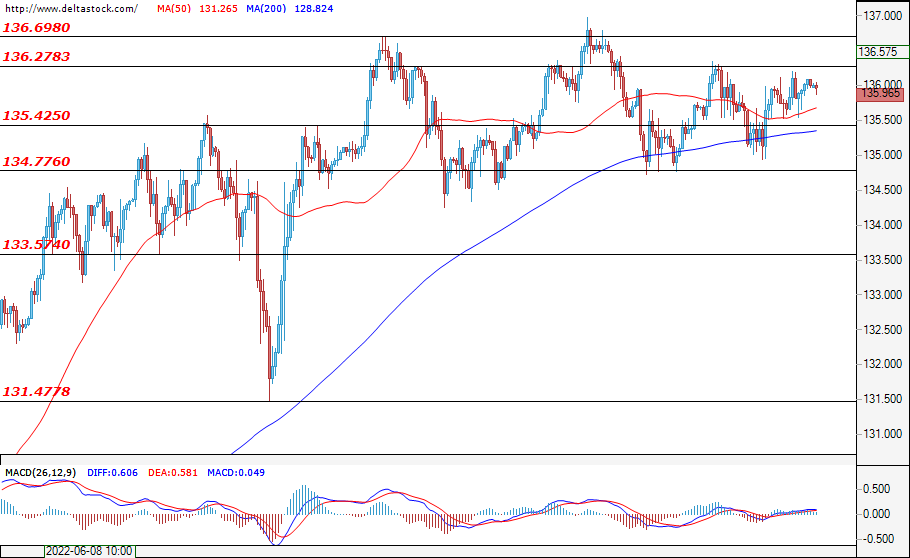
The resistance at 136.30 still withholds the attacks of the bulls and the forecast for today’s trading session is for the pair to head towards a test of the support at 134.77. Consequently, the pair may consolidate in the range of 134.77 – 136.27. If the bulls prevail and manage to breach the resistance zone at 136.30, then an upward movement may develop towards the high at 136.70.
GBP/USD
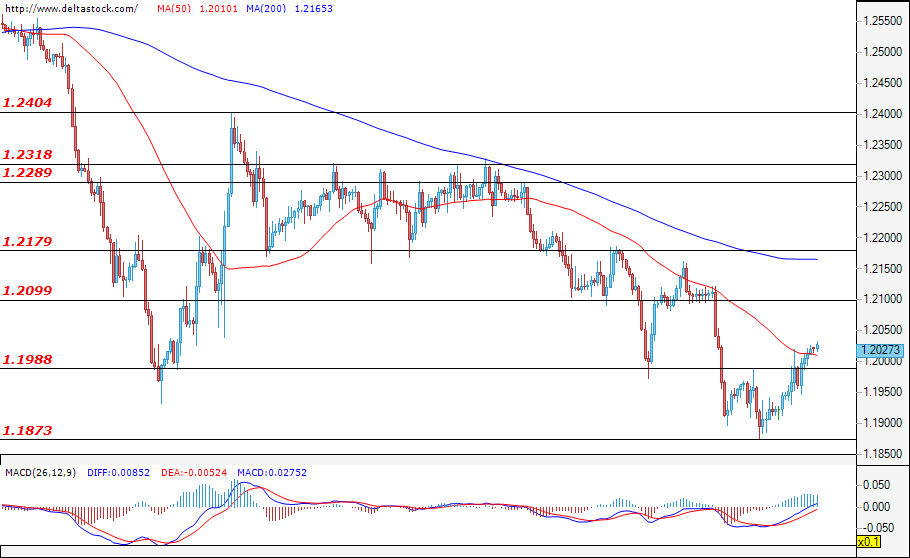
The pair bounced back from the support at 1.1872 and the bulls took control and violated the psychological level at 1.1200. The pair would most probably consolidate above 1.1200, with an upper border of 1.2100. If the bears enter the market and lead the pair below 1.1200, then we may expect a downward movement towards the support at 1.1873. However, the market sentiment remains positive – for a continuation of the upward movement towards the key resistance at 1.2180, which scenario is likely to be realised only after a confirmed breach of the resistance at 1.2100.
EUGERMANY40
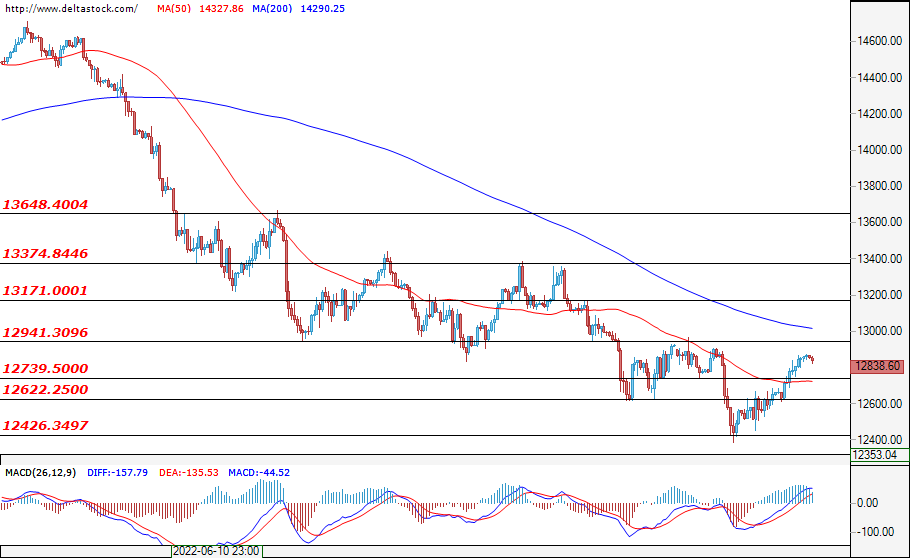
The index continues to gain value and the bulls would most probably try to attack the resistance zone at 12940. However, considering this level offers strong resistance, the forecast for today’s trading session is for the price to remain below it and to witness a slight correction towards the support at 12739, where a successful breach would suggest a downward movement towards the support at 12622.
US30
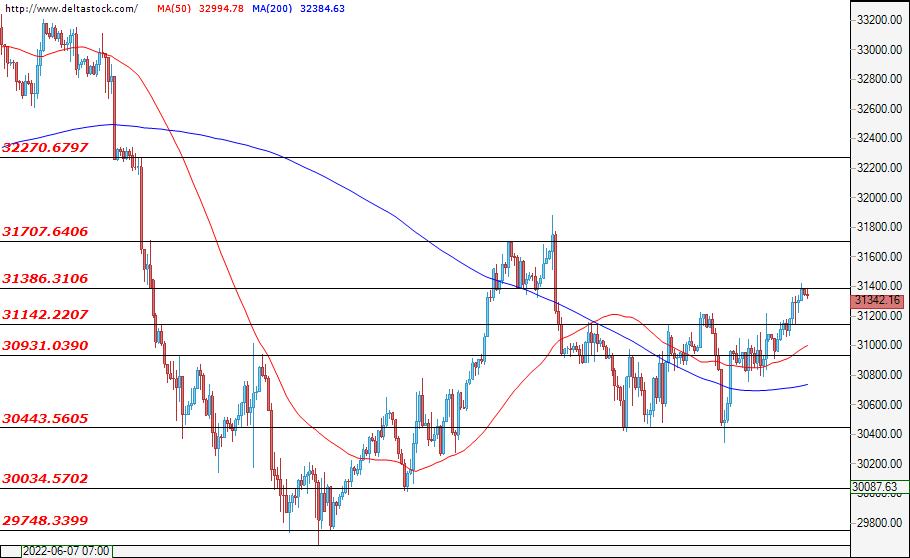
The bulls faced difficulties in overcoming the resistance at 31386, and in the early hours of today’s trading, the sellers are trying to take control and so the most probable scenario for today’s trading session is for a corrective move towards the support at 30930. However, if the bulls manage to take control and breach the resistance at 31386, then we may witness an impulsive upward movement towards the next key resistance at 31700.
EUR/USD pair moved into a bearish zone below $1.0200
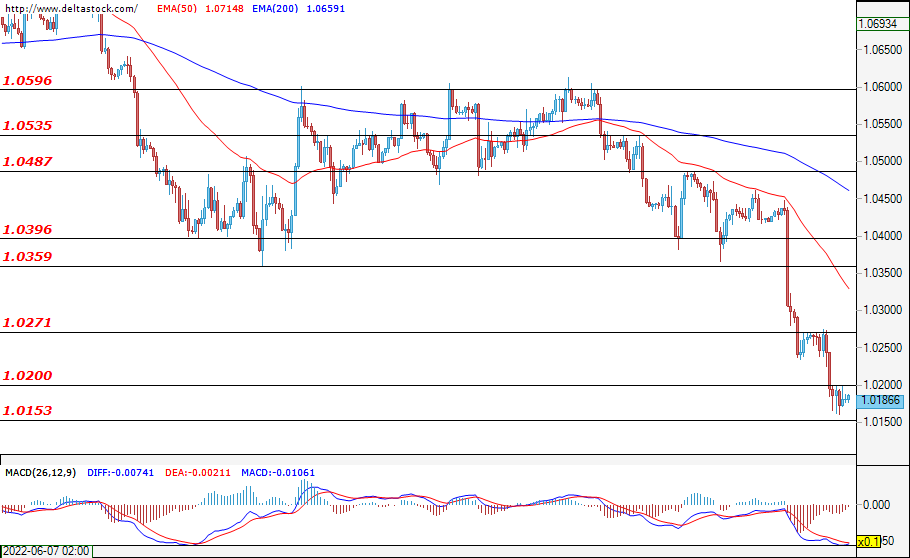
The Euro started a fresh decline below the 1.0300 support zone against the US Dollar. The EUR/USD pair even traded below the 1.0200 level to move into a bearish zone.
A low is formed near 1.0144 and the pair is now consolidating losses. It recently tested a connecting bearish trend line with resistance near 1.0180 on the hourly chart but failed to continue higher. It is also struggling below the 50 hourly simple moving average.
On the upside, the next major resistance is near 1.0200 on FXOpen. A break above the 1.0200 and 1.0220 resistance levels could start a decent recovery wave. In the stated case, it could even surpass 1.0250.
An immediate support is near the 1.0150 level. The next key support is near 1.0120, below the pair could decline towards the 1.0100 level in the near term. Any more losses might send the pair towards the 1.0050 level.
GBP/JPY Daily Outlook
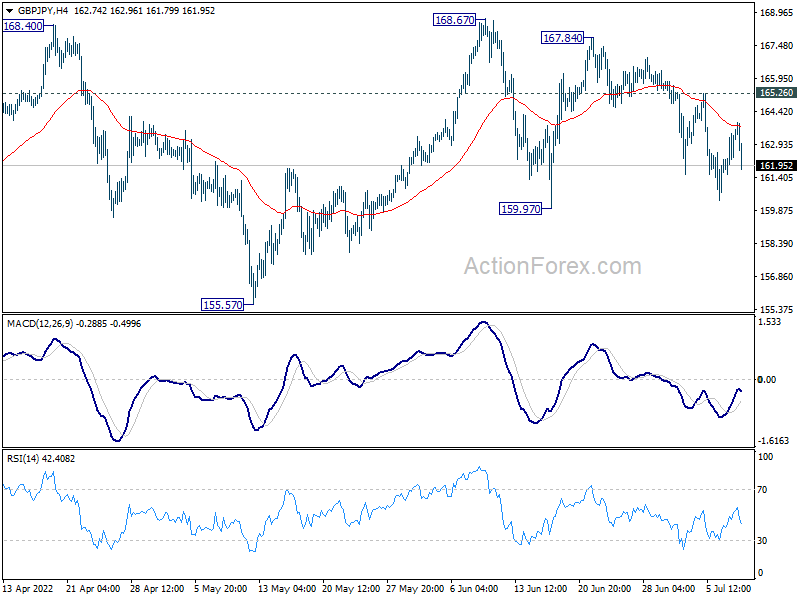
Daily Pivots: (S1) 162.20; (P) 162.91; (R1) 164.23; More...
Price actions in GBP/JPY are not too decisive so far. But further fall is in favor with 162.56 minor resistance intact. Firm break of 159.97 support will raise the chance of rejection by 167.93 long term fibonacci resistance. Deeper fall would be seen to 155.57 support for confirmation. On the upside, break of 165.26 minor resistance will turn bias back to the upside for retesting 168.67 high.
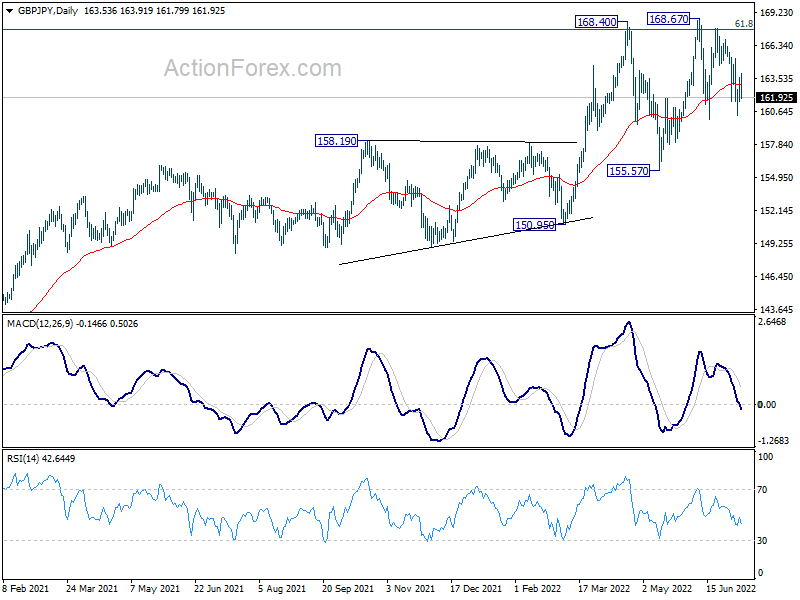
In the bigger picture, up trend from 123.94 (2020 low) is still in progress. Sustained break of 61.8% retracement of 195.86 (2015 high) to 122.75 (2016 low) at 167.93 will be a long term bullish signal, and could pave the way back to 195.86 high. This will now remain the favored case as long as 155.57 support holds, even in case of deep pull back.
EUR/JPY Daily Outlook
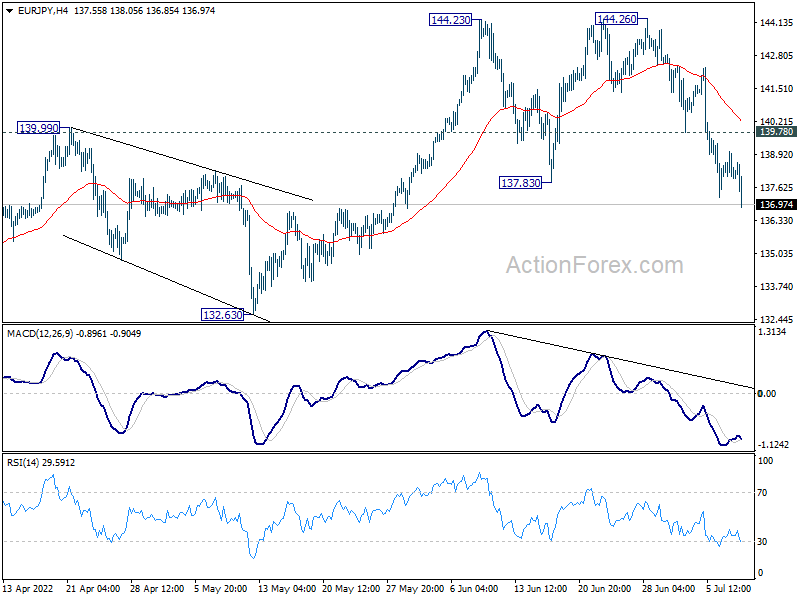
Daily Pivots: (S1) 137.78; (P) 138.42; (R1) 138.86; More....
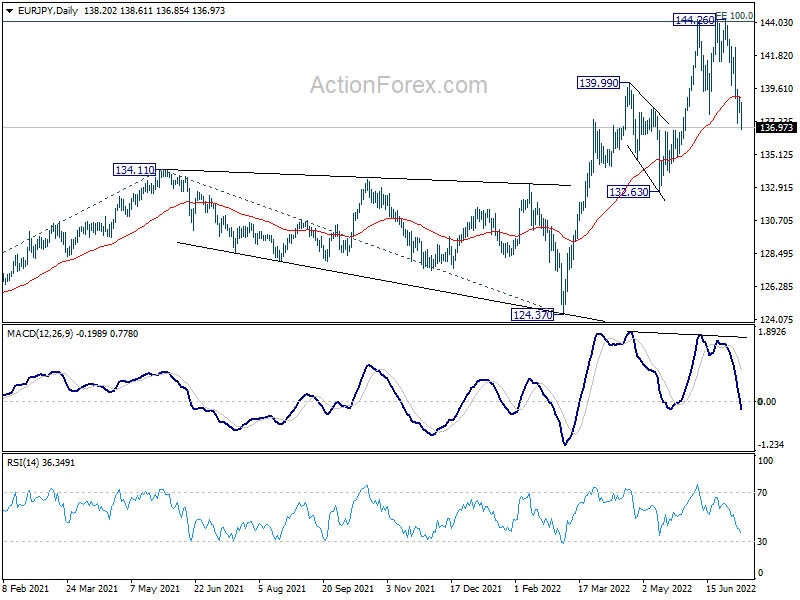
Intraday bias in EUR/JPY stays on the downside at this point. An important top might be formed at 144.26 after rejection by 144.06 long term fibonacci level. Deeper fall would be seen to 132.63 support for confirmation. On the upside, above 139.78 minor resistance will turn intraday bias neutral first.
In the bigger picture, up trend from 114.42 (2020 low) is in progress. Such rise is seen as the third leg of the pattern from 109.30 (2016 low). Sustained trading above 100% projection of 114.42 to 134.11 from 124.37 at 144.06 will indicate upside acceleration and target 149.76 long term resistance (2014 high). In any case, outlook will remain bullish as long as 132.63 support holds, in case of deep pull back.
EUR/GBP Daily Outlook
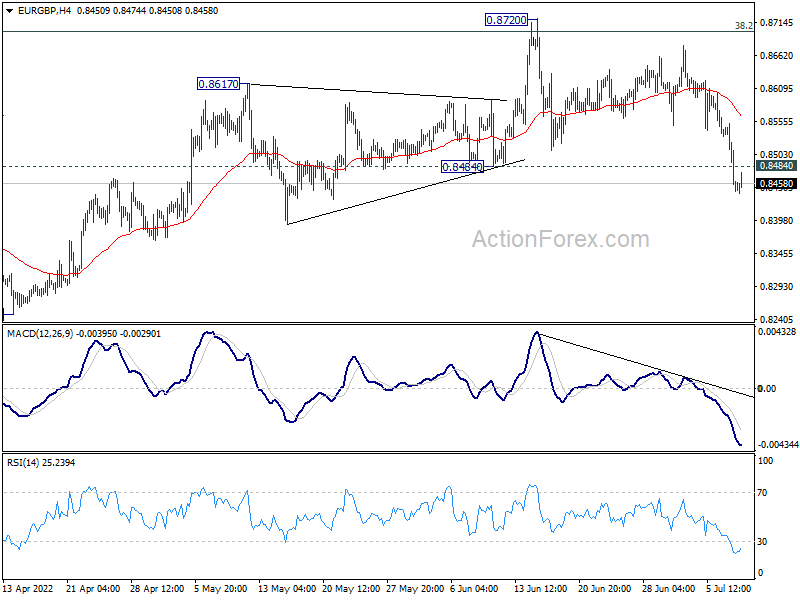
Daily Pivots: (S1) 0.8413; (P) 0.8484; (R1) 0.8522; More...
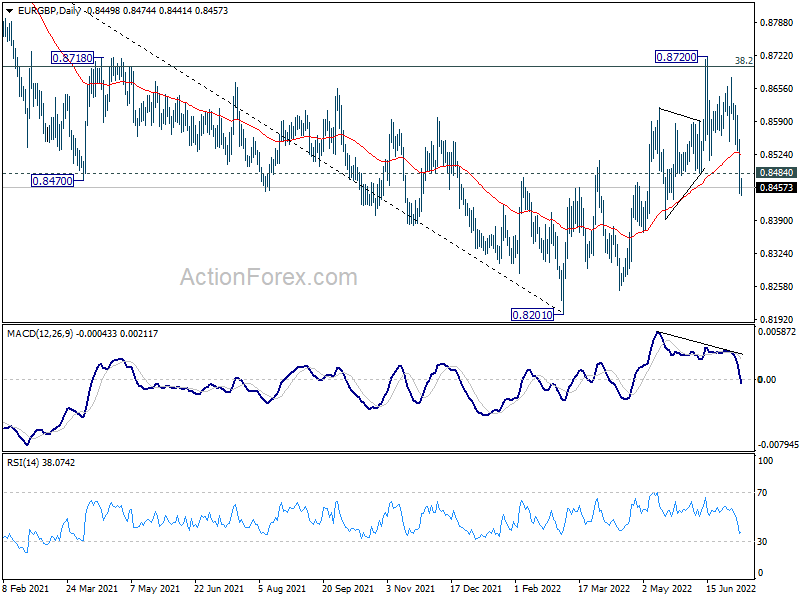
EUR/GBP's break of 0.8484 support argues that rebound from 0.8201 has completed at 0.8720, after rejection by 0.8697 medium term fibonacci level. Intraday bias is back on the downside for 0.8248 support first. Break will target 0.8201 low. For now, risk will stay on the downside as long as 0.8720 resistance holds, in case of recovery.
In the bigger picture, rise from 0.8201 medium term bottom could could either be a correction to the down trend from 0.9499 (2020 high), or a medium term up trend itself. Sustained break of 38.2% retracement of 0.9499 to 0.8201 at 0.8697 will affirm the latter case, and pave the way to 61.8% retracement at 0.9003. However, rejection by 0.8697 will maintain medium term bearishness.
EUR/AUD Daily Outlook
Daily Pivots: (S1) 1.4780; (P) 1.4913; (R1) 1.4986; More...
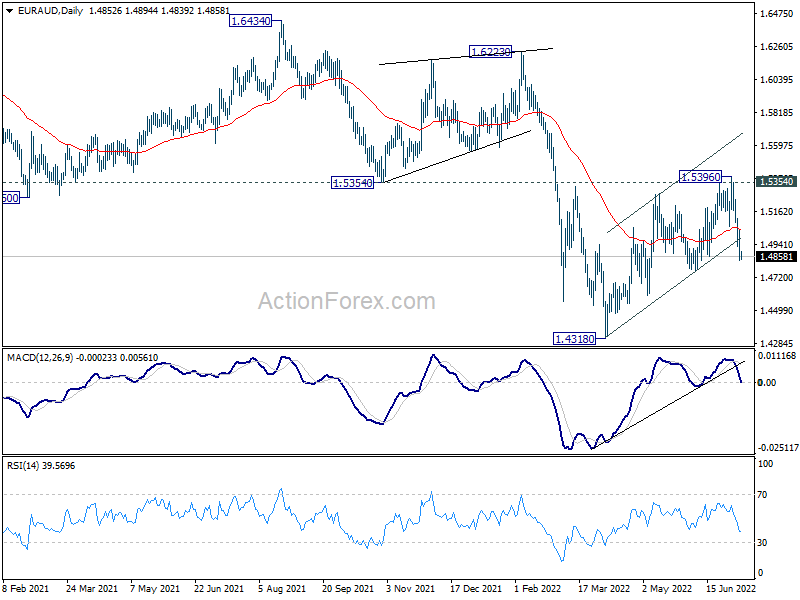
Intraday bias in EUR/AUD stays on the downside for 1.4759 support. Sustained break there should confirm rejection by 1.5354 support turned resistance, and argues that larger down trend is no finished. Further fall should then be seen to retest 1.4138 low next. On the upside, above 1.5059 minor resistance will turn bias back to the upside for retesting 1.5396 instead.
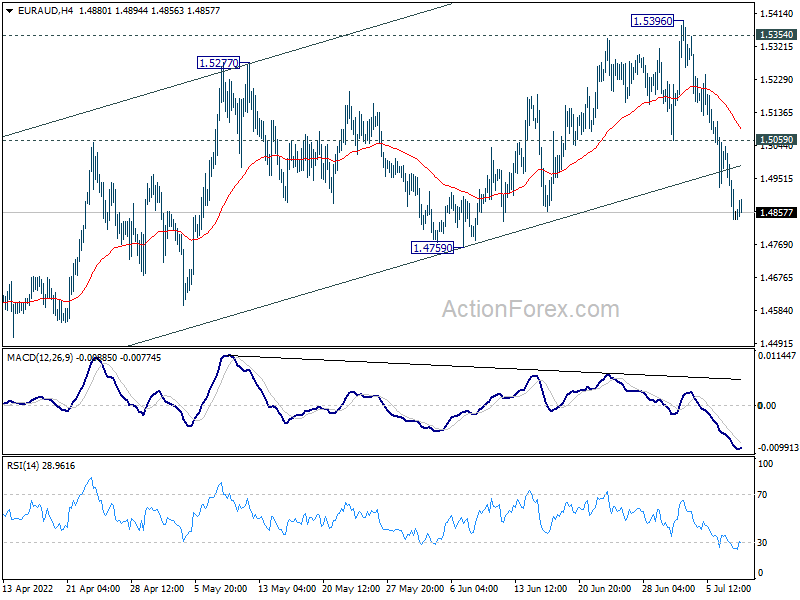
In the bigger picture, sustained break of 1.5354 support turned resistance will argue that a medium term bottom was formed at 1.4318 already. It would still be too early to call for long term trend reversal. But further rise would then be seen back towards 1.6434 resistance (2021 high). However, rejection by 1.5354 will retain bearishness for extending the down trend from 1.9799 (2020 high) through 1.4318 at a later stage.
EUR/CHF Daily Outlook
Daily Pivots: (S1) 0.9872; (P) 0.9901; (R1) 0.9929; More....
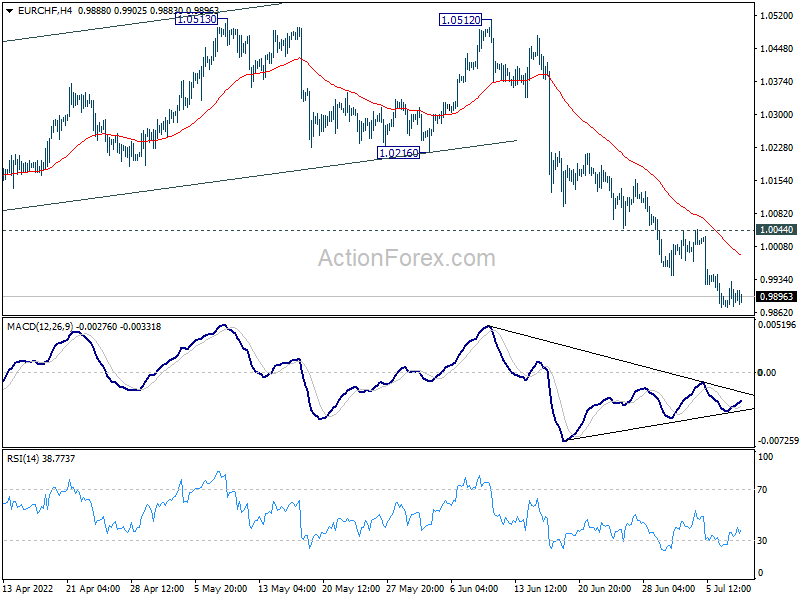
Further decline is expected in EUR/CHF despite loss of downside momentum. Current down trend should target 0.9650 long term projection level. On the upside, break of 1.0044 minor resistance will turn intraday bias neutral and bring consolidations, before staging another decline.
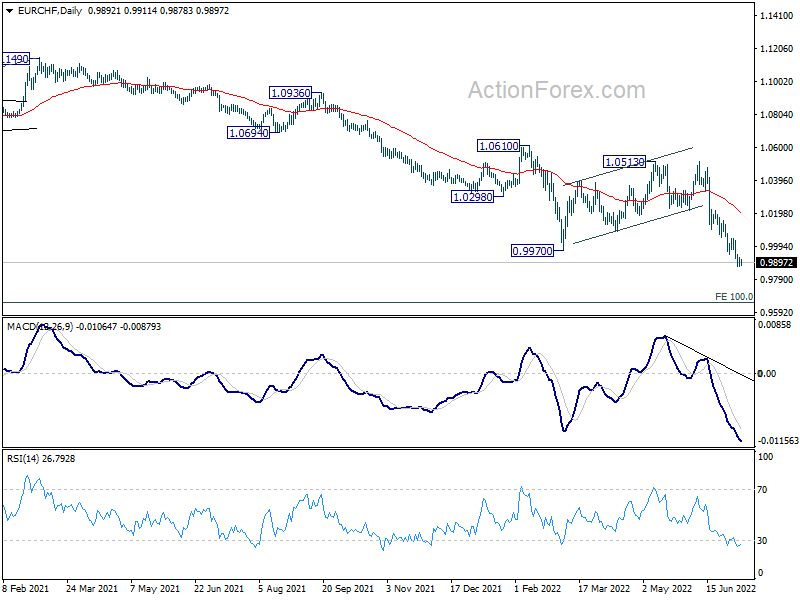
In the bigger picture, rejection by 55 week EMA affirmed medium term bearishness. Long term down trend from 1.2004 (2018 high) is expected target 100% projection of 1.2004 to 1.0505 to 1.1149 at 0.9650. On the upside, break of 1.0513 resistance is needed to indicate medium term bottoming. Otherwise, outlook will stay bearish in case of strong rebound.
USD/CAD Daily Outlook
Daily Pivots: (S1) 1.2935; (P) 1.2995; (R1) 1.3028; More...
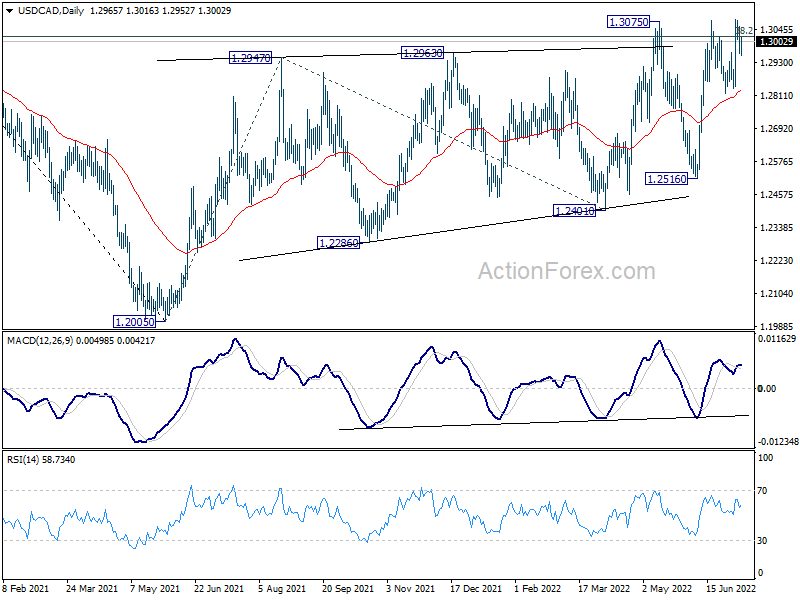
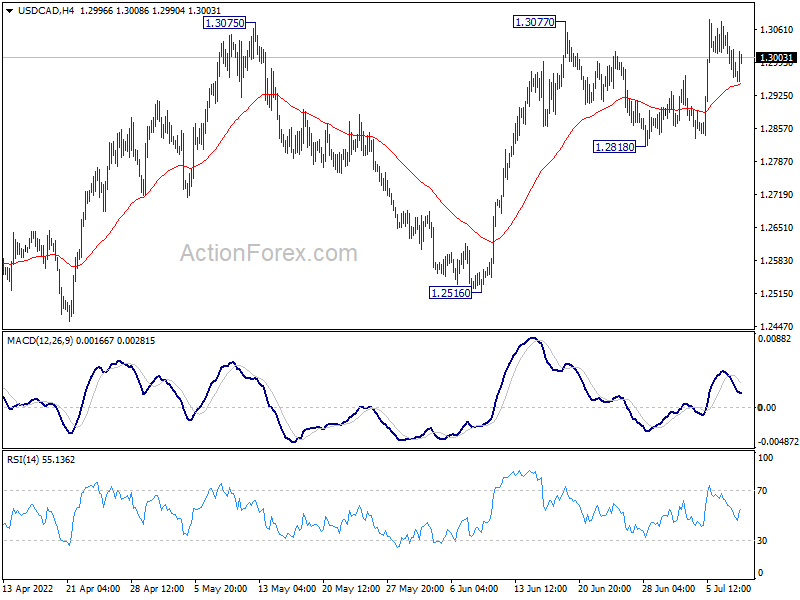
Range trading continues in USD/CAD and intraday bias remains neutral. Further rise is mildly in favor with 1.2818 support intact. On the upside, break of 1.3077 and sustained trading above 1.3022 fibonacci level will carry larger bullish implications, and bring up trend resumption. Next target is 100% projection of 1.2005 to 1.2947 from 1.2401 at 1.3343. On the downside, break of 1.2818 minor support will bring deeper fall back to 1.2516 support instead.
In the bigger picture, focus stays on 38.2% retracement of 1.4667 (2020 high) to 1.2005 (2021 low) at 1.3022. Sustained break there should confirm that the down trend from 1.4667 has completed after defending 1.2061 long term cluster support. Further rise would then be seen towards 61.8% retracement at 1.3650. However, rejection by 1.3022 will maintain medium term bearishness.