Sample Category Title
AUD/USD Daily Report
Daily Pivots: (S1) 0.6810; (P) 0.6849; (R1) 0.6905; More...
AUD/USD is staying in range of 0.6762/6918 and intraday bias remains neutral first. Strong support could still be seen from 0.6756/60 cluster support to complete the whole correction from 0.8006, and bring rebound. On the upside, above 0.6918 resistance will indicate short term bottoming, and turn bias back to the upside for 0.7282 resistance. However, sustained break of 0.6756/60 will carry larger bearish implication and target 0.6461 fibonacci level next.
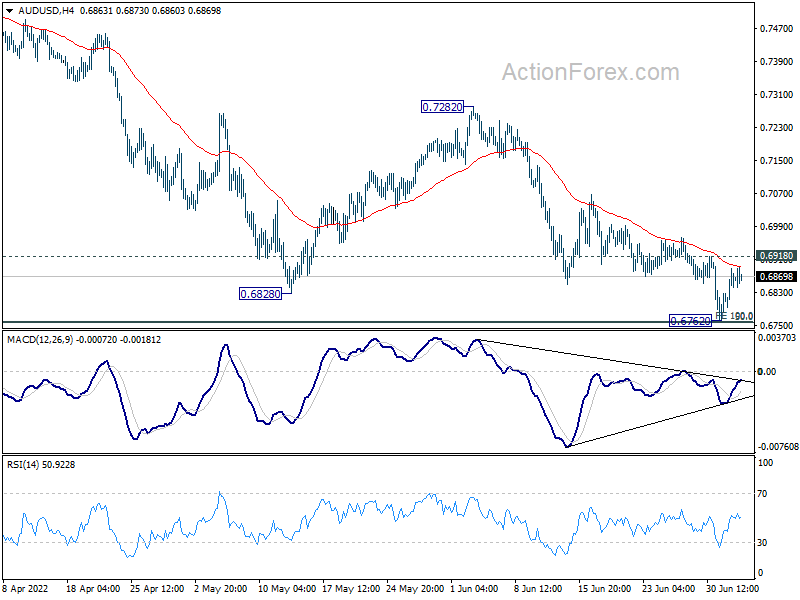
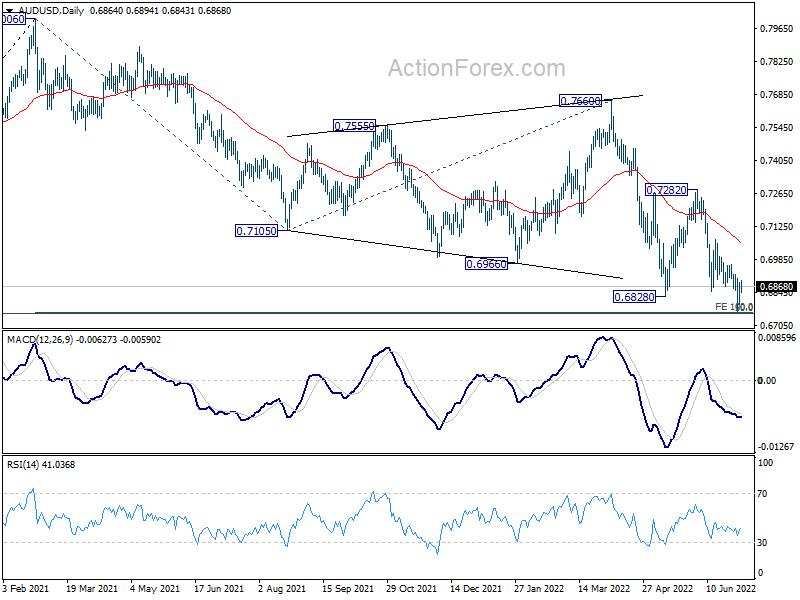
In the bigger picture, price actions from 0.8006 are seen as a corrective pattern to rise from 0.5506 (2020 low). Strong support is expected from 50% retracement of 0.5506 to 0.8006 at 0.6756 to complete the pattern. This coincides with 100% projection of 0.8006 to 0.7105 from 0.7660 at 0.6760. However firm break of 0.6756/60 will raise the chance of bearish reversal and target 61.8% retracement at 0.6461.
Aussie Shrugs RBA Hike, Yen Turning Softer
Aussie is trading in tight range after RBA delivered the 50bps rate hike as expected, and maintained tightening bias. Euro is currently the stronger one for the day, followed by Sterling. On the other hand, Yen is under some selling pressure together with Dollar. The development suggests that risk markets might be ready for a recovery as the US is back for holiday.
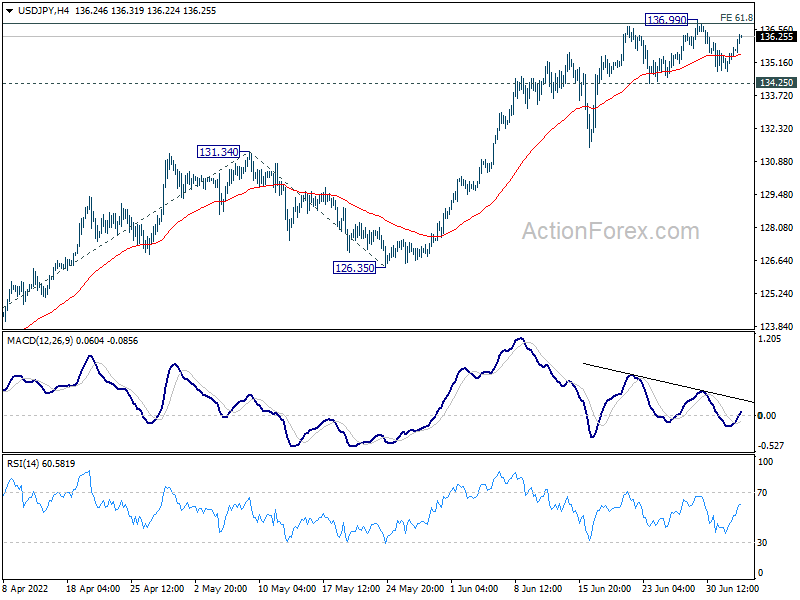
Technically, 136.99 temporary top in USD/JPY will be a focus and break there will resume larger up trend. Such development could help pull other Yen crosses higher. In particular, if that happens, EUR/JPY and GBP/JPY might follow by breaking through 144.26 and 168.67 resistance levels respectively.
In Asia, at the time of writing, Nikkei is up 0.89%. Hong Kong HSI is up 0.65%. China Shanghai SSE is down -0.12%. Singapore Strait Times is down -0.46%. Japan 10-year JGB yield is down -0.0007 at 0.225.
RBA hikes 50bps to 1.35%, more to come
RBA raised cash rate target by 50bps to 1.35% as widely expected. It also increased the interest rate on Exchange Settlement balances by 50bps to 1.25%.
It also maintains tightening bias. "The Board expects to take further steps in the process of normalising monetary conditions in Australia over the months ahead," it said. The timing and size of future hikes will be guided by the incoming data and assessment of the outlook for inflation and the labor market.
RBA also pointed to "behaviour of household spending" as one source of domestic "ongoing uncertainty". Global outlook "remains clouded" by war in Ukraine and the impacts of energy and agriculture prices. There are also ongoing uncertainties related to COVID, especially in China.
Also from Australia, AiG Performance of Construction dropped sharply form 50.4 to 46.2 in June.
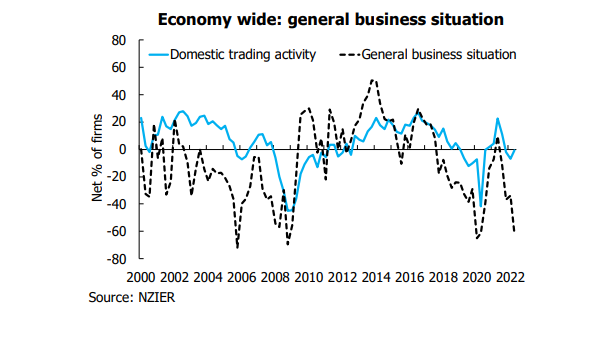
New Zealand business confidence dropped to -65 in Q2
New Zealand NZIER Business Confidence dropped from -40 to -65 in Q2. A net 65% of firms surveyed expected general business conditions to deteriorate. That's the weakest level since Q1 2020.
NZIER said: "For the June quarter, firms saw activity in their own business remaining subdued. Besides the continued uncertainty over the COVID-19 outbreak, businesses are also grappling with the intensification of cost pressures and higher interest rates."
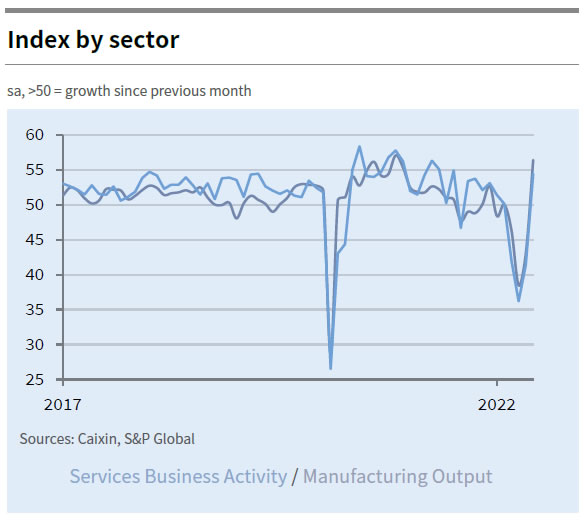
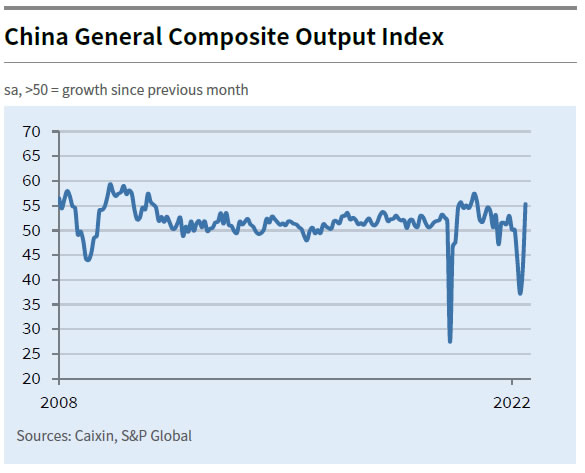
China Caixin PMI services rose to 54.5 in Jun, composite rose to 55.3
China Caixin PMI Services rose from 41.4 to 54.5 in June, above expectation of 49.0. That's the highest level since July 2021, signaling strongest upturn in business activity for 11 months. There were renewed increase in overall sales, despite slight drop in export orders. Inflationary pressures weakened. PMI Composite rose from 42.2 to 55.3.
Wang Zhe, Senior Economist at Caixin Insight Group said: "Overall, regional Covid outbreaks were put under control and restrictions were loosened in June, facilitating a gradual recovery in business operations. The supply side was the first to reflect improvements in production and logistics, while it will take more time to restore demand. The rebound in the services sector, which was hit harder by Covid outbreaks, was stronger than that of the manufacturing sector. Job creation lagged behind these positive developments, with the gauge for employment remaining in contractionary territory. Manufacturers still faced high cost pressure and profit challenges."
Looking ahead
France industrial production and Eurozone PMI services final will be released in European session. UK will also release PMI services final. Later in the day, Canada building permits and US factory orders will be featured.
AUD/USD Daily Report
Daily Pivots: (S1) 0.6810; (P) 0.6849; (R1) 0.6905; More...
AUD/USD is staying in range of 0.6762/6918 and intraday bias remains neutral first. Strong support could still be seen from 0.6756/60 cluster support to complete the whole correction from 0.8006, and bring rebound. On the upside, above 0.6918 resistance will indicate short term bottoming, and turn bias back to the upside for 0.7282 resistance. However, sustained break of 0.6756/60 will carry larger bearish implication and target 0.6461 fibonacci level next.
In the bigger picture, price actions from 0.8006 are seen as a corrective pattern to rise from 0.5506 (2020 low). Strong support is expected from 50% retracement of 0.5506 to 0.8006 at 0.6756 to complete the pattern. This coincides with 100% projection of 0.8006 to 0.7105 from 0.7660 at 0.6760. However firm break of 0.6756/60 will raise the chance of bearish reversal and target 61.8% retracement at 0.6461.
Economic Indicators Update
| GMT | Ccy | Events | Actual | Forecast | Previous | Revised |
|---|---|---|---|---|---|---|
| 22:00 | NZD | NZIER Business Confidence Q2 | -65 | -40 | ||
| 22:30 | AUD | AiG Performance of Construction Index Jun | 46.2 | 50.4 | ||
| 23:30 | JPY | Labor Cash Earnings Y/Y May | 1.00% | 1.50% | 1.70% | |
| 01:45 | CNY | Caixin Services PMI Jun | 54.5 | 49 | 41.4 | |
| 04:30 | AUD | RBA Rate Decision | 1.35% | 1.35% | 0.85% | |
| 06:45 | EUR | France Industrial Output M/M May | 0.50% | -0.10% | ||
| 07:45 | EUR | Italy Services PMI Jun | 51.5 | 53.7 | ||
| 07:50 | EUR | France Services PMI Jun F | 54.4 | 54.4 | ||
| 07:55 | EUR | Germany Services PMI Jun F | 52.4 | 52.4 | ||
| 08:00 | EUR | Eurozone Services PMI Jun F | 52.8 | 52.8 | ||
| 08:30 | GBP | Services PMI Jun F | 53.4 | 53.4 | ||
| 12:30 | CAD | Building Permits M/M May | -1.40% | -0.60% | ||
| 14:00 | USD | Factory Orders M/M May | 0.50% | 0.30% |
RBA hikes 50bps to 1.35%, more to come
RBA raised cash rate target by 50bps to 1.35% as widely expected. It also increased the interest rate on Exchange Settlement balances by 50bps to 1.25%.
It also maintains tightening bias. "The Board expects to take further steps in the process of normalising monetary conditions in Australia over the months ahead," it said. The timing and size of future hikes will be guided by the incoming data and assessment of the outlook for inflation and the labor market.
RBA also pointed to "behaviour of household spending" as one source of domestic "ongoing uncertainty". Global outlook "remains clouded" by war in Ukraine and the impacts of energy and agriculture prices. There are also ongoing uncertainties related to COVID, especially in China.
China Caixin PMI services rose to 54.5 in Jun, composite rose to 55.3
China Caixin PMI Services rose from 41.4 to 54.5 in June, above expectation of 49.0. That's the highest level since July 2021, signaling strongest upturn in business activity for 11 months. There were renewed increase in overall sales, despite slight drop in export orders. Inflationary pressures weakened. PMI Composite rose from 42.2 to 55.3.
Wang Zhe, Senior Economist at Caixin Insight Group said: "Overall, regional Covid outbreaks were put under control and restrictions were loosened in June, facilitating a gradual recovery in business operations. The supply side was the first to reflect improvements in production and logistics, while it will take more time to restore demand. The rebound in the services sector, which was hit harder by Covid outbreaks, was stronger than that of the manufacturing sector. Job creation lagged behind these positive developments, with the gauge for employment remaining in contractionary territory. Manufacturers still faced high cost pressure and profit challenges."
New Zealand business confidence dropped to -65 in Q2
New Zealand NZIER Business Confidence dropped from -40 to -65 in Q2. A net 65% of firms surveyed expected general business conditions to deteriorate. That's the weakest level since Q1 2020.
NZIER said: "For the June quarter, firms saw activity in their own business remaining subdued. Besides the continued uncertainty over the COVID-19 outbreak, businesses are also grappling with the intensification of cost pressures and higher interest rates."
(RBA) Statement by Philip Lowe, Governor: Monetary Policy Decision
At its meeting today, the Board decided to increase the cash rate target by 50 basis points to 1.35 per cent. It also increased the interest rate on Exchange Settlement balances by 50 basis points to 1.25 per cent.
Global inflation is high. It is being boosted by COVID-related disruptions to supply chains, the war in Ukraine and strong demand which is putting pressure on productive capacity. Monetary policy globally is responding to this higher inflation, although it will be some time yet before inflation returns to target in most countries.
Inflation in Australia is also high, but not as high as it is in many other countries. Global factors account for much of the increase in inflation in Australia, but domestic factors are also playing a role. Strong demand, a tight labour market and capacity constraints in some sectors are contributing to the upward pressure on prices. The floods are also affecting some prices.
Inflation is forecast to peak later this year and then decline back towards the 2–3 per cent range next year. As global supply-side problems continue to ease and commodity prices stabilise, even if at a high level, inflation is expected to moderate. Higher interest rates will also help establish a more sustainable balance between the demand for and the supply of goods and services. Medium-term inflation expectations remain well anchored and it is important that this remains the case. A full set of updated forecasts will be published next month following the release of the June quarter CPI.
The Australian economy remains resilient and the labour market is tighter than it has been for some time. The unemployment rate was steady at 3.9 per cent in May, the lowest rate in almost 50 years. Underemployment has also fallen significantly. Job vacancies and job ads are both at very high levels and a further decline in unemployment and underemployment is expected over the months ahead. The Bank's business liaison program and business surveys continue to point to a lift in wages growth from the low rates of recent years as firms compete for staff in the tight labour market.
One source of ongoing uncertainty about the economic outlook is the behaviour of household spending. The recent spending data have been positive, although household budgets are under pressure from higher prices and higher interest rates. Housing prices have also declined in some markets over recent months after the large increases of recent years. The household saving rate remains higher than it was before the pandemic and many households have built up large financial buffers and are benefiting from stronger income growth. The Board will be paying close attention to these various influences on household spending as it assesses the appropriate setting of monetary policy.
The Board will also be paying close attention to the global outlook, which remains clouded by the war in Ukraine and its effect on the prices for energy and agricultural commodities. Real household incomes are under pressure in many economies and financial conditions are tightening, as central banks increase interest rates. There are also ongoing uncertainties related to COVID, especially in China.
Today's increase in interest rates is a further step in the withdrawal of the extraordinary monetary support that was put in place to help insure the Australian economy against the worst possible effects of the pandemic. The resilience of the economy and the higher inflation mean that this extraordinary support is no longer needed. The Board expects to take further steps in the process of normalising monetary conditions in Australia over the months ahead. The size and timing of future interest rate increases will be guided by the incoming data and the Board's assessment of the outlook for inflation and the labour market. The Board is committed to doing what is necessary to ensure that inflation in Australia returns to target over time.
Technical Outlook and Review
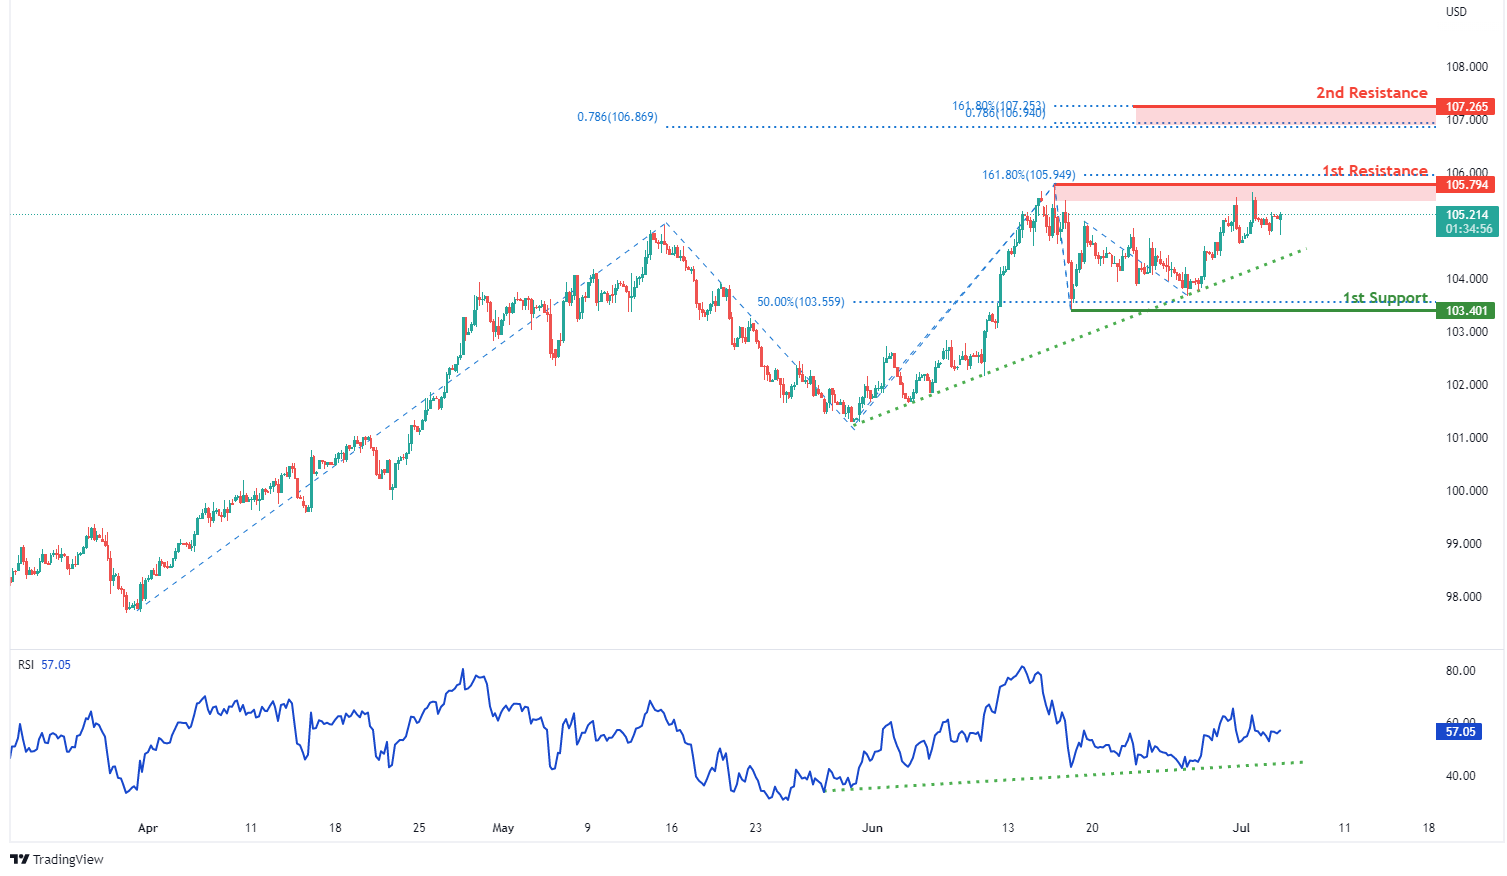
DXY:
On the H4, with RSI moving along an ascending trendline and prices moving along the ascending trendline, we have a bullish bias that bullish momentum will carry prices to 1st resistance at 105.794 where the swing high resistance and 161.8% fibonacci extension are. Once we have upside confirmation, we would expect bullish momentum to carry prices to 2nd resistance at 107.265 in line with 161.8% fibonacci extension, 78.6% fibonacci projection and 78.6% fibonacci projection. Alternatively, price may drop to 1st support at 103.401 where the horizontal swing low support and 50% fibonacci retracement are.
Areas of consideration:
- H4 time frame, 1st resistance at 105.794
- H4 time frame, 1st support at 103.401
XAU/USD (GOLD):
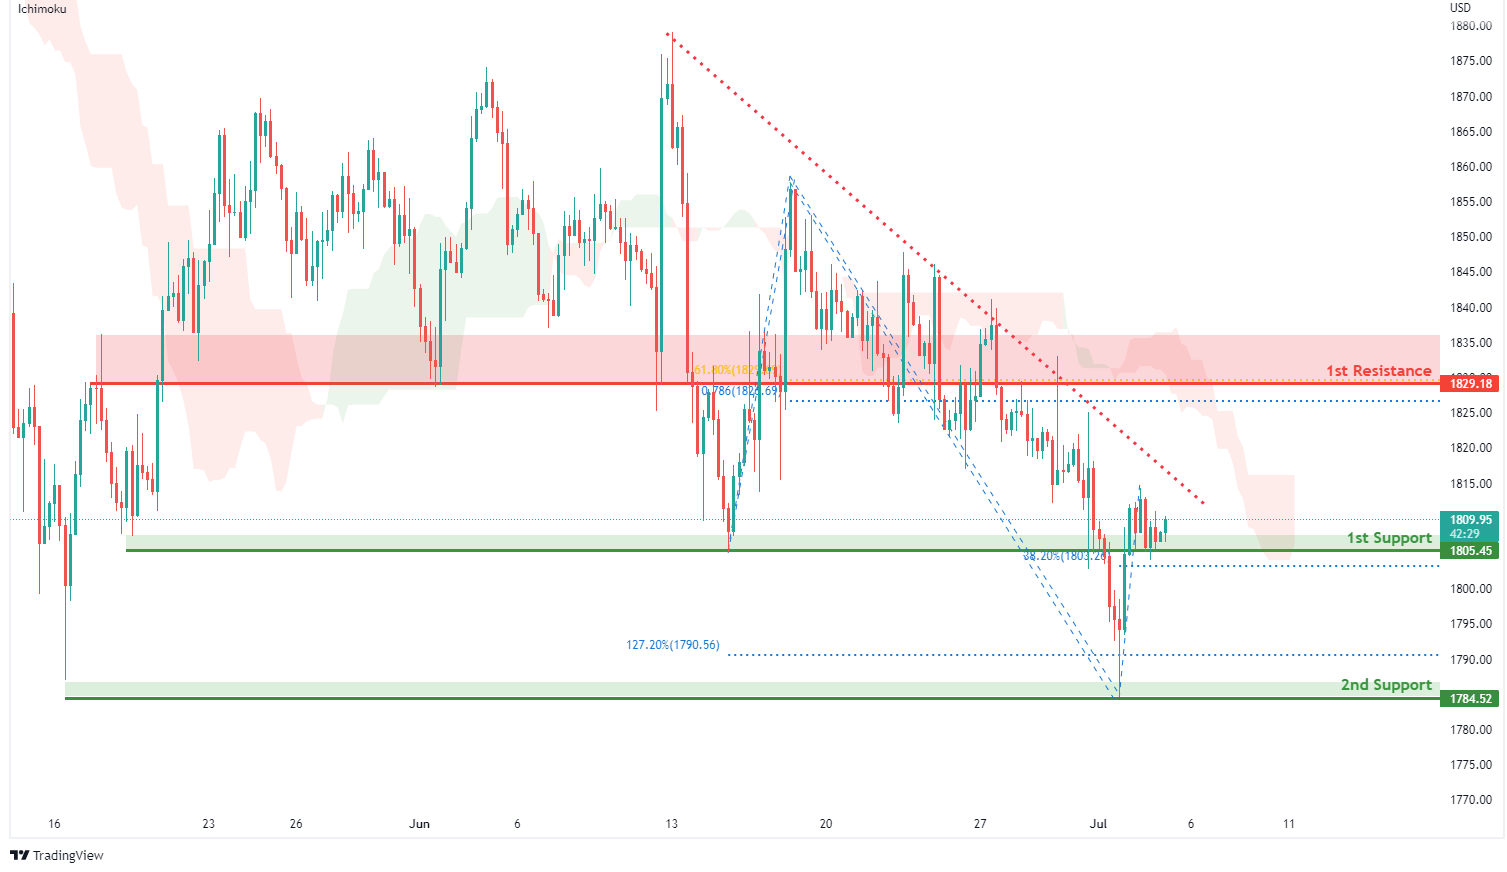
On the H4, with prices moving below the ichimoku indicator and along a descending trendline, we have a bearish bias that prices will drop to our 1st support at 1805.45 where the horizontal overlap support and 38.2% fibonacci retracement. Once we have downside confirmation, we would expect bearish momentum to carry price to 2nd support at 1784.52 in line with swing low support and 127.2% fibonacci extension. Alternatively, price could rise to our 1st resistance at 1829.18 in line with overlap resistance, 61.8% fibonacci retracement and 78.6% fibonacci projection.
Areas of consideration:
- H4 time frame, 1st Resistance at 1829.18
- H4 time frame, 1st Support at 1805.45
GBP/USD:
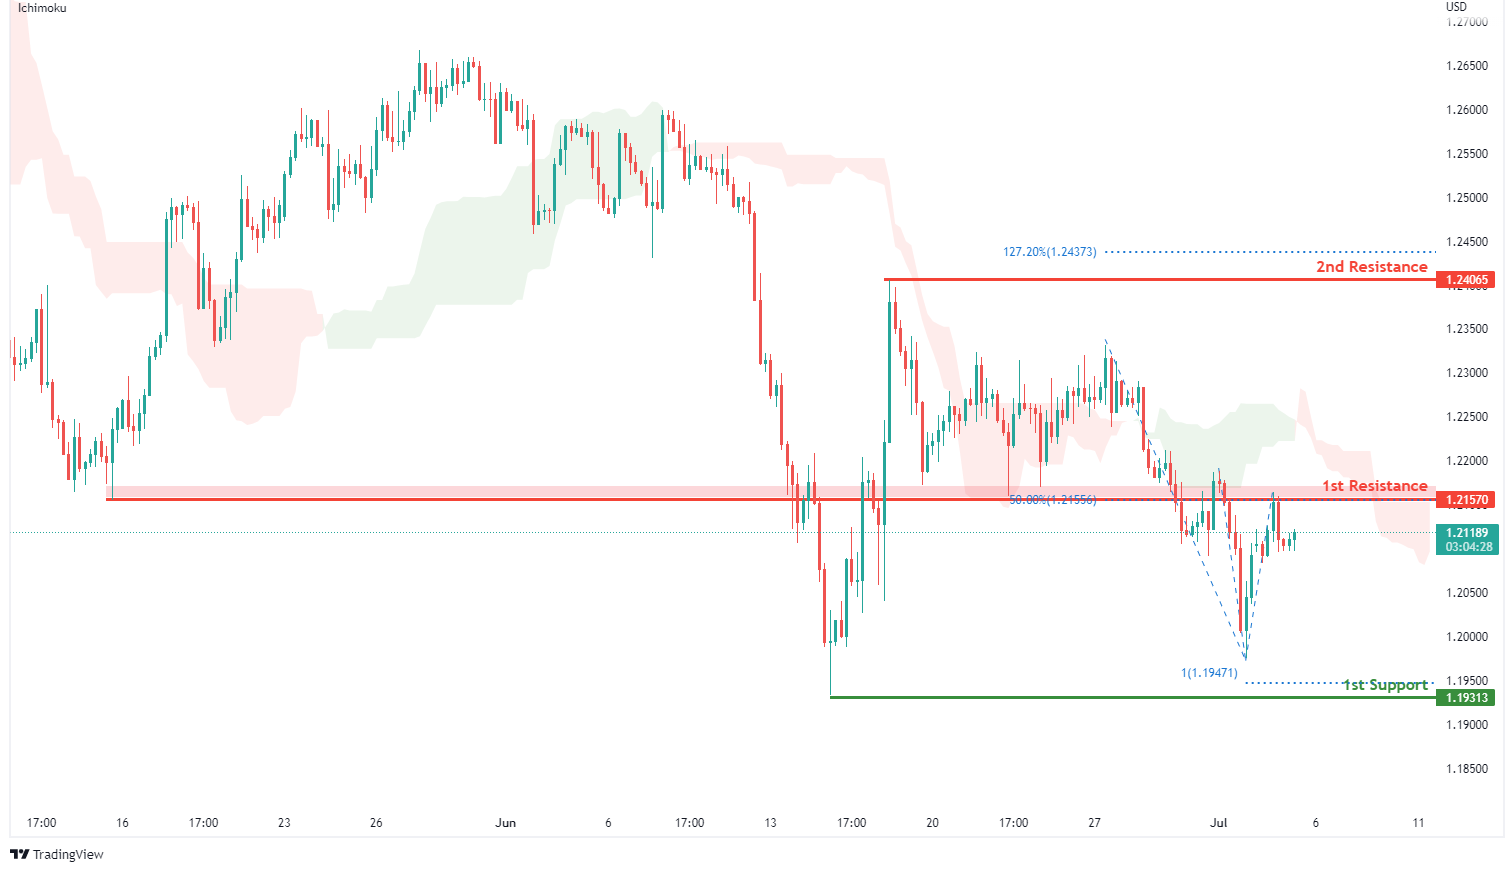
On the H4, with prices moving below the ichimoku indicator, we have a bearish bias that price will rise and drop from our 1st resistance at 1.21570 where the horizontal overlap resistance and 50% fibonacci retracement are to our 1st support at 1.19313 where the horizontal swing low support and 100% fibonacci projection are. Alternatively, price could rise above 1st resistance structure and head to 2nd resistance at 1.24065 in line with the swing high resistance and 127.2% fibonacci extension.
Areas of consideration:
- H4 1st resistance at 1.21570
- H4 1st support at 1.19313
USD/CHF:
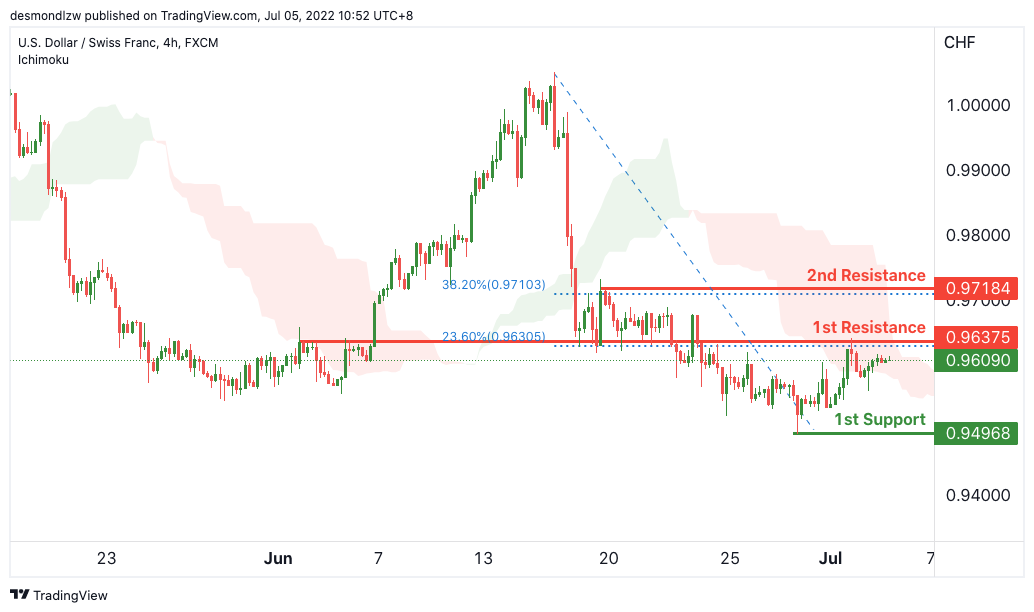
On the H4, with price moving below the ichimoku cloud , we have a bearish bias that price will continue to drop from the 1st resistance at 0.96375 in line with the horizontal pullback resistance and 23.6% Fibonacci retracement to the 1st support at 0.94968 in line with the horizontal swing low support. Alternatively, price may reverse off the 1st resistance and rise to the 2nd resistance where the 38.2% Fibonacci retracement and pullback resistance is.
Areas of consideration
- 1st support level at 0.94968
- 1st resistance level at 0.96375
EUR/USD :
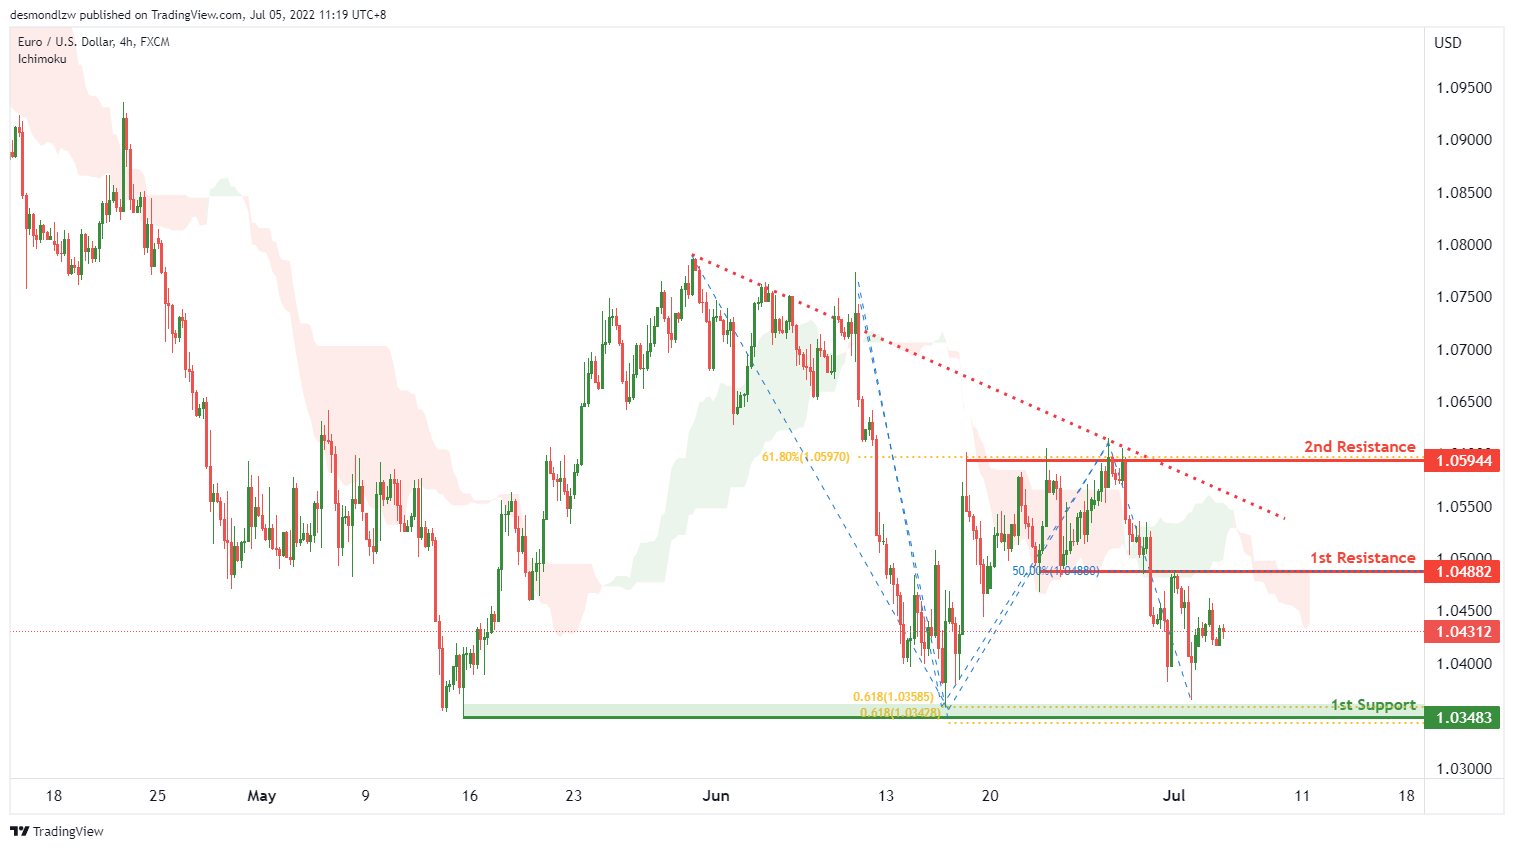
On the H4, with price moving below the ichimoku cloud and in a descending trendline, we have a bearish bias that price will continue to drop from the 1st resistance at 1.04882 at the overlap resistance to the 1st support at 1.03483 at the swing low in line with the two 61.8% fibonacci projections. Alternatively, price may reverse off the 1st resistance and rise to the 2nd resistance at the multiple swing high in line with the 61.8% fibonacci retracement.
Areas of consideration :
- H4 1st resistance at 1.04882
- H4 1st support at 1.03483
USD/JPY:
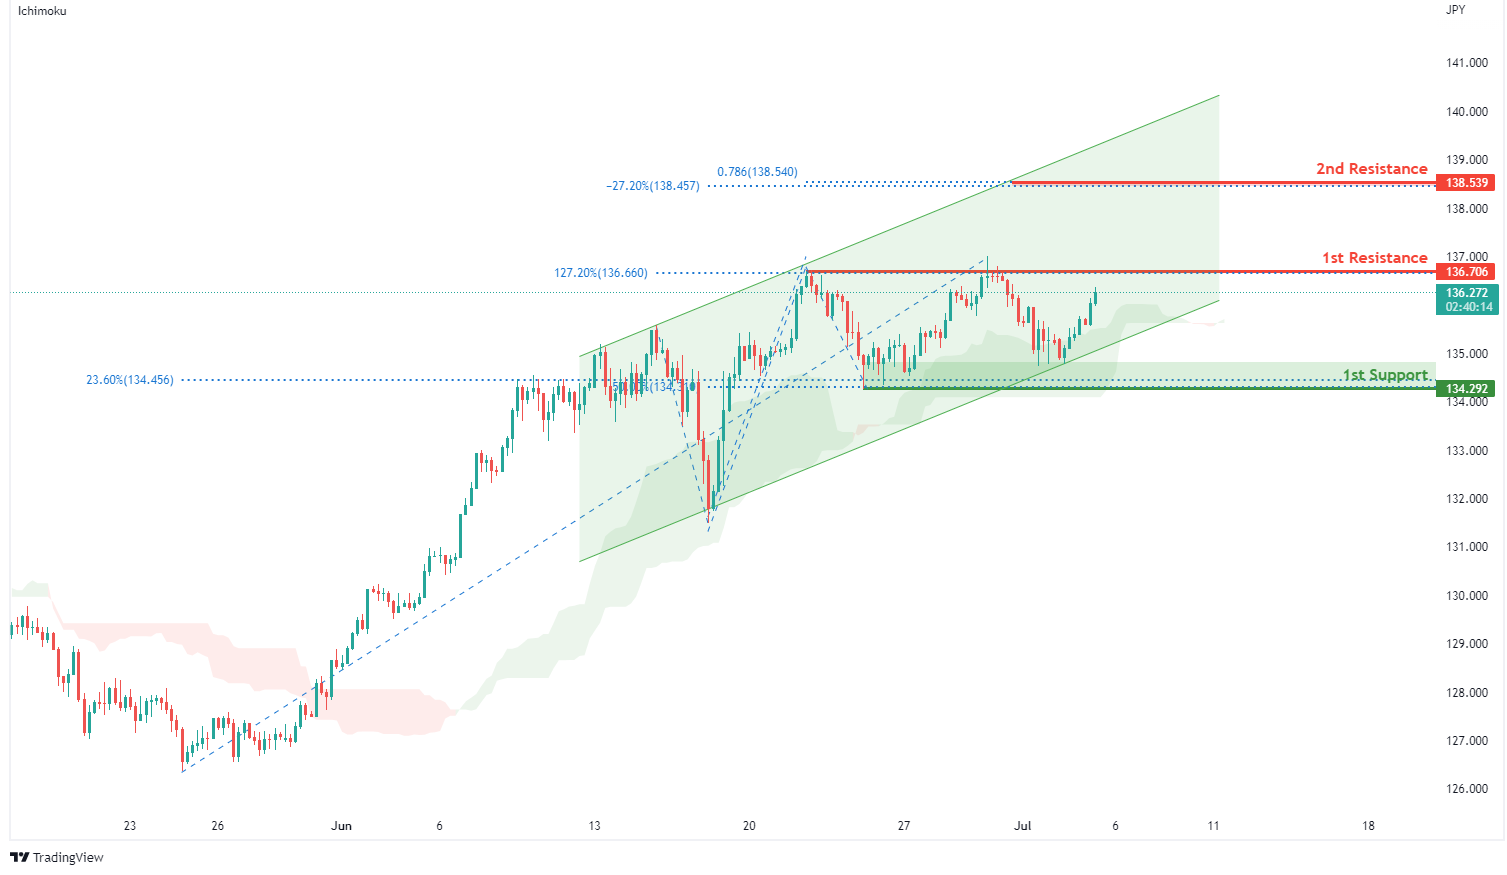
On the H4, with price moving within an ascending channel and above the ichimoku indicator, we have a bullish bias that price will rise to our 1st resistance at 136.706 where the swing high resistance and 127.2% fibonacci extension are. Once there is upside confirmation that price has broken past the 1st resistance, we would expect bullish momentum to carry price to our 2nd resistance at 138.539 where the -27.2% fibonacci expansion and 78.6% fibonacci projection are. Alternatively, price may drop to 1st support at 134.292 in line with the swing low support, 23.6% fibonacci retracement and 50% fibonacci retracement.
Areas of consideration:
- H4 time frame, 1st resistance at 136.706
- H4 time frame, 1st support at 134.292
AUD/USD:
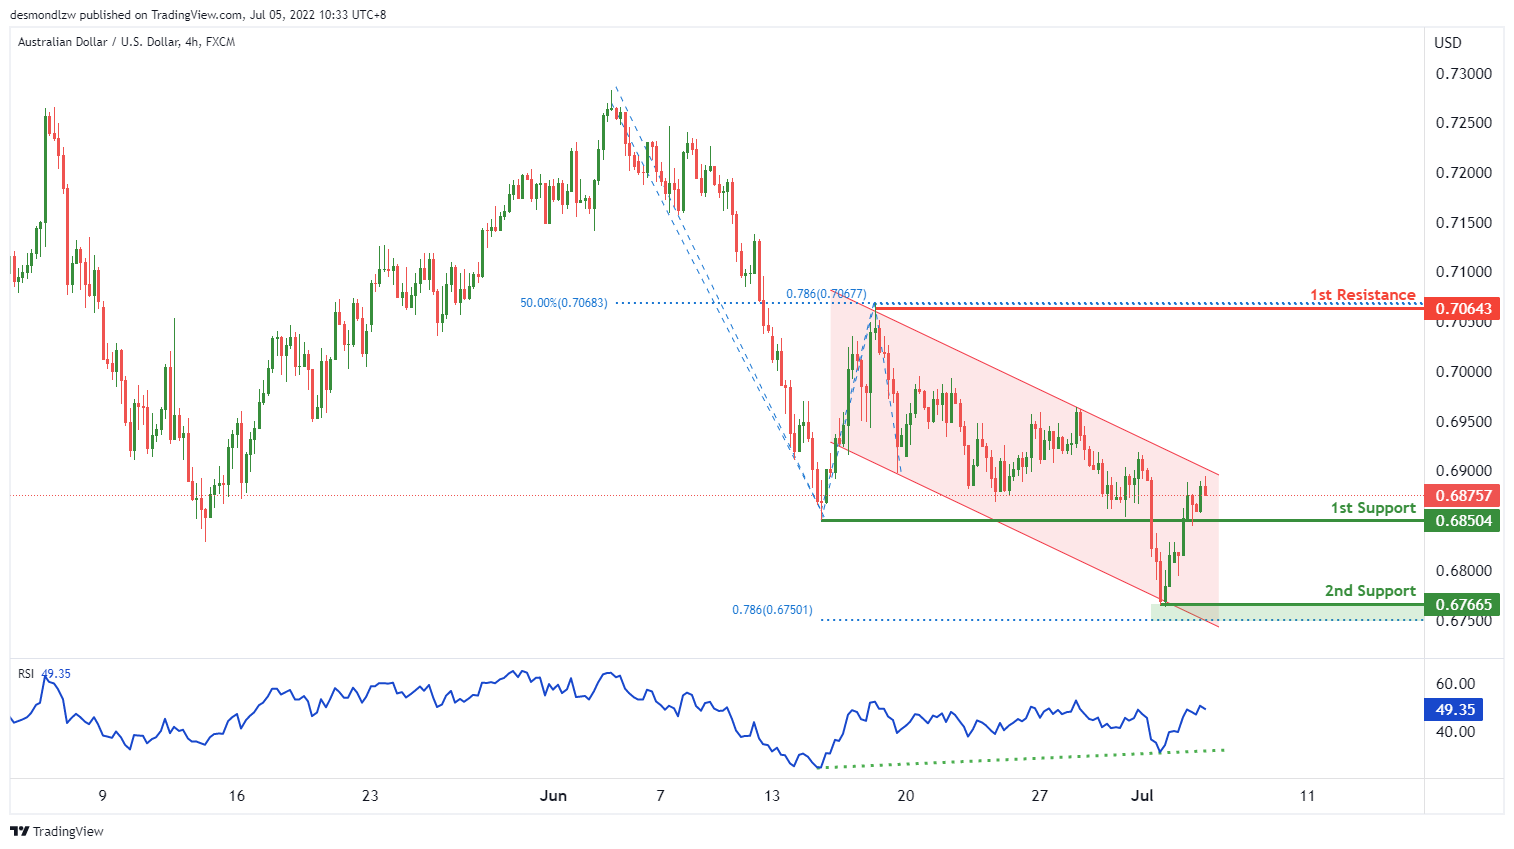
On the H4, with price moving in a descending trend channel but in an ascending trendline on the RSI, there is a bullish divergence, and we have a bullish bias that price will rise from the 1st support at 0.68504 at the pullback support to the 1st resistance at 0.70643 at the swing high in line with the 50% fibonacci retracement and 78.6% fibonacci projection. Alternatively, price may reverse off the 1st support and drop to the 2nd support at 0.67665 at the swing low in line with the 78.6% fibonacci projection.
Areas of consideration
- H4 1st resistance at 0.70643
- H4 1st support at 0.68504
NZD/USD:
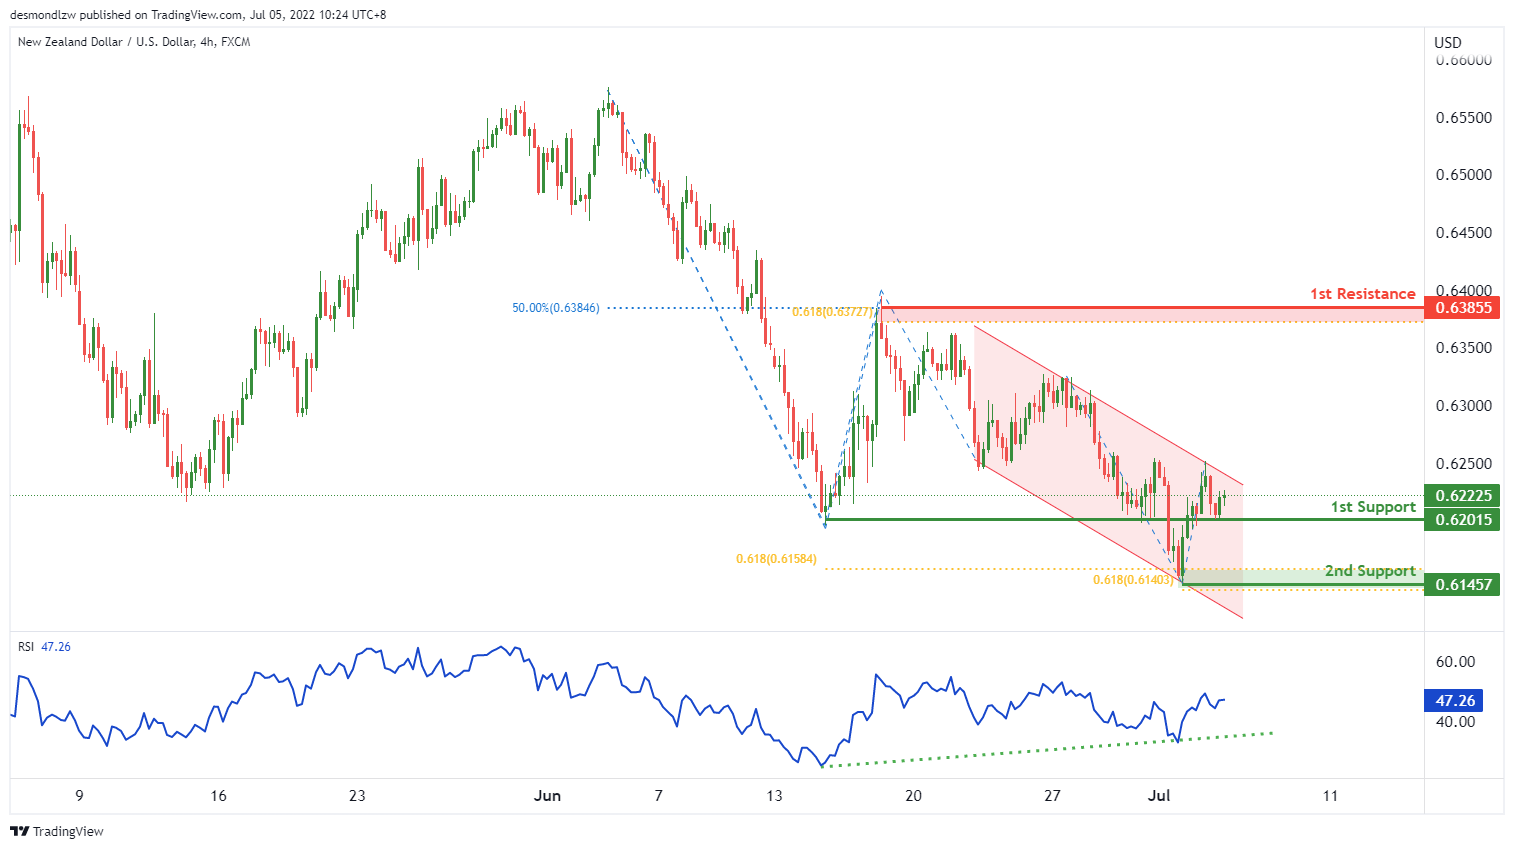
On the H4, with price moving in a descending trend channel but in an ascending trendline on the RSI, there is a bullish divergence, and we have a bullish bias that price will rise from the 1st support at 0.62015 at the pullback support to the 1st resistance at 0.63855 at the swing high in line with the 50% fibonacci retracement and 61.8% fibonacci projection. Alternatively, price may reverse off the 1st support and drop to the 2nd support at 0.61457 at the swing low in line with the two 61.8% fibonacci projections.
Areas of consideration:
- H4 time frame, 1st support at 0.62015
- H4 time frame, 1st resistance at 0.63855
USD/CAD:
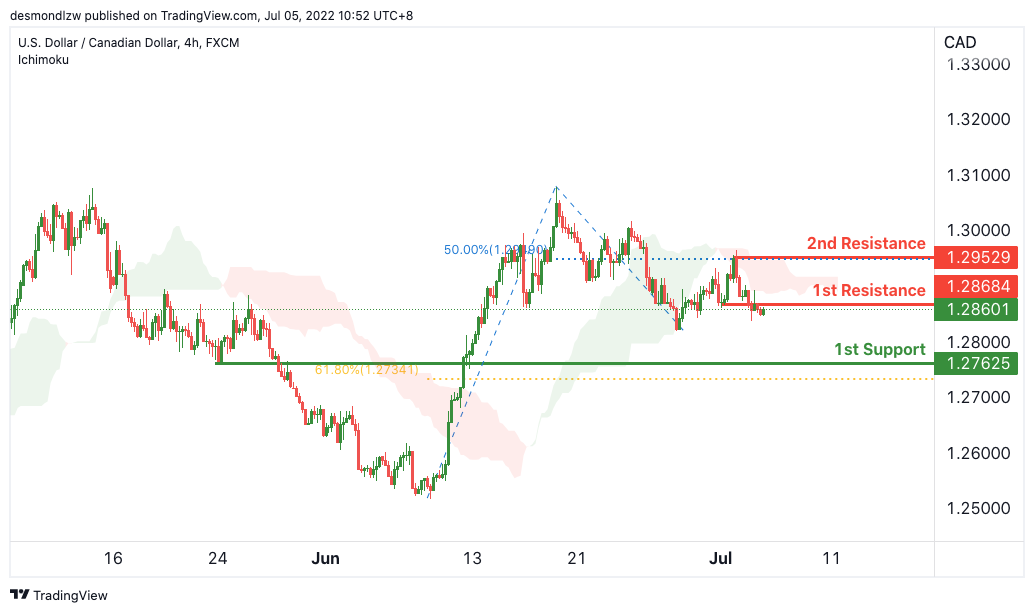
On the H4, with price moving below the ichimoku cloud , we have a bearish bias that price will continue to drop from the 1st resistance at 1.28684 in line with the horizontal pullback resistance to the 1st support at 1.27625 in line with the horizontal pullback support and 61.8% Fibonacci retracement. Alternatively, price may reverse off the 1st resistance and rise to the 2nd resistance where the 50% Fibonacci retracement and swing high resistance is.
Areas of consideration:
- H4 time frame, 1st resistance at 1.28684
- H4 time frame, 1st support at .27625
OIL:
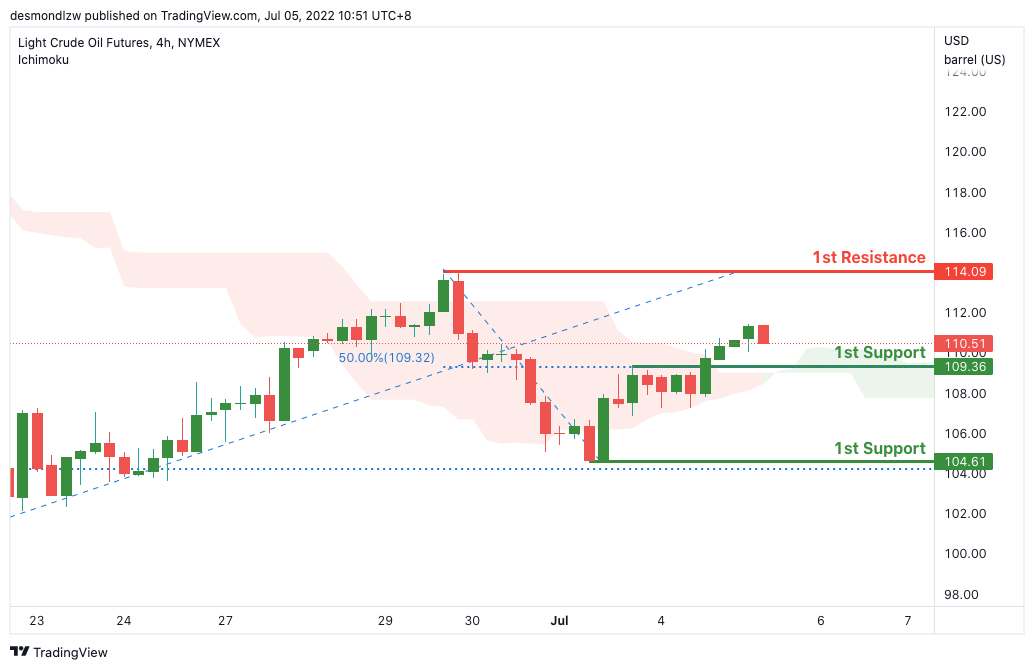
On the H4, with price moving above the ichimoku cloud, we have a bullish bias that price will rise from our 1st support at 109.36 where the horizontal pullback support and 50% Fibonacci retracement are to our 1st resistance at 114.09 in line with the horizontal swing high resistance. Alternatively, price may break 1st support and head for 2nd support at 104.61 where the horizontal swing low support.
Areas of consideration:
- H4 time frame, 1st resistance of 109.36
- H4 time frame, 1st support of 104.41
Dow Jones Industrial Average:
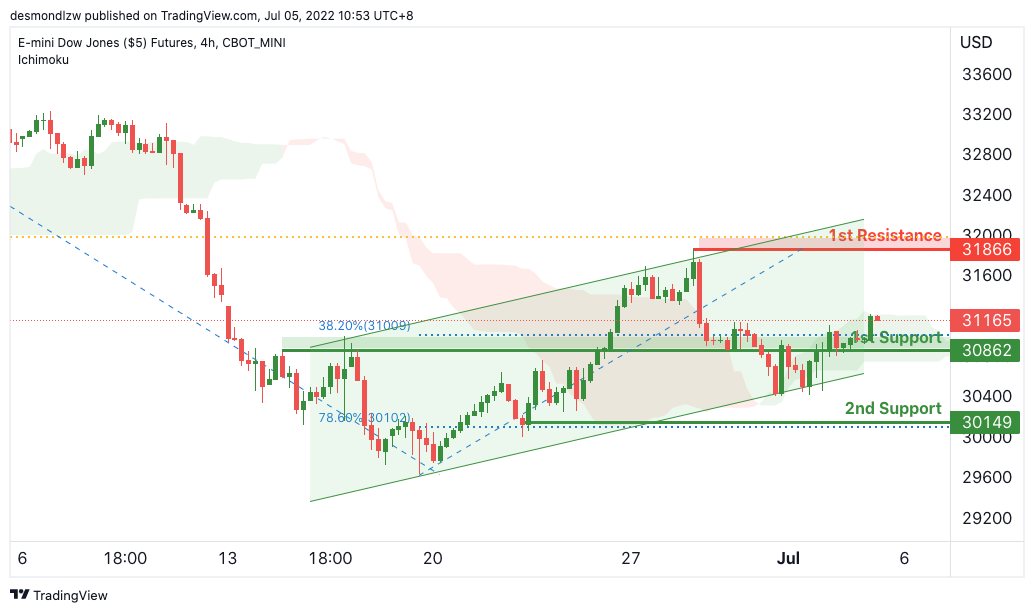
On the H4, with price moving along an ascending channel and expected to break out of the ichimoku cloud, we have a bullish bias that price will rise from our 1st support at 30862 where the horizontal pullback support and 38.2% Fibonacci retracement are to our 1st resistance at 31866 in line with the horizontal swing high resistance and 61.8% fibonacci retracement. Alternatively, price may break 1st support and head for 2nd support at 30149 where the horizontal swing low support and 78.6% fibonacci retracement are. Take note we are waiting for the break of the 1st resistance to confirm the bullish move.
Areas of consideration:
- H4 time frame, 1st resistance of 31866
- H4 time frame, 1st support of 30862
Elliott Wave View: Dollar Index (DXY) Remains Bullish
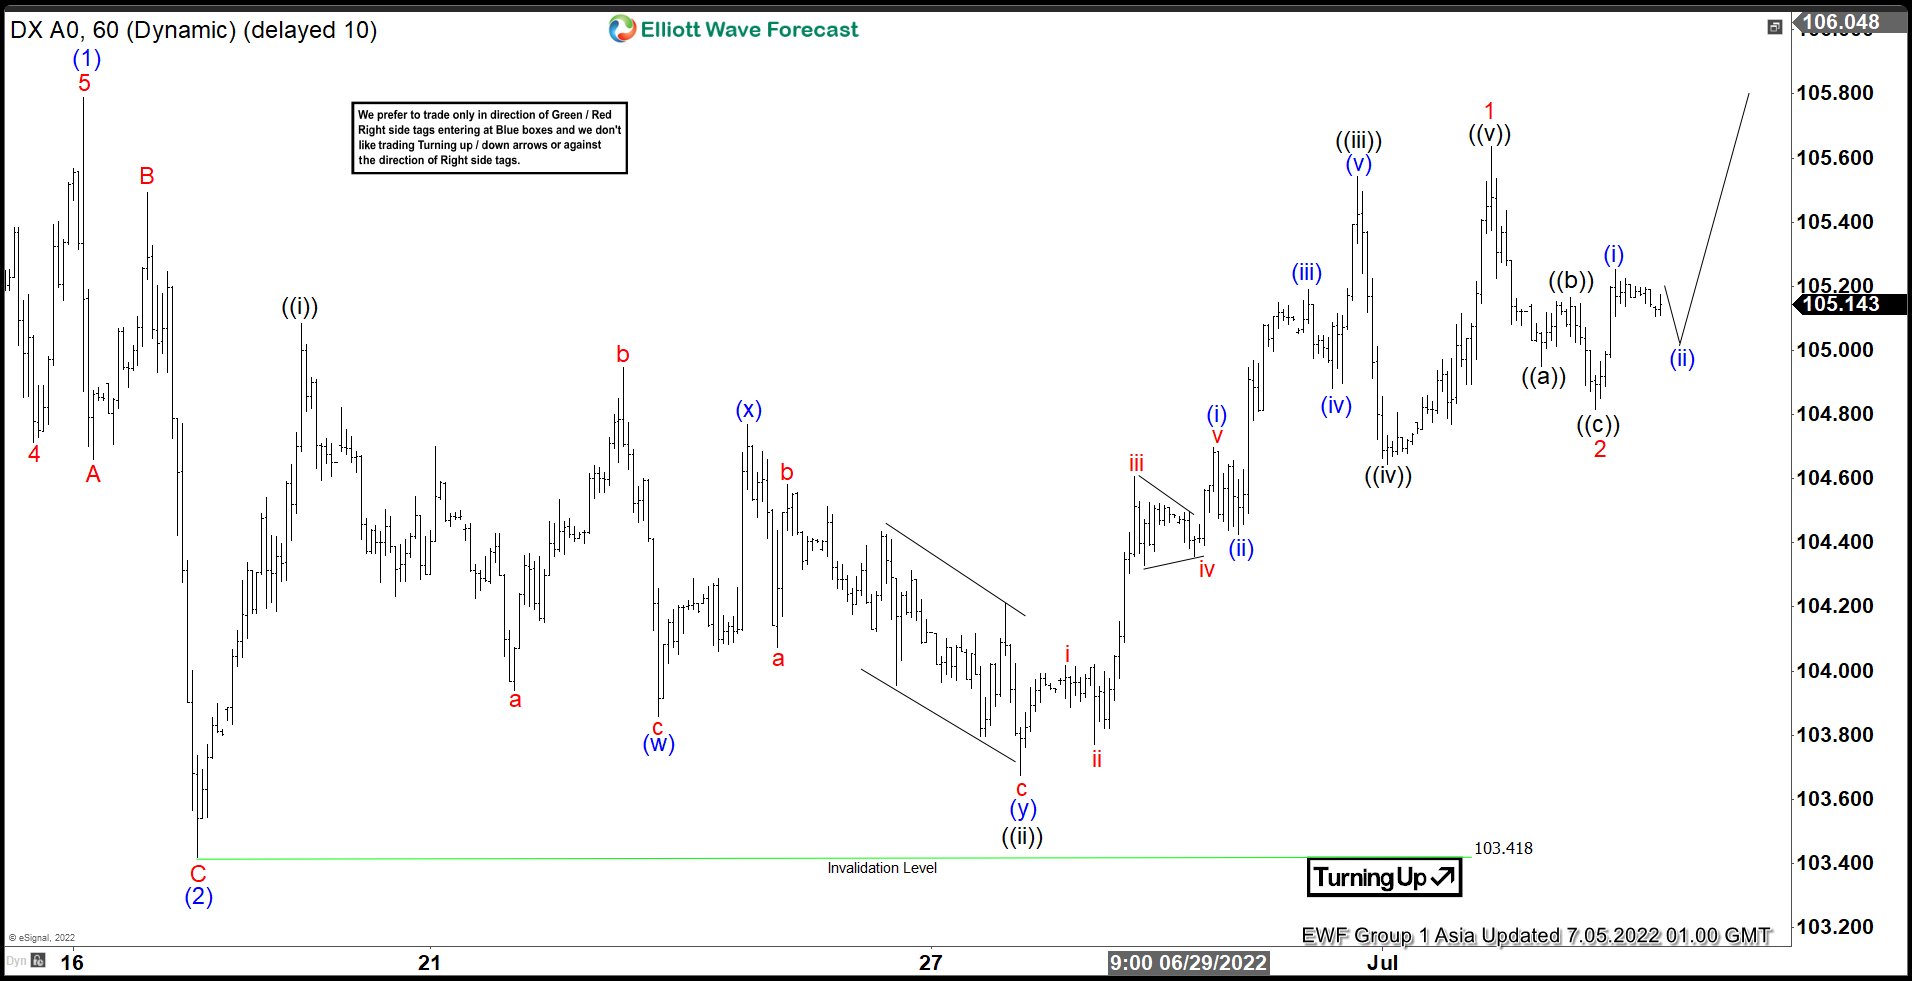
Short term Elliott Wave view in Dollar Index suggests rally to 105.78 ended wave (1). Wave (2) pullback ended at 103.41 with subdivision as a zigzag Elliott Wave structure. Down from wave (1), wave A ended at 104.66 and wave B ended at 105.49. Index extended lower in wave C towards 103.41 to complete wave (2). Index has resumed higher in wave (3), but it still needs to break above wave (1) at 105.78 to validate this view and rule out a double correction in wave (2).
Internal subdivision of wave (3) is unfolding as a 5 waves impulse structure. Up from wave (2), wave ((i)) ended at 105.08, and dips in wave ((ii)) ended at 103.67. Index then resumes higher in wave ((iii)) towards 105.54, and pullback in wave ((iv)) ended at 104.64. Final leg higher wave ((v)) ended at 105.63 which completed wave 1. Pullback in wave 2 ended at 104.81 with internal subdivision as a zigzag in lesser degree. Down from wave 1, wave ((a)) ended at 104.95, wave ((b)) ended at 105.16, and wave ((c)) ended at 104.81. Near term, while dips stay above 103.41, expect the Index to extend higher.
DXY 60 Minutes Elliott Wave Chart
Platinum Support Area
The Fed’s aggressive rate hikes to fight inflation has caused deterioration in economic outlook. Atlanta Fed’s GDP gauge now sees the second quarter running at – 2.1%. With the first quarter’s decline of 1.6%, this makes it two quarters in a row with negative GDP. This fits with the technical definition of a recession. As a result of the aggressive rate hikes, all risk assets including stock, commodities, and cryptos have been hit really hard while US Dollar has rallied very strongly. In today’s update, we will look specifically at Platinum to see a possible support area.
Platinum Monthly Elliott Wave Chart
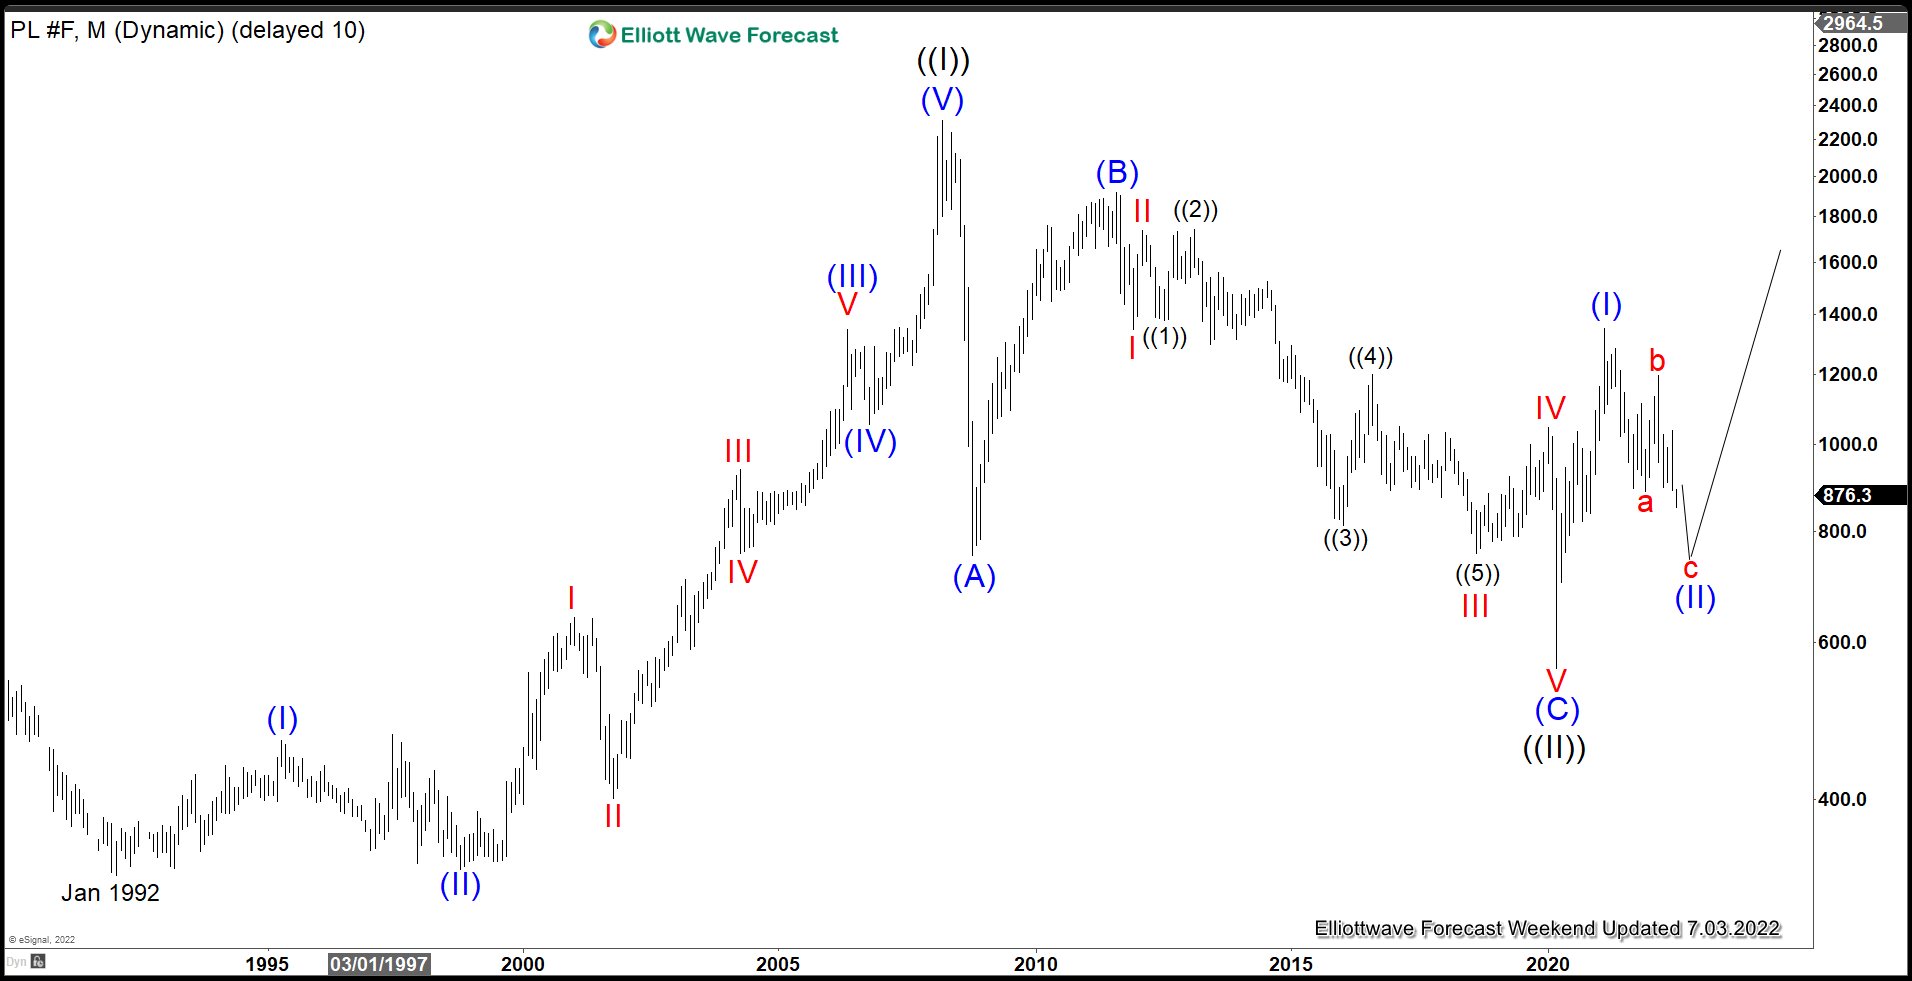
Monthly Elliott Wave in Platinum above suggests that the metal has ended Grand Super Cycle wave ((II)) pullback at $562. This ended the multi-decade correction to the cycle from January 1992. From there, Platinum has started a new bullish leg higher in wave ((III)). Up from wave ((II)), wave (I) ended at $1348.2. Wave ((II)) pullback is now in progress to correct cycle from 3/16/2020 low before the next leg higher. Let’s look at the daily chart below to get better look of the potential support area.
Platinum Daily Elliott Wave Chart
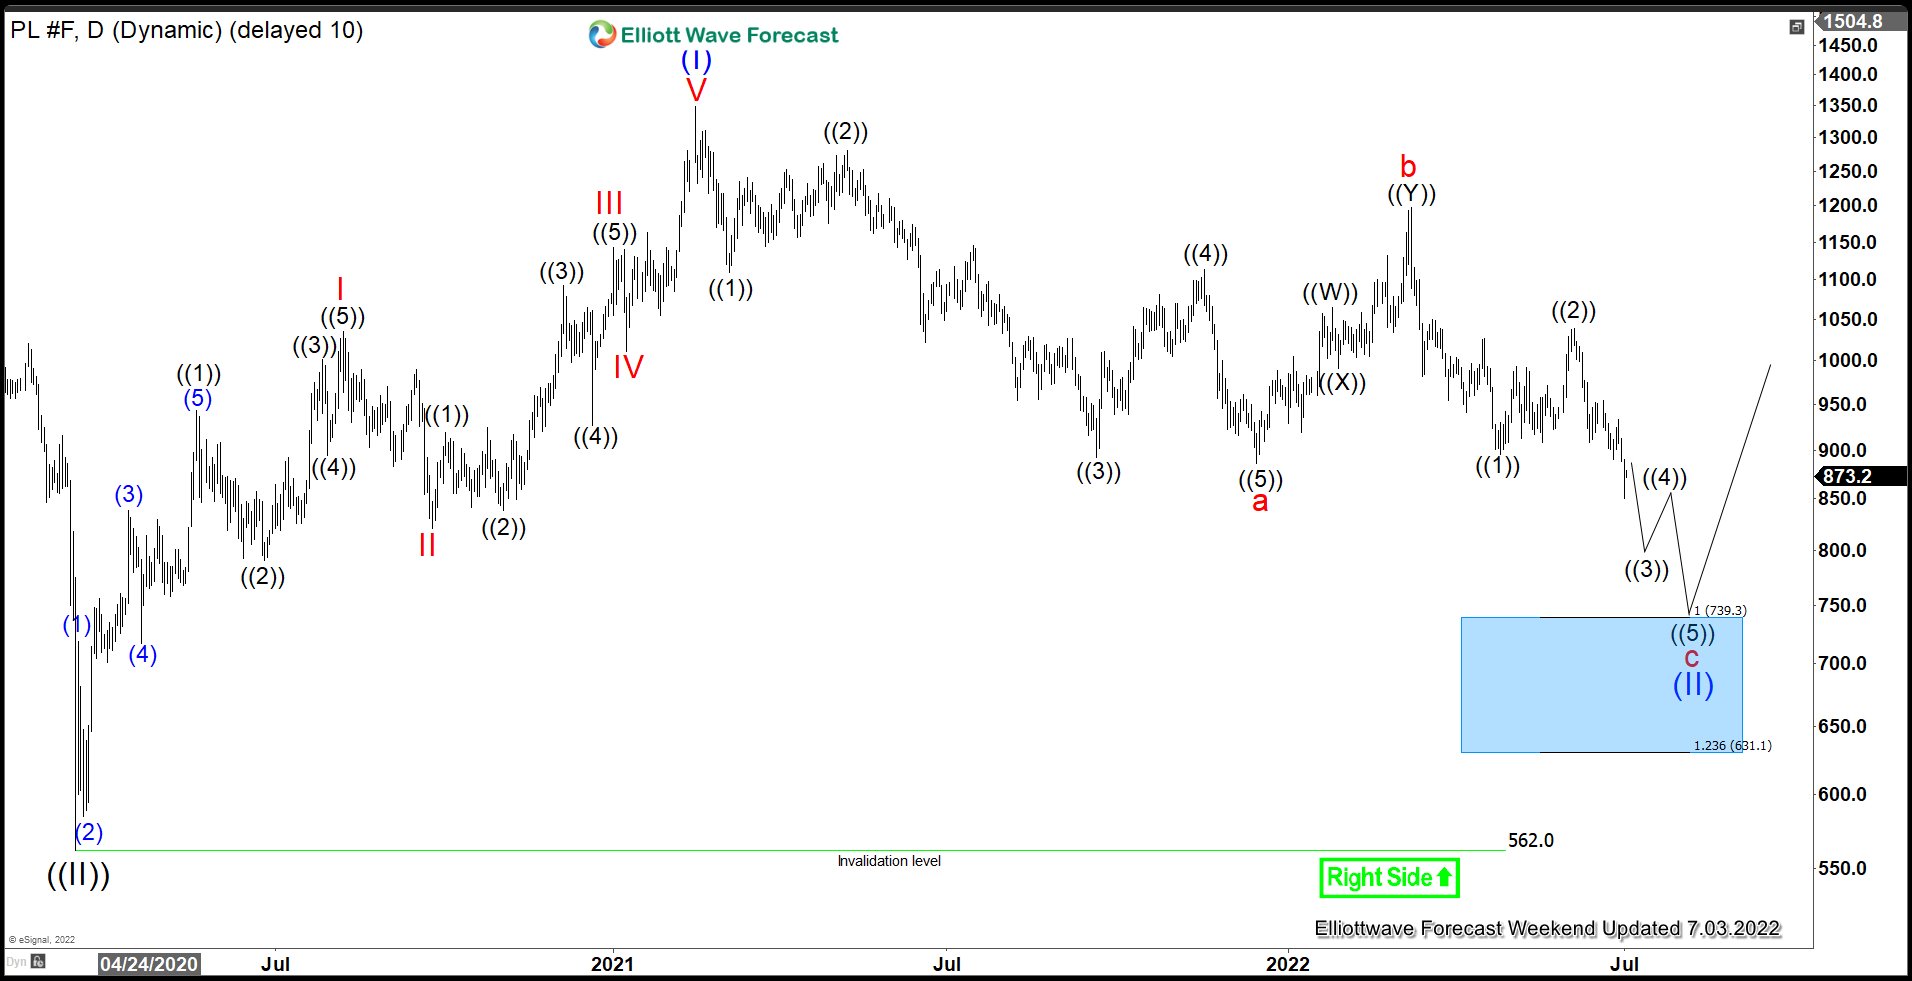
Daily Elliott Wave chart of Platinum above shows the potential support area for wave (II). The pullback is unfolding as a zigzag Elliott Wave structure. Down from wave (I), wave a ended at $886, and wave b ended at $1197. Wave c target can be measured as 100% – 123.6% Fibonacci extension of wave a which comes at $631 – $739 area. This area should see buyers for the next leg higher and give a good buying opportunity.
EURNZD Buying The Dips At The Blue Box Area
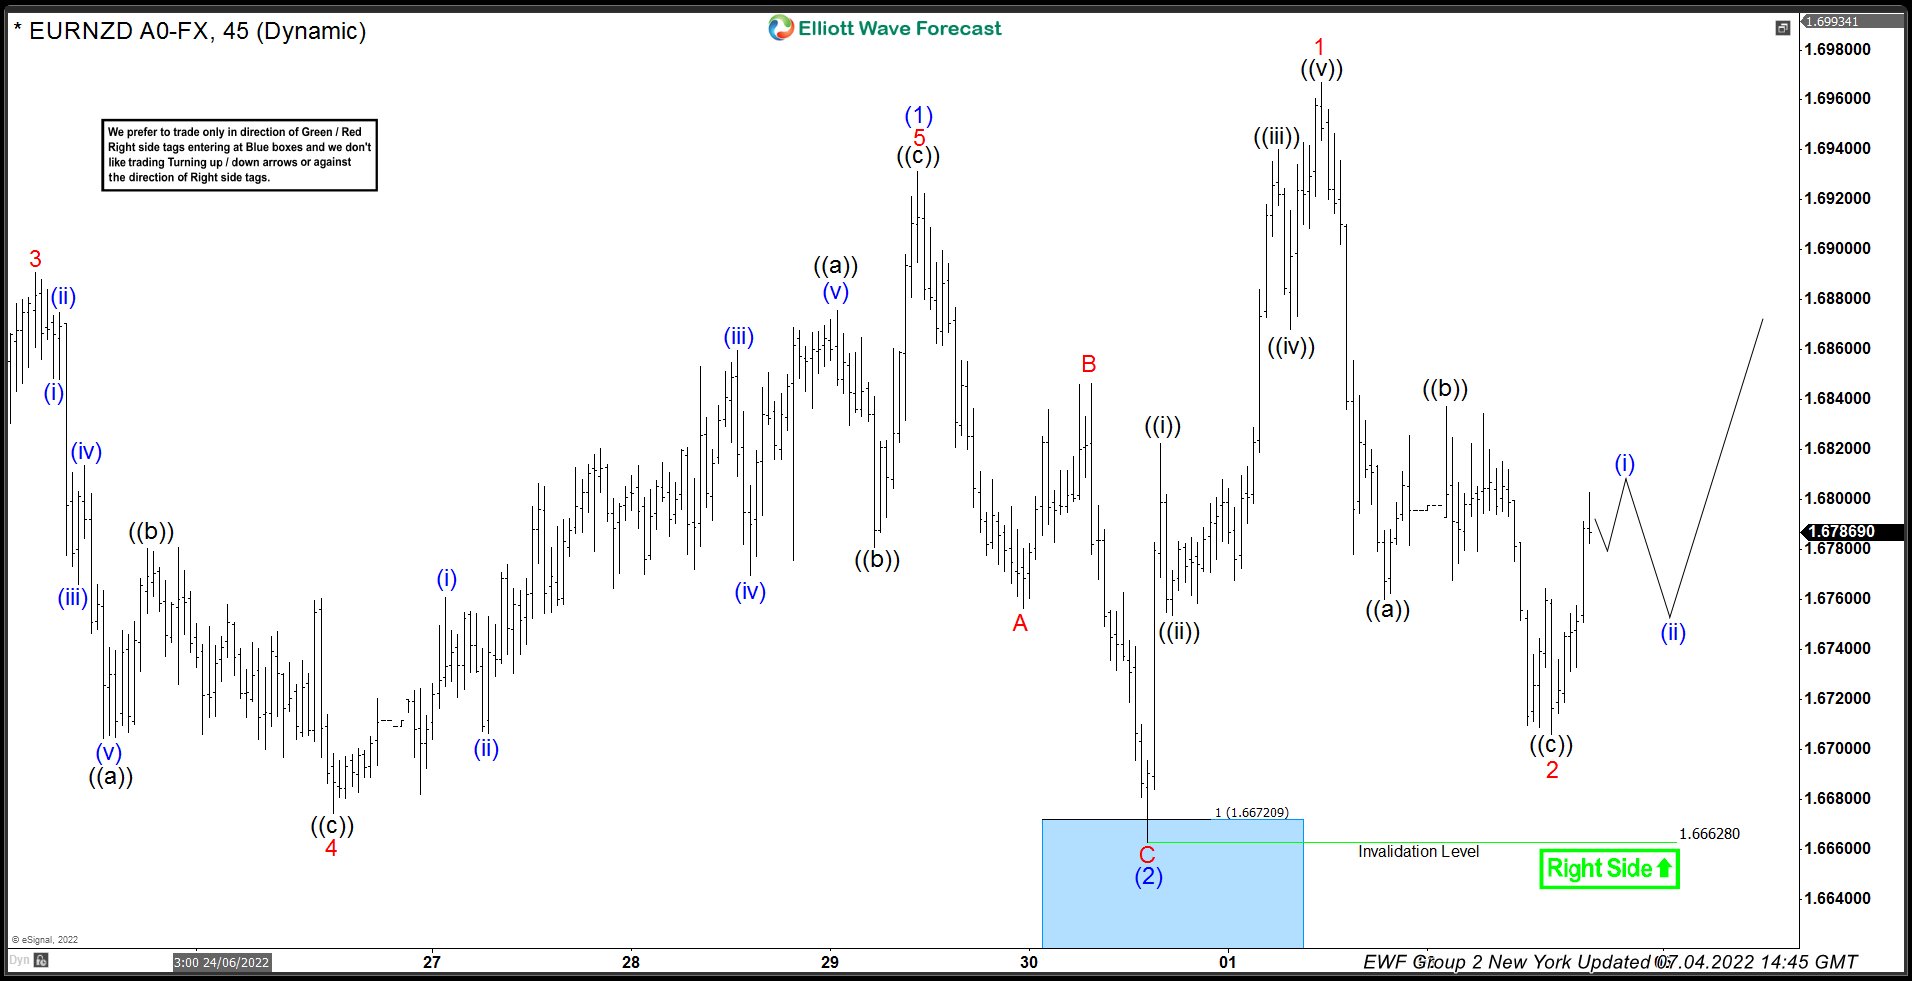
In this technical blog we’re going to take a quick look at the Elliott Wave charts of EURNZD published in members area of the website. As our members knew, we’ve been favoring the long side in EURNZD since it broke above May 12, 2022 high. Break of May 12, 2022 high created an incomplete bullish sequence in the pair up from April 5, 2022 low against June 3, 2022 low. EURNZD cycle from June 3, 2022 low ended at June 29, 2022 peak and it started pulling back. This pull back took the form of Elliott Wave Zig Zag pattern and members knew it was nothing more than another buying opportunity. In the remainder of the article, we are going to explain the Elliott Wave Pattern and talk about the blue box buying area.
Before we take a look at the real market example, let’s explain Elliott Wave Zigzag.
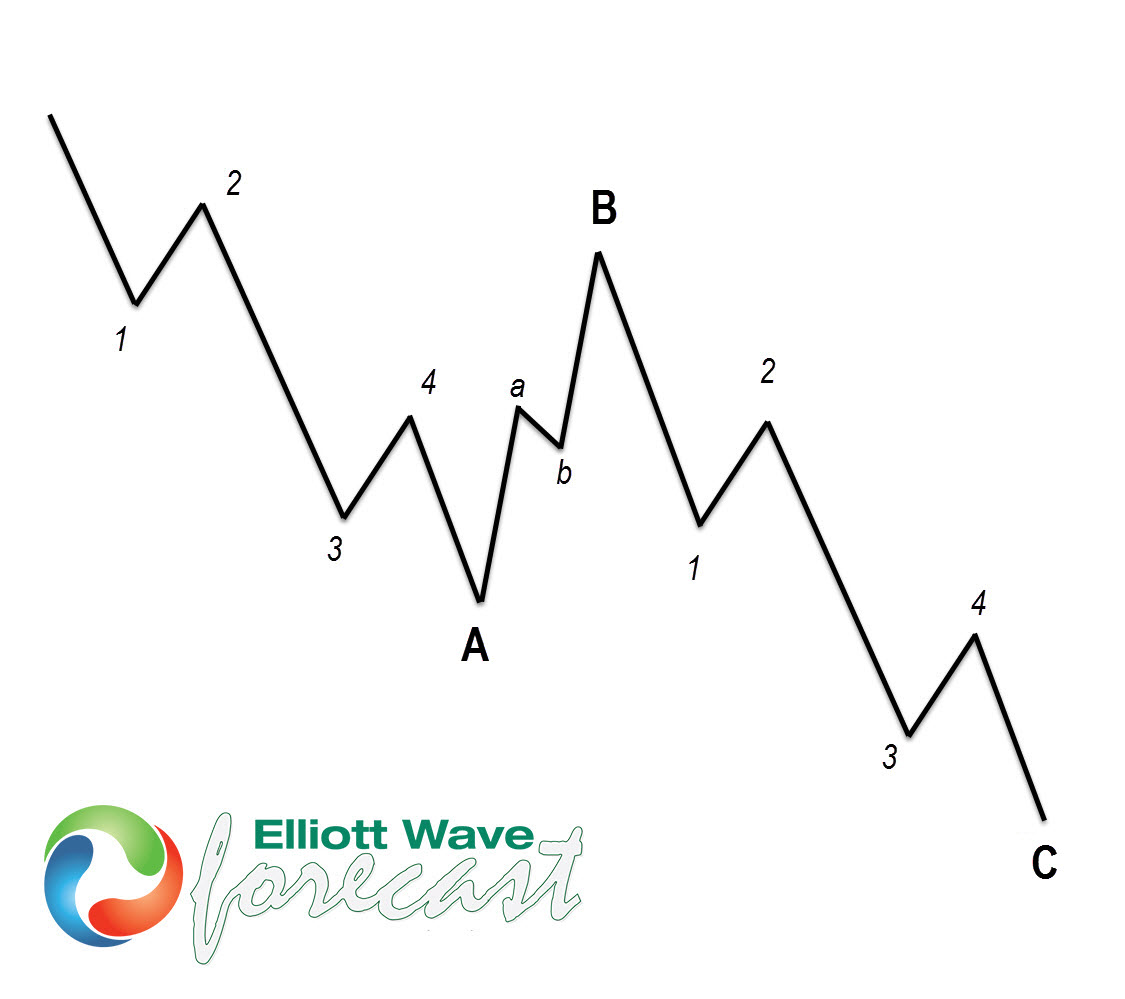
Elliott Wave Zigzag is the most popular corrective pattern in Elliott Wave theory . It’s made of 3 swings and is sub-divided as 5-3-5. Inner swings are labeled as A,B,C where A =5 waves, B=3 waves and C=5 waves. That means A and C can be either impulsive waves or diagonals. (Leading Diagonal in case of wave A or Ending in case of wave C) . Waves A and C must meet all conditions of being 5 wave structure, such as: having RSI divergence between wave subdivisions, ideal Fibonacci extensions and ideal retracements etc. Wave B could be a triangle, FLAT, Zigzag or a double three structure.
EURNZD 30 June, 2022 1 Hour Elliott Wave Update
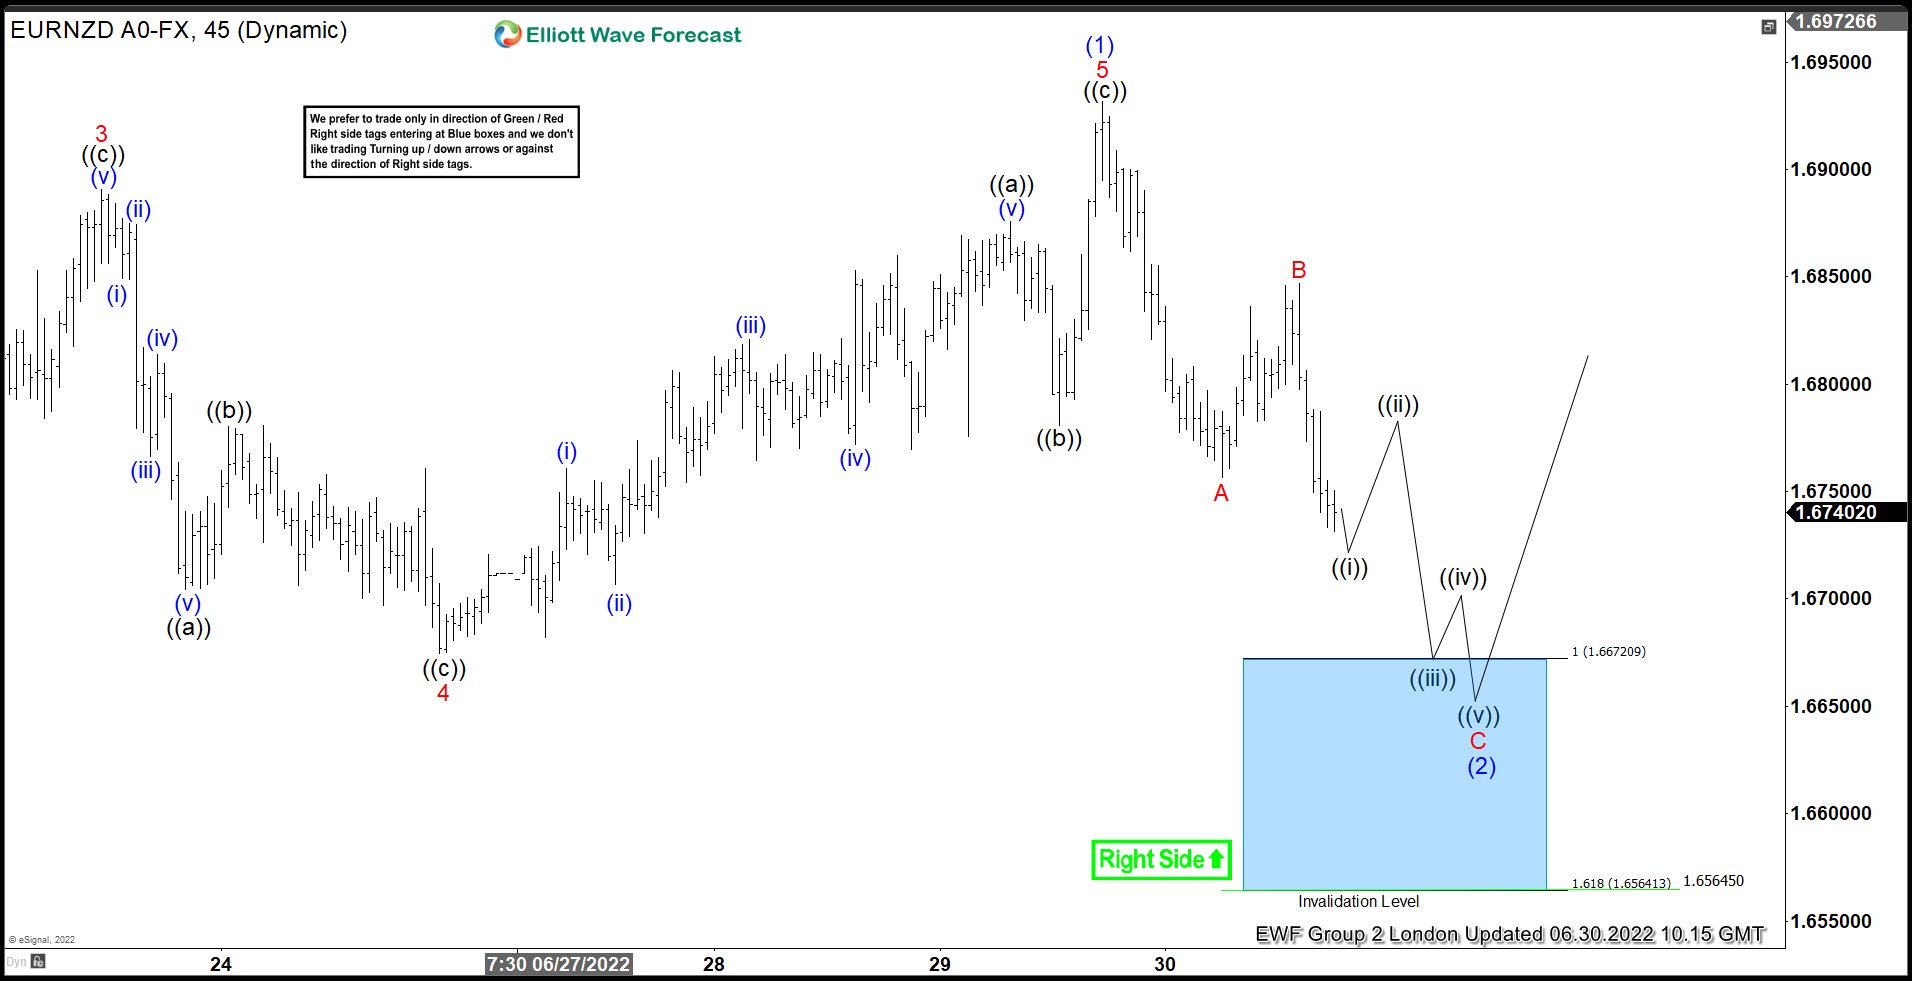
Current view suggests EURNZD is doing black pull back against the June 3, 2022 (1.6348) low. First leg from the peak was in 5 waves which has been labelled as wave A. Bounce was corrective and completed wave B. We have already seen a new low below wave A which makes it an incomplete sequence against June 30, 2022 peak. Current view suggests C leg is in progress toward 1.6672 – 1.6564 area (highlighted with a blue box).
We don’t recommend selling the pair against the main bullish trend. Strategy is waiting for the price to reached marked blue box zone, before buying the pair again. As the main trend is bullish we expect buyers to appear at the blue box for 3 waves bounce at least. Once bounce reaches 50 Fibs against red B high, we will make long position risk free by either moving stop loss to entry position or taking partial profits and putting stop on remaining position below the low within the blue box. Invalidation for the trade would be break of marked invalidation level at 1.6564. As our members know, Blue Boxes are no enemy areas , giving us around 80% or a higher chance to get 3 waves bounce at least from the blue box.
EURNZD 01 July, 2022 1 Hour Elliott Wave Update
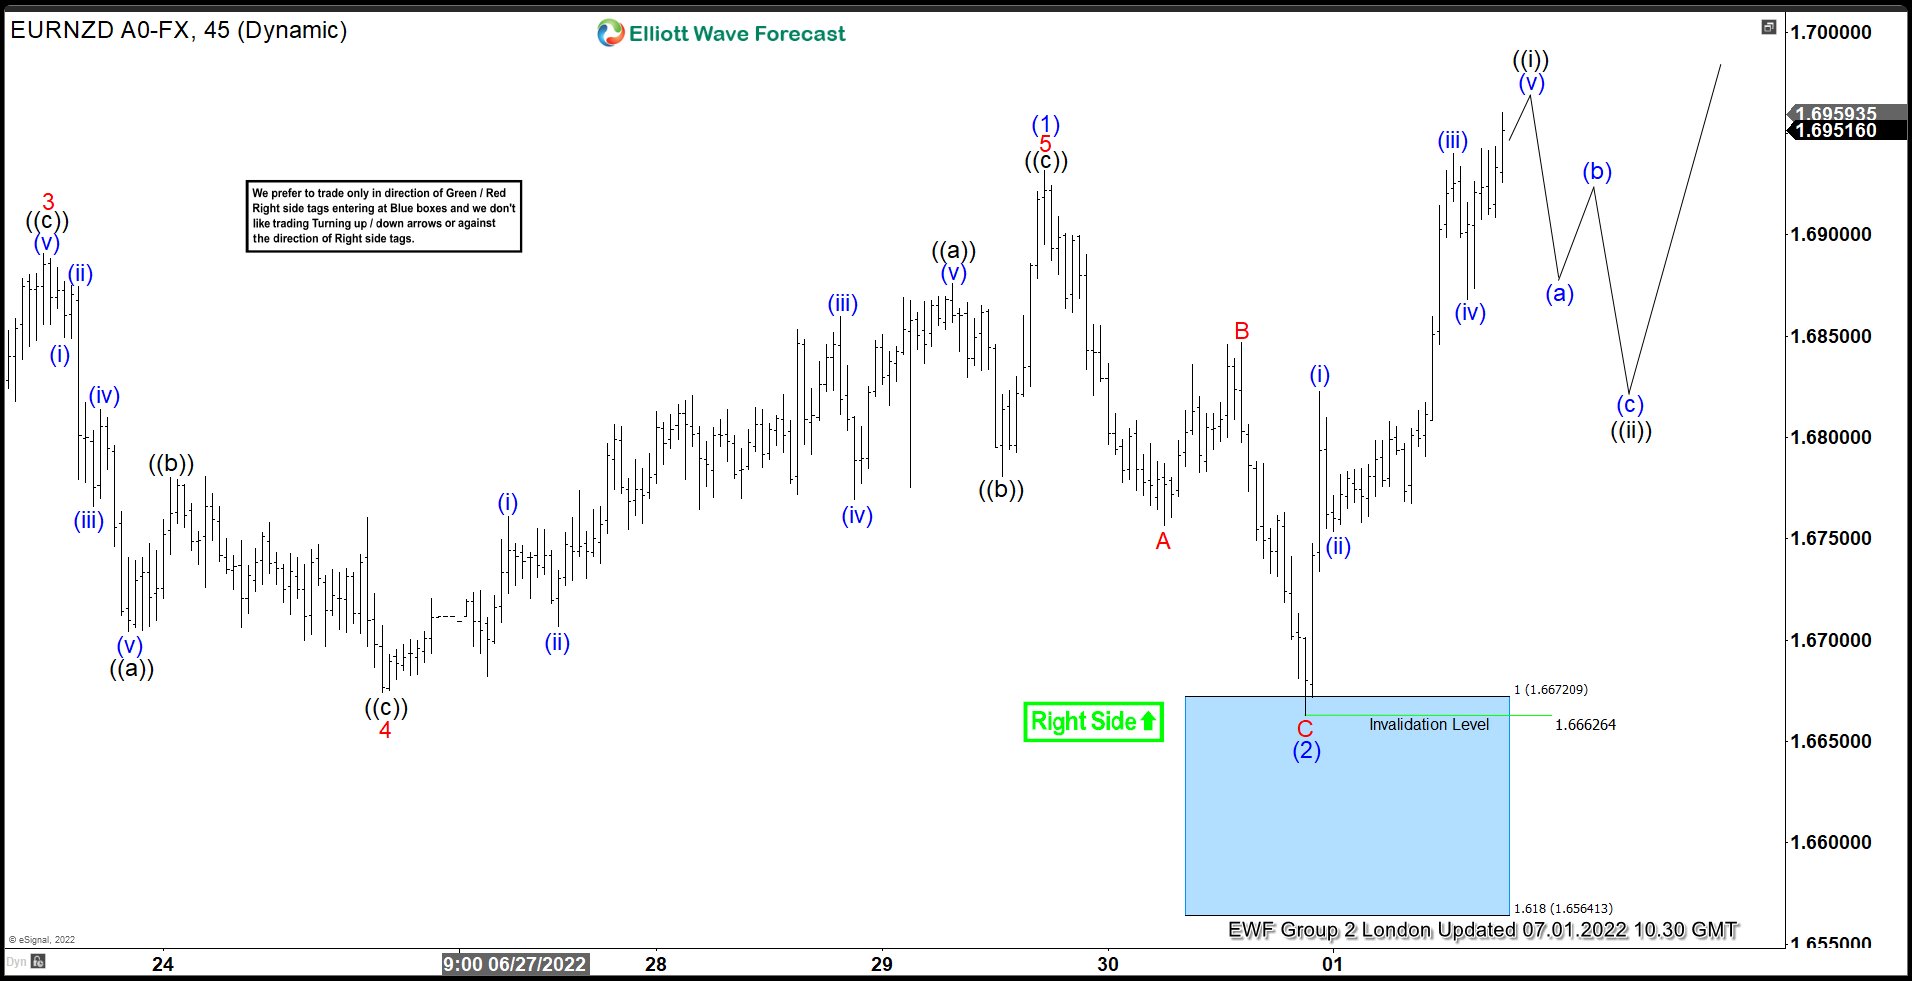
Chart below shows EURNZD made proposed leg down as we expected. The pair has found buyers at the Blue Box area and we are getting good reaction from there. Pull back completed at1.6662 low as a Zig Zag pattern. The rally from the blue box has already made a new high above June 29, 2022 low. Consequently, members who have taken the long trades at the blue box now enjoying profits in a risk free trades. As dips hold above 1.6662 low, expect the pair to continue higher and resume the rally.
EURNZD 04 July, 2022 1 Hour Elliott Wave Update
Chart below shows pair completed 5 waves up from 1.6662 low and pulled back in 3 waves. Pull back has held above 1.6662 low and now pair has scope to continue higher in wave 3. In case of a break below the recent low at 1.6706, wave (1) could be moved to July 1, 2022 peak (1.6967), 1.6706 low would become wave W and the bounce from 1.6706 low will become wave X. New low below 1.6706 should be part of wave Y of (2) and we should see buyers entering the market again at 100 – 161.8 Fibonacci extension area of W-X cycles. We will show the area with a blue box if market follows this path.
Keep in mind that market is dynamic and presented view could have changed in the mean time. You can check most recent charts in the membership area of the site.