Sample Category Title
Yen Steady in Holiday-Thin Trading
The currency markets will be in quiet mode today, as US markets are closed for the Fourth of July holiday. The yen hasn’t shown much movement over the past week, although USD/JPY hit another 24-year high last week when it climbed to the 137.00 line.
In the US, there are no tier-1 releases until Wednesday, with the release of the FOMC minutes. According to CME’s FedWatch, the markets have priced in a supersize 75bp increase at 85%, up from 75% late last week. The Fed appears intent on continuing to raise rates aggressively, with Fed Chair Powell saying last week that curbing inflation was his primary task right now. At the ECB forum in Sintra, Portugal, Powell said it was important to prevent inflation expectations from becoming anchored, adding that restoring price stability was paramount, even if that mean negative growth.
Powell has understandably tried to downplay concerns about a recession, but the nagging “R” word continues to hover close by. On Friday, the Atlanta Fed GDP tracker indicated that the US is likely already in a recession, with the economy contracting by 2.1% in Q2, which together with the Q1 decline of 1.6% would mean the economy is in recession.
Markets brace for weak Japan household spending
Japan releases household spending on Friday. Japan’s inflation of 2.1% is much lower than the levels we are seeing in the UK and US, but consumers are not used to prices rising, after 15 years of very low inflation. A weaker yen has made imports more expensive, and the Japanese consumer is holding tighter to their purse strings. Household spending is expected to fall to 0.9% in May, after a decline of 1.7% in April. The BoJ has kept an ultra-accommodative policy in place, trying to boost domestic demand. If household spending posts another large decline, it would underline the fact that the economy is still not responding to the BoJ’s loose policy.
USD/JPY Technical
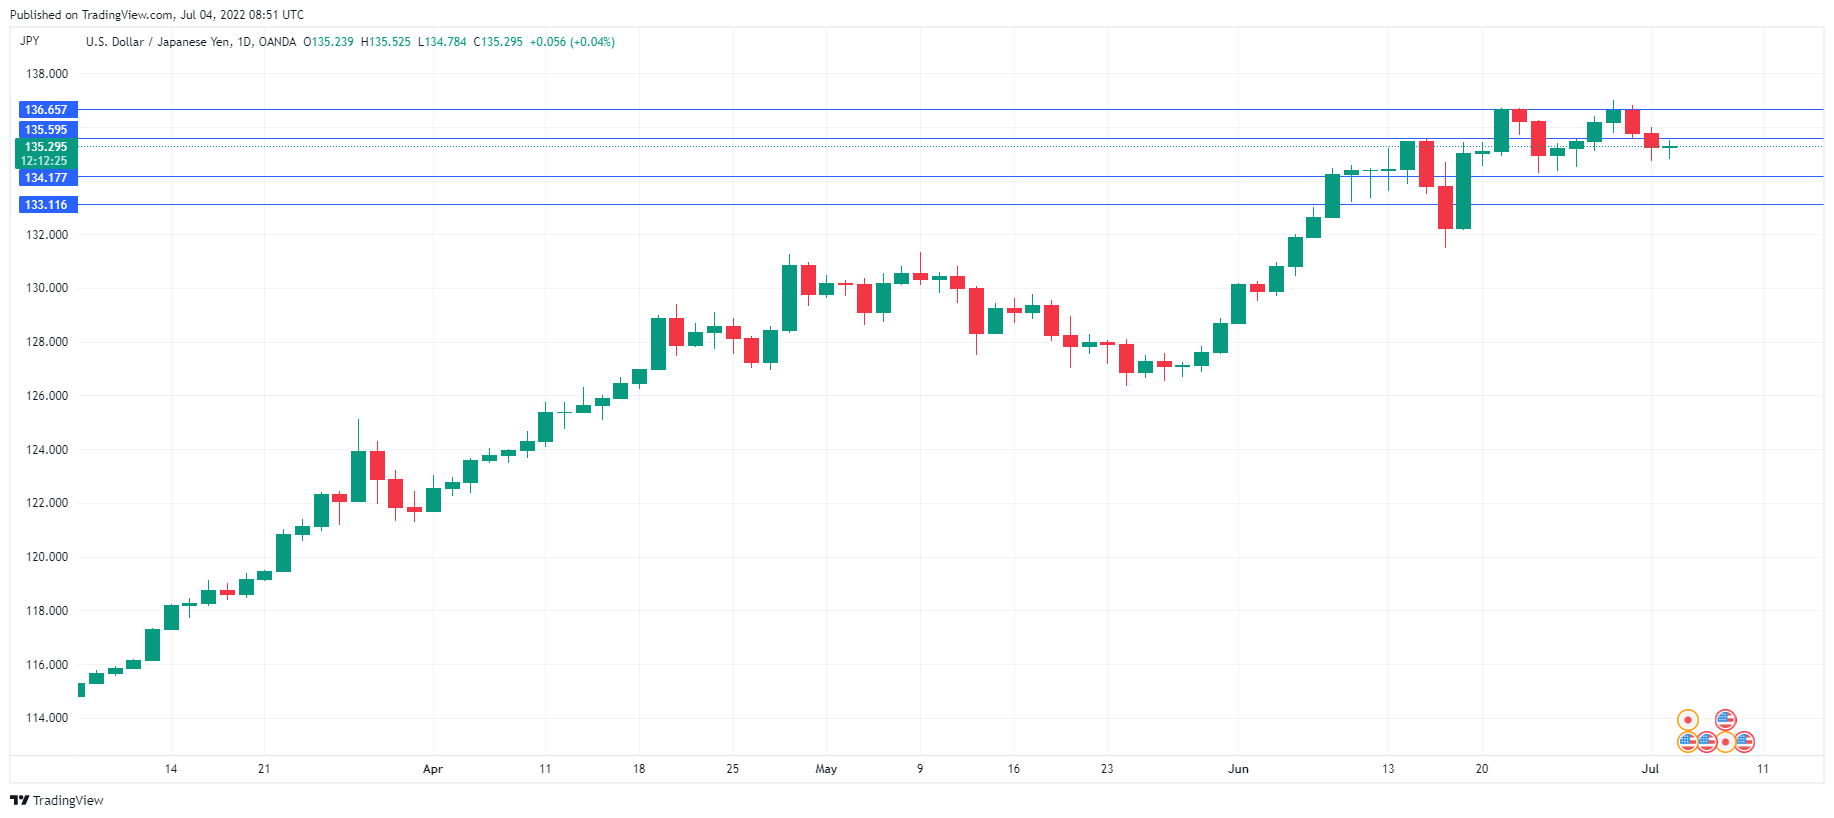
- 135.59 is a weak resistance line. Next, there is resistance at 136.65
- There is support at 134.17 and 133.11
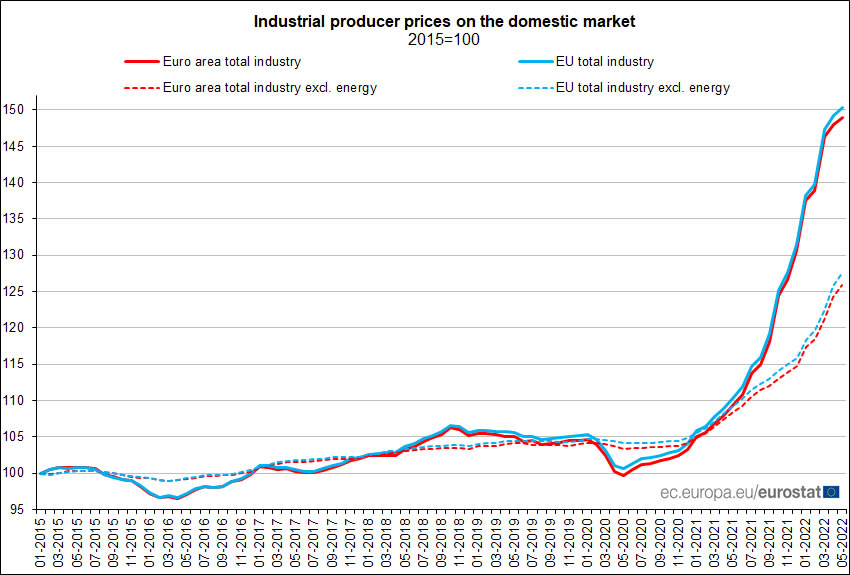
Eurozone PPI up 0.7% mom, 36.3% yoy in May
Eurozone PPI rose 0.7% mom, 36.3% yoy in May, versus expectation of 1.0% mom, 36.7% yoy. For the month, industrial producer prices increased by 1.7% for intermediate goods, by 1.3% for non-durable consumer goods, by 0.9% for durable consumer goods and by 0.6% for capital goods, while they decreased by -0.2% in the energy sector. Prices in total industry excluding energy increased by 1.3%.
EU PPI rose 0.8% mom, 36.4% yoy. Among Member States for which data are available, the highest monthly increases in industrial producer prices were recorded in Finland (+5.5%), Estonia (+5.4%) and Lithuania (+4.9%). Decreases were observed in Ireland (-19.4%), Slovakia (-4.4%), the Netherlands (-0.8%), Bulgaria and France (-0.1% both).
GBP/USD: Bears Taking a Breather After Strong Rejection at 1.20 Zone on Friday
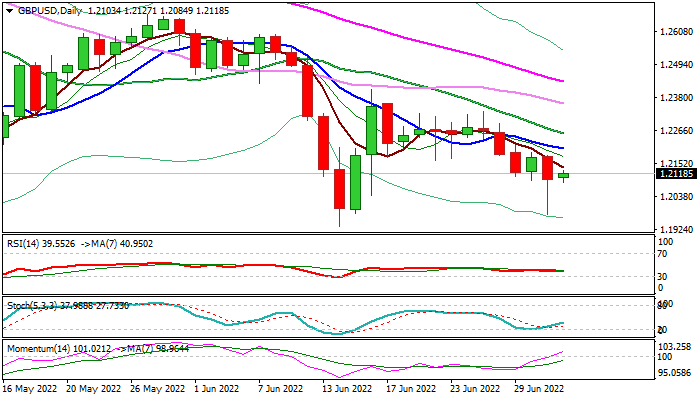
Cable is trading around 1.21 handle, moving in a narrow range on expected lower volumes due to US Independence Day holiday.
Friday’s daily candle with long tail signals that bears are lacking strength for a final attack at 2022 low (1.1933) and also facing headwinds from psychological 1.20 support.
Fresh bullish momentum on daily chart supports the action, though moving averages are still in full bearish setup and weigh, suggesting that recovery needs more evidence.
Violation of falling 10DMA (1.2202) would give fresh strength to the action for extension towards upper pivots at 1.2296/1.2332 (daily Kijun-sen / recent range top).
Caution on failure to clear 10DMA which capped in past four days that would keep the downside at risk.
Res: 1.2139; 1.2202; 1.2225; 1.2254.
Sup: 1.2084; 1.2045; 1.2000; 1.1975.
EUR/USD: Recovery Faces Tough Work at the Upside to Generate Bullish Signal
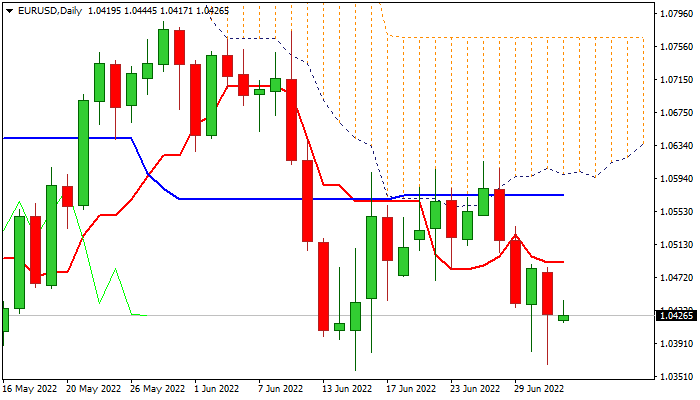
The Euro is holding in a tight range on Monday, following initial bullish signal on double downside rejection last Thu/Fri, on expected headwinds at key 1.0360/40 support zone.
Mixed daily studies (14-d momentum is attempting to break into positive zone and stochastic is heading north, RSI and MA’s are bearishly aligned) look for clearer signal.
Initial optimism that the action could bounce, exists but needs verification on lift and close above daily Tenkan-sen (1.0490) that is seen as minimum requirement.
In such scenario, recovery would accelerate towards strong barriers at 1.0572 (daily Kijun-sen), 1.0602 (daily cloud base) and 1.0614 (Jun 27 recovery top), but unlikely to easily break higher that would keep short-term action within the range and keep the downside vulnerable.
Expect stronger direction signals on break of either pivot at 1.0572 and 1.0340.
Fundamentals do not work in favor of Euro, as the ECB will likely stick to its initial decision for the first rate hike by 25 basis points, while the Fed is increasingly hawkish and markets already talk about more aggressive step on 75 basis points hike in July policy meeting that would further inflate the dollar and keep the single currency in defensive.
Res: 1.0456; 1.0490; 1.0519; 1.0572.
Sup: 1.0380; 1.0358; 1.0349; 1.0340.
Bitcoin: Too Early to Buy
Bitcoin is down 9.2% over the past week, finishing around $19,400 and trading near 19,000 on Monday morning. Ethereum has lost 13.3% in the last seven days, while other top altcoins in the top 10 have fallen from 8.6% (BNB) to 18% (Solana).
According to CoinMarketCap, the total capitalisation of the crypto market fell 9% over the week to $865bn. Bitcoin’s dominance index fell 0.3 points to 42.2%. The cryptocurrency fears index by Monday rose to 14 points.
Bitcoin has been under even pressure for almost all last week. A brief bounce at the beginning of the day on July 1 was more likely due to emotional excitement from the start of a new period (month, quarter, half-year) rather than fundamental changes in the situation. This rebound protected BTCUSD from updating lows.
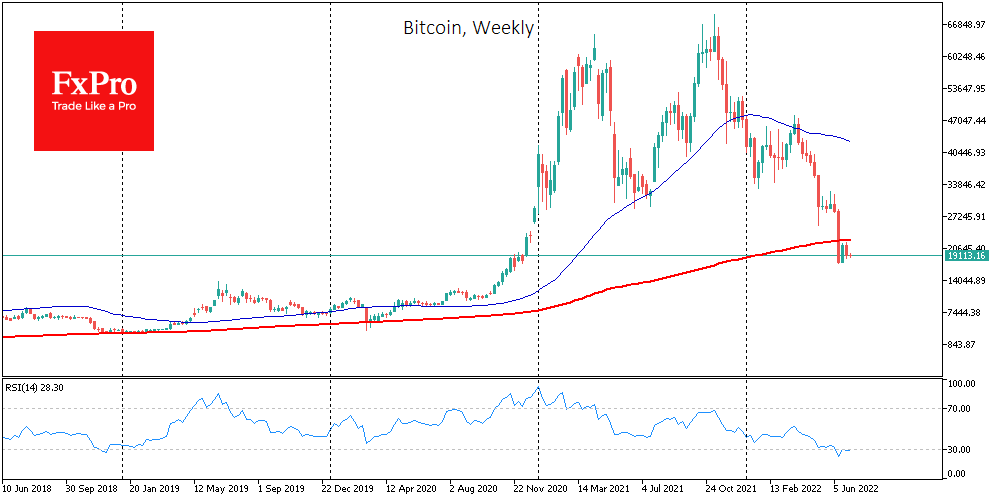
Nevertheless, the global picture remains bearish as stock markets show no glimpses of tightening financial conditions by central banks. On the weekly charts, BTCUSD remains below the 200-week average, having failed a timid attempt to climb higher last week.
The RSI on the weekly charts remains oversold, which is a historical anomaly. Unfortunately for the bulls, this is not a sign of a better time to enter. Technically, a sustained return from extreme to norm would be a buy signal.
The end of the second quarter of 2022 was the worst for bitcoin in 11 years. Investor Michael Bury, who predicted the 2007 mortgage crisis, admits that the current market situation is only the middle of a bearish cycle for BTC and equities.
Changpeng Zhao, chief executive of cryptocurrency exchange Binance, called the current collapse of the crypto market a good time to buy bitcoin for the long term. He said that if traders can hold out in the current bear market, their investments will multiply in the next bullish trend.
According to IntoTheBlock, retail investors have stepped up after bitcoin fell below $20,000. This category of cryptocurrency holders has been the most aggressive in buying during the recent sell-off.
El Salvador continues to buy bitcoins amid a falling market. This time, the country’s government spent about $1.5 million to buy 80 BTC at an average price of $19,000.
On the other hand, Bank of America reported that the bank’s customers investing in cryptocurrencies has fallen by more than 50% since November last year.
Daily Technical Analysis
EUR/USD
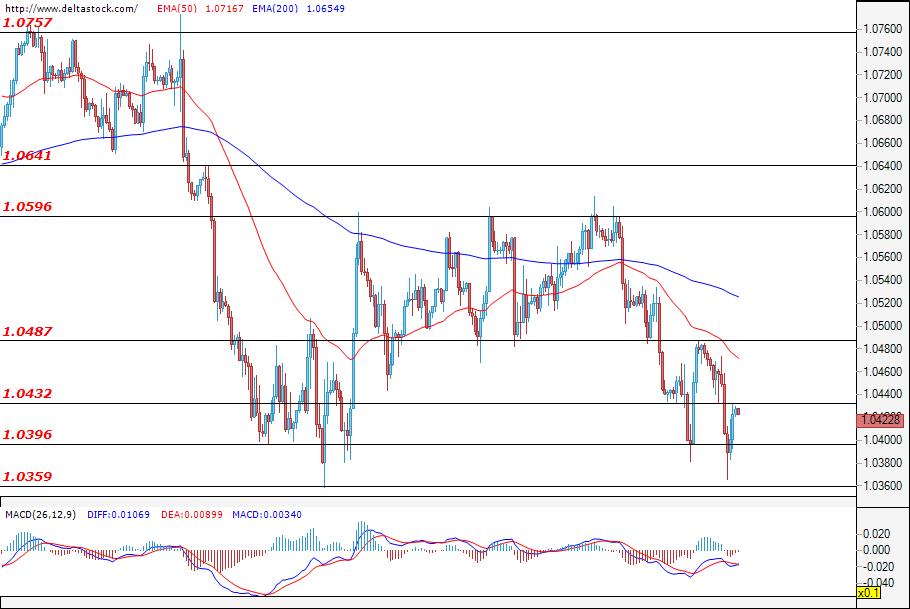
Friday's session was quite volatile for the EUR/USD, and in the early hours of today, the trend took a downward turn. There was a brief struggle between traders around the session open in Europe, but in the end the bears prevailed and the currency pair continued to plummet. The bottom for the day and the week was 1.0365, where the pair managed to find support and close the last day of the week at levels of around 1.0430. Today is Independence Day in the U.S. and volatility is expected to remain low as it is a public holiday. Euro data on today's macroeconomic calendar will show the German trade balance (6:00 GMT), as well as manufacturing inflation levels (9:00 GMT), but this Friday all eyes will be on the U.S. labour force data. For now, the 1.0360 level is once more defending itself, but whether this is the last bottom for the EUR/USD will depend on what data we will get on the last day of this week and how the market will respond to it.
USD/JPY
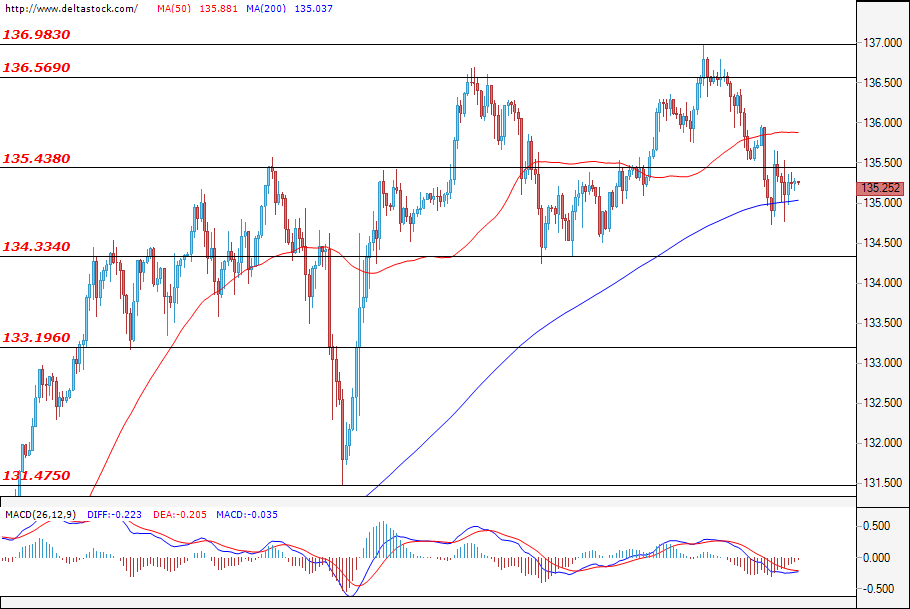
After failing to find support at around 135.50 and reach a new high, the correction deepened, and on Friday, the pair managed to fall back to around 134.65. At the time of writing, the level at 135.43 is acting as the first major resistance, which has to be overcome in order for the rally to continue. .There is no yen or dollar data on the macroeconomic calendar today, and so once again all eyes will be on the NFP data on Friday this week. If the dollar comes out on top again, then the previous high of 136.98 can be easily breached, but if we instead see wavering sentiment, then the currency pair could deepen its correction.
GBP/USD
Friday’s session was extremely volatile for the sterling as we saw sharp movements of around 200 pips in both directions. It all started with a strong decline that managed to bring the currency pair to levels below 1.2000, but not for long as the bulls attacked these levels shortly after and we saw a recovery of the decline, with the session ending near 1.2100. Whether this upward move is enough to prompt traders to continue buying will depend on the strength of the dollar. Support from U.S. banks is lacking today as the nation celebrates its Independence Day, but on Tuesday we can expect more information from the macroeconomic calendar, which could define where the pair is headed in the long term. The Cable will also be influenced by the U.S. labour data to come out this Friday at 12:30 GMT.
EUGERMANY40
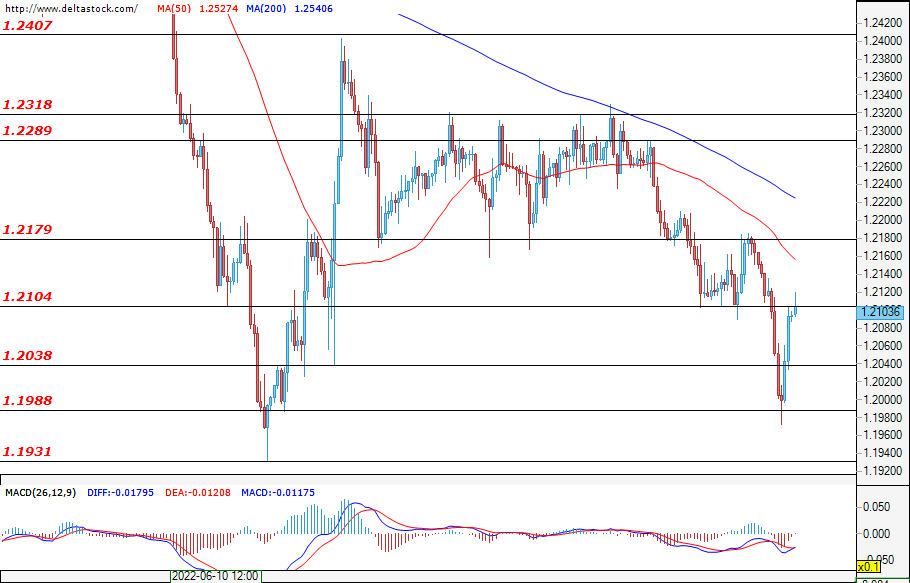
Volatility remained elevated on Friday and we saw big swings in both directions. The session started with a decline in the early hours of the day. However, as the German index approached levels at around 12740, it managed to find support and rise as the European exchanges opened. Movements in the U.S. stock market also managed to help the index continue its rally and end the day near 12900. This key level has already been playing the role of support several times in a row, but whether it will switch roles will to some extent depend on the data on the German trade balance scheduled for today (06:00 GMT). For now, the odds for the downtrend to deepen are high.
US30
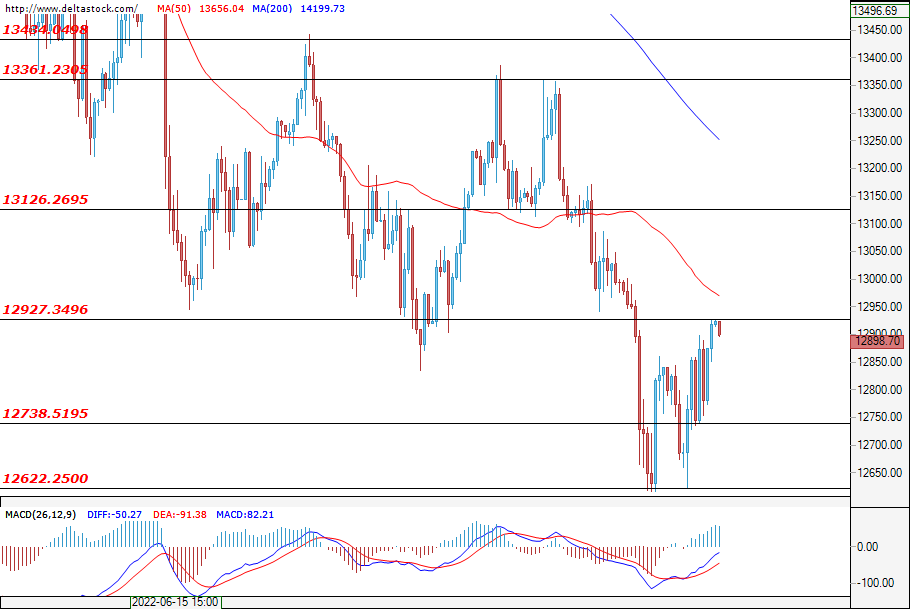
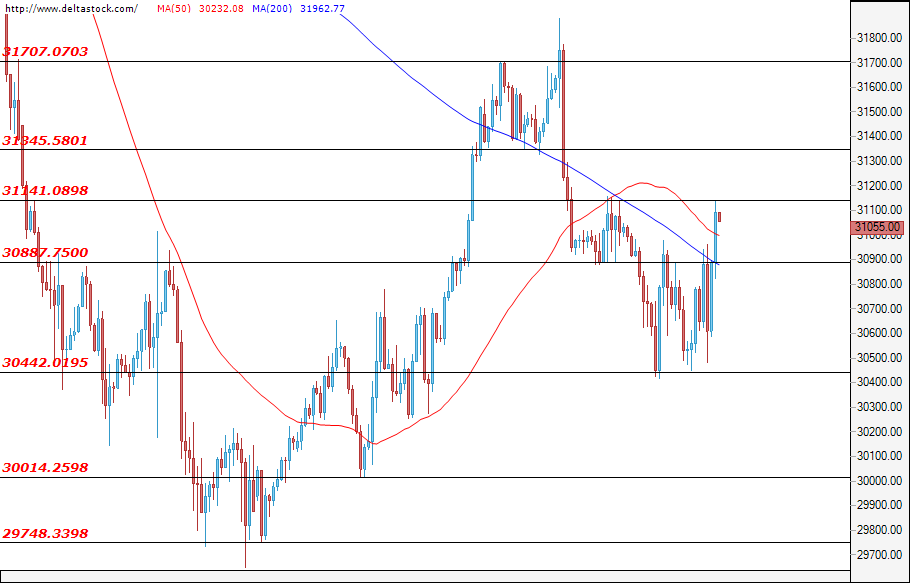
In the early hours of Friday, we saw the blue-chip index head towards the key levels of 30450. There it found support and managed to score a nearly $800 gain and close the day at around 31000. However, today is Independence Day in the U.S. and the major players in the U.S. stock market are missing. All U.S. indices will therefore be trading on reduced hours today and will end the session at 15:00 GMT. The direction in the index is expected to be defined later this week, and especially on Friday after the U.S. NFP and labour data at 12:30 GMT is released. A drop in the dollar may help the indices to continue their growth, but if we see the opposite scenario, then a deepening of last week's corrections is not excluded.
Gas Price Downward Momentum Accelerates on Supply Hopes
The price of natural gas tumbled sharply as investors continued focusing on the changing supply dynamics. This price action is mostly because of a significant increase in storage injection in the US. It also declined after a US regulator barred the Freeport LNG plant, citing safety concerns. In a statement, the Pipeline and Hazardous Materials Safety Administration said that the plant should take some more measures to address safety before reopening. Freeport, the second-biggest US LNG export partner had a major blast in June that disrupted supplies. In a statement, the plant’s operator said that it expects a full restart to happen in October.
The euro rose slightly as investors continued reflecting on the latest European consumer inflation data. Data published on Friday showed that that the bloc’s inflation surged to the highest level on record as the cost of food and energy rose. Headline inflation jumped by 8.6% on a year-on-year basis while core inflation continued rising. Countries like Spain and Italy published record inflation as German’s prices declined slightly. Therefore, analysts are pricing in a big rate hike by the European Central Bank (ECB) later this month. The euro will react to the latest German trade numbers and Euro area’s producer price index (PPI) data.
Cryptocurrency prices remained under pressure during the weekend as concerns about the industry remained. Several large players in the industry have come under pressure. BlockFi, which was once valued at over $4 billion is being acquired by FTX for about $25 million. At the same time, Celsius and Voyager Digital have suspended withdrawals while Three Arrow Digital went bankrupt. Voyager was once one of the biggest crypto hedge funds with over $16 billion in assets.
EURUSD
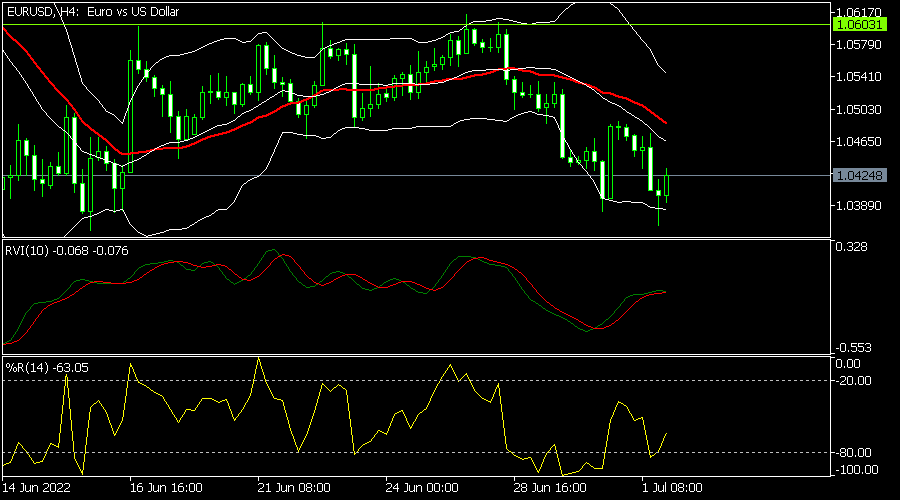
The EURUSD pair formed a hammer pattern on the four-hour chart. In price action analysis, this pattern is usually bullish. It has moved between the middle and lower lines of the Bollinger Bands while the Williams % Range and Relative Vigor Index (RVI) have pointed upwards. The pair is also slightly below the 25-day moving average. Therefore, there is a possibility that the pair will keep rising as bulls target the key resistance at 1.0435.
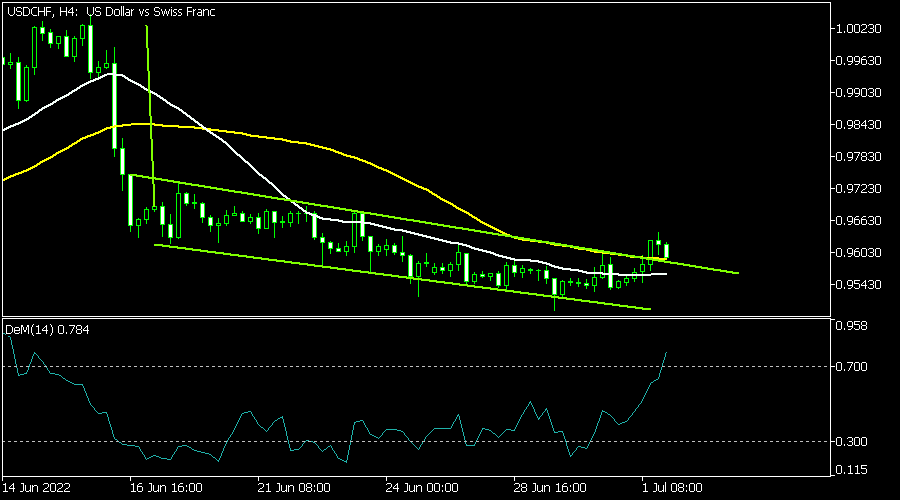
USDCHF
The USDCHF pair bounced back ahead of the upcoming Swiss consumer inflation data. It rose to a high of 0.9620, which was the highest point in 2 weeks. As it rose, the pair managed to move above the descending channel shown in green. It also moved slightly above the 25-day moving average while the DeMarker indicator rose to the overbought point. The pair has also formed a break and retest pattern, meaning that it will likely continue its recovery.
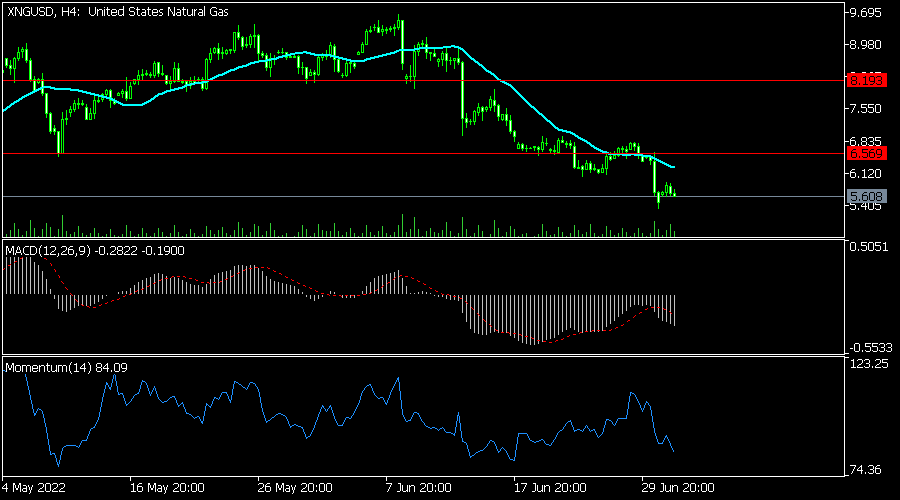
XNGUSD
The XNGUSD pair remained under pressure as investors priced in more supply in the coming months. It is trading at 5.60, which was the lowest level since April. It has moved below the 25-day moving average while the MACD and the momentum oscillator have continued falling. It is also below the important resistance level at 6.56. The pair will likely continue keep falling in the near term.
Gold Raises a Bullish Flag, But How Strong are the Bulls?
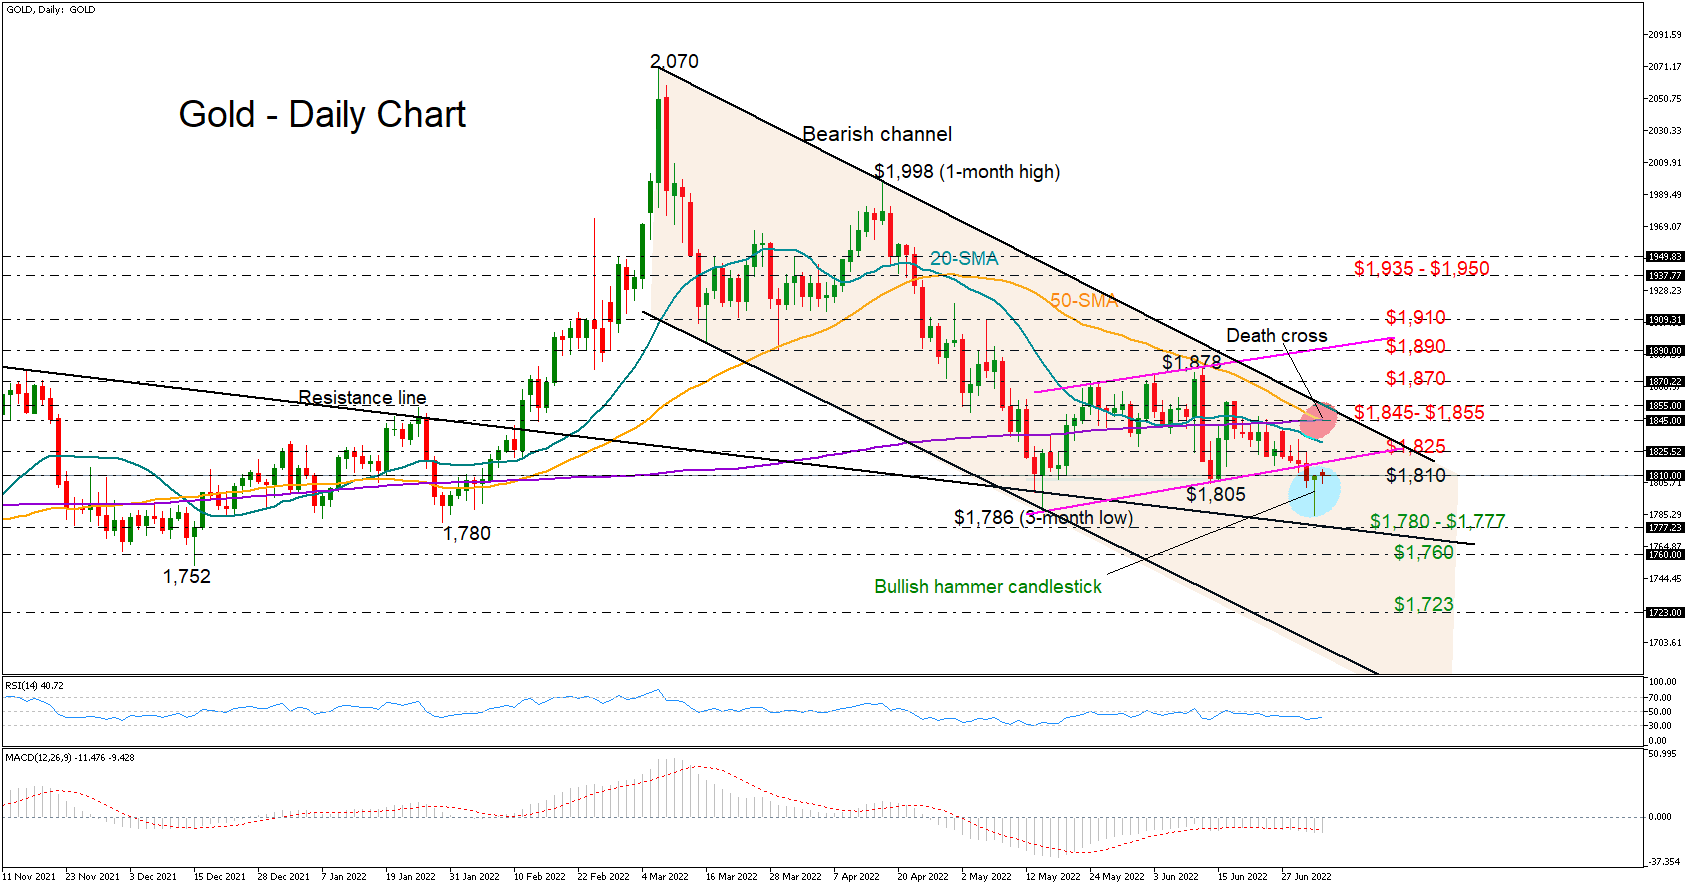
Gold optimism started to shine again after the creation of a bullish hammer candlestick on Friday, which succeeded the sharp bounce on May’s bottom of $1,786/ounce.
The price is currently pushing for a higher close slightly above the $1,810 level, trying to confirm the green bullish candlestick formation. Yet, some caution is still required given the negative trend in the RSI and the MACD, which keep hovering within the bearish area.
More importantly, the market is setting up a death cross between the 50- and 200-day simple moving averages (SMAs) after the bearish cross between the 20- and 200-day SMAs last week, suggesting that any upside correction might only be temporary and part of the original negative trend.
Nevertheless, if bullish forces persist, the precious metal will attempt to crawl above the broken support trendline seen at $1,825. Should efforts prove successful, the recovery may continue towards the $1,845 – $1,855 key region, where the longer-term SMAs and the upper boundary of the bearish channel are positioned. Further up, the price may face some congestion around the $1,870 barrier before accelerating towards the surface of the short-term bullish channel at $1,890.
On the downside, the $1,786 – $1,777 floor will remain under the spotlight. If it cracks, the downtrend could stretch towards the support zone around $1,760, while lower, all attention will turn to the 2021 barrier at $1,723.
Summarizing, gold has charted an encouraging candlestick pattern, flagging a potential turnup in the price, but negative risks haven't completely evaporated yet. Perhaps a durable advance above $1,825 could reduce skepticism and motivate additional buying.
AUD/USD: Aussie Bounces from New Two-Year Low But Upticks Seen Limited, RBA in Focus
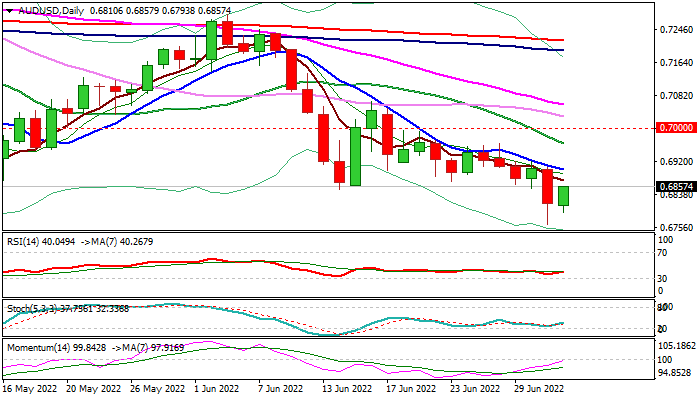
The AUDUSD edges higher in early Monday after 1.2% drop on Friday, when the pair broke below previous low at 0.6828 (May 12) and hit new two-year low at 0.6815.
Friday’s close below 0.6828 low was a bearish signal, though bears face headwinds here and may hold in extended consolidation before resuming.
Technical studies on daily chart are negative and adds to bearish sentiment on global growth worries that continues to hurt risk appetite.
Traders await Tuesday’s RBA policy meeting, with wide expectations for the second consecutive 0.5% hike that will push the rate to 1.35%, as the central bank puts all efforts to curb soaring inflation which is expected to hit 7% this year, with RBA statement expected to remain hawkish.
Focus is also on Fed minutes due on Wednesday, with the US central bank also seen maintaining hawkish stance, with growing expectations for more aggressive action on 0.75% hike.
Upticks face initial resistance at 0.6900 (falling 10DMA) which should ideally cap, while break here would ease downside pressure and open way for test of strong barriers at 0.7000/60 (psychological / base of thick daily cloud) where extended upticks should stall and offer better selling opportunities.
Bears eye initial target at 0.6758 (50% retracement of 0.5509/0.8007, Mar 2020/Feb 2021 rally), violation of which would risk acceleration towards 0.6643 (Jan 2019 spile low) and 0.6463 (Fibo 61.8%).
Res: 0.6871; 0.6900; 0.6964; 0.7000.
Sup: 0.6828; 0.6793; 0.6758; 0.6643.
AUD/USD Technical Analysis 4th July 2022
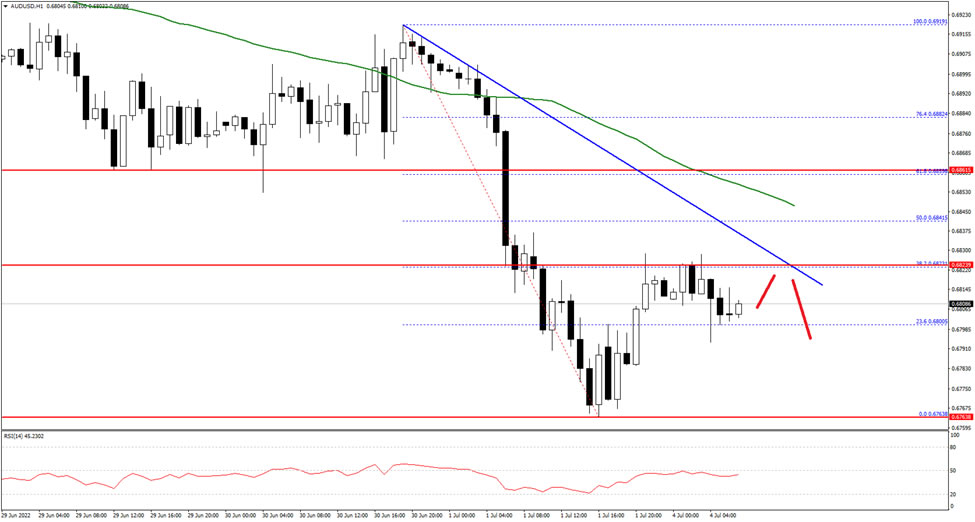
The Aussie Dollar started a fresh decline from the 0.6920 zone against the US Dollar. The AUD/USD pair traded below the 0.6850 support to move into a bearish zone.
It tested the 0.6760 zone on FXOpen and is currently correcting losses. It is now trading well below the 0.6850 level and the 50 hourly simple moving average. An immediate resistance on the upside is near the 0.6820 level.
There is also a key bearish trend line with resistance near 0.6825 on the hourly chart. If there is an upside break above the 0.6825 level, the pair could rise steadily towards the 0.6850 level in the near term. Any more gains could send the pair towards 0.6920.
An immediate support on the downside is near the 0.6780 level. The next key support is near the 0.6750 level. A downside break below the 0.6750 support could lead the pair towards the 0.6680 support.