

Sample Category Title
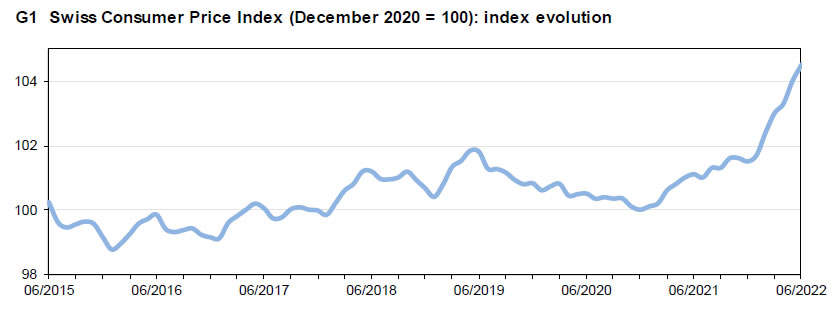
Swiss CPI accelerated to 3.5% yoy in Jun, highest since 2008
Swiss CPI rose 0.5% mom in June, above expectation of 0.3% mom. The monthly rise was due to several factors including rising prices for fuel, heating oil, and fruiting vegetables. Over the 12-month period, CPI accelerated from 2.9% yoy to 3.4% yoy, above expectation of 3.2% yoy. That's also the highest level since July 2008.
Looking at some more details, core inflation rose 0.2% mom, 1.9% yoy. Domestic products inflation rose 0.3% mom, 1.7% yoy. Imported production inflation rose 1.2% mom, 8.5% yoy.
Decline in US Yields Capped Further USD Gains
Markets
Fears on a potential sharp setback in (US and global) growth again outweighed persistent high inflation as a driver for trading on Friday. The flash preliminary EMU CPI printed higher than expected at 0.8% M/M and 8.6% Y/Y (was 8.1% in May) even as German inflation was softer than expected due to a one-off price decline on some transportation fees. Core inflation eased slightly to 3.7% from 3.8%, but with no indication of a profound trend reversal yet. Bonds even started a new up-leg in US dealings, reaching a new recovery top as a disappointing US manufacturing ISM questioned the room for the Fed (and other CB’s) to continue their anti-inflation campaign. The headline ISM eased from 56.1 to 53.0. Production held up well (54.9), but forwarding look sub-indices including new orders (49.2) and backlog of orders (53.2 from 58.7) suggest a further slowdown ahead. Employment also dropped further in contraction territory (47.4). After a new spike higher, bonds slightly eased off intra-day peak levels but still finished the day with impressive gains. US yields declined 16 bps (5-y), 13,2/12 bps for 10 and 2-y yields and 8 bps for the 30-y. The Bund curve showed a similar picture easing 13.9/13.2 bps (5/2-y) to 5.1 bps (30-y). Despite a fragile risk sentiment, intra-EMU spreads versus Germany continue to narrow (10y Italy minus 7 bps). Equities closed off intraday lows (EuroStoxx -0.2%, US indices even gained about 1% on lower yields). Still, the technical picture remains hesitant, at best. The decline in US yields also capped further USD gains. DXY stayed away from the 105.78 correction top (close 105.14). The yen even slightly outperformed (USD/JPY close 134.12). EUR/USD temporary dropped below the 1.04 handle, but the real test of the key 1.0350/41 area was again avoided (close 1.0414). The gradual but protracted EUR/GBP uptrend stayed in place (close 0.8616). Markets will probably take a slow start to the week as US markets are closed of the 4th of July holiday. The eco calendar is Europe is thin. Asian markets show a mixed picture despite Friday’s WS rebound. For the German 10-y yield the 1.19%/1.15% area (previous top/38% retracement) serves as a key support. The dollar rally slowed (both in DXY and USD/JPY and EUR/USD). However, if uncertainty on global growth/risk-off persists or intensifies (quid earnings season?), a sustained rebound in the likes of EUR/USD isn’t evident. A retest of the 1.0341 level remains a decent possibility. Later this week, we keep a closed eye at the RBA interest rate decision (Tuesday), the US Services ISM and the Minutes of the June Fed meeting (Wednesday) and the US payrolls on Friday.
News Headlines
The European Central Bank is looking into changing the parameters of outstanding targeted longer-term refinancing operations (TLTRO). The loans, with maturities of three years were offered from September 2019 onwards at a quarterly basis. Currently, there’s still some €2.2tn outstanding. The rate on the loans is calculated as the average price over their three-year life. Initially, they were available at -0.5%, but that changed during the pandemic to -1%. Since last month, that discount is removed again with the deposit rate returning as the reference. Even if the ECB embarks on a tightening cycle, there is a strong incentive to keep TLTRO’s until maturity rather than repay them early given the pick-up between the average cost and the higher actual deposit rate. Sources close to the ECB suggest this windfall, estimated at around €14bn, is politically unacceptable. Czech President Zeman said he thinks that new board members of the Czech National Bank – installed by Zeman – lack any inclination towards dramatic rate hikes. He added that raising rates is not a way to suppress cost inflation as interest rates are one of the cost items. Zeman also pointed to the gap between negative ECB rates and the CNB policy rate of already 7%. The August 4 meeting is the first following the dovish rotation at the CNB. Money markets discount only a small additional hike to fend off 16% Y/Y inflation and are even thinking about rate cuts on a 12-month horizon. CNB since June defends the CZK from weakening beyond EUR/CZK 24.75 through FX interventions..
Gold Jumps on Ukraine Tensions, Lower US Yields
Appetite in Asia was mixed. US futures gave back a part of Friday’s gains, but FTSE and European futures hint at a positive start despite escalating tensions in Ukraine after the fall of Lysychansk in the hands of Russians. So, gains are probably fragile.
Australia decided to ban Russian gold along with some other G7 nations including the US, Britain, Canada and Japan, a decision which has no influence on the course of the war.
Gold is up this morning, after having tipped a toe to $1784 on Friday. Rising geopolitical tensions and the sharp fall in the US yields are supportive of a short-term rebound. In the medium run, the death cross formation on the daily chart hints that we should see a strong resistance into the $1850 mark.
Interestingly though, crude oil is slightly down this morning, trading below the $110pb mark. We certainly saw a rebound after hitting the $105pb level last week following the OPEC decision, or more relevantly, the recession fears.
JP Morgan warns that crude prices could hit $380 per barrel, if Russia cuts output as a response to Westerns sanctions and mounting tensions. Yet, the global demand could hardly keep up, if the price of a barrel got multiplied by two or, by four from the actual levels.
Looking at the price dynamics, it’s more likely we see the barrel of crude fall below $100 than rise above $200.
Dollar gains
The US dollar index starts the week on a strong footage. The greenback reversed losses it recorded during the second half of June, and the dollar index is again very close to the 20-year peak it hit on June 15th, above 105 level.
The EURUSD is under a decent selling pressure. The pair fell to 1.0365 on Friday. We now see a triple bottom formation around the 1.0350/60 region, which could point at a possible rebound above the 1.05 level. But breaking the 1.0350 support will likely send the pair surfing lower on stops, and get the euro bears to target parity, again.
A further fall in the EURUSD would be justified by the expectation that the European Central Bank (ECB) won’t be able to catch up with the speed of tightening of other central banks, as the Europeans must make sure that raising the rates wouldn’t trigger a renewed debt crisis in the middle of a continent ravaged by pandemic, war and a serious energy crisis.
Elsewhere, the Reserve Bank of Australia (RBA) is expected to raise the rates by 50bp at its meeting tomorrow. But the AUDUSD remains under a decent selling pressure below the 70 cents mark, and the sharp fall in iron ore prices, due to the recession fears, doesn’t play in favour of a stronger Aussie these days.
EUR/USD Daily Outlook
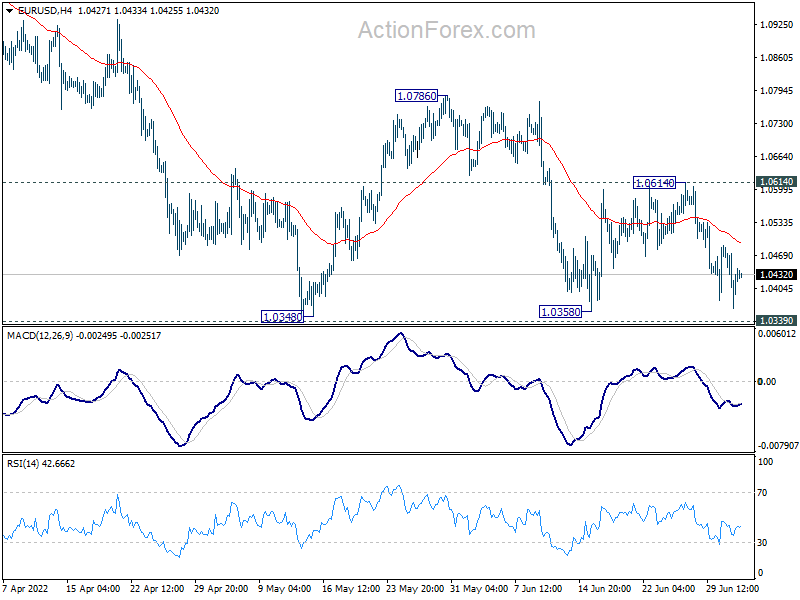
Daily Pivots: (S1) 1.0366; (P) 1.0428 (R1) 1.0489; More...
EUR/USD is still holding in range above 1.0339/58 support zone and intraday bias remains neutral first. Further decline is expected as long as 1.0614 resistance holds. On the downside, sustained break of 1.0339/48 will resume larger down trend. Next target is long term projection level at 1.0090. On the upside, above 1.0614 will turn bias back to the upside for 1.0786 resistance instead.
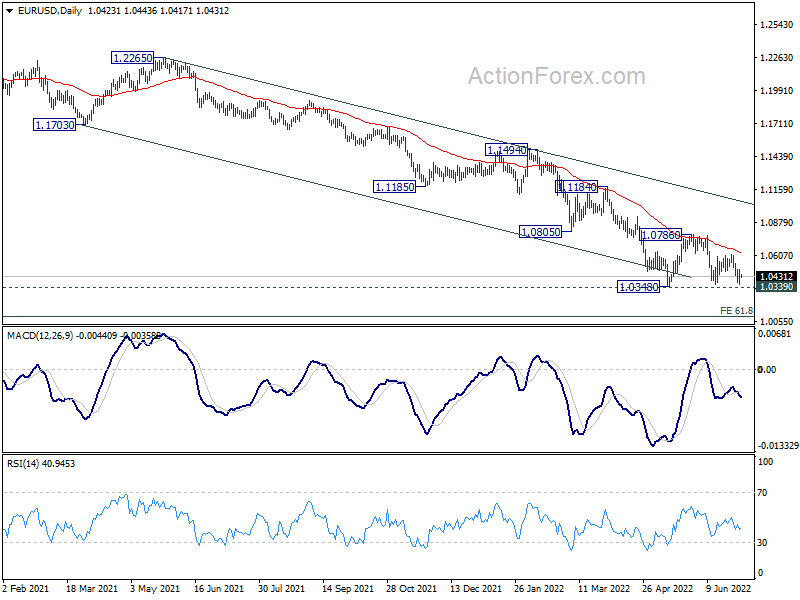
In the bigger picture, focus stays on 1.0339 long term support (2017 low). Decisive break there will resume whole down trend from 1.6039 (2008 high). Next target is 61.8% projection of 1.3993 to 1.0339 from 1.2348 at 1.0090. However, firm break of 1.0805 support turned resistance will delay this bearish case, and bring stronger rebound first.
Slow Start to a Week with RBA Hike, Fed and ECB Minutes, NFP
It's a rather slow start to the week, with major pairs and crosses stuck inside Friday's range. Trading could remain subdued for the day with the US on holiday. But there are lots of events to look forward to, starting from RBA's rate hike tomorrow. Minutes of Fed and ECB meeting might not reveal anything new. Instead, important data like ISM services and non-farm payroll would provide more guidance to the markets.
Technically, Dollar is in upper hand against both Euro and Sterling. Yet, both EUR/USD and GBP/USD are still held above recent lows at 1.0358 and 1.1932 respectively. These two levels will be the main focuses for the week as the US publishes important economic data.
In Asia, at the time of writing, Nikkei is up 0.68%. Hong Kong HSI is flat. China Shanghai SSE is up 0.35%. Singapore Strait Times is up 0.74%. Japan 10-year JGB yield is flat at 0.221.
Australia expects resource and energy export earnings to make successive records this year and next
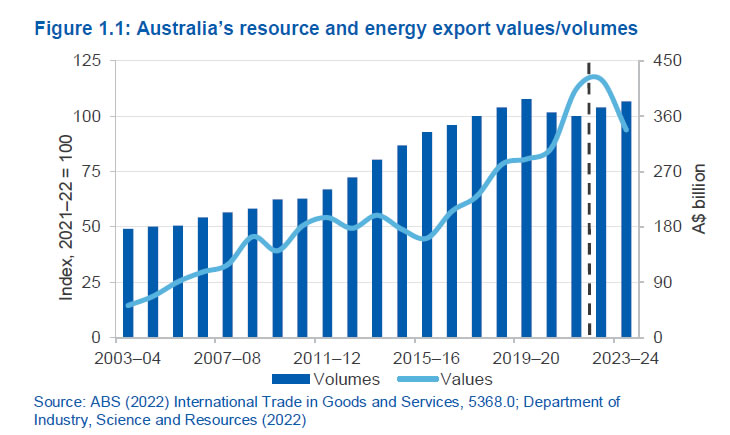
Australia's Department of Industry, Science and Resources said in a new quarterly report that resources and energy exports earnings are expected deliver two successive record years in 2021-2022 and 2022-2023, before falling slightly in 2023-24 to a third highest ever figure.
Resources and energy export earnings are estimated to be at AUD 405B in 2021-22, AUD 419B in 2022-23, and then notably lower at AUD 338B in 2023-24. The growth was mainly driven by higher prices as volume would remain below 2019-20 high throughout the forecast period.
CHF/JPY topped in short term, but up trend intact
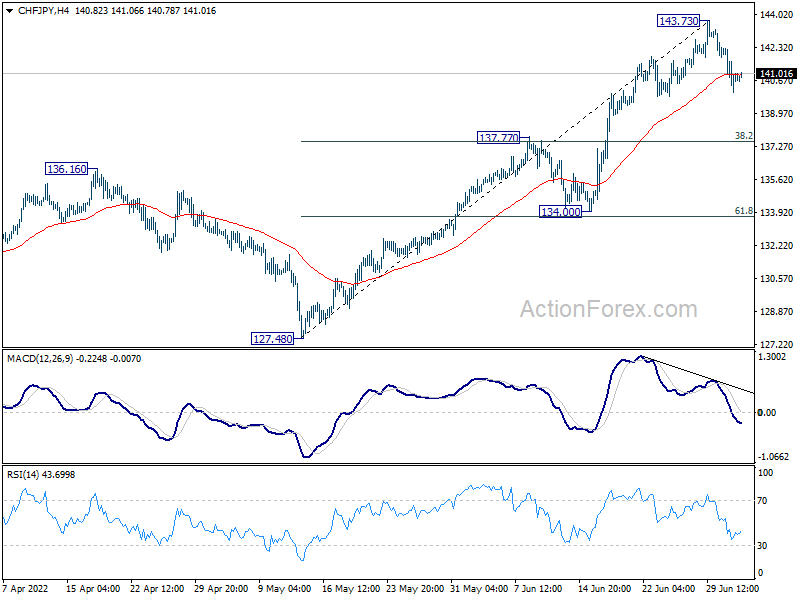
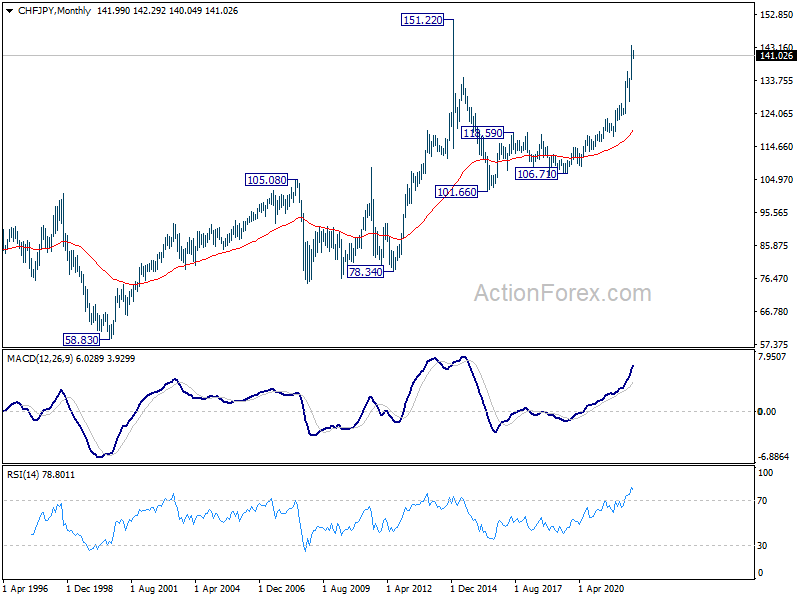
CHF/JPY's up trend should have passed its climax for the near term. It has been lifted by buying in Swiss Franc on SNB's hawkish rate hike in June, while BoJ is still standing firm by its ultra loose monetary policy. But recent pull back in benchmark treasury yields is giving Yen a lift. Meanwhile, as for the Franc, the pull back could be deeper if EUR/CHF manages to rebound firmly from 0.9970 long term support.
Technically, a short term top should be in place at 143.74, on bearish divergence condition in 4 hour MACD. Deeper correction cannot be ruled out for now. But downside should be contained by 137.77 cluster support (38.2% retracement of 127.48 to 143.73 at 137.52) to bring rebound. The overall long term up trend in CHF/JPY is still in healthy shape to retest 151.22 high (2014 high, the spike after SNB removed the EUR/CHF floor).
RBA to hike 50bps, Fed and ECB to publish minutes, NFP featured too
RBA is widely expected to raise interest rate by 50bps to 1.35% this week. A 75 bps was ruled out by Governor Philip Lowe, as he said only the 25bps and 50bps options were on the table. The central bank should also maintain tightening bias, setting the stage for more rate hikes down the road. Lowe has indicated in an interview that it's reasonably to get the cash rate to 2.50% at some point. Nevertheless, the path would be data dependent. Fed and ECB will publish meeting minutes too.
The economic data calendar is also very busy. US ISM services and non-farm payroll report are the main focuses. But attention will also be on Eurozone Sentix, China PMI services, Swiss CPI, and Canada employment.
Here are some highlights for the week:
- Monday: Japan monetary base; Australia MI inflation gauge, building approvals; Germany trade balance; Swiss CPI; Eurozone Sentix investor confidence, PPI; Canada PMI manufacturing, BoC business outlook survey.
- Tuesday: Australia AiG construction, retail sales, RBA rate decision; China Caixin PMI services; France industrial production, Eurozone PMI services final; UK PMI services final; Canada building permits; US factory orders.
- Wednesday: Germany factory orders; UK PMI construction; Eurozone retail sales; US ISM services, FOMC minutes.
- Thursday: Australia AiG services, trade balance; Japan leading indicators; Swiss unemployment rate, foreign currency reserves; Germany industrial production; ECB meeting accounts; US ADP employment, jobless claims, trade balance; Canada trade balance, Ivey PMI.
- Friday: Japan household spending, current account; France trade balance; Italy industrial production; Canada employment; US non-farm payrolls.
EUR/USD Daily Outlook
Daily Pivots: (S1) 1.0366; (P) 1.0428 (R1) 1.0489; More...
EUR/USD is still holding in range above 1.0339/58 support zone and intraday bias remains neutral first. Further decline is expected as long as 1.0614 resistance holds. On the downside, sustained break of 1.0339/48 will resume larger down trend. Next target is long term projection level at 1.0090. On the upside, above 1.0614 will turn bias back to the upside for 1.0786 resistance instead.
In the bigger picture, focus stays on 1.0339 long term support (2017 low). Decisive break there will resume whole down trend from 1.6039 (2008 high). Next target is 61.8% projection of 1.3993 to 1.0339 from 1.2348 at 1.0090. However, firm break of 1.0805 support turned resistance will delay this bearish case, and bring stronger rebound first.
Economic Indicators Update
| GMT | Ccy | Events | Actual | Forecast | Previous | Revised |
|---|---|---|---|---|---|---|
| 23:50 | JPY | Monetary Base Y/Y Jun | 3.90% | 4.90% | 4.60% | |
| 01:00 | AUD | TD Securities Inflation M/M Jun | 0.30% | 1.10% | ||
| 01:30 | AUD | Building Permits M/M May | 9.90% | -1.80% | -2.40% | -3.90% |
| 06:00 | EUR | Germany Trade Balance (EUR) May | 4.2B | 3.5B | ||
| 06:30 | CHF | CPI M/M Jun | 0.30% | 0.70% | ||
| 06:30 | CHF | CPI Y/Y Jun | 3.20% | 2.90% | ||
| 08:30 | EUR | Eurozone Sentix Investor Confidence Jul | -20 | -15.8 | ||
| 09:00 | EUR | PPI M/M May | 1.00% | 1.20% | ||
| 09:00 | EUR | PPI Y/Y May | 36.70% | 37.20% | ||
| 13:30 | CAD | Manufacturing PMI Jun | 56.8 | |||
| 14:30 | CAD | BoC Business Outlook Survey |
CHF/JPY topped in short term, but up trend intact
CHF/JPY's up trend should have passed its climax for the near term. It has been lifted by buying in Swiss Franc on SNB's hawkish rate hike in June, while BoJ is still standing firm by its ultra loose monetary policy. But recent pull back in benchmark treasury yields is giving Yen a lift. Meanwhile, as for the Franc, the pull back could be deeper if EUR/CHF manages to rebound firmly from 0.9970 long term support.
Technically, a short term top should be in place at 143.74, on bearish divergence condition in 4 hour MACD. Deeper correction cannot be ruled out for now. But downside should be contained by 137.77 cluster support (38.2% retracement of 127.48 to 143.73 at 137.52) to bring rebound. The overall long term up trend in CHF/JPY is still in healthy shape to retest 151.22 high (2014 high, the spike after SNB removed the EUR/CHF floor).
Australia expects resource and energy export earnings to make successive records this year and next
Australia's Department of Industry, Science and Resources said in a new quarterly report that resources and energy exports earnings are expected deliver two successive record years in 2021-2022 and 2022-2023, before falling slightly in 2023-24 to a third highest ever figure.
Resources and energy export earnings are estimated to be at AUD 405B in 2021-22, AUD 419B in 2022-23, and then notably lower at AUD 338B in 2023-24. The growth was mainly driven by higher prices as volume would remain below 2019-20 high throughout the forecast period.
Technical Outlook and Review
DXY:
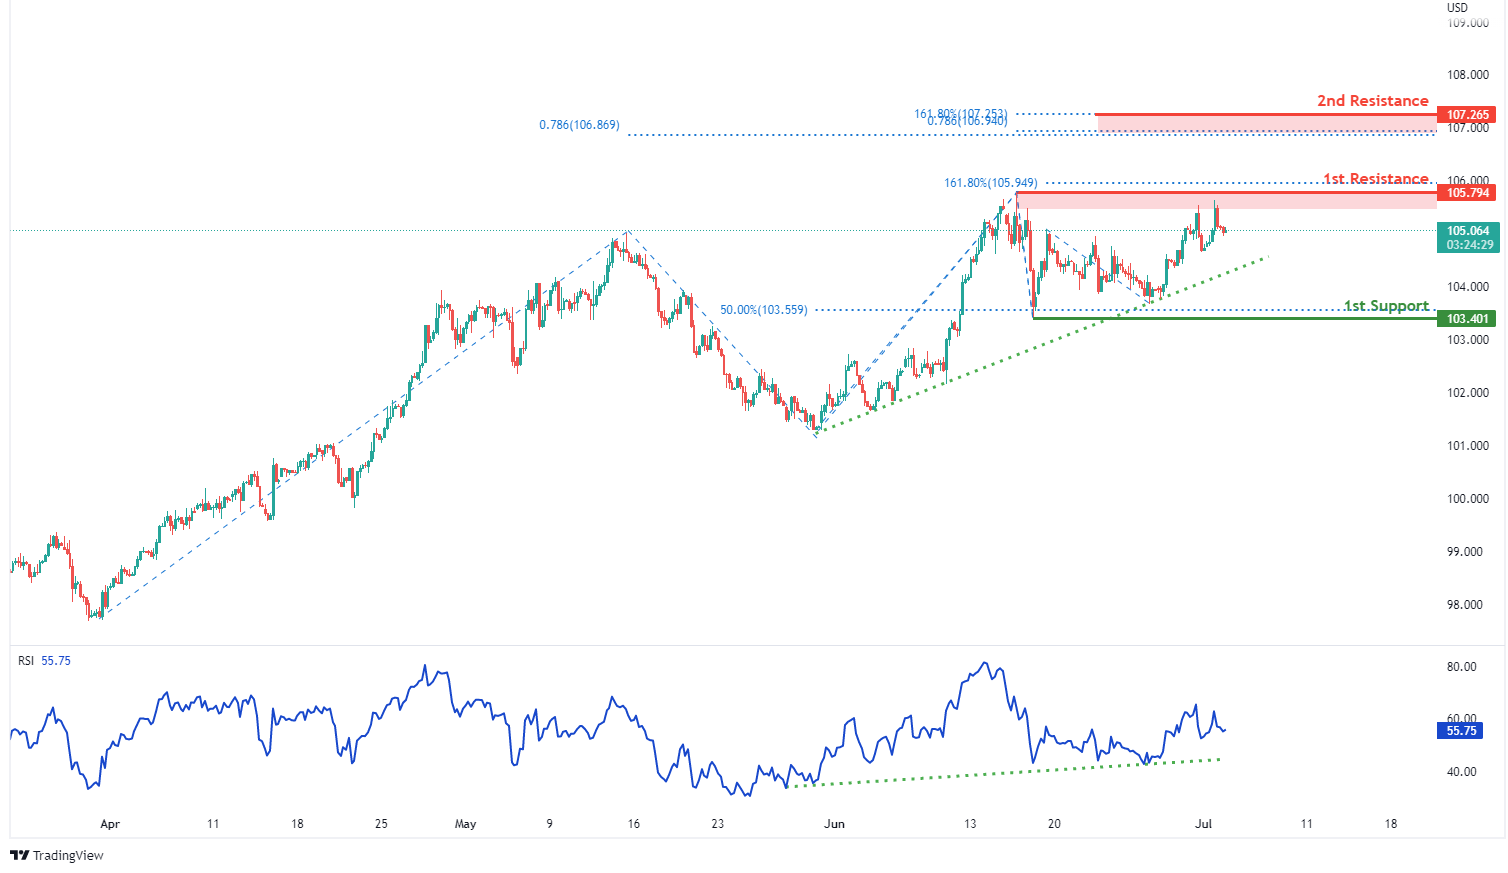
On the H4, with RSI moving along an ascending trendline and prices moving along the ascending trendline, we have a bullish bias that bullish momentum will carry prices to 1st resistance at 105.794 where the swing high resistance and 161.8% fibonacci extension are. Once we have upside confirmation, we would expect bullish momentum to carry prices to 2nd resistance at 107.265 in line with 161.8% fibonacci extension, 78.6% fibonacci projection and 78.6% fibonacci projection. Alternatively, price may drop to 1st support at 103.401 where the horizontal swing low support and 50% fibonacci retracement are.
Areas of consideration:
- H4 time frame, 1st resistance at 105.794
- H4 time frame, 1st support at 103.401
XAU/USD (GOLD):
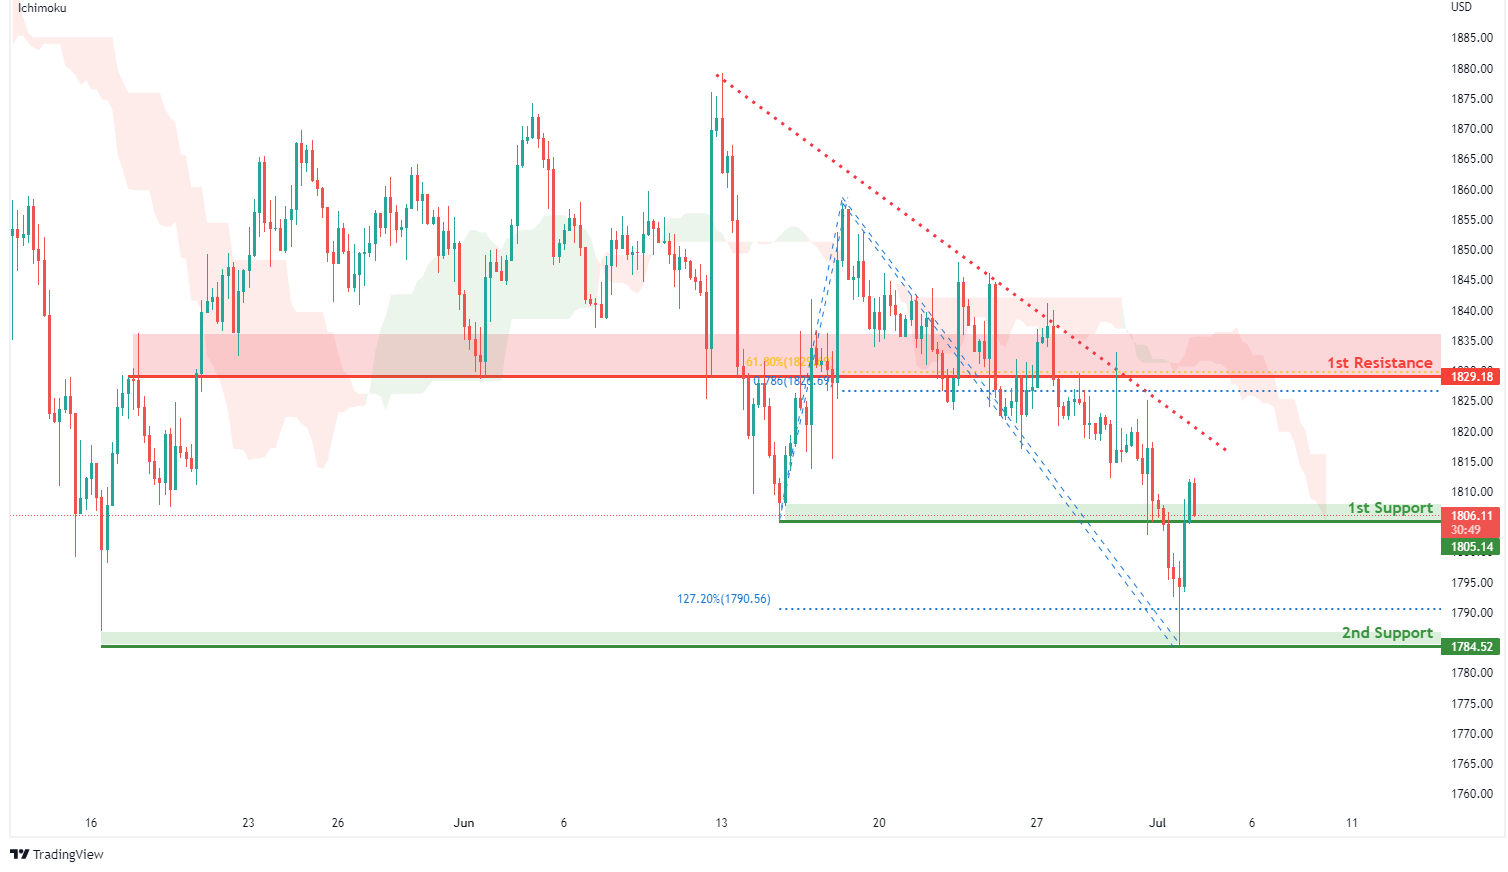
On the H4, with prices moving below the ichimoku indicator and along a descending trendline, we have a bearish bias that prices will drop to our 1st support at 1805.14 where the horizontal pullback support is. Once we have downside confirmation, we would expect bearish momentum to carry price to 2nd support at 1784.52 in line with swing low support and 127.2% fibonacci extension. Alternatively, price could rise to our 1st resistance at 1829.18 in line with overlap resistance, 61.8% fibonacci retracement and 78.6% fibonacci projection.
Areas of consideration:
- H4 time frame, 1st Resistance at 1829.18
- H4 time frame, 1st Support at 1805.14
GBP/USD:
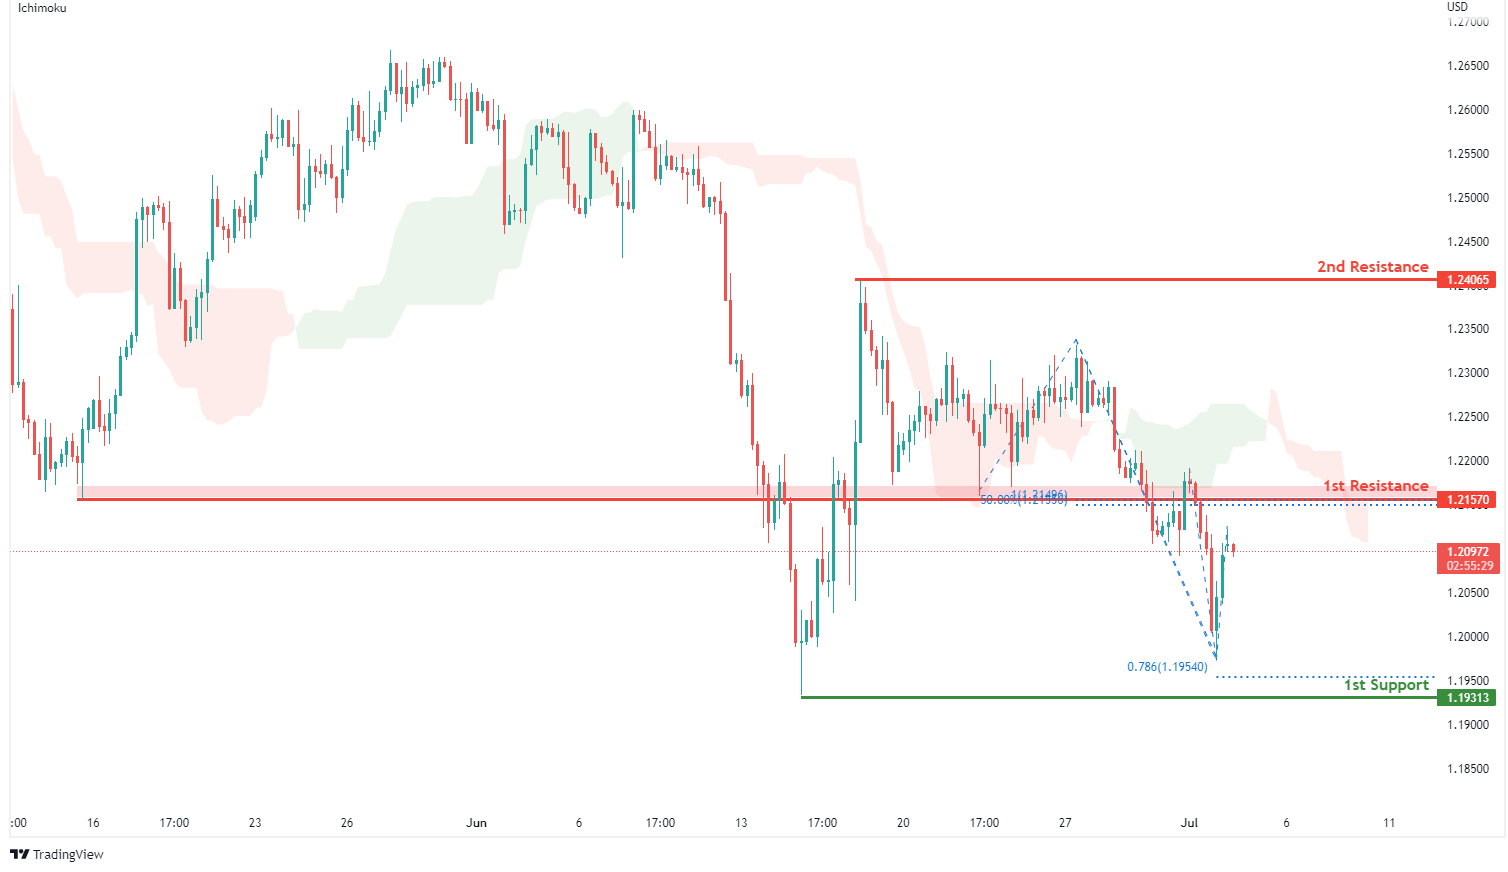
On the H4, with prices moving below the ichimoku indicator, we have a bearish bias that price will rise and drop from our 1st resistance at 1.21570 where the horizontal overlap resistance, 100% fibonacci projection and 50% fibonacci retracement are to our 1st support at 1.19313 where the horizontal swing low support and 78.6% fibonacci projection are. Alternatively, price could rise above 1st resistance structure and head to 2nd resistance at 1.24065 in line with the swing high resistance.
Areas of consideration:
- H4 1st resistance at 1.21570
- H4 1st support at 1.19313
USD/CHF:
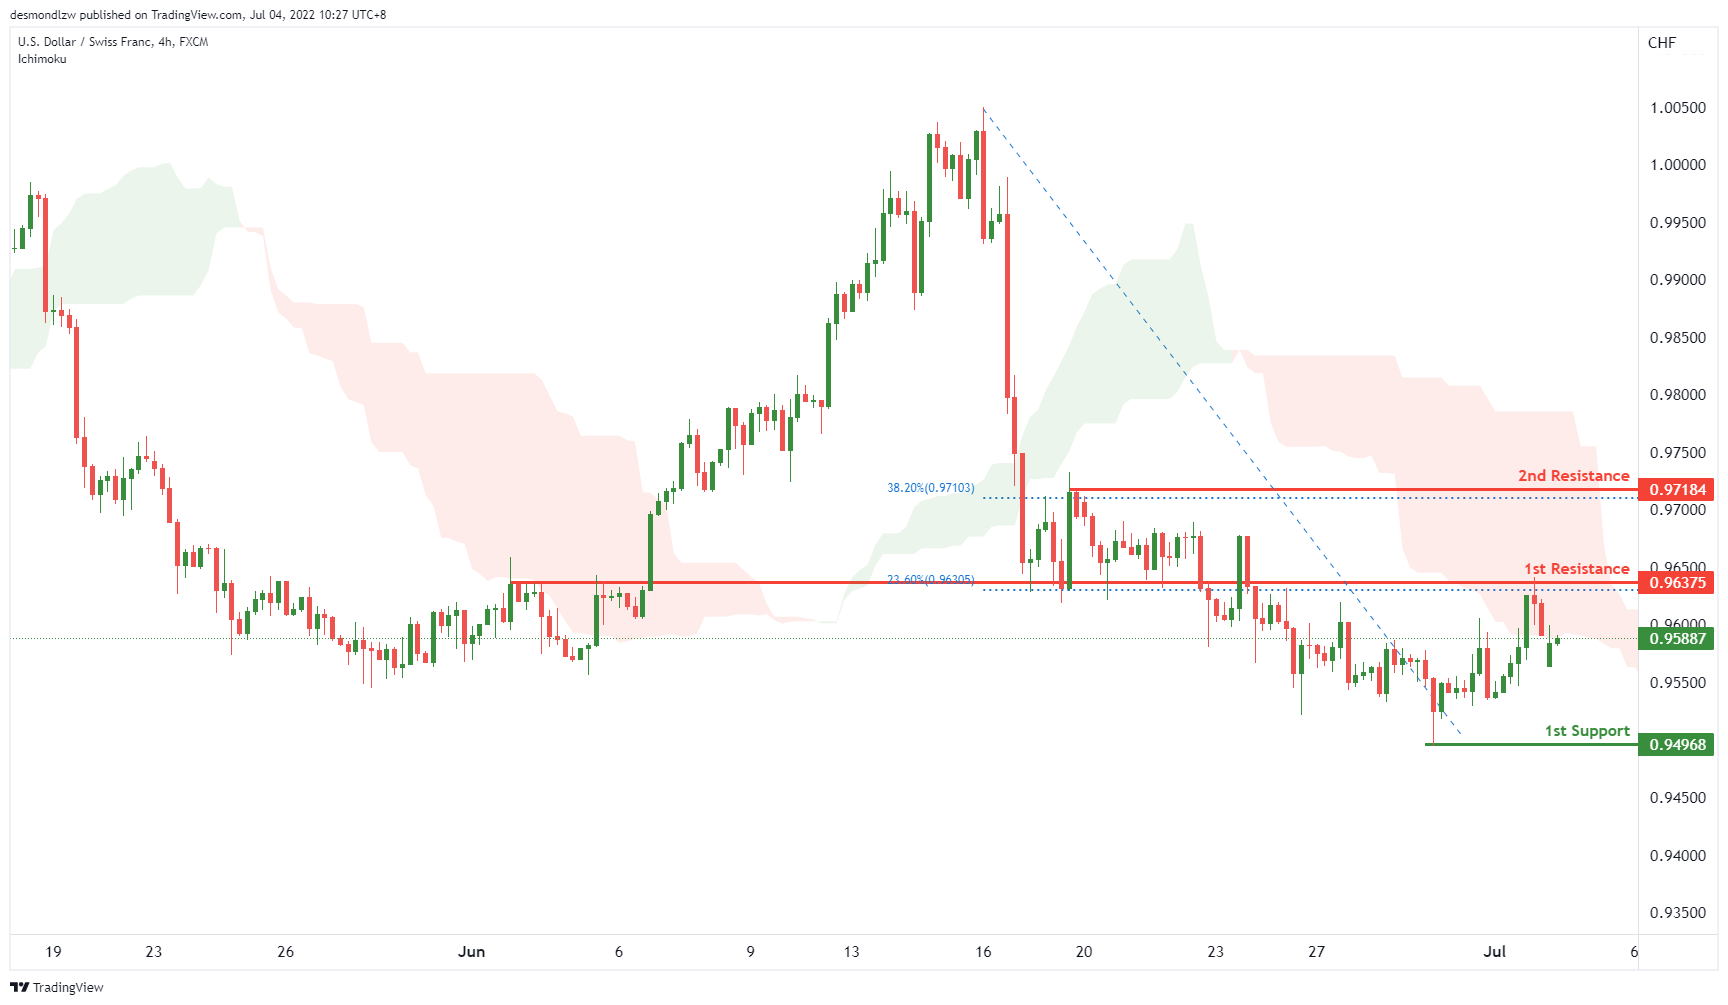
On the H4, with price moving below the ichimoku cloud , we have a bearish bias that price will continue to drop from the 1st resistance at 0.96375 in line with the horizontal pullback resistance and 23.6% Fibonacci retracement to the 1st support at 0.94968 in line with the horizontal swing low support. Alternatively, price may reverse off the 1st resistance and rise to the 2nd resistance where the 38.2% Fibonacci retracement and pullback resistance is.
Areas of consideration
- 1st support level at 0.94968
- 1st resistance level at 0.96375
EUR/USD :
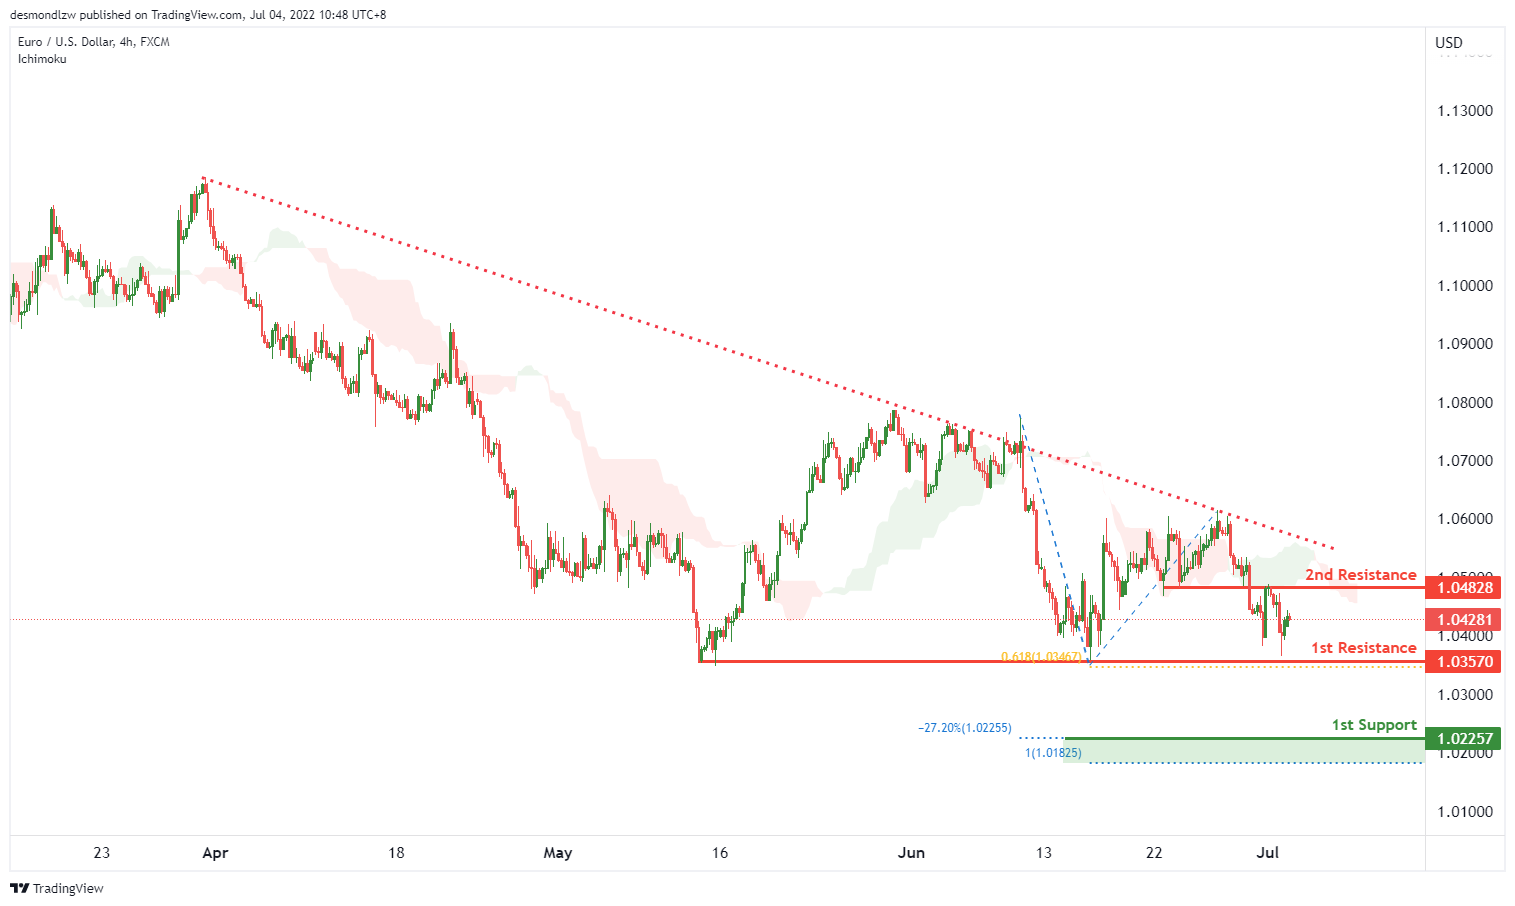
On the H4, with price moving in a descending trendline and below the ichimoku cloud, we have a bearish bias that the price will drop from the 1st resistance at 1.03570 in line with the multiple swing lows and 61.8% Fibonacci projection to the 1st support at 1.02257 in line with the -27.2% fibonacci expansion and 100% Fibonacci projection. Alternatively, price may reverse off the 1st resistance and rise to the 2nd resistance at 1.04828 at the pullback resistance.
Areas of consideration :
- H4 1st resistance at 1.03570
- H4 1st support at 1.02257
USD/JPY:
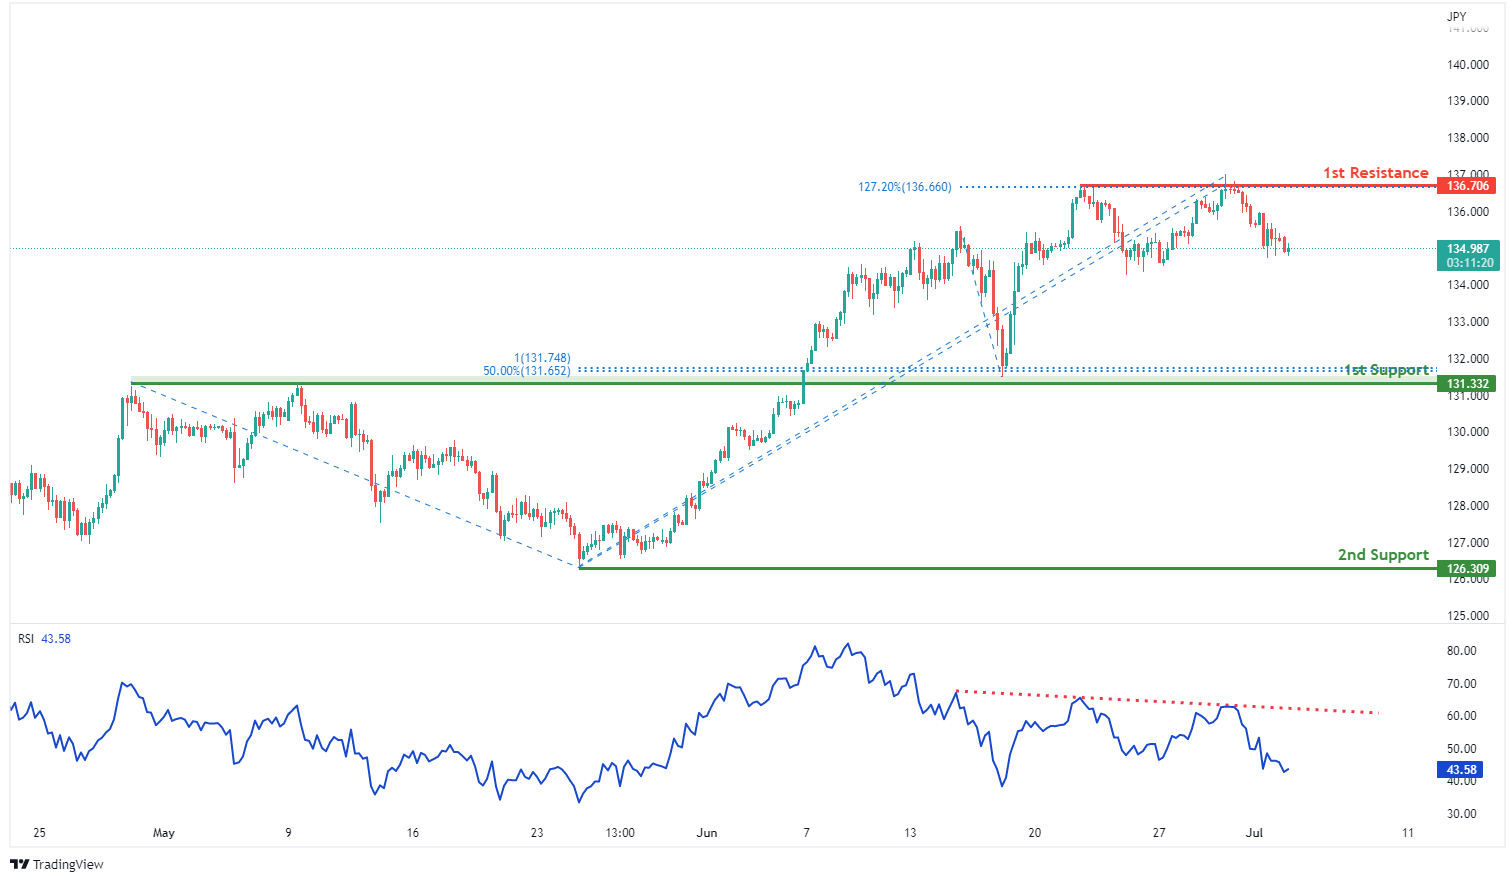
On the H4, with RSI moving along the descending trendline, we have a bearish bias that price will drop to our 1st support at 131.332 where the overlap support, 100% fibonacci projection and 50% fibonacci retracement are. Once there is downside confirmation, we would expect bearish momentum to carry price to our 2nd support at 126.309 where the swing low support is . Alternatively, price may rise to 1st resistance at 136.706 in line with the swing high resistance and 127.2% fibonacci extension.
Areas of consideration:
- H4 time frame, 1st resistance at 136.706
- H4 time frame, 1st support at 131.332
AUD/USD:
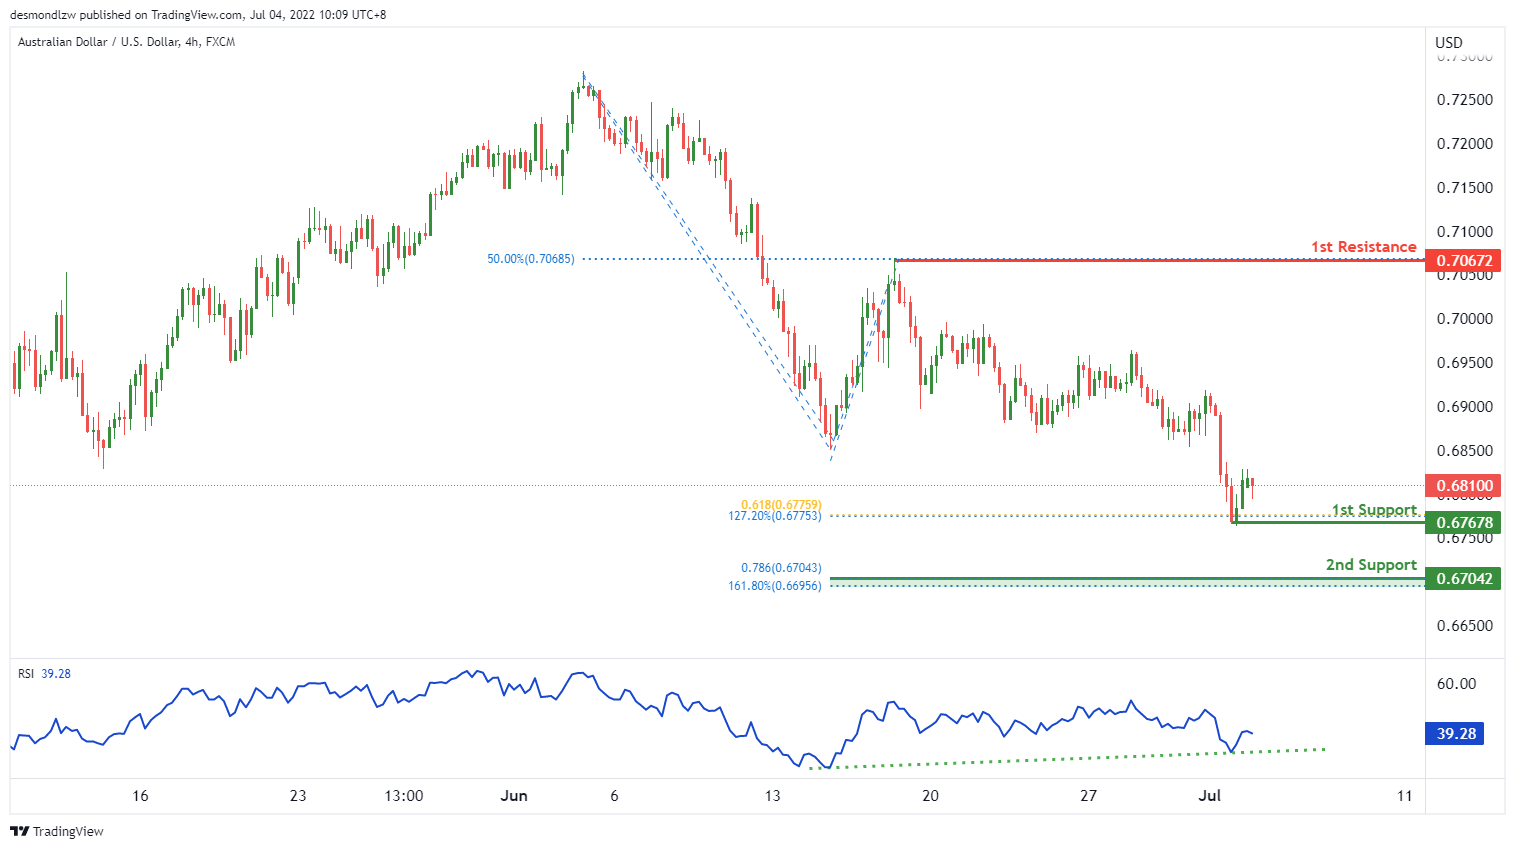
On the H4, with price moving in a bullish divergence on the RSI, we have a bullish bias that price will rise from the 1st support at 0.67678 at the swing low in line with the 61.8% fibonacci projection and 127.2% fibonacci extension to the 1st resistance at 0.70672 at the swing high in line with the 50% fibonacci retracement. Alternatively, price may reverse off the 1st support and drop to the 2nd support at 0.67042 in line with the 78.6% fibonacci projection and 161.8% fibonacci extension.
Areas of consideration
- H4 1st resistance at 0.70672
- H4 1st support at 0.67678
NZD/USD:
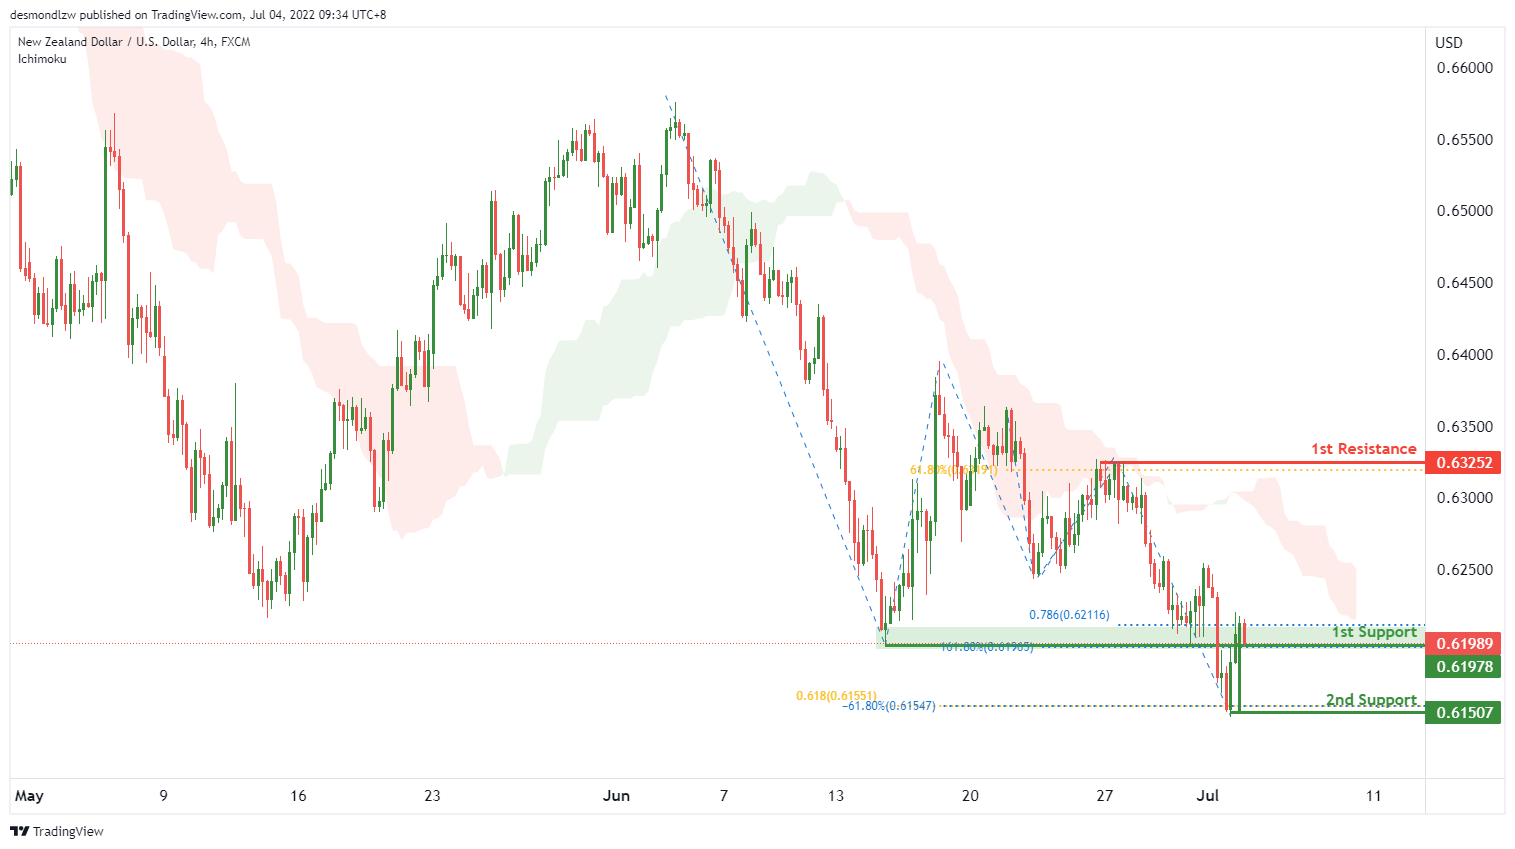
On the H4, with price recently bouncing off the confluence area at the 2nd support, we have a bullish bias that price will continue to rise from the 1st support at 0.61978 at the pullback support in line with the 78.6% fibonacci projection and 161.8% fibonacci extension to the 1st resistance at 0.63252 at the swing high in line with the 61.8% fibonacci retracement. Alternatively, price may reverse off the 1st support and drop to the 2nd support at 0.61507 in line with the 61.8% fibonacci projection and -61.8% fibonacci expansion.
Areas of consideration:
- H4 time frame, 1st support at 0.61978
- H4 time frame, 1st resistance at 0.63252
USD/CAD:
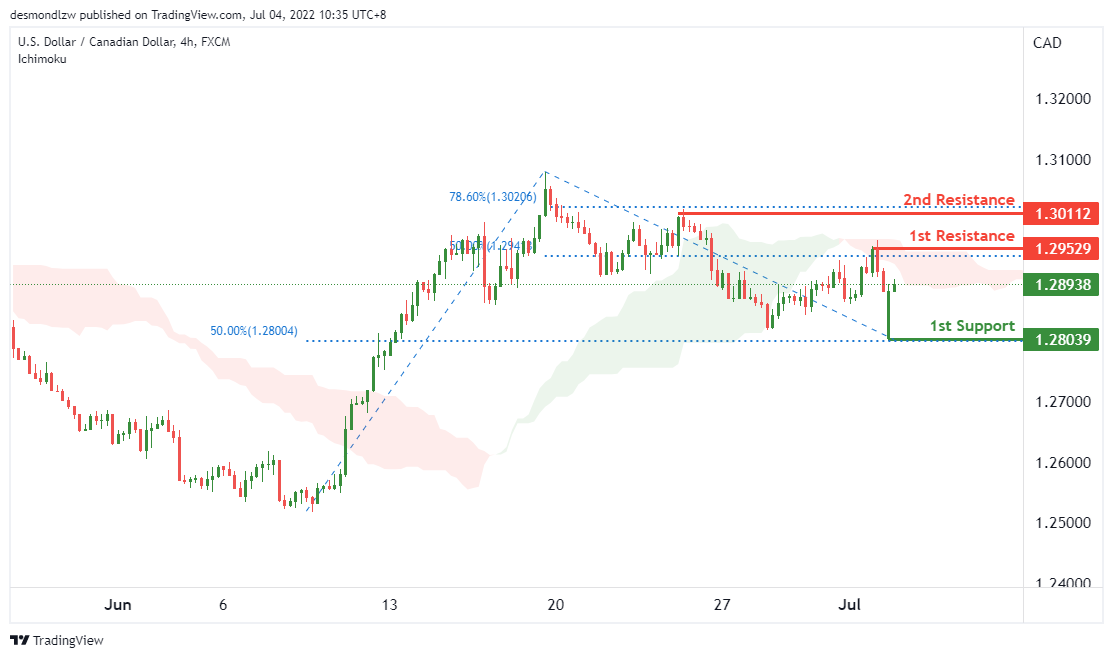
On the H4, with price expected to reverse off the ichimoku cloud , we have a bearish bias that price will continue to drop from the 1st resistance at 1.29529 in line with the horizontal swing high resistance and 50% Fibonacci retracement to the 1st support at 1.28039 in line with the 50% Fibonacci retracement and horizontal swing low support. Alternatively, price may reverse off the 1st resistance and rise to the 2nd resistance at 1.30112 where the 78.6% Fibonacci retracement and horizontal swing high resistance is.
Areas of consideration:
- H4 time frame, 1st resistance at 1.29529
- H4 time frame, 1st support at 1.28039
OIL:
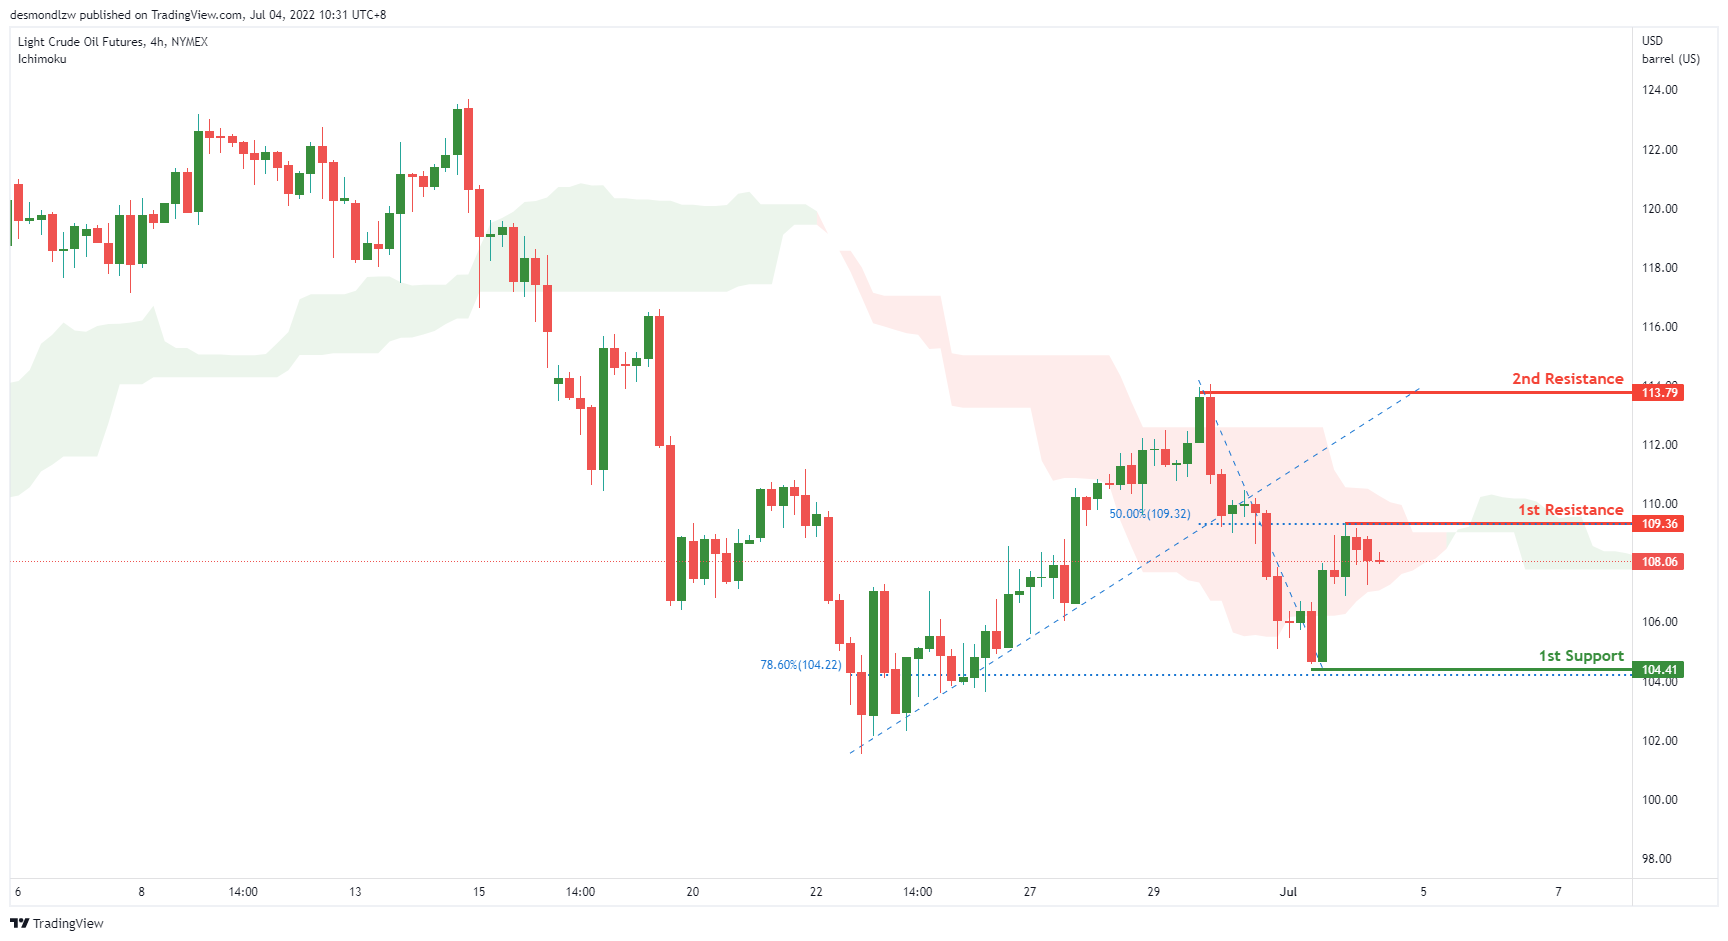
On the H4, with price expected to reverse off the ichimoku cloud , we have a bearish bias that price will continue to drop from the 1st resistance at 109.36 in line with the horizontal swing high resistance and 50% Fibonacci retracement to the 1st support at 104.41 in line with the 78.6% Fibonacci retracement and horizontal swing low support. Alternatively, price may reverse off the 1st resistance and rise to the 2nd resistance at 113.79 where the horizontal swing high resistance is.
Areas of consideration:
- H4 time frame, 1st resistance of 109.36
- H4 time frame, 1st support of 104.41
Dow Jones Industrial Average:
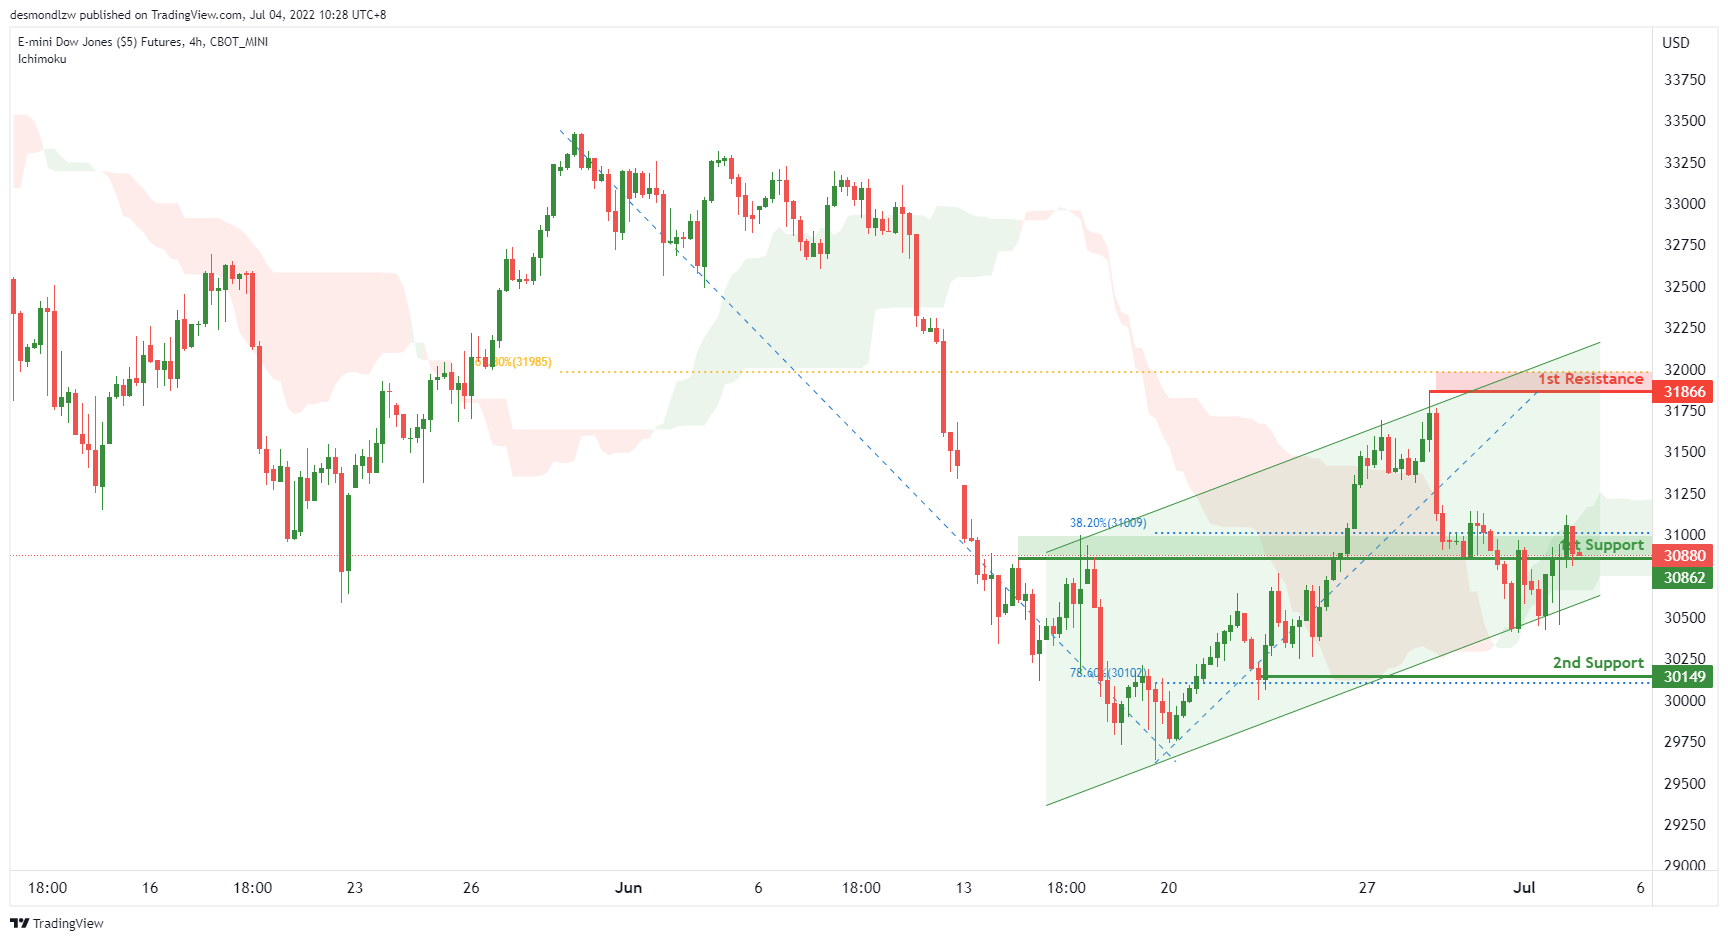
On the H4, with price moving along an ascending channel and expected to break out of the ichimoku cloud, we have a bullish bias that price will rise from our 1st support at 30862 where the horizontal pullback support and 38.2% Fibonacci retracement are to our 1st resistance at 31866 in line with the horizontal swing high resistance and 61.8% fibonacci retracement. Alternatively, price may break 1st support and head for 2nd support at 30149 where the horizontal swing low support and 78.6% fibonacci retracement are. Take note we are waiting for the break of the 1st resistance to confirm the bullish move.
Areas of consideration:
- H4 time frame, 1st resistance of 31866
- H4 time frame, 1st support of 30862
Forex and Cryptocurrencies Forecast
EUR/USD: The Dollar Is Gaining Strength Again
The EUR/USD pair moved in a sideways channel of 1.0500-1.0600 for a week and a half. However, it is clear that neither investors nor speculators are interested in such stagnation. But some kind of trigger is needed to break out of it.
The last meeting of the G7 leaders and the NATO summit did not have any particularly loud statements. At both events, a desire was expressed to continue helping Ukraine in its military confrontation with Russia, and the NATO bloc was replenished with two new members, Sweden and Finland. But these results were not enough to somehow influence the quotes of the dollar and the euro.
The trigger for the strengthening of the dollar, which forced the EUR/USD pair to go south on Tuesday, June 28 and break through the lower limit of the channel the next day, was the growth in demand for protective assets amid concerns about the prospects for the world economy. And taking into account the fact that the American currency has recently acted as a protective asset, the scales have tilted in its direction.
Speaking at the annual forum of the European Central Bank in Sintra, Portugal, ECB President Christine Lagarde said that "inflation expectations in the Eurozone are much higher than before", that "we are unlikely to return to conditions of low inflation soon", and that the regulator "will go as far as necessary to reduce inflation to the target of 2%". Christine Lagarde confirmed that the ECB intends to raise its key interest rate by 0.25% at its meeting on July 21 in order to achieve this goal. However, according to market participants, such a modest step is unlikely to have any serious effect. And the next meeting of the Bank will take place only in autumn, on September 08. So, most likely, inflation will continue to grow during this period.
The speech of US Federal Reserve Chairman Jerome Powell, who participated in the ECB forum as a colleague and guest of honor, was quite different in tone from the words of Christine Lagarde. The American assured the audience that the US economy is in a good position to cope with the active tightening of monetary policy, which is being implemented by his department.
The divergence between the ECB's careful monetary policy and the hawkish Fed has always been interpreted by the market in favor of the dollar. The same happened this time as well, and the EUR/USD pair continued its fall.
The European currency was slightly helped by weak macro data from the US in the second half of June 30. The impetus for a temporary rise in the pair was the release of data on GDP, which turned out to be less than expected, falling by 1.6% instead of the expected 1.5%. In addition, statistics showed a slowdown in economic growth rates from 5.5% to 3.5%. Data on basic spending on personal consumption in the United States did not live up to expectations either. Data on applications for unemployment benefits in the United States turned out to be noticeably worse than expected. Thus, the number of initial requests should have been reduced from 233K to 218K. However, their number decreased to only 231 thousand. The situation is similar with repeated requests, which decreased from 1.331K to just 1.328K.
However, all of the above negative factors provided only temporary support to the European currency. Fixing quarterly profit on the dollar did not help it much, and it went on the offensive again on Friday. The publication of data on inflation in the Eurozone, which accelerated from 8.1% to 8.6%, only speeded up the flight of investors to safe assets. As a result, the pair fixed a local bottom at 1.0364 and ended the five-day period at 1.0425.
The votes of experts at the time of writing the review, on the evening of July 01, are divided as follows: 35% side with the bulls, 50% - with the bears, and 15% are neutral. Among the oscillators on D1, 75% are red, 10% are green, and 15% are neutral gray. Trend indicators have 100% on the red side. The nearest resistance is located in the zone 1.0470-1.0500, then the zone 1.0600-1.0615 follows, in case of success the bulls will try to rise to the zone 1.0750-1.0770, the next target is 1.0800. Except for 1.0400, the bears' task number 1 is to break through the support zone 1.0350-1.0364, formed by the lows of May 13 and July 01. If successful, they will move on to storm the 2017 low of 1.0340, below is only 20-year-old support and the cherished goal, 1:1 parity.
This coming week, July 04 is a public holiday in the USA: the country celebrates Independence Day. Statistics on retail sales in the Eurozone will be released on Wednesday, July 06. The publication on the same day of the ISM index of business activity in the US services sector and the minutes of the June meeting of the FOMC (Federal Open Market Committee) are also noteworthy. A similar minute of the ECB meeting and the ADP report on the level of employment in the US private and non-farm sectors and the number of initial applications for unemployment benefits will be published on Thursday, July 07. And another portion of data from the US labor market will arrive on Friday, October 08, including such important indicators as the unemployment rate and the number of new jobs created outside the agricultural sector (NFP).
GBP/USD: Similarities and Differences with EUR/USD
GBP /USD showed similar dynamics to EUR/USD last week. The reasons for the ups and downs of quotes are also similar. Therefore, it makes no sense to list them again. The pair moved clamped in the side channel 1.2165-1.2325 for a week and a half, and then flew down on June 28. A breakdown of support at 1.2100 increased bearish pressure, and it recorded a two-week low at 1.1975. This was followed by a correction to the north, and the pair finished at 1.2095;
Despite the fact that the euro and the pound behaved similarly against the dollar, there are still differences between them. The position of the Eurozone economy is complicated by a heavy dependence on Russian natural energy, the supply of which is limited due to sanctions imposed on Russia after its invasion of Ukraine. The situation is gradually improving: it became known that the United States bypassed Russia in gas supplies to Europe in June, for the first time. However, the final solution of the energy problem is still far away.
Unlike the EU, the UK's dependence on Russian energy is minimal. However, the strengthening of the British currency is hampered by political instability. Prime Minister Boris Johnson already survived a vote of no confidence in June, with several lawmakers from his own Conservative Party voting against him. In addition, after the by-elections, the party lost two seats in the UK Parliament. Problems associated with Brexit also add nervousness. The British pound came under additional pressure after MPs approved a bill allowing ministers to cancel part of the Northern Ireland protocol.
As for the country's economy, according to some experts, inflation in the United Kingdom will continue to grow and may exceed 11% by November.
At the moment, 60% of experts believe that the pair GBP/USD will try to consistently test the support of 1.1975 and 1.1932 in the near future. 40%, on the contrary, are waiting for a breakdown of the resistance at 1.2100 and further to the north. Among the trend indicators on D1, the power ratio is 100:0% in favor of the reds. Among the oscillators, the advantage of the bears is slightly less: 75% indicate a fall, the remaining 25% have turned their eyes to the east. Strong support lies at 1.2000, followed by lows of July 01 at 1.1975 and of June 14 at 1.1932. The bears' medium-term target may be the March 2020 low of 1.1409. In case of growth, the pair will meet resistance in the zones and at the levels of 1.2100, 1.2160-1.2175, 1.2200-1.2235, 1.2300-1.2325, 1.2400-1.2430, 1.2460, then the targets in the area of 1.2500 and 1.2600 follow.
As for the macroeconomic calendar for the UK, we advise you to pay attention to Tuesday, July 05, when the speech of the head of the Bank of England Andrew Bailey is expected. The composite PMI index and the index of business activity in the UK services sector will be published on the same day, and the index of business activity in the construction sector of this country a day later.
USD/JPY: Just a Breather or a Change in Trend?
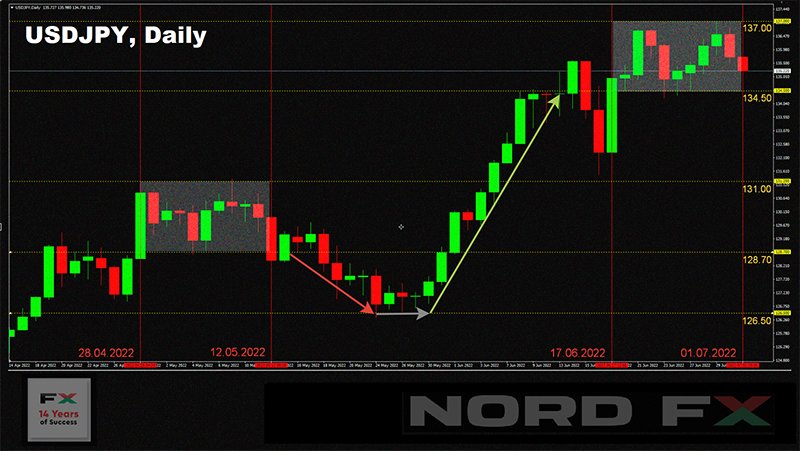
USD/JPY hit a new 24-year high last week once again, climbing to a high of 136.99 on Wednesday June 29. However, the difference from the previous high of June 22 is less than 30 points, and the two-week chart already looks more like a sideways channel than an uptrend. Perhaps the strength of the bulls has dried up and they, at least, need a break.
And perhaps, finally, the long-awaited dream of Japanese importers and housewives will come true, and the yen will go on the offensive, regaining the status of a popular safe-haven currency? It's possible. But not guaranteed. The difference between the super-dove monetary policy of the Central Bank of Japan and the distinctly hawkish monetary policy of the US Central Bank is too great.
Most analysts (50%) still expect the pair to move down at least to the 129.50-131.00 zone. 30% of experts vote for the fact that the pair will once again try to renew the maximum and rise above 137.00, and 20% believe that the pair will take a breather, moving in the side channel 134.50-137.00. For indicators on D1, the picture is very different from the opinion of experts. For oscillators, 65% are colored green (of which 10% are in the overbought zone), the remaining 35% have taken a neutral position. For trend indicators, 65% point north as well, and only 35% point south. The nearest support is located at 134.50-134.75, followed by zones and levels at 134.00, 133.50, 133.00, 132.30, 131.50, 129.70-130.30, 128.60 and 128.00. Apart from overcoming the immediate resistance at 136.00-136.35 and taking the height of 137.00, it is difficult to determine further targets for the bulls. Most often, such round levels as 137.00, 140.00 and 150.00 appear in the forecasts. And if the pair's growth rates remain the same as in the last 3 months, it will be able to reach the 150.00 zone in late August or early September.
No important events, be it the release of macroeconomic statistics or political factors, are expected in Japan this week.
CRYPTOCURRENCIES: Will Bitcoin Drop to $1,100? We look at the US Federal Reserve.
The battle for $20,000 continued throughout the second half of June. The BTC/USD pair fell to $17,940, then rose to $21,940. It should be noted that $20,000 is historically the most important level for the main cryptocurrency. Suffice it to recall the catastrophic crash of December 2017, when bitcoin approached this mark, reaching a height of $19,270, and then collapsed by 84%. Many experts expect something similar now, predicting a further fall of another 50-80% for the BTC/USD pair. And Robert Kiyosaki, author of the bestselling book Rich Dad Poor Dad, predicts an even more powerful collapse of bitcoin, by 95%, to $1,100.
In the meantime (Friday evening, July 01), the coin is trading in the $19,440 zone. The total capitalization of the crypto market at this moment is $0.876 trillion ($0.960 trillion a week ago). The Crypto Fear & Greed Index, like a week ago, is in the Extreme Fear zone at around 11 points out of 100 possible.
If you look at the charts, you can see that the bears had a clear advantage over the past week. And, in fairness, we note that bitcoin itself is not really to blame for this. It's all about the strengthening of the dollar, which is growing due to the rise in rates and the tightening of the monetary policy of the US Central Bank. In such a situation, investors prefer to get rid of risky assets by purchasing US currency. Global stock markets are under pressure from sellers, the MSCI World and MSCI EM indices are going down, showing the situation in developed and emerging markets, respectively. Among the developed markets, the main pressure fell on the European sites, but did not bypass he US either: the S&P500, Dow Jones and Nasdaq Composite, with which BTC is in direct correlation, are also moving south.
Additional downward pressure on the quotes of the first cryptocurrency is exerted by mining companies in need of liquidity. According to JPMorgan bank strategist Nikolaos Panigirtzoglou, this situation will continue in Q3 of 2022. According to the expert's calculations, public mining companies account for about 20% of the hash rate. Many of them sold bitcoins to cover operating expenses and service loans. Due to the more limited access to capital, private miners took similar steps as well. "Unloading will continue in Q3, if the profitability of production does not improve. This was already evident in May and June. There is a risk that the process will continue," the JPMorgan strategist believes.
According to Bloomberg, the cost of mining 1 BTC from $18,000-$20,000 at the beginning of the year dropped to about $15,000 in June due to the introduction of more energy-efficient equipment. However, it is not yet clear whether this will be enough for the stable functioning of the miners.
The recession in the cryptocurrency market will last for about 18 more months, and the industry will see the first signs of recovery after the easing of the Fed's monetary policy. This was stated by the head and founder of the Galaxy Digital crypto bank Mike Novogratz in an interview with New York Magazine. "I hope we have already seen the worst. I would be more confident about this if I knew what inflation would be like in the next two quarters. [...] I think the Fed will have to abandon the rate hike by the fall, and I believe that will make people calm down and start building again," said the head of Galaxy Digital.
According to Novogratz, the crisis has changed people's attitudes towards high-risk assets like cryptocurrencies. He noted that the past few months have shown the industry's dependence on leverage, which no one knew about. And it will take time now for the bankruptcy of weak players and the sale of collapsed assets. According to the head of Galaxy Digital, the situation is similar to the global financial crisis of 2008, followed by a wave of consolidation in the investment and banking industries.
Crypto analyst Benjamin Cowen doubts that the forecasts for a high BTC rate for 2023 can come true. In particular, he spoke about the forecast of venture capital investor Tim Draper, according to which the price of bitcoin could grow by more than 1000% from current levels and reach $250,000.
"I used to believe that BTC would be above $100,000 by 2023, but now I am skeptical about this idea. Especially after the Fed's policy has changed so much over the past six months," Cowen wrote. "I also look at other things, like social media statistics, and I see that the number of people interested in cryptocurrencies is in a downtrend. If it is difficult for people to buy gasoline, it will be even more difficult to buy bitcoin."
Instead of a huge rally, Cowen predicts an uninteresting BTC market over the next two years: "I think the bear market will end this year, and then the accumulation phase will begin, as in 2015 and 2019. Then there will be slow preparations for the next bitcoin halving, and the Fed may lower interest rates due to the victory over inflation during this period."
It is clear that many forecasts depend on the models, indicators and other analysis tools used. For example, we wrote a week ago how the creator of The Daily Gwei, Anthony Sassano, and the co-founder of Ethereum, Vitalik Buterin, criticized the Stock-to-Flow (S2F) model, on the basis of which a popular analyst aka PlanB issued his forecasts. Following criticism, PlanB has unveiled a chart of not one, but five different forecasting models. Indeed, S2F showed an overly optimistic view. The most accurate picture was given by estimates based on the complexity and costs of mining the first cryptocurrency.
Another analyst named Dave the Wave uses a logarithmic growth curve (LGC) model and believes that BTC can grow by 1100% within 4 years and reach $260,000. In the short term, Dave the Wave predicts the possibility of bitcoin rising to $25,000.
According to the cryptanalytic platform CryptoQuant, most cyclical indicators (Bitcoin Puell Multiple, MVRV, SOPR and the MPI BTC Miner Position Index) indicate that bitcoin is close to the bottom. The readings of these indicators are based on a historical pattern that has preceded an uptrend several times. Indicators also suggest that bitcoin is currently undervalued, signaling an imminent rally. A significant amount of unrealized losses confirms this forecast.
Anthony Scaramucci, the founder of SkyBridge Capital investment fund, also said that the first cryptocurrency is "technically oversold". He made this conclusion by analyzing the current BTC price in the context of an exponential growth in wallet activity and an increase in the number of use cases. At the same time, the hedge fund manager advised investors to evaluate bitcoin in retrospect. With this approach, the asset will turn out to be "very cheap due to excess leverage, which is worth taking advantage of."
We talked at the end of the previous review about another "forecasting model" presented by the President of El Salvador, Nayib Bukele. "My advice is to stop looking at charts and enjoy your life. If you have invested in BTC, your investment is safe, its value will rise immeasurably after the end of the bear market. The main thing is patience," the head of state wrote.
And now Yifan He, CEO of Chinese blockchain company Red Date Technology, has responded to this advice. He compared cryptocurrencies to financial pyramids and stated that the authorities of El Salvador and the Central African Republic (CAR), who decided to legalize bitcoin, are in serious need of basic education in finance. According to He, the leaders of these states put entire countries at risk, unless their original intention was to fraud their own citizens. It is not yet known whether Naib Bukele was offended by such words. We will follow the news.
Eco Data 7/4/22
[php_everywhere instance="1"]