

Sample Category Title
AUD/USD Weekly Outlook
AUD/USD's down trend from 0.8006 resumed last week and dropped to as low as 0.6762. Strong support could still be seen from 0.6756/60 cluster support to bring rebound. On the upside, above 0.6918 resistance will indicate short term bottoming, and turn bias back to the upside for 0.7282 resistance. However, sustained break of 0.6756/60 will carry larger bearish implication and target 0.6461 fibonacci level next.
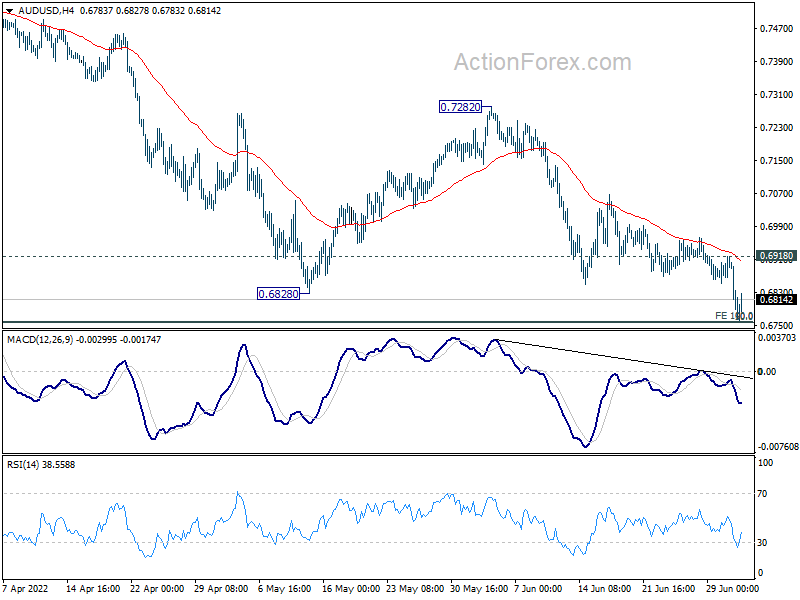
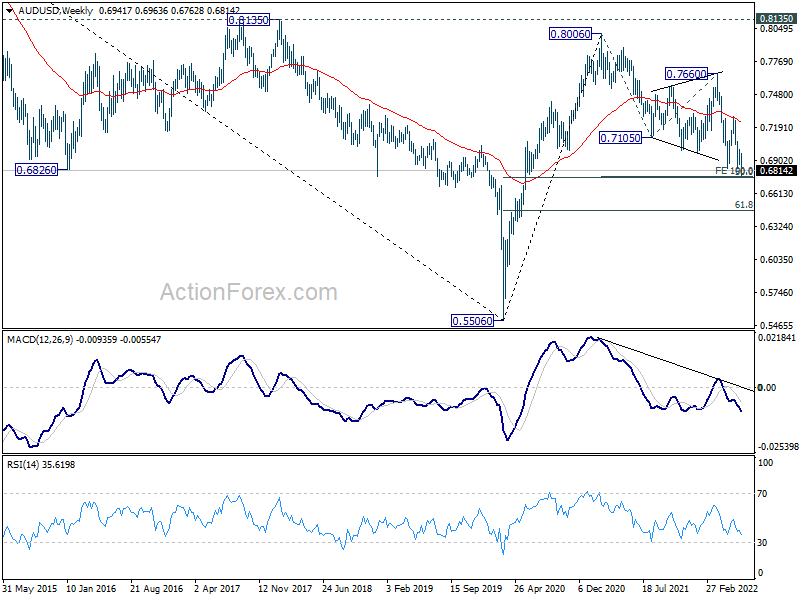
In the bigger picture, price actions from 0.8006 are seen as a corrective pattern to rise from 0.5506 (2020 low). Strong support is expected from 50% retracement of 0.5506 to 0.8006 at 0.6756 to complete the pattern. This coincides with 100% projection of 0.8006 to 0.7105 from 0.7660 at 0.6760. However firm break of 0.6756/60 will raise the chance of bearish reversal and target 61.8% retracement at 0.6461.
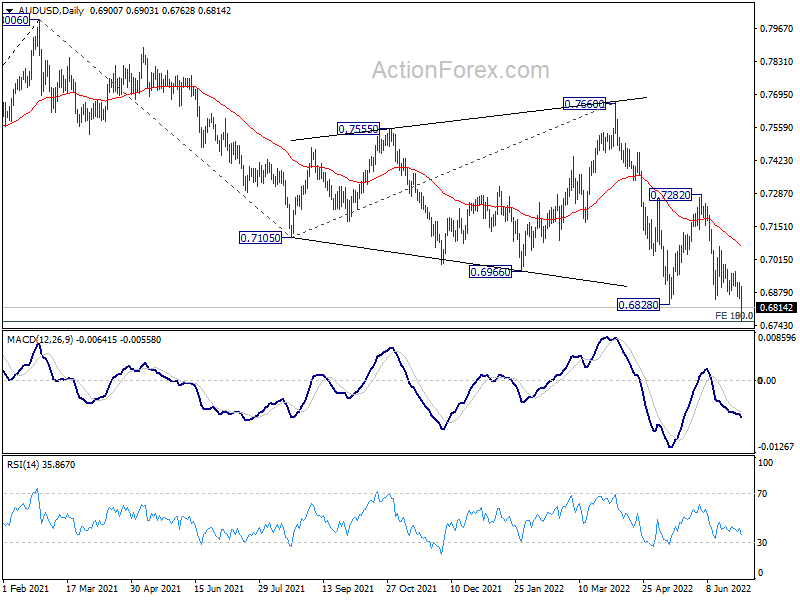
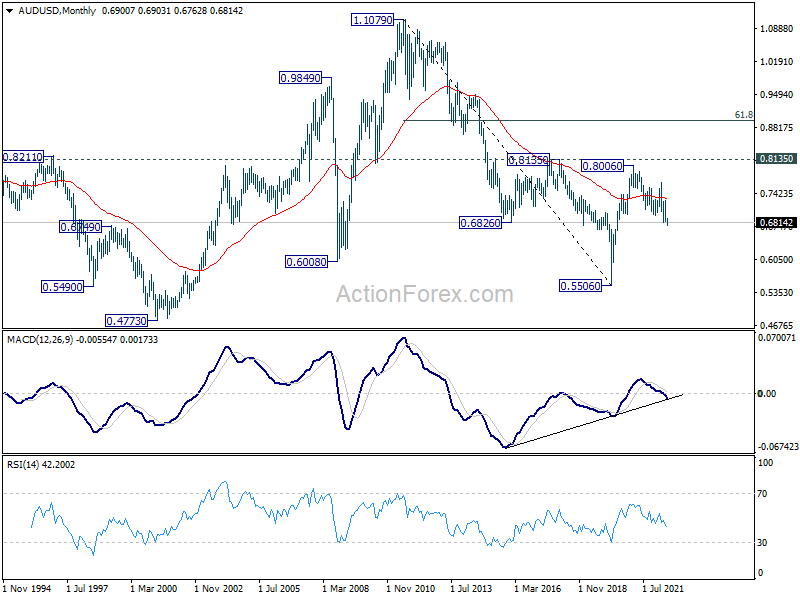
In the long term picture, rejection by 0.8135 resistance suggests that the long term down trend from 1.1079 (2011 high) is not ready to reverse. Yet, the structure of the fall from 0.8006 still argues that it's a corrective move. Hence, break of 0.5506 low is not envisaged for now. The long term outlook stays neutral first, and will be reassessed later after the fall from 0.8006 completes.
USD/CAD Weekly Outlook
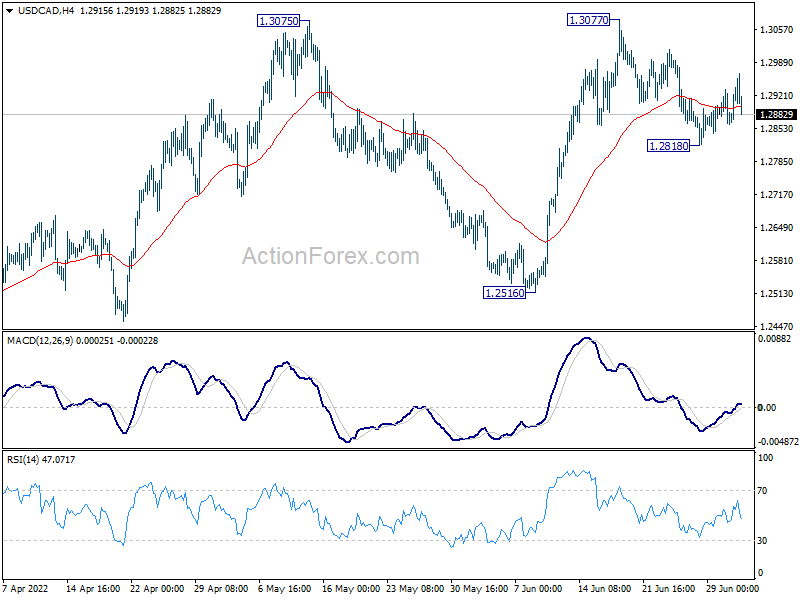
USDCAD dipped to 1.2818 last week but recovered. Initial bias remains neutral this week first. On the downside, break of 1.2818 minor support will resume the fall from 1.3077 towards 1.2516 support next. On the upside, break of 1.3077 and sustained trading above 1.3022 fibonacci level will carry larger bullish implications, and bring up trend resumption.
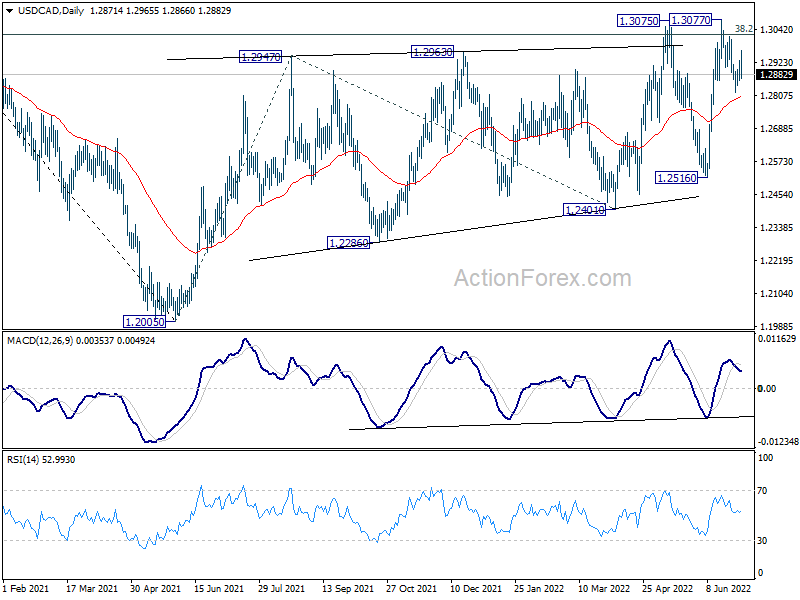
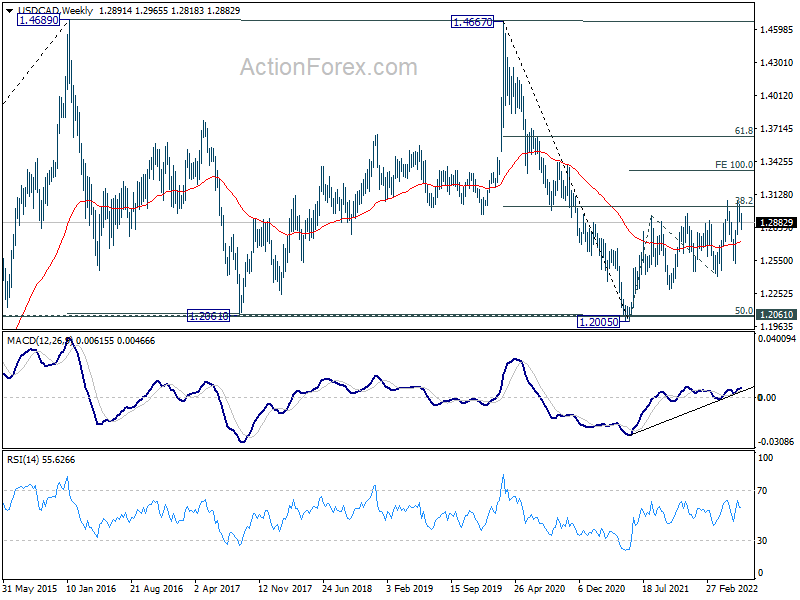
In the bigger picture, focus stays on 38.2% retracement of 1.4667 (2020 high) to 1.2005 (2021 low) at 1.3022. Sustained break there should confirm that the down trend from 1.4667 has completed after defending 1.2061 long term cluster support. Further rise would then be seen towards 61.8% retracement at 1.3650. However, rejection by 1.3022 will maintain medium term bearishness.
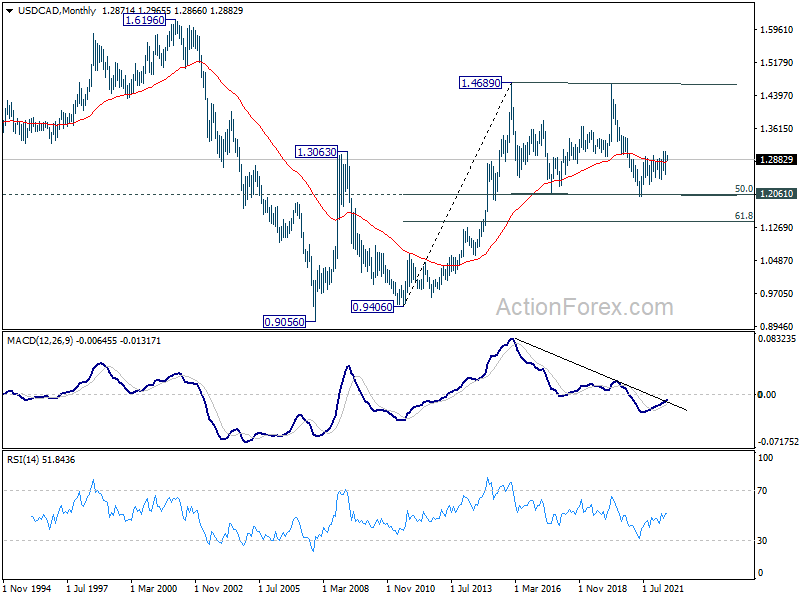
In the longer term picture, price actions from 1.4689 (2016 high) are seen as a consolidation pattern only. That is, up trend from 0.9506 (2007 low) is still expected to resume at a later stage. This will remain the favored case as long as 1.2061 support holds, which is close to 50% retracement of 0.9406 to 1.4689 at 1.2048. However, firm break of 1.2061 support will argue that USD/CAD has already started a long term down trend. Next target is 61.8% retracement of 0.9406 to 1.4689 at 1.1424.
GBP/JPY Weekly Outlook
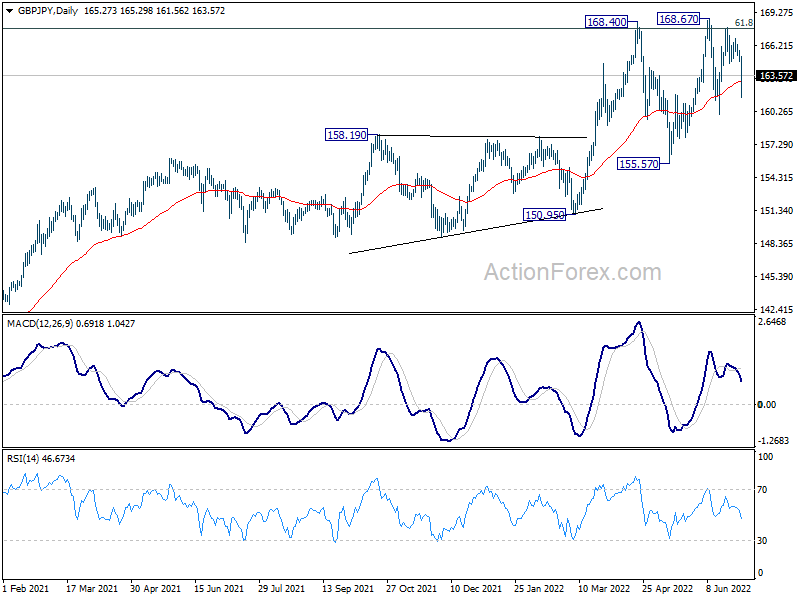
GBP/JPY dropped notably last week and initial bias stays on the downside this week. Deeper fall could be seen to 159.97 support. Firm break there will raise the chance of rejection by 167.93 long term fibonacci resistance. Deeper fall would be seen to 155.57 support for confirmation. On the upside, above 164.13 minor resistance will bring retest of 168.67 high instead.
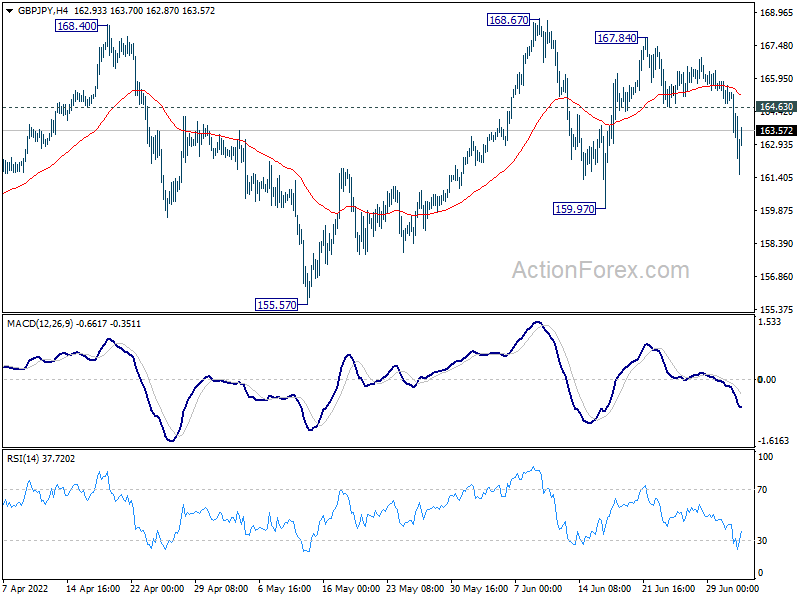
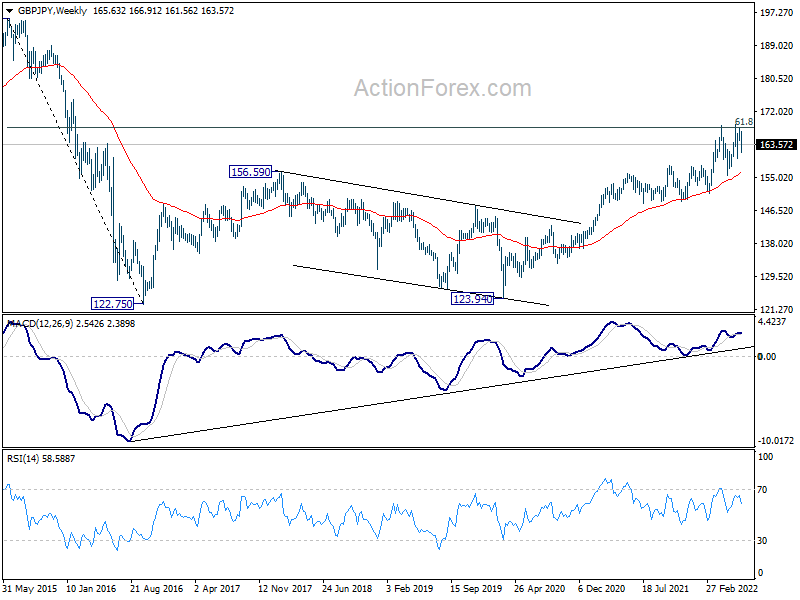
In the bigger picture, up trend from 123.94 (2020 low) is still in progress. Sustained break of 61.8% retracement of 195.86 (2015 high) to 122.75 (2016 low) at 167.93 will be a long term bullish signal, and could pave the way back to 195.86 high. This will now remain the favored case as long as 155.57 support holds, even in case of deep pull back.
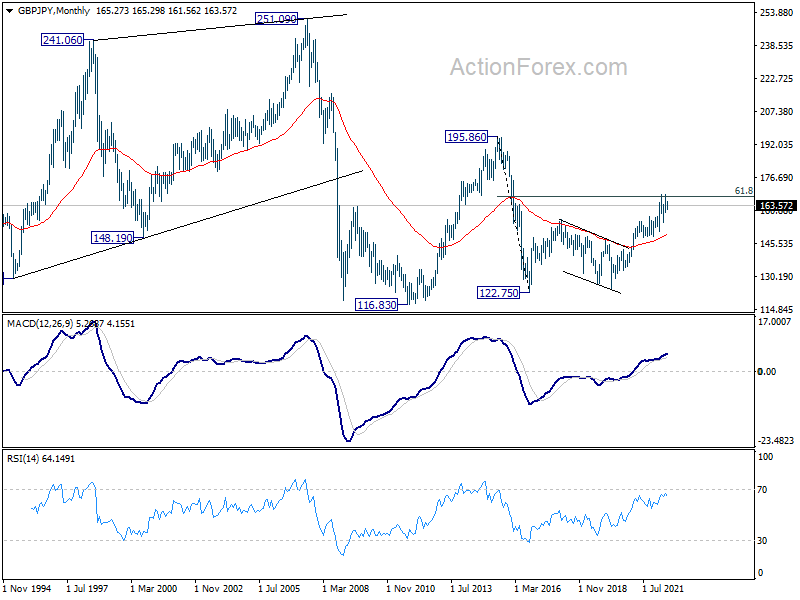
In the longer term picture, rise from 122.75 could be the third leg the the pattern from 116.83 (2011 low). Further rise will remain in favor as long as 55 month EMA (now at 149.84) holds. Sustained break of 61.8% retracement of 195.86 to 122.75 at 167.93. will pave the way to 195.86 (2015 high).
EUR/JPY Weekly Outlook
EUR/JPY edged higher to 144.26 last week but reversed from there. Initial bias stays mildly on the downside this week for 137.83 support first. Sustained break there will raise the chance of rejection by 144.06 long term projection level and target 132.63 support. On the upside, above 142.42 minor resistance will bring retest of 144.26 high instead.
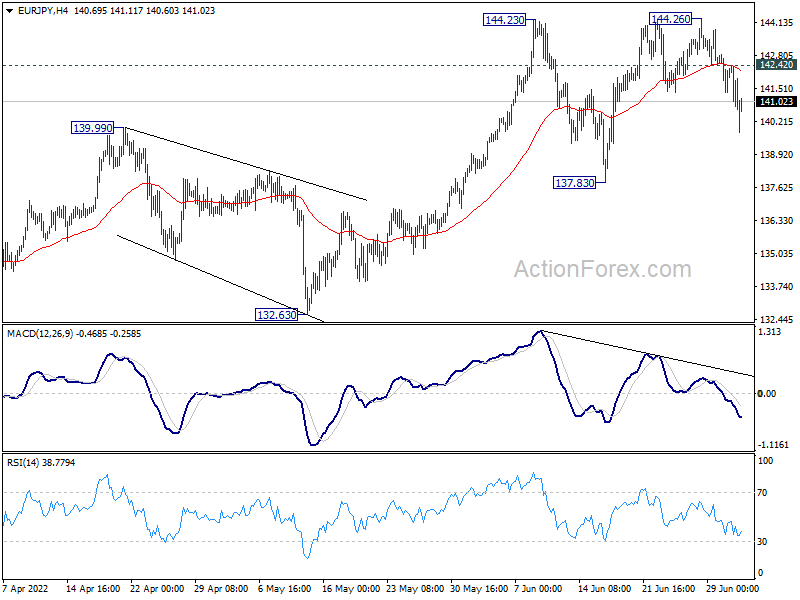
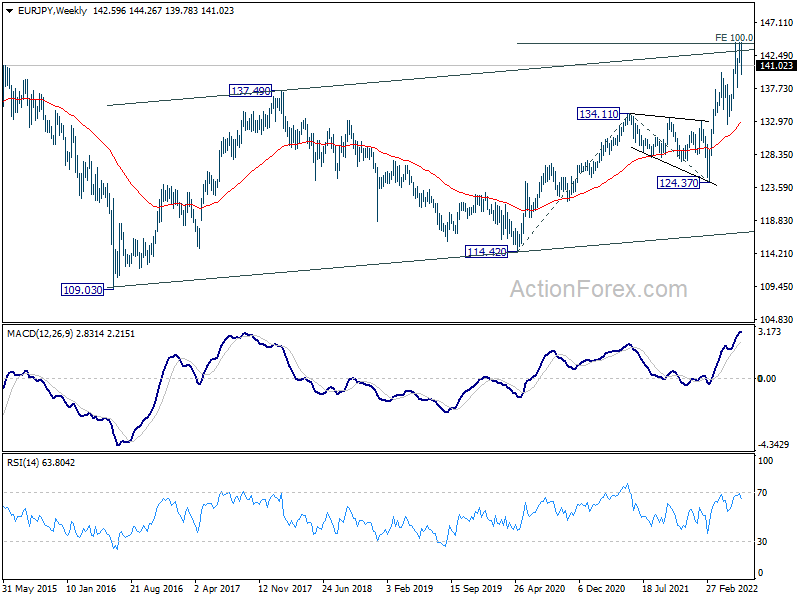
In the bigger picture, up trend from 114.42 (2020 low) is in progress. Such rise is seen as the third leg of the pattern from 109.30 (2016 low). Sustained trading above 100% projection of 114.42 to 134.11 from 124.37 at 144.06 will indicate upside acceleration and target 149.76 long term resistance (2014 high). In any case, outlook will remain bullish as long as 132.63 support holds, in case of deep pull back.
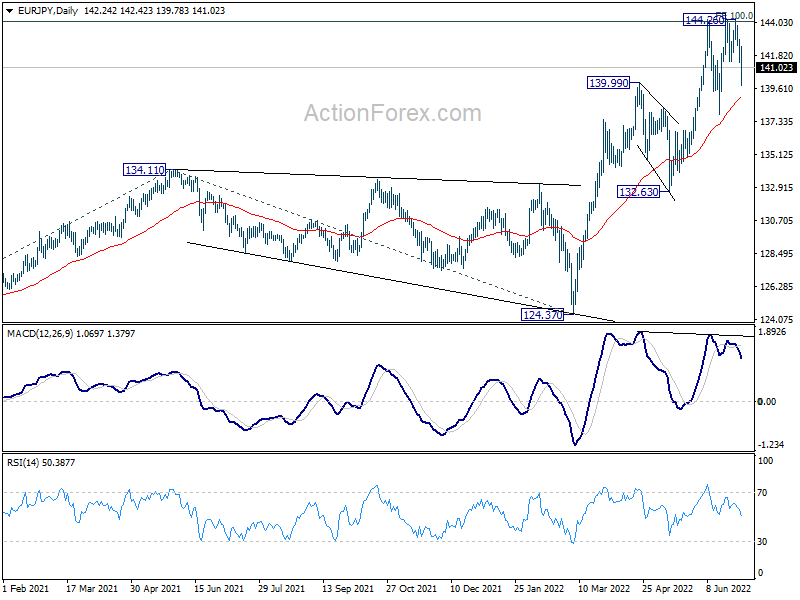
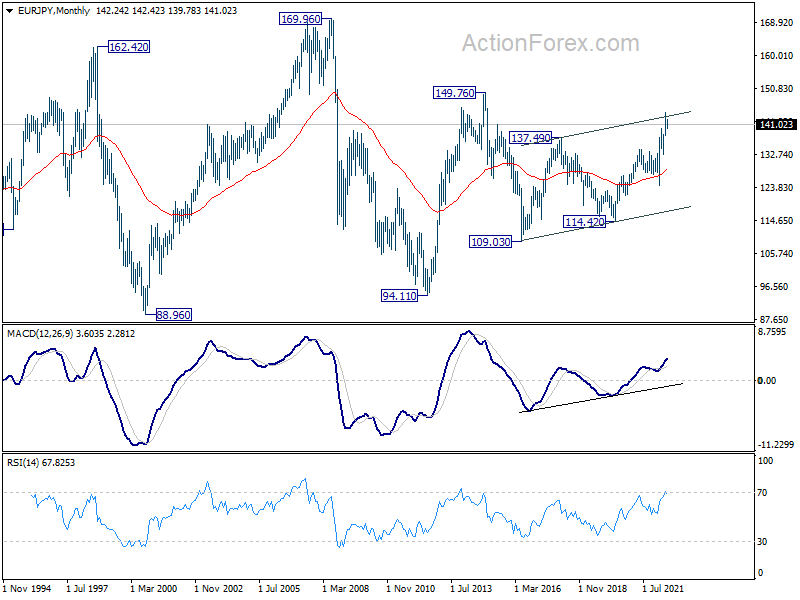
In the long term picture, current rally could be resuming whole rise from 94.11 (2012 low). Further rally would be seen to 149.76 resistance (2014 high) and above. This will remain the favored case as long as 132.63 support holds.
EUR/GBP Weekly Outlook
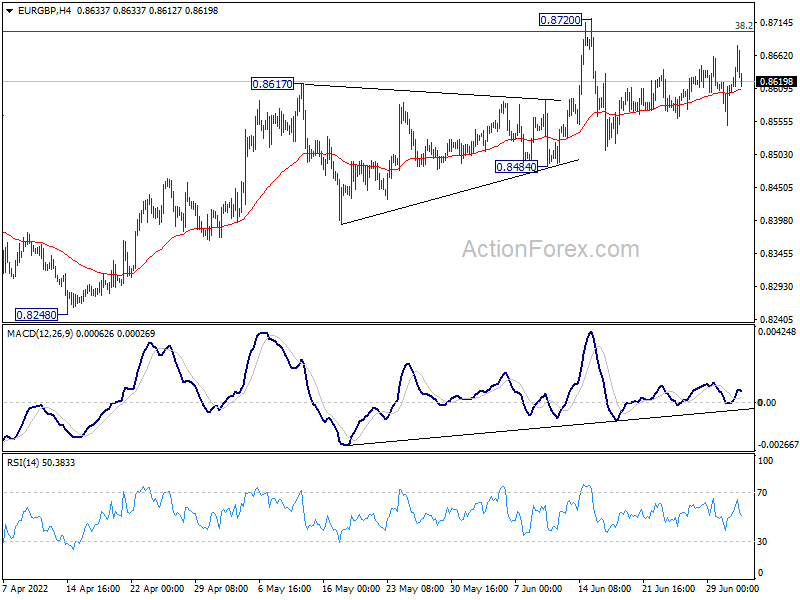
Range trading continued in EUR/GBP last week and outlook is unchanged. Initial bias remains neutral this week first. As long as 0.8484 support holds, further rise is in favor. Break of 0.8720 and sustained trading above 0.8697 medium term fibonacci level will carry larger bullish implication. Next target is 0.9003 fibonacci level. However, break of 0.8484 will indicate rejection by 0.8697 and turn near term outlook bearish.
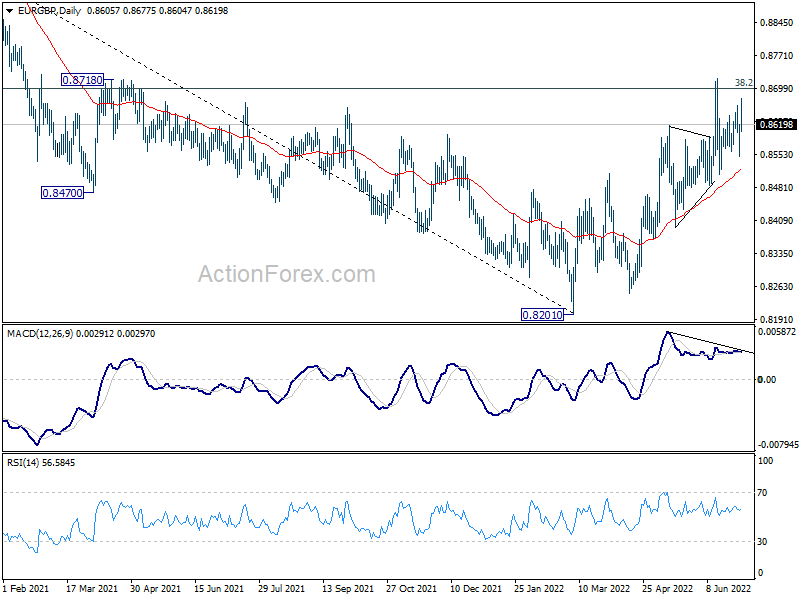
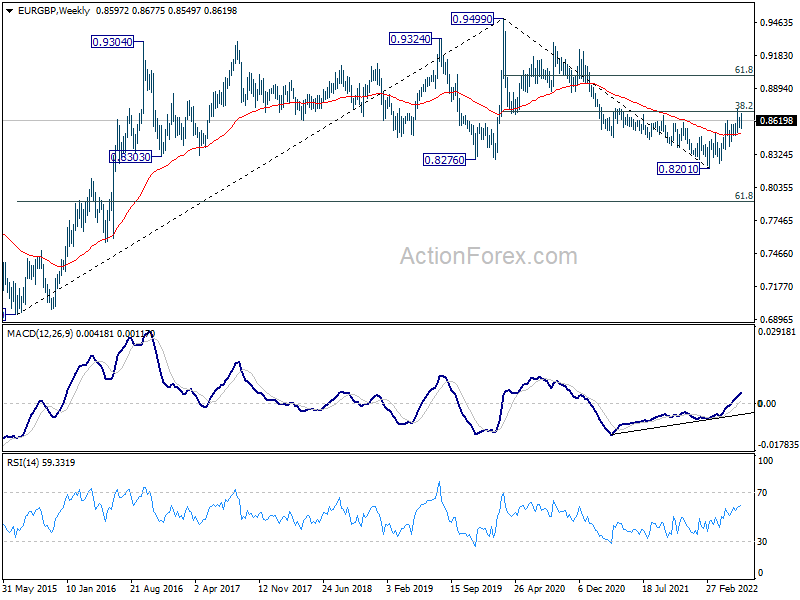
In the bigger picture, rise from 0.8201 medium term bottom could could either be a correction to the down trend from 0.9499 (2020 high), or a medium term up trend itself. Sustained break of 38.2% retracement of 0.9499 to 0.8201 at 0.8697 will affirm the latter case, and pave the way to 61.8% retracement at 0.9003. However, rejection by 0.8697 will maintain medium term bearishness.
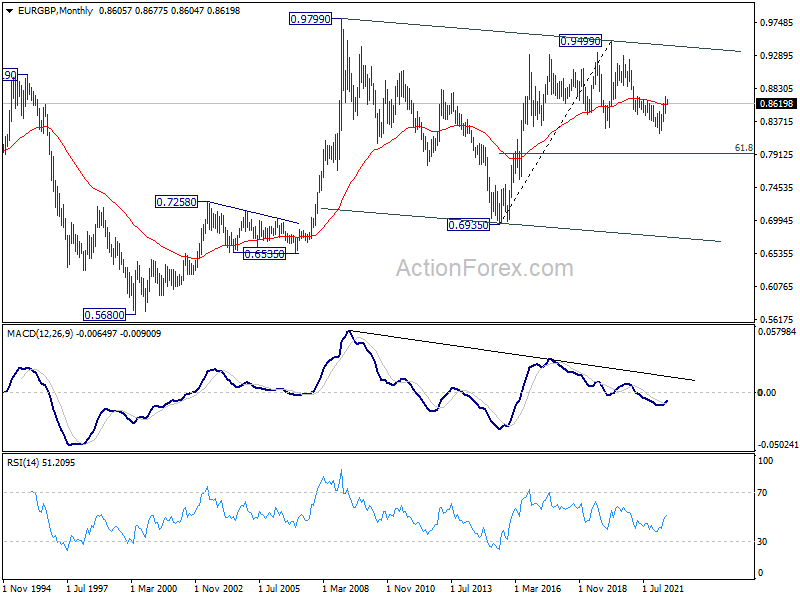
In the long term picture, the lack of medium term downside momentum suggests that fall from 0.9499 (2020 high) is merely a correction to rise from 0.6935 (2015 high). In case of another fall, downside should be contained by 61.8% retracement of 0.6935 to 0.9499 at 0.7917 to bring rebound. Sustained trading above 55 month EMA (now at 0.8604) will indicate that the correction has completed and bring retest of 0.9499.
EUR/AUD Weekly Outlook
EUR/AUD's rise from 1.4318 resumed last week and breached 1.5354 support turned resistance. Initial bias stays on the upside this week. Sustained trading above 1.5354 should indicate medium term bottoming at 1.4318. Stronger rally would be seen back to 100% projection of 1.4318 to 1.5277 from 1.4759 at 1.5718. On the downside, however, break of 1.5059 will revive medium term bearishness and turn bias back to the downside.
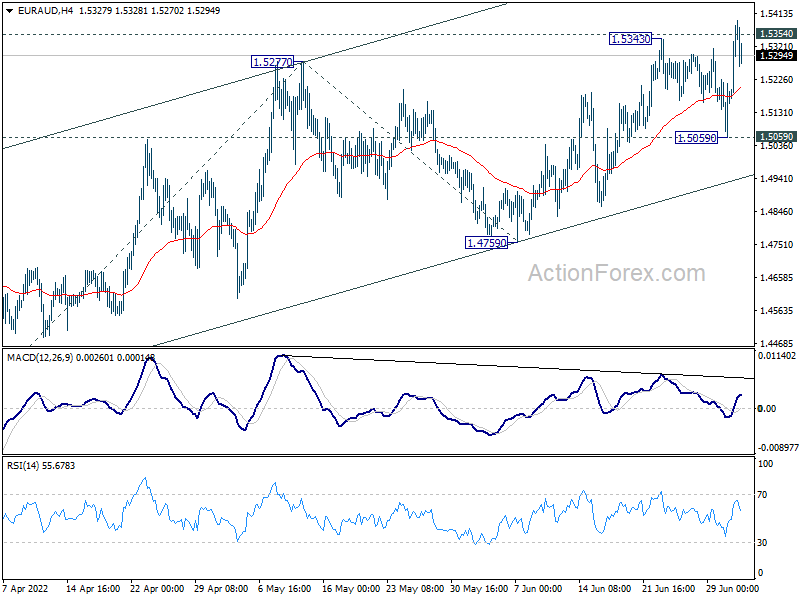
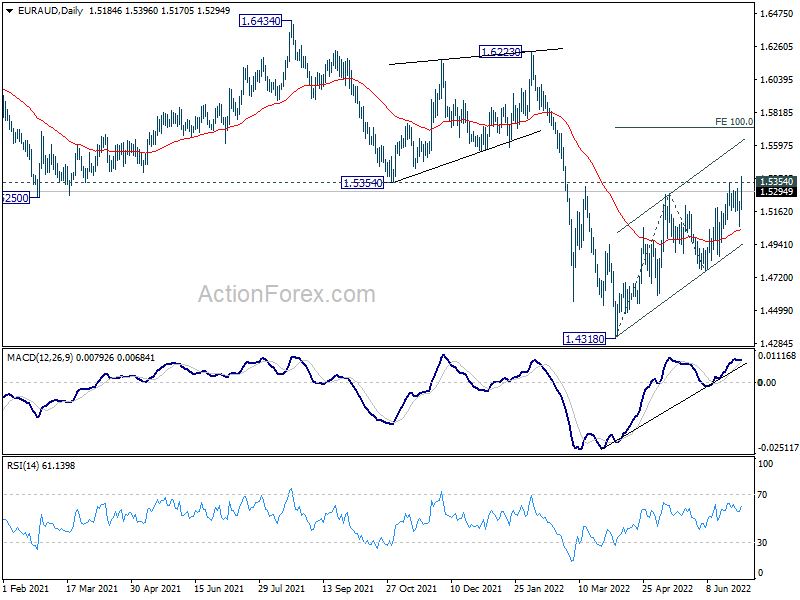
In the bigger picture, sustained break of 1.5354 support turned resistance will argue that a medium term bottom was formed at 1.4318 already. It would still be too early to call for long term trend reversal. But further rise would then be seen back towards 1.6434 resistance (2021 high). However, rejection by 1.5354 will retain bearishness for extending the down trend from 1.9799 (2020 high) through 1.4318 at a later stage.
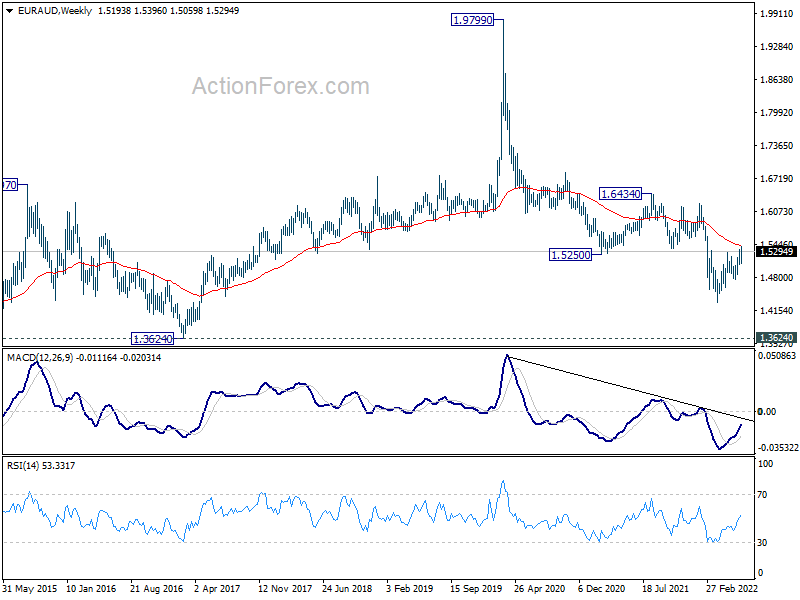
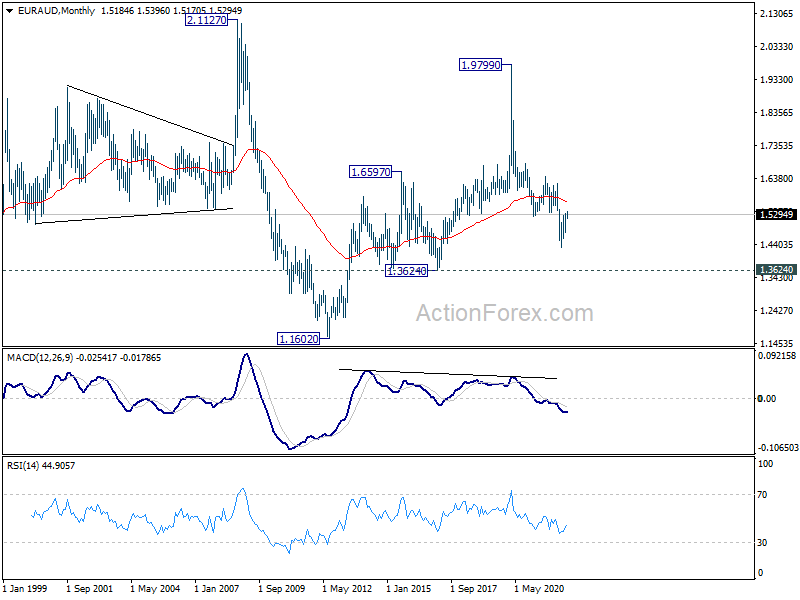
In the longer term picture, fall from 1.9799 (2020 high) is seen as the third leg of the pattern from 2.1127 (2008 high). Deeper fall should be seen to 1.3624 support. Decisive break there would pave the way back to 1.1602 (2012 low). This will remain the favored case as long as 55 month EMA (now at 1.5713) holds.
EUR/CHF Weekly Outlook
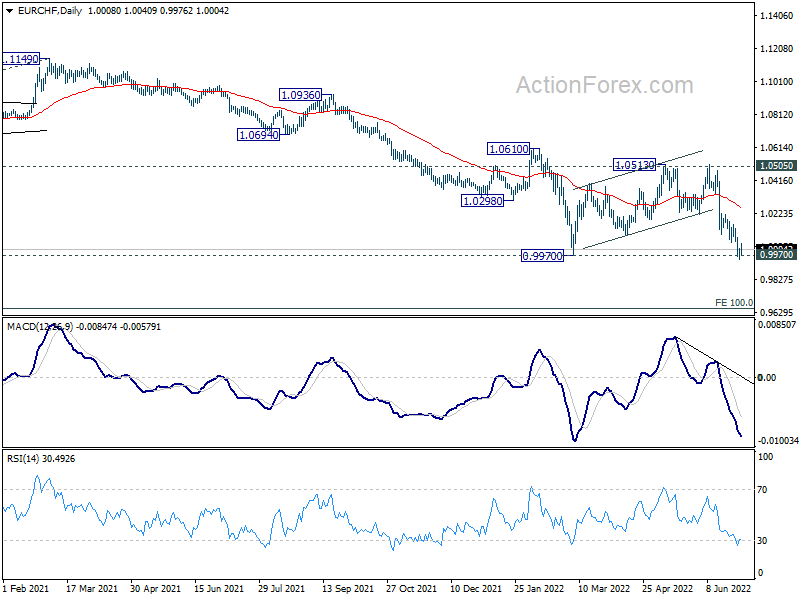
EUR/CHF dropped to as low as 0.9943 last week and breached 0.9970 low. But a temporary low was formed and it quickly recovered. Initial bias is neutral this week first. On the downside, sustained trading below 0.9970 will resume larger down trend for 0.9650 long term projection level. For now, outlook will stay bearish as long as 1.0155 resistance holds, in case of recovery.
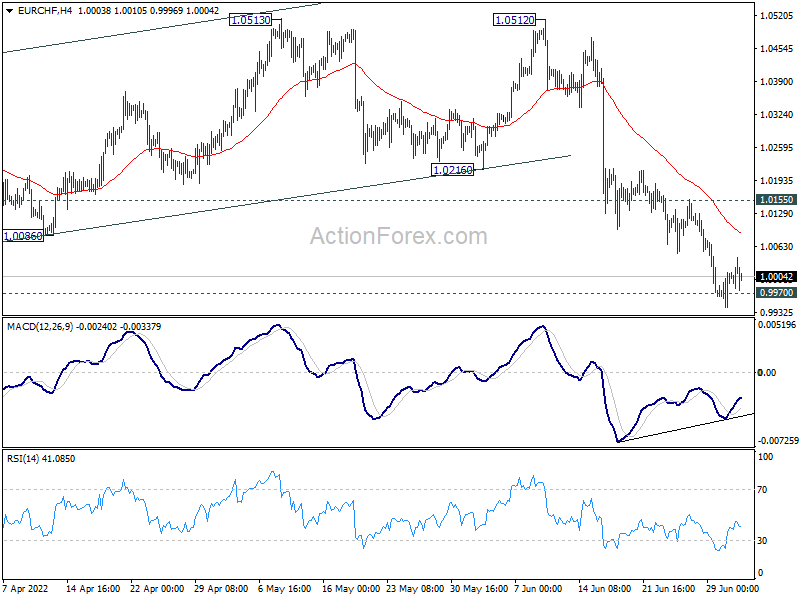
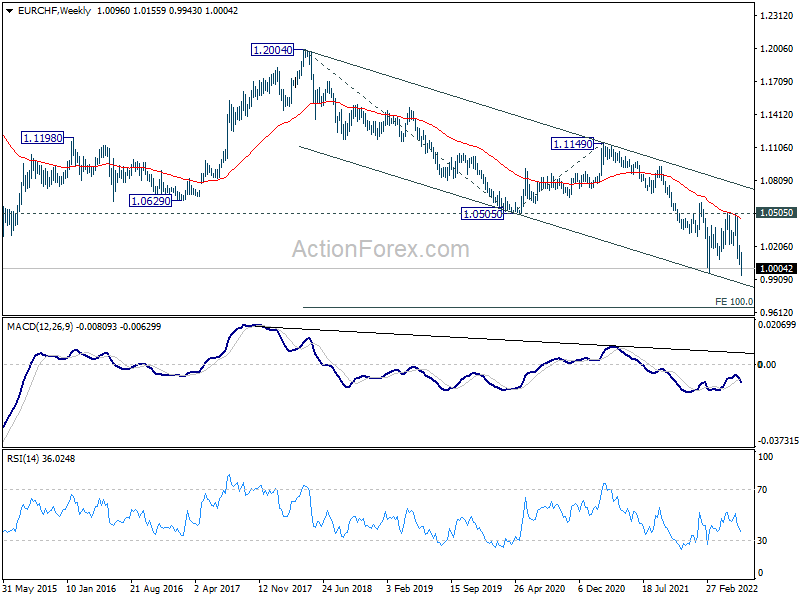
In the bigger picture, as long as 1.0505 support turned resistance (2020 low) holds, long term down trend from 1.2004 (2018 high) is expected to continue. Next target is 100% projection of 1.2004 to 1.0505 to 1.1149 at 0.9650. However, firm break of 1.0505 will suggest medium term bottoming, and bring stronger rebound towards 1.1149 structural resistance.
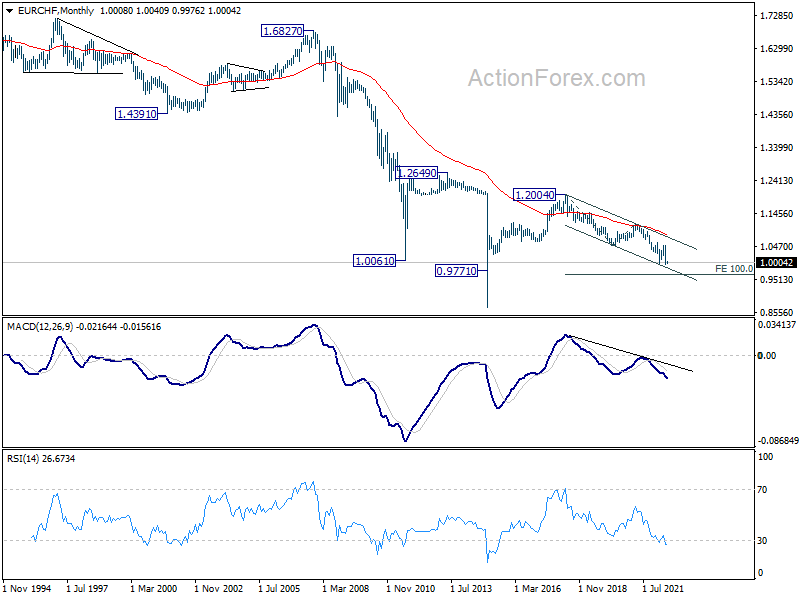
In the long term picture, capped below 55 month EMA, EUR/CHF is seen as extending the multi-decade down trend. There is no prospect of a bullish reversal until some sustained trading above the 55 month EMA (now at 1.0840).
Aussie Dived But a Bottom Around the Corner?
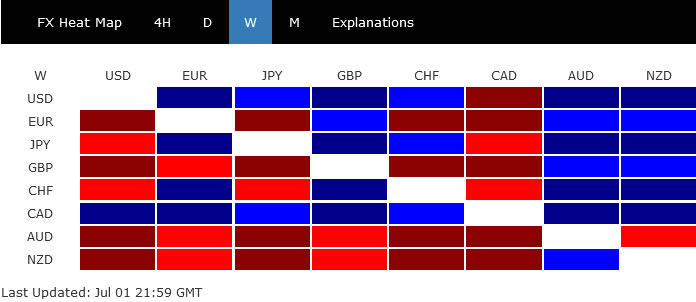
Extending fall in commodity prices and recession fears were the main theme in the markets last week. Australian Dollar ended as the worst performer, followed by New Zealand Dollar, and then Sterling. However, Canadian Dollar was surprisingly the strongest one, partly helped by resilient oil prices.
Meanwhile, extended pull back in US and European benchmark treasury yields boosted the Japanese Yen. Dollar was some what supported by mild risk-off sentiment, but capped by weakness in yields. Swiss Franc's appeared to be losing some momentum after a powerful, broad based rally. While Euro was weak initially, it was saved by buying in some crosses and ended mixed.
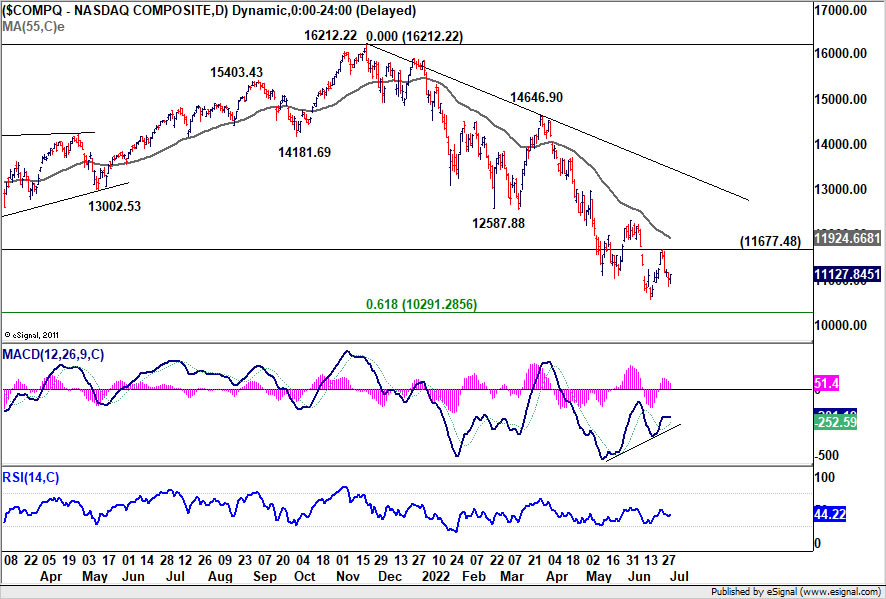
NASDAQ should bottom above 10k and stage bullish reversal
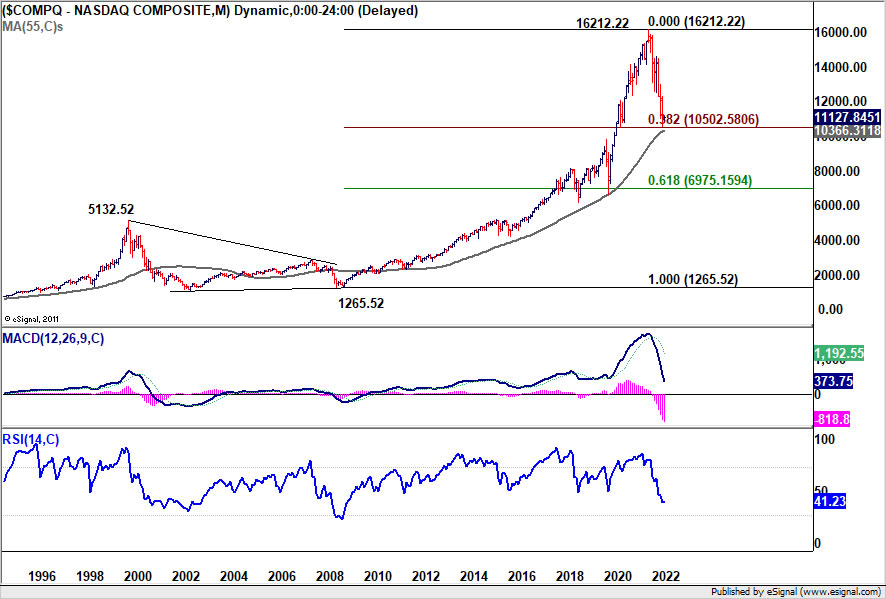
NASDAQ quickly retreated after edging higher last week and closed lower at 11127.84. Deeper decline cannot be ruled out yet. But downside potential should be limited and the case of reversal is building up. Bullish convergence condition is already seen in daily MACD. More importantly, NASDAQ is now close to a long term cluster support zone, including 55 month EMA (now at 10366.31, 61.8% retracement of 6631.42 to 16212.22 at 10291.28, and 38.2% retracement of 1265.52 to 16212.22 at 10502.58.
That is, NASDAQ should finally bottom above 10k handle. Break of 11677.68 resistance will turn focus back to 55 day EMA (now at 11924.66). Sustained break there should start the second leg of the corrective pattern from 16212.22, and target 14646.90/16212.22 resistance zone.
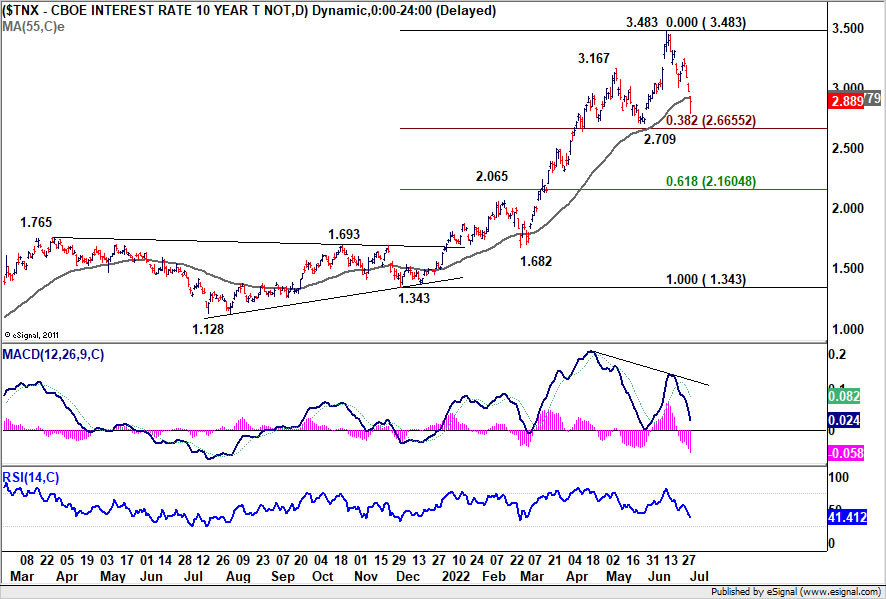
10-year yield lost 3% handle, but strong support expected at around 2.7%
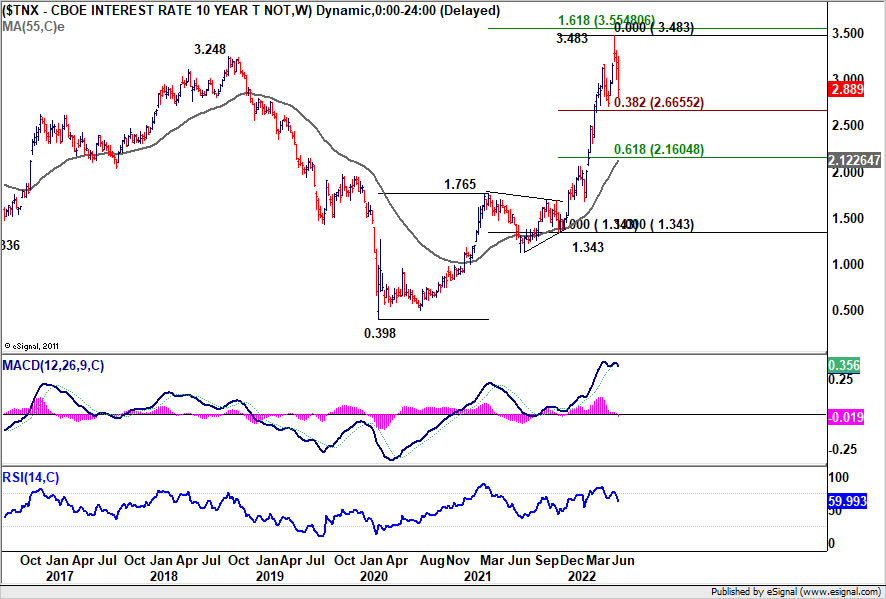
10-year yield tumbled last week as the correction from 3.483 high extended and lost 3% handle. Recession fears and disappointing economic data prompted some more recession fear. Nevertheless, it should noted that TNX did close notably higher than Friday's low at 2.791, which could be a sign of stabilization.
For now, it's in correction to the up trend from 1.343 and strong support is likely at 2.709, which is close to 38.2% retracement of 1.343 to 3.483 at 2.665, to contain downside, and set the range for a sideway pattern. However, sustained break of 2.6655 could trigger even steeper fall to 61.8% retracement at 2.160. If this unlikely scenario happens, it would be a rather negative sign.
Dollar index recovered but risk stays on downside
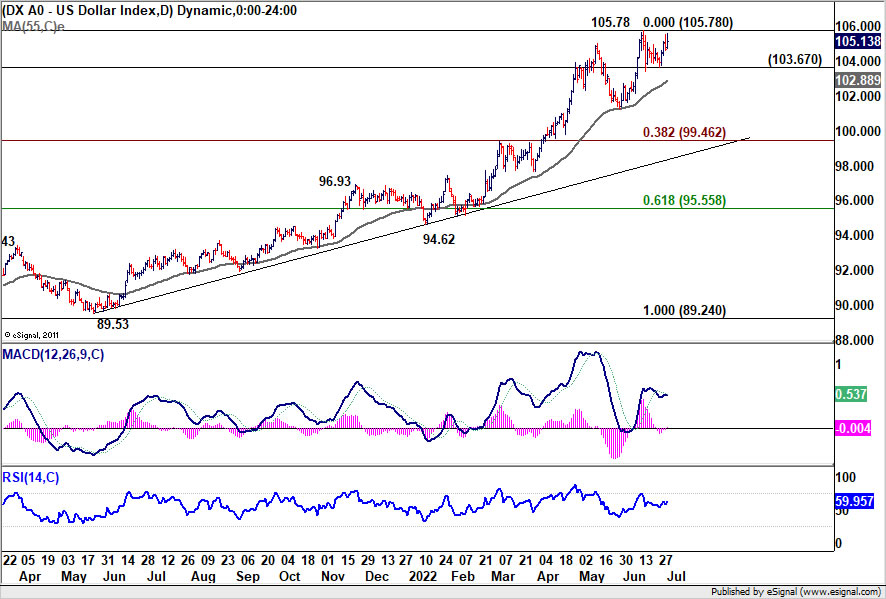
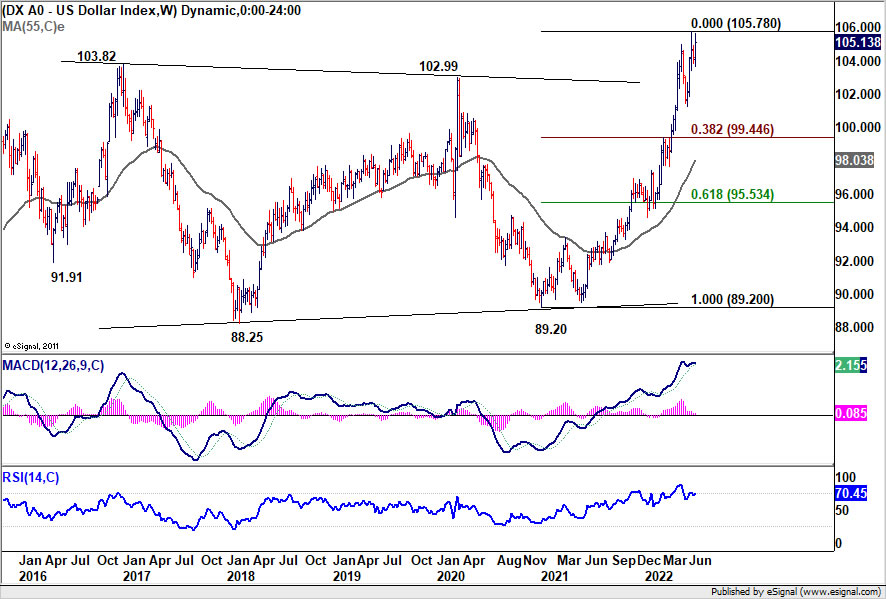
Dollar index recovered last week but failed to break through 105.78 high. It's partly supported by mild risk-off sentiment, but capped by falling treasury yields. But still, risk of a medium term correction is growing. In particular, the pull back could be quick sizeable if stocks do reverse. Break of 103.67 support will complete a small double top pattern. In this case, DXY should fall through 55 day EMA (now at 102.88), and possibly even further to 38.2% retracement of 89.52 to 105.78 at 99.46.
AUD/CAD extended down trend as Aussie weighed down by falling metal
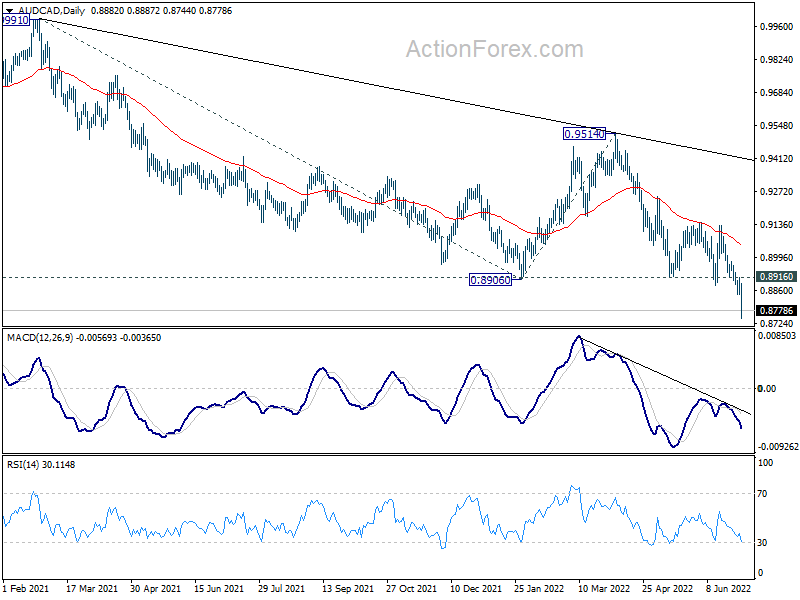
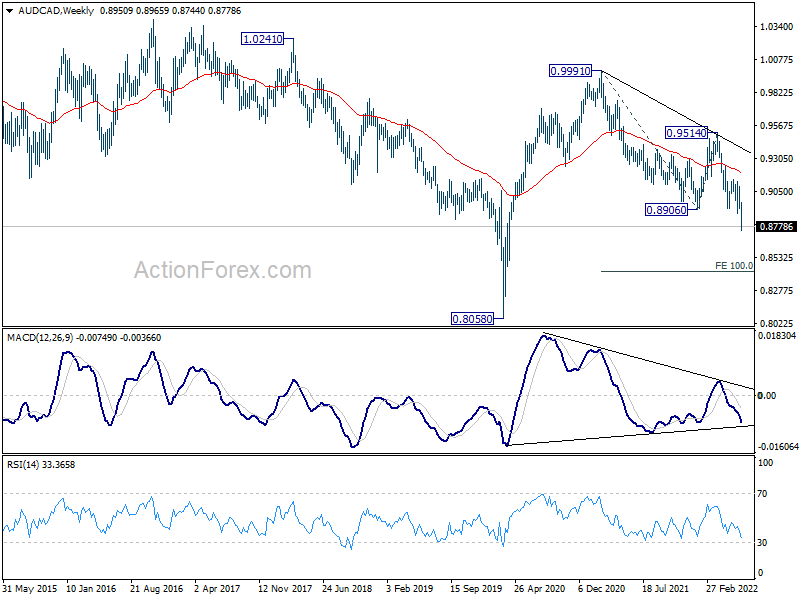
Aussie's falls broadly last week as weighed down heavily by falling base metal prices. On the other hand, Canadian Dollar was resilient as oil prices stayed range bound. AUD/CAD extended the medium term down trend from 0.9991 high. Such decline could still be a correction to the rebound from 0.8058 (2020 low). But whether or not, outlook will stay bearish as long as 0.8916 support turned resistance holds. Next target is 100% projection of 0.9991 to 0.8906 from 0.9514 at 0.8429.
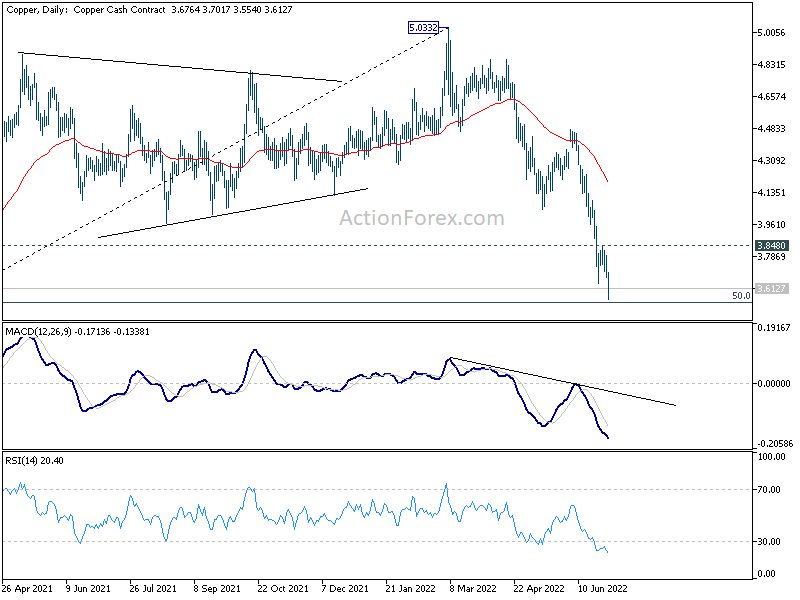
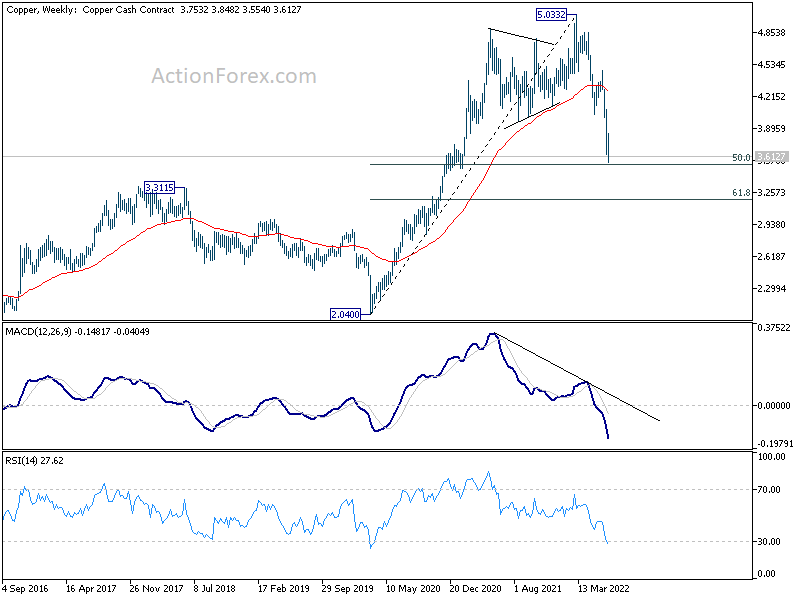
Copper's down trend continued last week and dipped further to as low as 3.554. It's now close to 50% retracement of 2.0400 to 5.0332 at 3.5366. Oversold condition (in both daily and weekly RSI) could help copper stabilizes at current level. Break of 3.848 resistance will argue that the five wave sequence from 5.0332 high has completed, and bring stronger rebound back to 55 day EMA (now at 4.191). Such development could at least help slow Aussie's selloff.
However, firm break of 3.5366 will bring deeper fall to 61.8% retracement at 3.1834 and possibly below. That would give Aussie additional selling pressure.
Gold hesitated to follow the even weaker silver
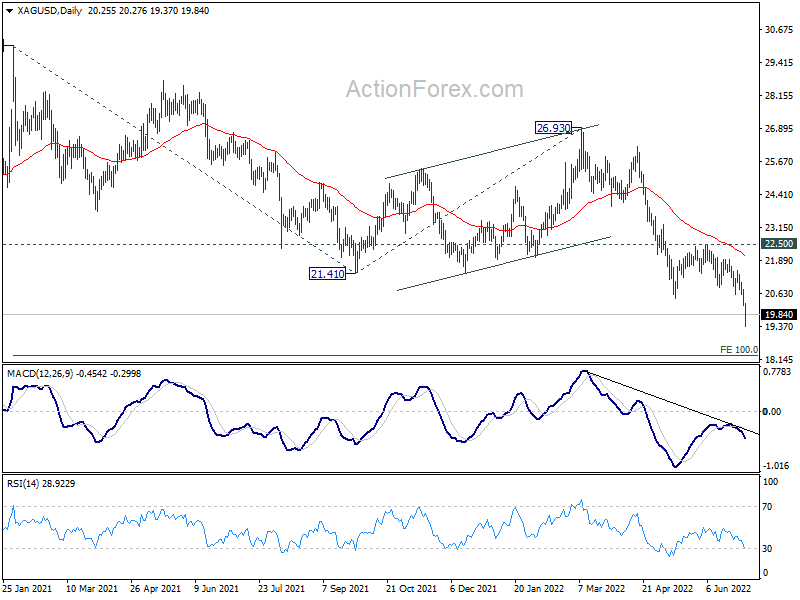
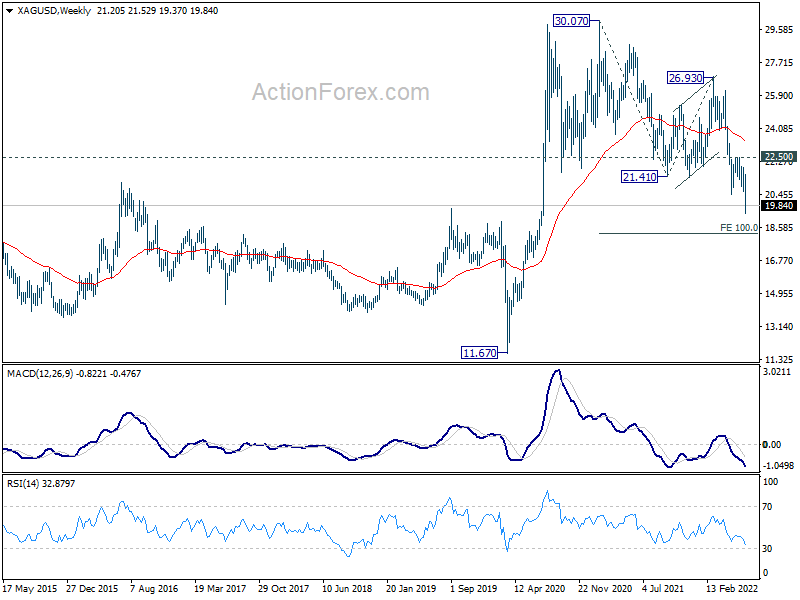
Talking about metals, the fortune of gold and silver was rather different. Silver reacted more to the selloff in industrial metal, and resumed the down trend from 30.07. Such decline could still be a corrective move to rise from 11.67 (2020 low). But whether or not, outlook will stay bearish as long as 22.50 resistance holds. Next target is 100% projection of 30.07 to 21.41 from 26.93 at 18.27.
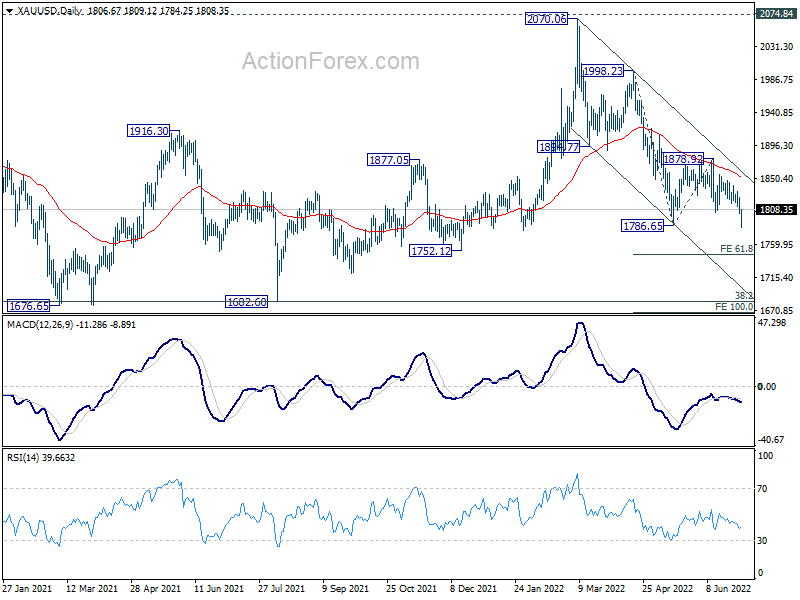
On the other hand, gold quickly recovered after breaching 1786.65 to 1784.25. It's partly supported by the extended pull back in treasury yields. But still, the decline from 2070.06 is still in progress and should target 61.8% projection of 1998.23 to 1786.65 from 1878.92 at 1748.16 on next fall.
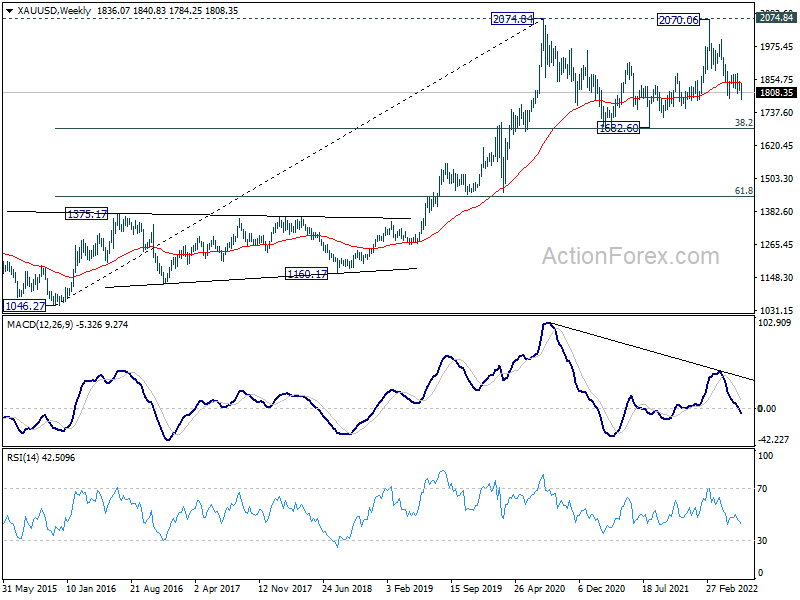
Still, such decline is seen as the third leg of the consolidation pattern from 2074.84 (2020 high). Based on current structure, while break of 1748.16 cannot be ruled out, downside should be contained above 1682.60 support (38.2% retracement of 1046.27 to 2074.84 at 1681.92).
AUD/USD Weekly Outlook
AUD/USD's down trend from 0.8006 resumed last week and dropped to as low as 0.6762. Strong support could still be seen from 0.6756/60 cluster support to bring rebound. On the upside, above 0.6918 resistance will indicate short term bottoming, and turn bias back to the upside for 0.7282 resistance. However, sustained break of 0.6756/60 will carry larger bearish implication and target 0.6461 fibonacci level next.
In the bigger picture, price actions from 0.8006 are seen as a corrective pattern to rise from 0.5506 (2020 low). Strong support is expected from 50% retracement of 0.5506 to 0.8006 at 0.6756 to complete the pattern. This coincides with 100% projection of 0.8006 to 0.7105 from 0.7660 at 0.6760. However firm break of 0.6756/60 will raise the chance of bearish reversal and target 61.8% retracement at 0.6461.
In the long term picture, rejection by 0.8135 resistance suggests that the long term down trend from 1.1079 (2011 high) is not ready to reverse. Yet, the structure of the fall from 0.8006 still argues that it's a corrective move. Hence, break of 0.5506 low is not envisaged for now. The long term outlook stays neutral first, and will be reassessed later after the fall from 0.8006 completes.
Summary 7/4 – 7/8
Monday, Jul 4, 2022
[php_everywhere instance="1"]
Tuesday, Jul 5, 2022
[php_everywhere instance="2"]
Wednesday, Jul 6, 2022
[php_everywhere instance="3"]
Thursday, Jul 7, 2022
[php_everywhere instance="4"]
Friday, Jul 8, 2022
[php_everywhere instance="5"]
Weekly Economic & Financial Commentary: U.S. Recession Is Likely, and Global Contagion Is Unavoidable
Summary
United States: Running on Empty
- Consumers staying power is showing signs of running out as inflation persists and confidence moves sharply lower. While consumers still have the ability to rely on their balance sheets to support spending, it's uncertain for how much longer they will continue to do so. Piling on the tough news was the weak ISM manufacturing report for June, which illustrates that we are not just seeing weakness out of the consumer, but investment spending as well.
- Next week: ISM Services (Wed), Trade Balance (Thu), Nonfarm Payrolls (Fri)
International: China's Economy Starting to Recover, U.K. Recession Seems Inevitable
- This week, we received further evidence that China's economy is on the road to recovery from its lockdown-induced slump. On the other hand, as U.K inflation accelerates further this year, and we expect the U.S. economy to slow late this year and fall into recession during 2023, we believe that could also be enough to tip the U.K. economy into recession by early next year.
- Next week: Reserve Bank of Australia (Tue), Central Bank of Peru (Thu), Mexico CPI (Thu)
Credit Market Insights: Pay Ya Later
- Consumers have increasingly relied on their balance sheets to fund spending, and as consumers tap credit, a less traditional service, Buy Now, Pay Later, has received increased attention. This week, we unpack what we know and importantly what we do not yet know about the service.
Topic of the Week: U.S. Recession Is Likely, and Global Contagion Is Unavoidable
- Inflation has trended uncomfortably high in many countries around the world, even as policymakers have ramped up monetary tightening cycles. The worldwide inflation problem has created an interesting dichotomy for the global economy, and as a result, we have made significant changes to our forecast profile for many central banks and economies.