Sample Category Title
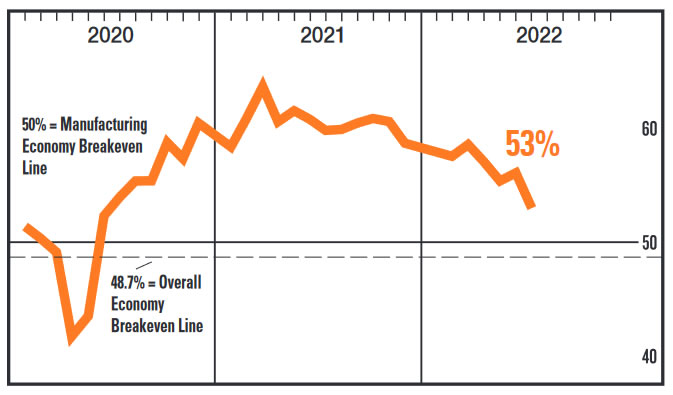
US ISM manufacturing dropped to 53 in Jun, lowest in two years
US ISM Manufacturing PMI dropped from 56.1 to 53.0 in June, below expectation of 55.0. That's the lowest level since June 2020.
New orders dropped from 55.1 to 49.2. Production rose from 54.2 to 54.9. Employment dropped from 49.6 to 47.3. Supplier deliveries dropped from 65.7 to 57.3. Prices dropped from 82.2 to 78.5.
ISM said: "The past relationship between the Manufacturing PMI and the overall economy indicates that the Manufacturing PMI for June (53 percent) corresponds to a 1.5-percent increase in real gross domestic product (GDP) on an annualized basis."
EUR/USD Mid-Day Outlook
Daily Pivots: (S1) 1.0415; (P) 1.0452 (R1) 1.0521; More...
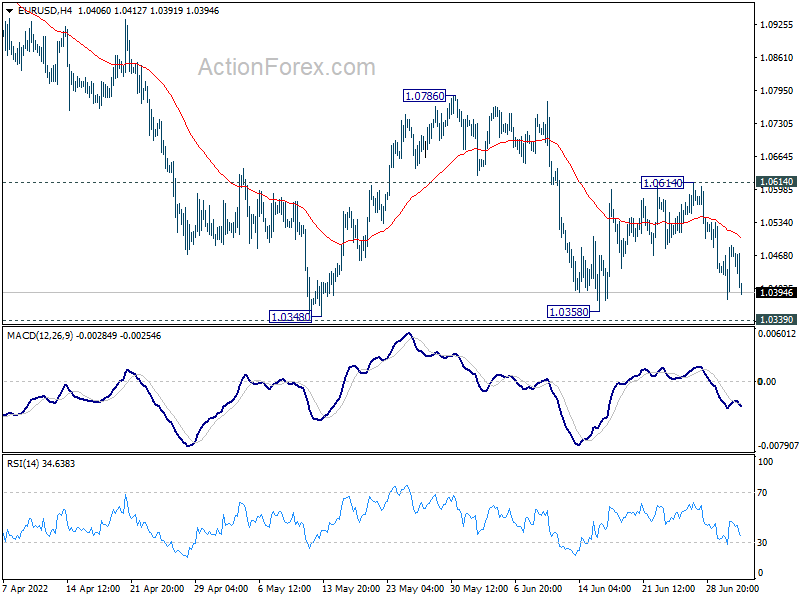
Intraday bias in EUR/USD remains neutral at this point. Further fall is in favor with 1.0614 minor resistance intact. On the downside, sustained break of 1.0339/48 will resume larger down trend. Next target is long term projection level at 1.0090. On the upside, above 1.0614 will turn bias back to the upside for 1.0786 resistance instead.
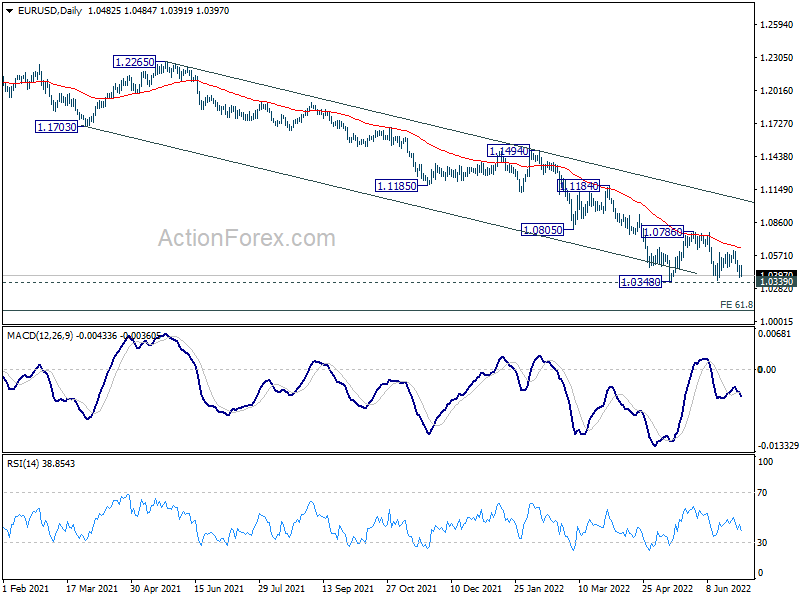
In the bigger picture, focus stays on 1.0339 long term support (2017 low). Decisive break there will resume whole down trend from 1.6039 (2008 high). Next target is 61.8% projection of 1.3993 to 1.0339 from 1.2348 at 1.0090. However, firm break of 1.0805 support turned resistance will delay this bearish case, and bring stronger rebound first.
GBP/USD Mid-Day Outlook
Daily Pivots: (S1) 1.2118; (P) 1.2153; (R1) 1.2215; More...
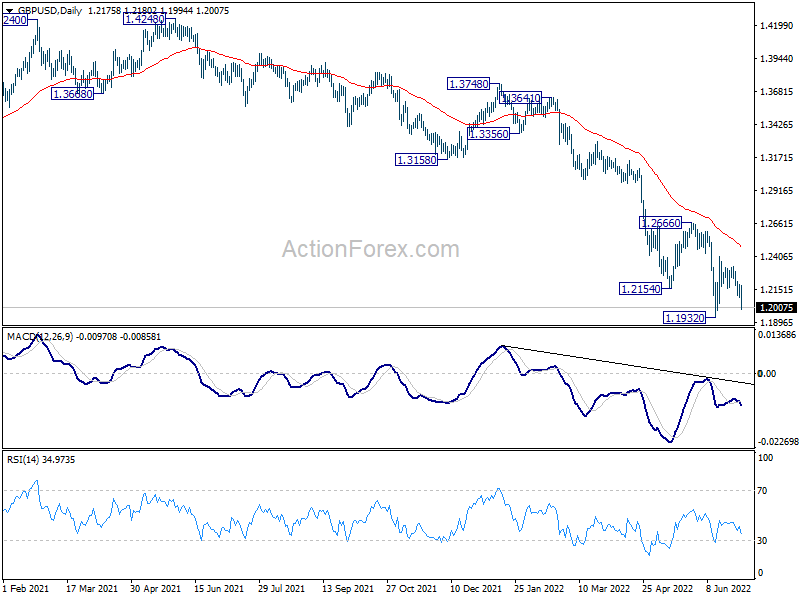
Intraday bias in GBP/USD stays neutral for the moment. Further fall is in favor as long as 1.2187 minor resistance holds. Firm break of 1.1932 will resume larger down trend from 1.4248. On the upside, above 1.2187 will resume the rebound from 1.1932 to 1.2666 resistance. Firm break there will indicate medium term bottoming.
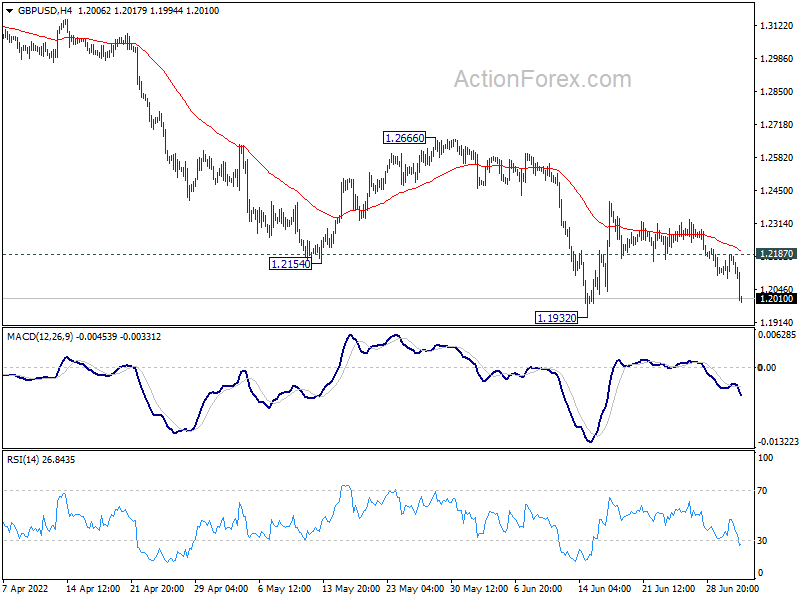
In the bigger picture, fall from 1.4248 (2018 high) could be a leg inside the pattern from 1.1409 (2020 low), or resuming the longer term down trend. Deeper decline is expected as long as 1.2666 resistance holds. Next target is 1.1409 low. However, firm break of 1.2666 will bring stronger rise back to 55 week EMA (now at 1.3140).
USD/CHF Mid-Day Outlook
Daily Pivots: (S1) 0.9518; (P) 0.9561; (R1) 0.9593; More...
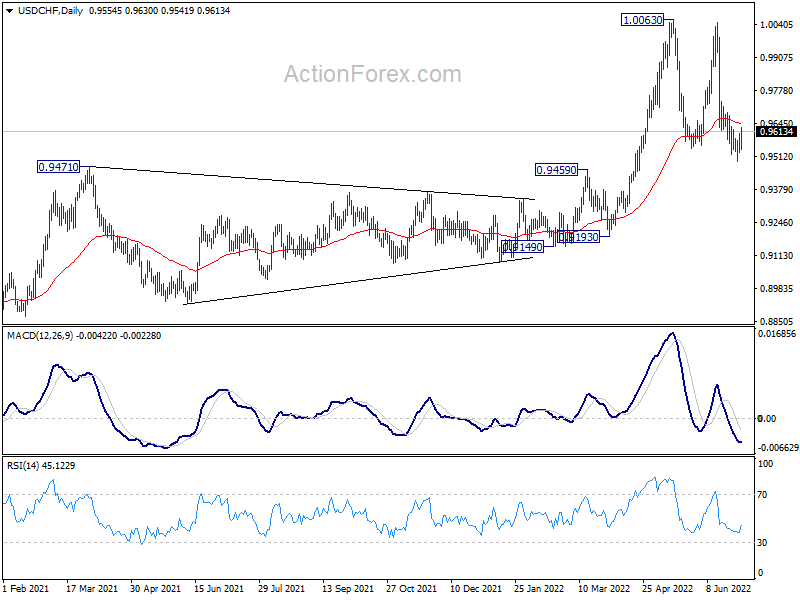
Intraday bias in USD/CHF remains neutral. Fall from 1.0048 is still seen as the third leg of the consolidation pattern from 1.0063. Strong support should be seen around 0.9543 to bring rebound. On the upside, above 0.9731 minor resistance will turn bias back to the upside for retesting 1.0063 resistance. However, sustained break of 0.9543 will bring deeper fall back to 0.9459 resistance turned support.
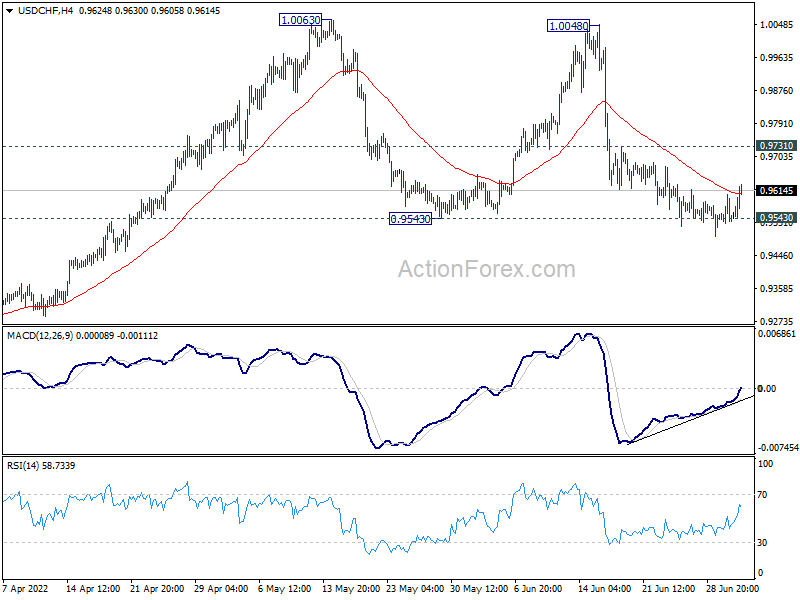
In the bigger picture, down trend from 1.0342 (2016 high) should have completed with three waves down to 0.8756 (2021 low) already. Rise from 0.8756 is likely a medium term up trend of its own. Next target is 1.0237/0342 resistance zone. This will remain the favored case as long as 0.9471 resistance turned support holds. However, sustained break of 0.9471 will extend long term range trading with another falling leg.
USD/JPY Mid-Day Outlook
Daily Pivots: (S1) 135.24; (P) 136.03; (R1) 136.49; More...
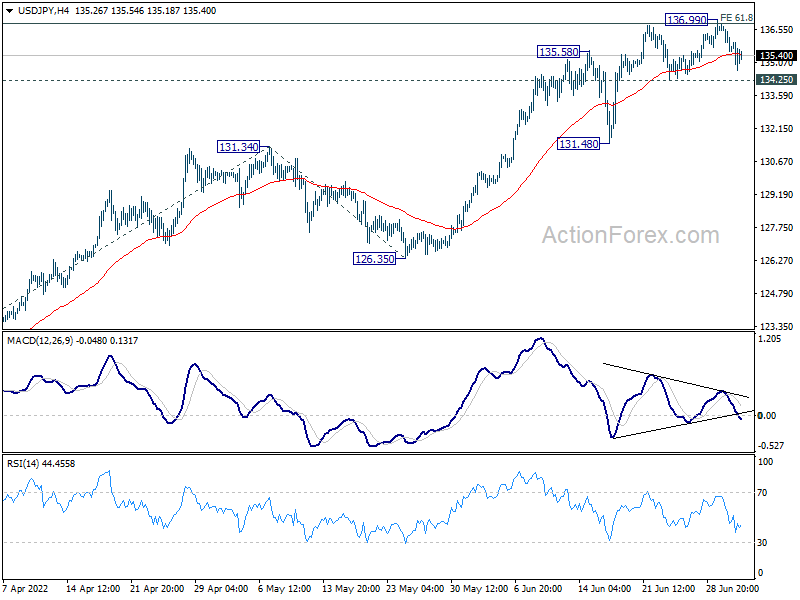
Range trading continues in USD/JPY and intraday bias remains neutral. On the upside, sustained trading above of 61.8% projection of 114.40 to 131.34 from 126.35 at 136.81 will extend larger up trend to 100% projection at 143.29. However, break of 134.25 will turn bias back to the downside for 131.48 support instead.
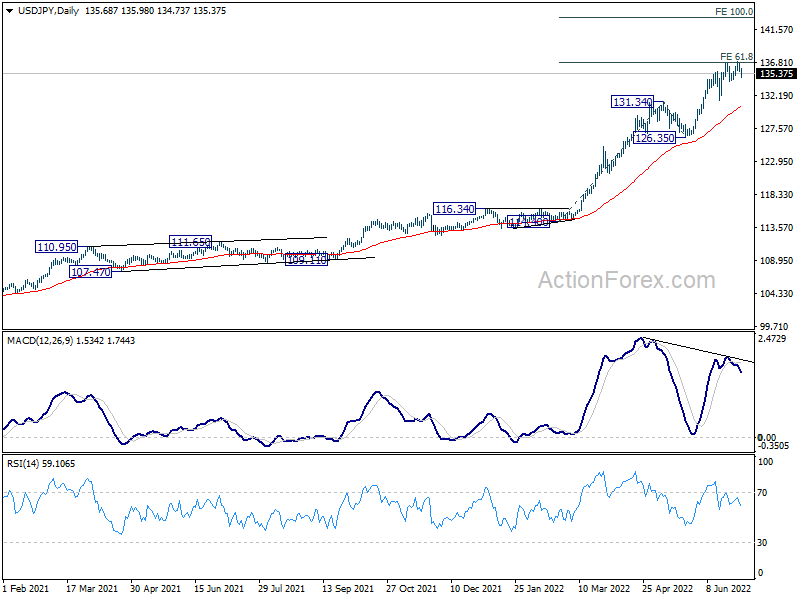
In the bigger picture, current rally is seen as part of the long term up trend from 75.56 (2011 low). Next target is 100% projection of 75.56 (2011 low) to 125.85 (2015 high) from 98.97 at 149.26, which is close to 147.68 (1998 high). This will remain the favored case as long as 126.35 support holds.
AUD/USD Mid-Day Report
Daily Pivots: (S1) 0.6866; (P) 0.6893; (R1) 0.6931; More...
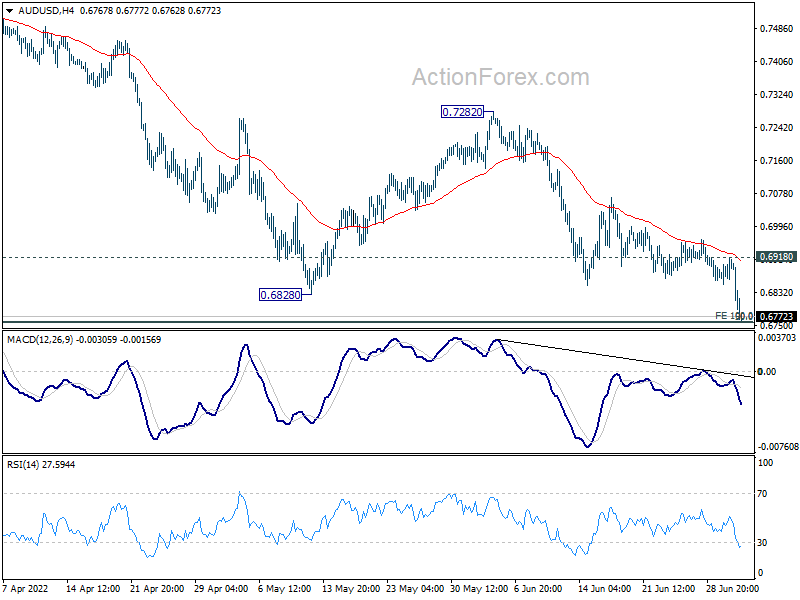
Intraday bias in AUD/USD stays on the downside with focus on 0.6756/60 cluster fibonacci level. Strong support is still expected there to bring rebound. Break of 0.6918 resistance will indicate short term bottoming and turn bias back to the downside. However, sustained break of 0.6756/60 will carry larger bearish implication and target 0.6461 fibonacci level next.
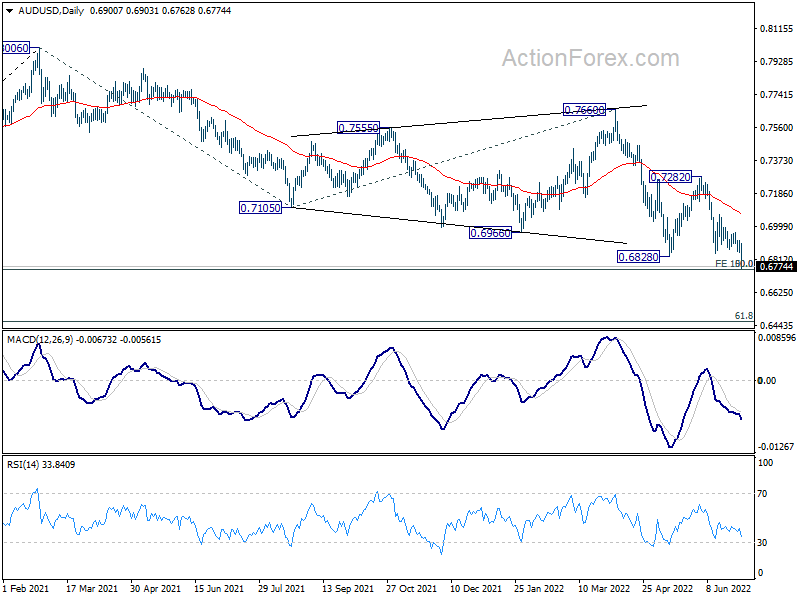
In the bigger picture, price actions from 0.8006 are seen as a corrective pattern to rise from 0.5506 (2020 low). Strong support is expected from 50% retracement of 0.5506 to 0.8006 at 0.6756 to complete the pattern. This coincides with 100% projection of 0.8006 to 0.7105 from 0.7660 at 0.6760. However firm break of 0.6756/60 will raise the chance of bearish reversal and target 61.8% retracement at 0.6461.
Selloff in Aussie Intensifies With Commodity Prices
Selloff in Aussie and Kiwi intensifies today following the steep decline in commodities. Safe-have flows continue to boost the Japanese Yen, which is additionally lifted by extended pull back in US and European benchmark yields. As for the week, Dollar is the strongest one, but the second placed Yen has the potential to overtake it. There is little chance for Aussie and Kiwi to reverse their worst performer places for the week.
In Europe, at the time of writing, FTSE is down -0.04%. DAX is flat, CAC is up 0.06%. Germany 10-year yield is down -0.074 at 1.265. Earlier in Asia, Nikkei dropped -1.73%. China Shanghai SSE dropped -0.32%. Singapore Strait Times dropped -0.21%. Japan 10-year JGB yield dropped -0.010 to 0.221.
Gold downside breakout, targets 1748
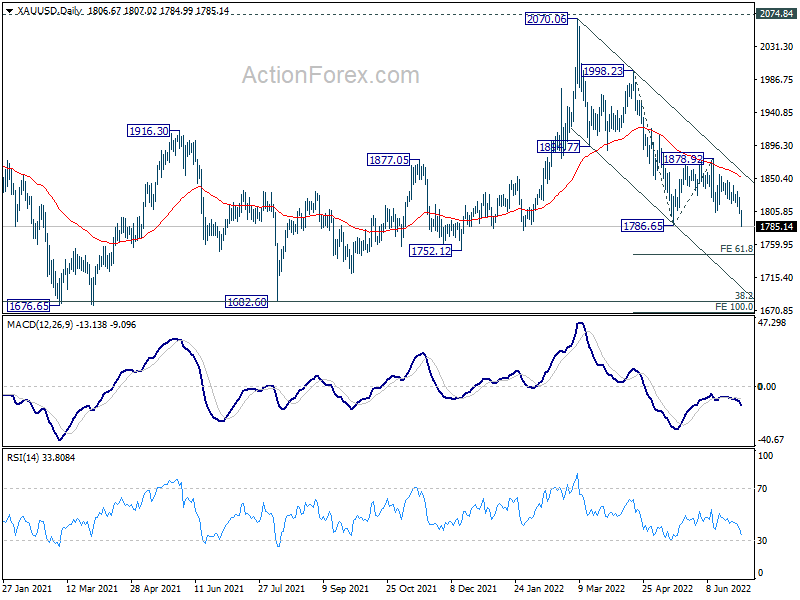
Gold's selloff is finally picking up momentum today and breach of 1786.65 support indicates resumption of whole decline from 2070.06. Further fall should be seen to 61.8% projection of 1998.23 to 1786.65 from 1878.92 at 1748.16.
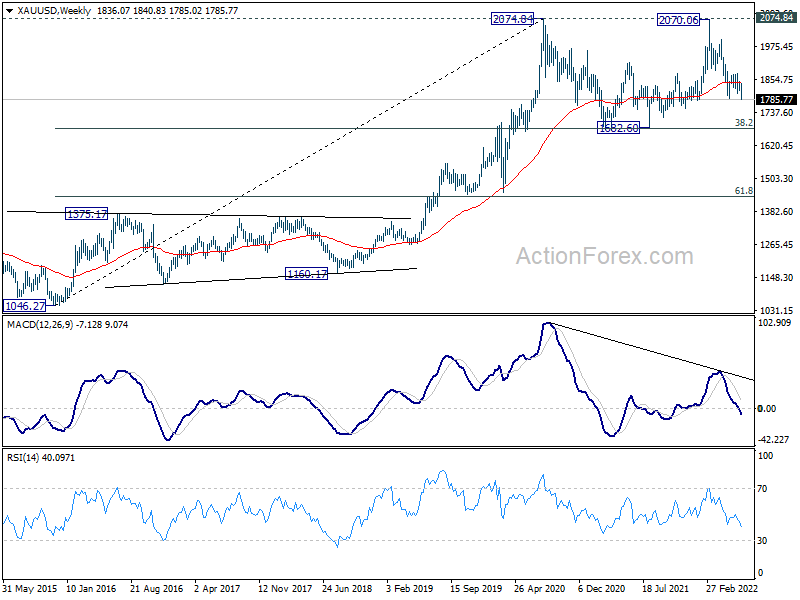
It should be noted that fall from 1786.65 should now be in its fifth leg. That is, it should be near completion. Also, such decline is seen as the third leg of the consolidation pattern from 2074.84 (2020 high). Based on current structure, while break of 1748.16 cannot be ruled out, downside should be contained above 1682.60 support (38.2% retracement of 1046.27 to 2074.84 at 1681.92).
Eurozone CPI accelerated to 8.6% yoy in Jun, but core CPI slowed to 3.7% yoy
Eurozone CPI accelerated from 8.1% yoy to 8.6% yoy in June, above expectation of 8.3% yoy. However, CPI core slowed from 3.8% yoy to 3.7% yoy, below expectation of 3.9% yoy.
Looking at the main components, energy is expected to have the highest annual rate in June (41.9%, compared with 39.1% in May), followed by food, alcohol & tobacco (8.9%, compared with 7.5% in May), non-energy industrial goods (4.3%, compared with 4.2% in May) and services (3.4%, compared with 3.5% in May).
Eurozone PMI manufacturing finalized at 22-mth low at 52.1, increasing likelihood of manufacturing recession
Eurozone PMI Manufacturing was finalized at 52.1 in June, down from April's 54.6. That's also the lowest level in 22 months. Readings of the member states were also weak, with the Netherlands at 19-month low of 55.9, Ireland at 16-month low at 53.1, Spain at 17-month low at 52.6, Germany at 23-month low at 52.0, France at 18-month low at 51.4, Austria at 22-month low at 51.2, Greece at 16-month low at 51.1, Italy at 24-month low at 50.9.
Chris Williamson, Chief Business Economist at S&P Global Market Intelligence said: "Eurozone manufacturing has moved into decline in June, with production dropping for the first time for two years amid a steepening downturn in demand.... The downturn looks set to gain momentum in coming months.... One upside to the recent weakening of demand is an alleviation of some supply chain constraints, which has in turn helped cool inflationary pressures for industrial goods. With the survey data indicating an increasing likelihood of the manufacturing sector slipping into a recession, these price pressures should ease further in the third quarter."
UK PMI manufacturing finalized at 52.8 in Jun, economic backdrop to darken further in H2
UK PMI Manufacturing was finalized at 52.8 in June, down from May's 54.6, a two-year low. S&P Global said output growth slowed to near-stagnation pace as new orders intakes fell for the first time since January 2021. Price inflation remained elevated despite further easing.
Rob Dobson, Director at S&P Global Market Intelligence, said: "UK manufacturing output growth ground to a near standstill in June, as intakes of new work contracted for the first time since January 2021. Domestic market conditions became increasingly difficult and foreign demand fell sharply again... Business confidence took a hit as a result, dipping to its gloomiest since mid-2020... "There were some welcome signs that supply-chain constraints and cost inflationary pressures may have passed their peaks. However, with these constraints still elevated overall and demand headwinds rising, it is likely that UK manufacturing will see the economic backdrop darken further in the second half of the year."
Japan Tankan large manufacturing index dropped to 9 in Q2
Japan Tankan survey showed that large manufacturer sentiment dropped to lowest in more than a year. But note improvement was seen in the non-manufacturing sector. Also, the strong capital expenditure plan was a big surprise, showing that corporate spending was still robust despite increasing uncertainty.
Large manufacturing index dropped from 14 to 9 in Q2, below expectation of 13. That's the lowest level since Q1 2021. Large manufacturing outlook improved from 9 to 10, below expectation of 14.
Non-manufacturing index rose from 9 to 13, below expectation of 14. Non-manufacturing outlook rose from 7 to 13, below expectation of 17.
Capex plans for big firms seen rising 18.6% yoy in fiscal 2022, well above expectation of 8.9%.
Consumer inflation expectations rose from 1.8% to 2.4%. Three years ahead, consumer prices are expected to rise 2%, up from 1.6%.
Japan PMI manufacturing finalized at 52.7, optimism improved
Japan PMI Manufacturing was finalized at 52.7 in June, down from May's 53.3. S&P Global said output growth slowed amid near-stagnation in new orders. Prices charged for goods rose at sharpest pace on record. Business optimism improved to three-month high.
Usamah Bhatti, Economist at S&P Global Market Intelligence, said: "June PMI data pointed to a softer expansion of the Japanese manufacturing sector... Panel members often commented that rising price and supply pressures amid sustained disruption and delays had held back activity in the sector... That said, the degree of optimism regarding the 12-month outlook for output strengthened to a three-month high in June... This is broadly in line with the estimate for industrial production to grow just 2% in 2022 before an acceleration in 2023."
China Caixin PMI manufacturing rose to 51.7, restoration in the post-pandemic era
China Caixin PMI Manufacturing rose from 48.1 to 51.7 in June, above expectation of 50.2. Caixin said production increased at quickest rate for 19 months, as total new work and export sales returned to growth. Supplier performance stabilized.
Wang Zhe, Senior Economist at Caixin Insight Group said: "Restoration in the post-pandemic era remained the focus of the current economy, yet its base was far from strong. Deteriorating household income and expectations caused by a weak labor market dampened the demand recovery. Correspondingly, supportive policies should target employees, gig workers and low-income groups impacted by the outbreaks."
Australia AiG manufacturing rose to 54, exports jumped but domestic sales fell
Australia AiG Performance of Manufacturing rose 1.6 pts to 54.0 in June. Looking at some details, production rose 2.4 to 54.7. Employment rose 0.8 to 51.0. New orders rose 0.7 to 55.7. Exports jumped 10.1 to 53.0. Sales dropped -2.6 to 45.0. Input prices rose 2.1 to 89.3. Selling prices rose 2.1 to 67.8. Average wages dropped -5.5 to 69.3.
Innes Willox, Chief Executive of Ai Group said: "Although input price pressures continued to accumulate, Australia's manufacturing sector expanded again in June with solid increases in production and new orders and a slight lift in employment. While export sales were up, domestic sales fell reflecting the decline in consumer and business confidence in the face of concerns about inflation, interest rates and asset values. Selling prices were higher in June but by a smaller amount than input costs as less robust demand inhibited the ability of manufacturers to fully recover their higher costs in the market."
AUD/USD Mid-Day Report
Daily Pivots: (S1) 0.6866; (P) 0.6893; (R1) 0.6931; More...
Intraday bias in AUD/USD stays on the downside with focus on 0.6756/60 cluster fibonacci level. Strong support is still expected there to bring rebound. Break of 0.6918 resistance will indicate short term bottoming and turn bias back to the downside. However, sustained break of 0.6756/60 will carry larger bearish implication and target 0.6461 fibonacci level next.
In the bigger picture, price actions from 0.8006 are seen as a corrective pattern to rise from 0.5506 (2020 low). Strong support is expected from 50% retracement of 0.5506 to 0.8006 at 0.6756 to complete the pattern. This coincides with 100% projection of 0.8006 to 0.7105 from 0.7660 at 0.6760. However firm break of 0.6756/60 will raise the chance of bearish reversal and target 61.8% retracement at 0.6461.
Economic Indicators Update
| GMT | Ccy | Events | Actual | Forecast | Previous | Revised |
|---|---|---|---|---|---|---|
| 22:30 | AUD | AiG Performance of Mfg Index Jun | 54 | 52.4 | ||
| 22:45 | NZD | Building Permits M/M May | -0.50% | -8.50% | -8.60% | |
| 23:30 | JPY | Tokyo CPI Core Y/Y Jun | 2.10% | 2.10% | 0.90% | 1.90% |
| 23:30 | JPY | Unemployment Rate May | 2.60% | 2.50% | 2.50% | |
| 23:50 | JPY | Tankan Large Manufacturing Index Q2 | 9 | 13 | 14 | |
| 23:50 | JPY | Tankan Large Manufacturing Outlook Q2 | 10 | 14 | 9 | |
| 23:50 | JPY | Tankan Non - Manufacturing Index Q2 | 13 | 14 | 9 | |
| 23:50 | JPY | Tankan Non - Manufacturing Outlook Q2 | 13 | 17 | 7 | |
| 23:50 | JPY | Tankan Large All Industry Capex Q2 | 18.60% | 8.90% | 2.20% | |
| 00:30 | JPY | Manufacturing PMI Jun F | 52.7 | 52.7 | 52.7 | |
| 01:45 | CNY | Caixin Manufacturing PMI Jun | 51.7 | 50.2 | 48.1 | |
| 07:30 | CHF | SVME PMI Jun | 59.1 | 57.3 | 60 | |
| 07:45 | EUR | Italy Manufacturing PMI Jun | 50.9 | 50.7 | 51.9 | |
| 07:50 | EUR | France Manufacturing PMI Jun F | 51.4 | 51 | 51 | |
| 07:55 | EUR | Germany Manufacturing PMI Jun F | 52 | 52 | 52 | |
| 08:00 | EUR | Eurozone Manufacturing PMI Jun F | 52.1 | 52 | 52 | |
| 08:30 | GBP | Manufacturing PMI Jun F | 52.8 | 53.4 | 53.4 | |
| 08:30 | GBP | Mortgage Approvals May | 66K | 64K | 66K | |
| 08:30 | GBP | M4 Money Supply M/M May | 0.50% | 0.40% | 0.00% | |
| 09:00 | EUR | Eurozone CPI Y/Y Jun P | 8.60% | 8.30% | 8.10% | |
| 09:00 | EUR | Eurozone CPI Core Y/Y Jun P | 3.70% | 3.90% | 3.80% | |
| 13:45 | USD | Manufacturing PMI Jun F | 52.4 | 52.4 | ||
| 14:00 | USD | ISM Manufacturing PMI Jun | 55 | 56.1 | ||
| 14:00 | USD | ISM Manufacturing Prices Paid Jun | 80 | 82.2 | ||
| 14:00 | USD | ISM Manufacturing Employment Index Jun | 49.6 | |||
| 14:00 | USD | Construction Spending M/M May | 0.40% | 0.20% |
Gold downside breakout, targets 1748
Gold's selloff is finally picking up momentum today and breach of 1786.65 support indicates resumption of whole decline from 2070.06. Further fall should be seen to 61.8% projection of 1998.23 to 1786.65 from 1878.92 at 1748.16.
It should be noted that fall from 1786.65 should now be in its fifth leg. That is, it should be near completion. Also, such decline is seen as the third leg of the consolidation pattern from 2074.84 (2020 high). Based on current structure, while break of 1748.16 cannot be ruled out, downside should be contained above 1682.60 support (38.2% retracement of 1046.27 to 2074.84 at 1681.92).
Unsuccessful Bitcoin Pump
Bitcoin was down 7.2% on Thursday, ending it at around $18,800. Ethereum lost 8.7%, while other leading altcoins in the top 10 fell from 4.4% (BNB) to 10.6% (Dogecoin). However, Bitcoin greeted the new day, month and half-year with buying. In a thin market early in the day with Asia predominantly active, this spurred the price up 11% to $20,800, quickly deflating to $19,400.
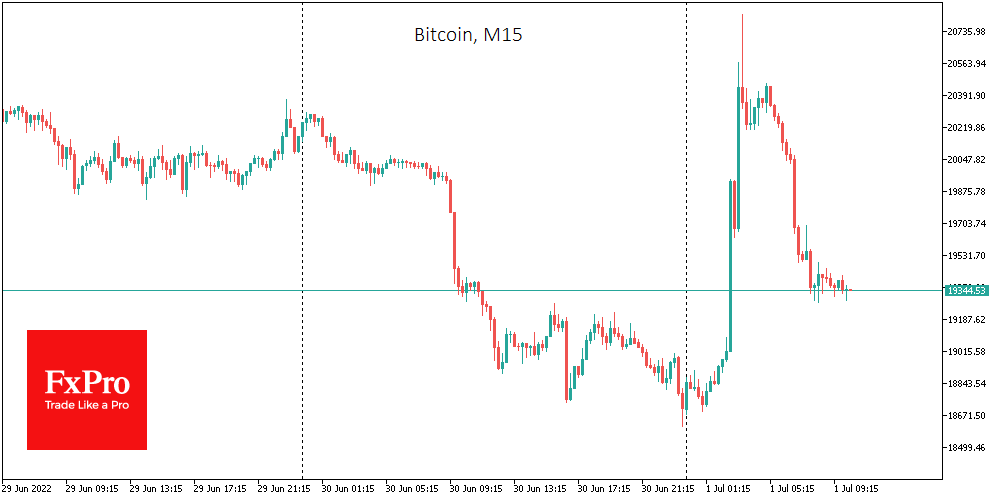
In other words, we see attempts to create the appearance of buying the dip in bitcoin. Still, the rise in price entails increased selling – a typical sign that institutional and market professionals are “dumping” the asset to retail investors guided by the price chart.
By Friday, the cryptocurrency fear and greed index remained unchanged at 11 points (“extreme fear”).
Bitcoin intensified its decline on Thursday after breaking the $20,000 level. BTC tested 11-day lows near $18,600 amid a plunge in stock indices.
Last month was one of the worst for bitcoin, with BTC losing 41% of its value, falling short of historical trends.
In terms of seasonality, July is considered a relative success for BTC. Over the past 11 years, bitcoin has ended the month up seven times and down four times. The average rise was 22%, and the average decline was 9%. In the first case, BTC could end July at around $23,000. In the second, it could end July at about $17,000.
According to Deutsche Bank, Bitcoin could recover to $28,000 by the end of 2022 on the back of a likely rally in US equities.
JPMorgan Bank believes the crypto market could bottom out soon, after which bitcoin and other crypto assets will consolidate. Most traders with margin positions have already washed out of the market.
We continue to maintain our position that there remains a sellers’ advantage, and the slowest of them will be careful to sell the crypto market on upside attempts.
According to BitInfoCharts, bitcoin’s fall from historic highs has stripped some 75% of investors (82,600) of their millionaire status.
Pantera Capital founder Dan Morehead is confident that it’s too early to talk about a “bottom” of the market. He expects several more defaults by companies in the sector shortly – like the story of Three Arrows Capital.
OTC cryptocurrency dealer Genesis Global Trading could face hundreds of millions of dollars in losses due to the loss of liquidity of counterparties Three Arrows Capital and Babel Finance.
Lee Reiners, director of the Center for Global Financial Markets at Duke University in North Carolina, believes digital currencies have no real value and should be banned.
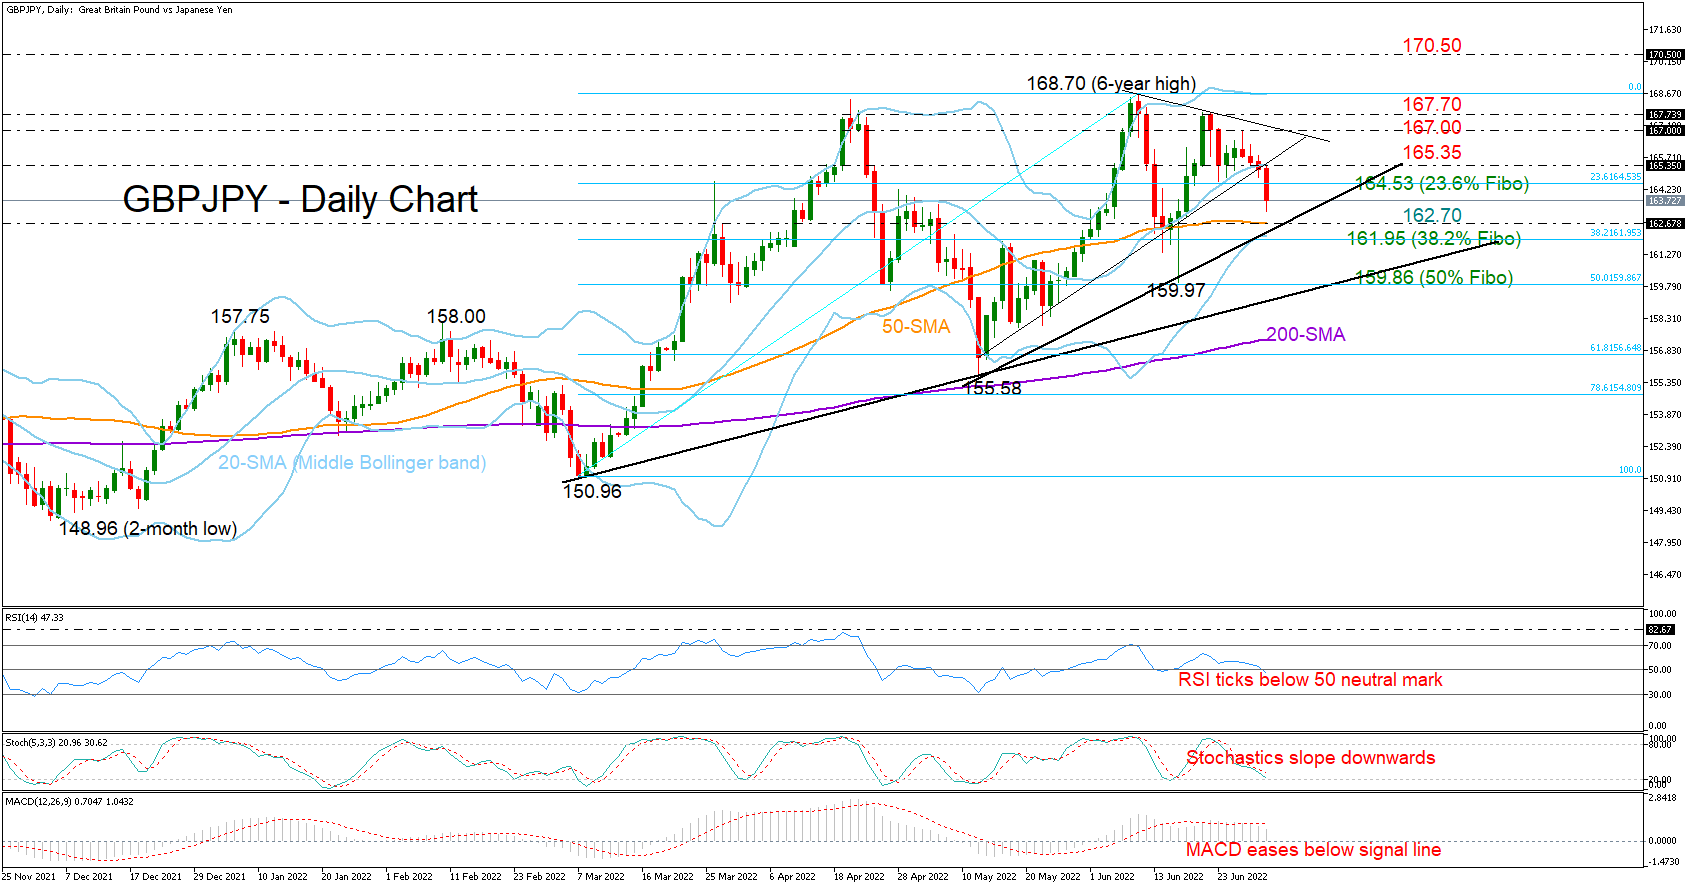
GBPJPY Bears Take Charge; Eyes on 50-SMA
GBPJPY sharpened its downturn below the 20-day simple moving average (SMA) and a key support trendline on Friday, tumbling to a two-week low of 163.24.
The price is also set for a close below the 23.6% Fibonacci retracement of the 150.96 – 168.70 upleg at 164.53, which was indestructible over the past week, hinting at further weakness ahead. The momentum indicators are in favor of this bearish scenario, too. The RSI is crossing below its 50 neutral mark, the Stochastics are falling, and the MACD is losing steam below its red signal line. Besides, with the price trading some distance above the lower Bollinger band, the market has yet to reach oversold levels.
Sliding even lower, the pair may face congestion around the 50-day SMA and the tentative support trendline drawn from the 155.58 trough at 162.70. The 38.2% Fibonacci of 161.95 is adding more importance to the region. Hence, a move below that base is expected to produce another strong downfall, likely towards the 50% Fibonacci of 159.86 and the longer-term ascending trendline.
On the upside, a bounce back above the 20-day SMA at 165.35 is required to bring the 167.00 round level and the short tentative resistance trendline under examination. Then, the bulls may attempt to clear the tough ceiling of 167.70 – 168.70 with scope to meet the 170.50 barrier taken from January-February 2016.
In brief, downside pressures are expected to persist in the near term, with traders likely seeking immediate support within the 162.70 – 162.95 territory.