Sample Category Title
Unsuccessful Bitcoin Pump
Bitcoin was down 7.2% on Thursday, ending it at around $18,800. Ethereum lost 8.7%, while other leading altcoins in the top 10 fell from 4.4% (BNB) to 10.6% (Dogecoin). However, Bitcoin greeted the new day, month and half-year with buying. In a thin market early in the day with Asia predominantly active, this spurred the price up 11% to $20,800, quickly deflating to $19,400.
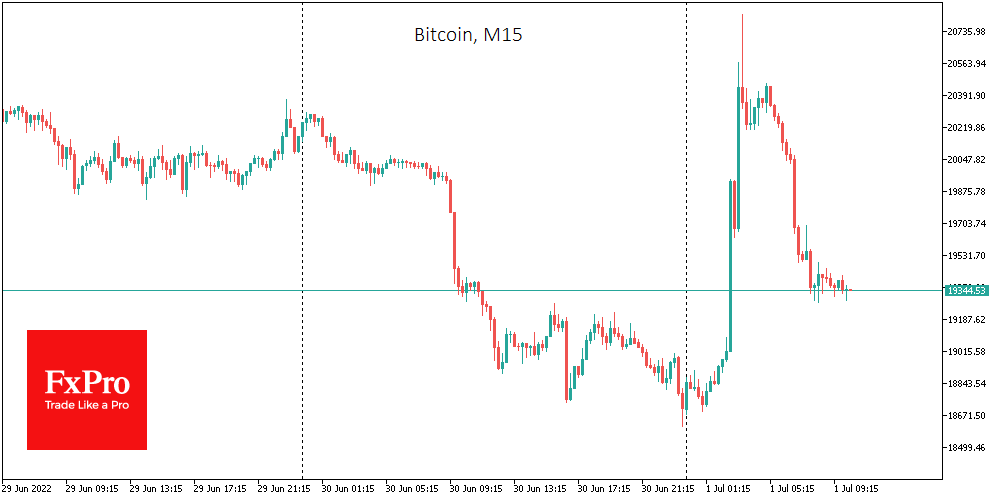
In other words, we see attempts to create the appearance of buying the dip in bitcoin. Still, the rise in price entails increased selling – a typical sign that institutional and market professionals are “dumping” the asset to retail investors guided by the price chart.
By Friday, the cryptocurrency fear and greed index remained unchanged at 11 points (“extreme fear”).
Bitcoin intensified its decline on Thursday after breaking the $20,000 level. BTC tested 11-day lows near $18,600 amid a plunge in stock indices.
Last month was one of the worst for bitcoin, with BTC losing 41% of its value, falling short of historical trends.
In terms of seasonality, July is considered a relative success for BTC. Over the past 11 years, bitcoin has ended the month up seven times and down four times. The average rise was 22%, and the average decline was 9%. In the first case, BTC could end July at around $23,000. In the second, it could end July at about $17,000.
According to Deutsche Bank, Bitcoin could recover to $28,000 by the end of 2022 on the back of a likely rally in US equities.
JPMorgan Bank believes the crypto market could bottom out soon, after which bitcoin and other crypto assets will consolidate. Most traders with margin positions have already washed out of the market.
We continue to maintain our position that there remains a sellers’ advantage, and the slowest of them will be careful to sell the crypto market on upside attempts.
According to BitInfoCharts, bitcoin’s fall from historic highs has stripped some 75% of investors (82,600) of their millionaire status.
Pantera Capital founder Dan Morehead is confident that it’s too early to talk about a “bottom” of the market. He expects several more defaults by companies in the sector shortly – like the story of Three Arrows Capital.
OTC cryptocurrency dealer Genesis Global Trading could face hundreds of millions of dollars in losses due to the loss of liquidity of counterparties Three Arrows Capital and Babel Finance.
Lee Reiners, director of the Center for Global Financial Markets at Duke University in North Carolina, believes digital currencies have no real value and should be banned.
GBPJPY Bears Take Charge; Eyes on 50-SMA
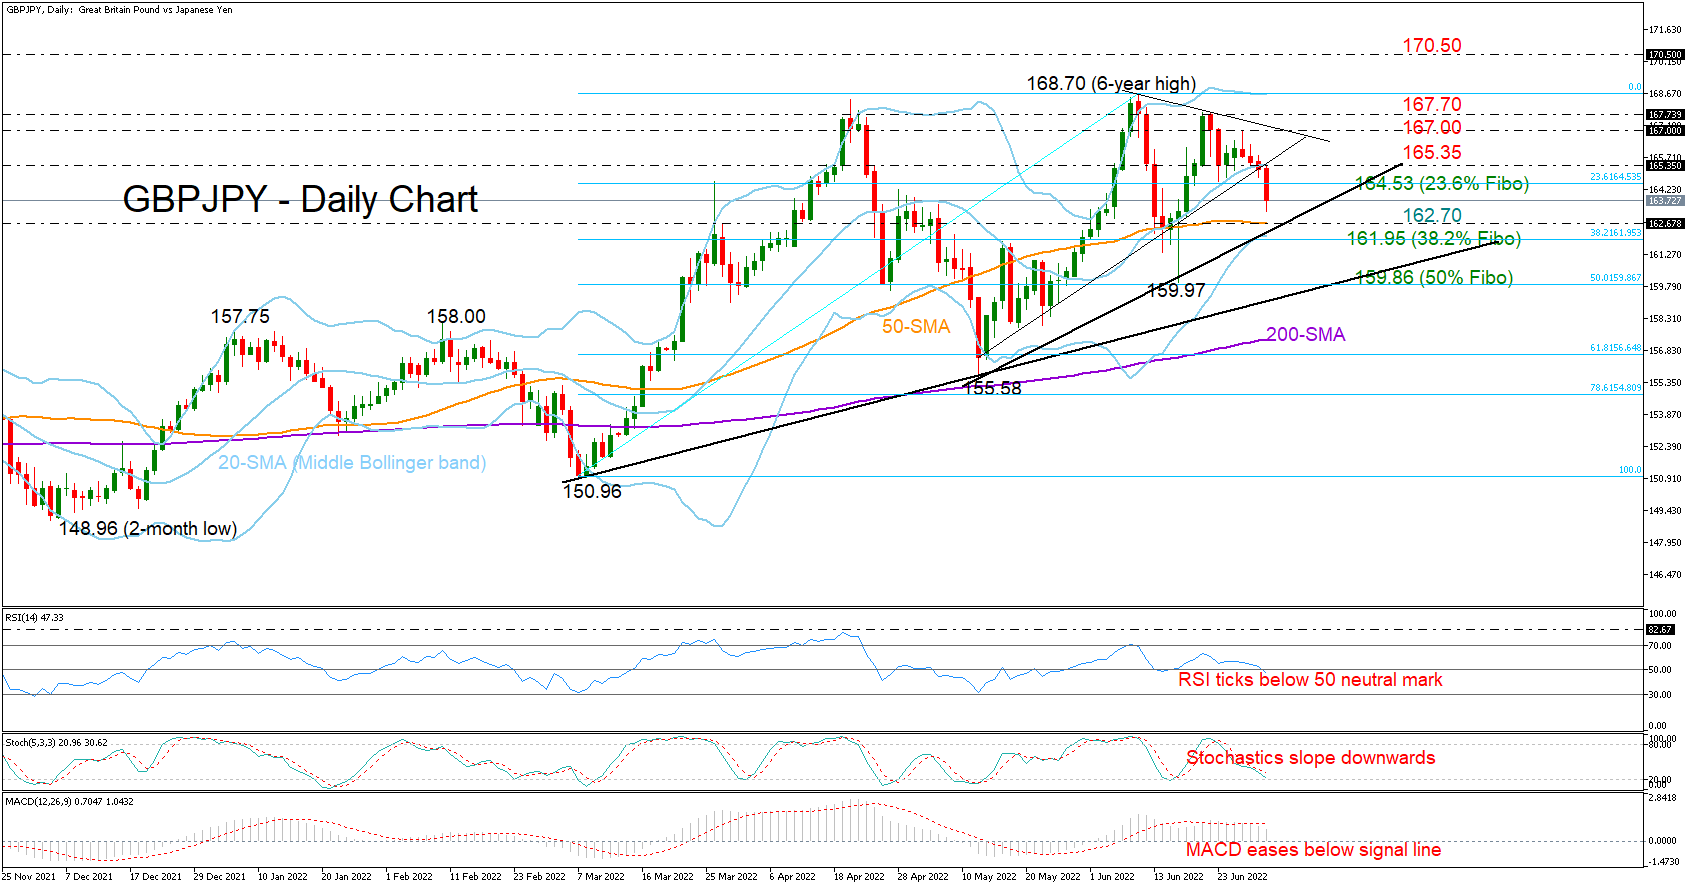
GBPJPY sharpened its downturn below the 20-day simple moving average (SMA) and a key support trendline on Friday, tumbling to a two-week low of 163.24.
The price is also set for a close below the 23.6% Fibonacci retracement of the 150.96 – 168.70 upleg at 164.53, which was indestructible over the past week, hinting at further weakness ahead. The momentum indicators are in favor of this bearish scenario, too. The RSI is crossing below its 50 neutral mark, the Stochastics are falling, and the MACD is losing steam below its red signal line. Besides, with the price trading some distance above the lower Bollinger band, the market has yet to reach oversold levels.
Sliding even lower, the pair may face congestion around the 50-day SMA and the tentative support trendline drawn from the 155.58 trough at 162.70. The 38.2% Fibonacci of 161.95 is adding more importance to the region. Hence, a move below that base is expected to produce another strong downfall, likely towards the 50% Fibonacci of 159.86 and the longer-term ascending trendline.
On the upside, a bounce back above the 20-day SMA at 165.35 is required to bring the 167.00 round level and the short tentative resistance trendline under examination. Then, the bulls may attempt to clear the tough ceiling of 167.70 – 168.70 with scope to meet the 170.50 barrier taken from January-February 2016.
In brief, downside pressures are expected to persist in the near term, with traders likely seeking immediate support within the 162.70 – 162.95 territory.
EURAUD Buying The Dips At The Blue Box Area
Hello fellow traders. In this technical blog we’re going to take a quick look at the Elliott Wave charts of EURAUD, published in members area of the website. As our members know, we’ve been favoring the long side in EURAUD due to incomplete bullish structure the pair is showing in the cycle from the April 5th low. Consequently, we recommended members to avoid selling the pair, while keep favoring the long side. Recently the pair made a short term pull back that has given us good trading opportunities. In the further text we are going to explain the Elliott Wave Forecast and trading strategy.
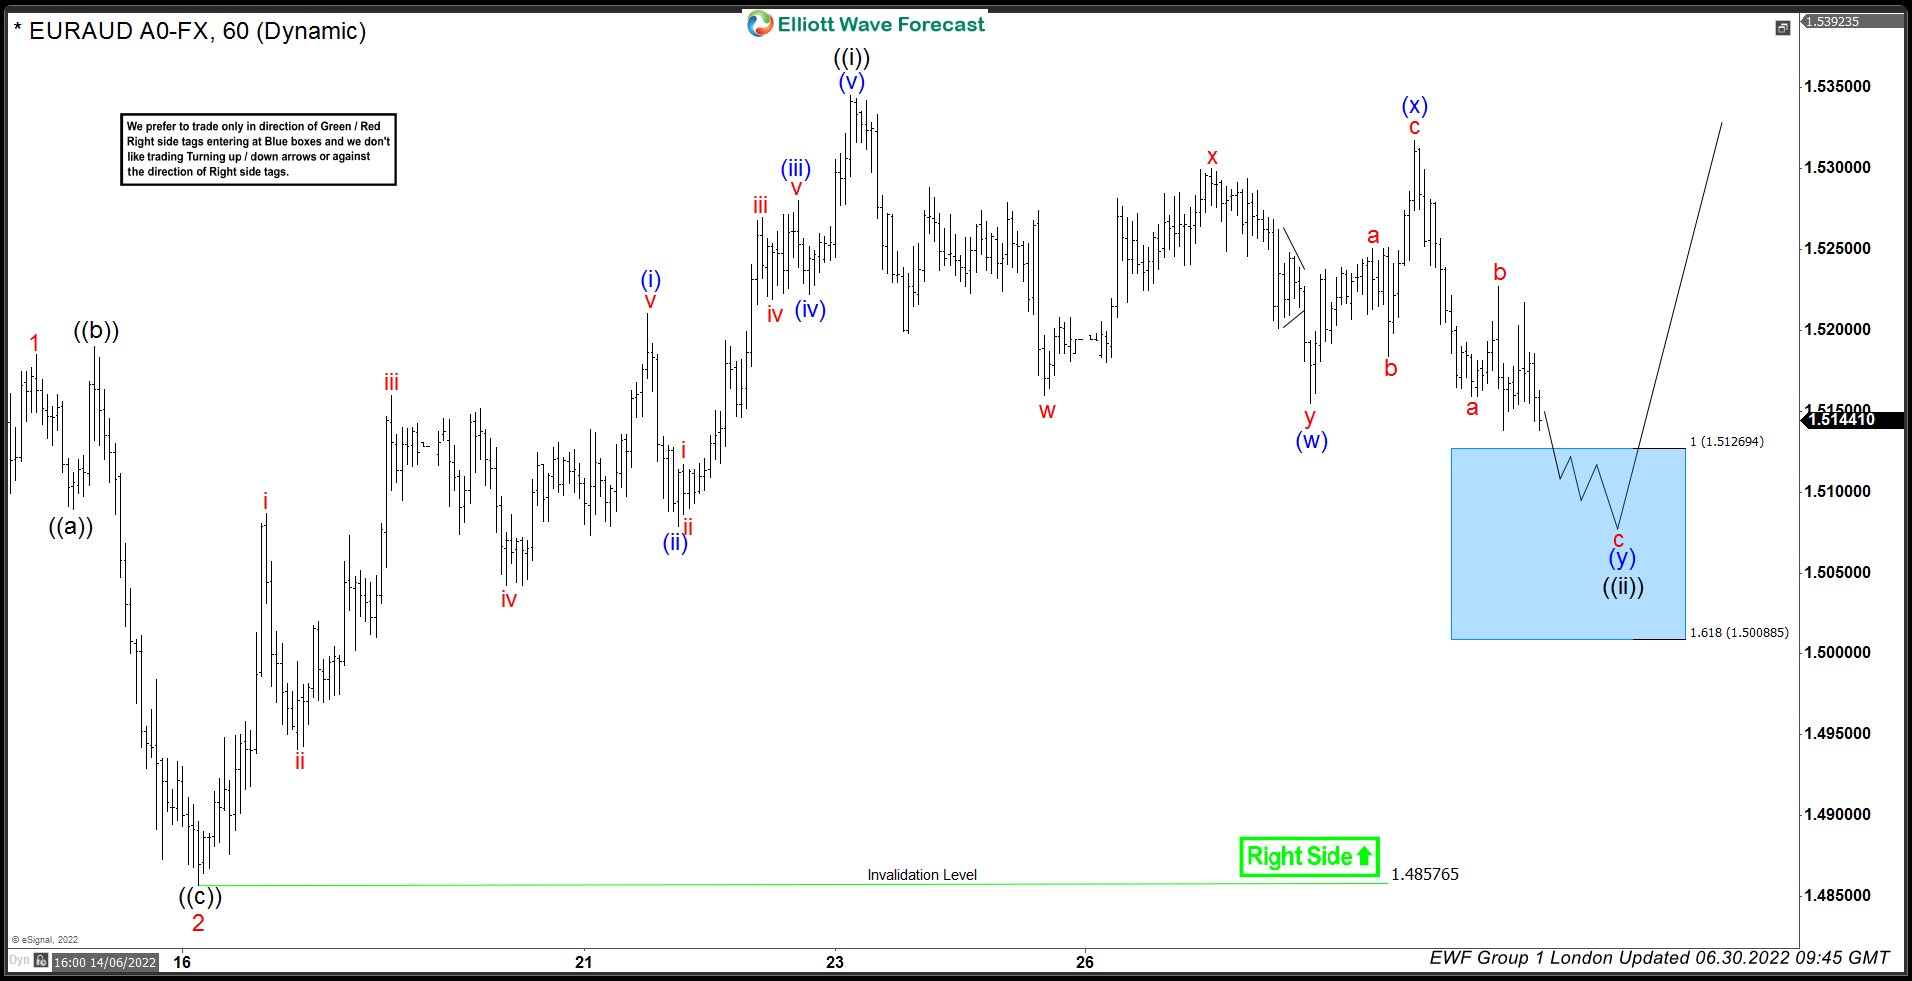
EURAUD Elliott Wave 1 Hour Chart 06.30.2022
Short term cycle from the 1.4857 ended as 5 waves structure – ((i)) black. Currently the pair is giving us correction that is unfolding as Elliott Wave Double Three Pattern. Wave ((ii)) Pull back looks incomplete at the moment. We expect to see another leg down toward 1.51269-1.50088 area ( Blue Box – buying zone) .We don’t recommend selling the pair against the main bullish trend. Strategy is waiting for the price to reached marked blue box zone, before entering the long trades. As the main trend is bullish we expect buyers to appear at the blue box for 3 waves bounce at least. Once bounce reaches 50 Fibs against the (x) blue high, we will make long position risk free ( put SL at BE). Invalidation for the trade would be break of marked invalidation level 1.50088.
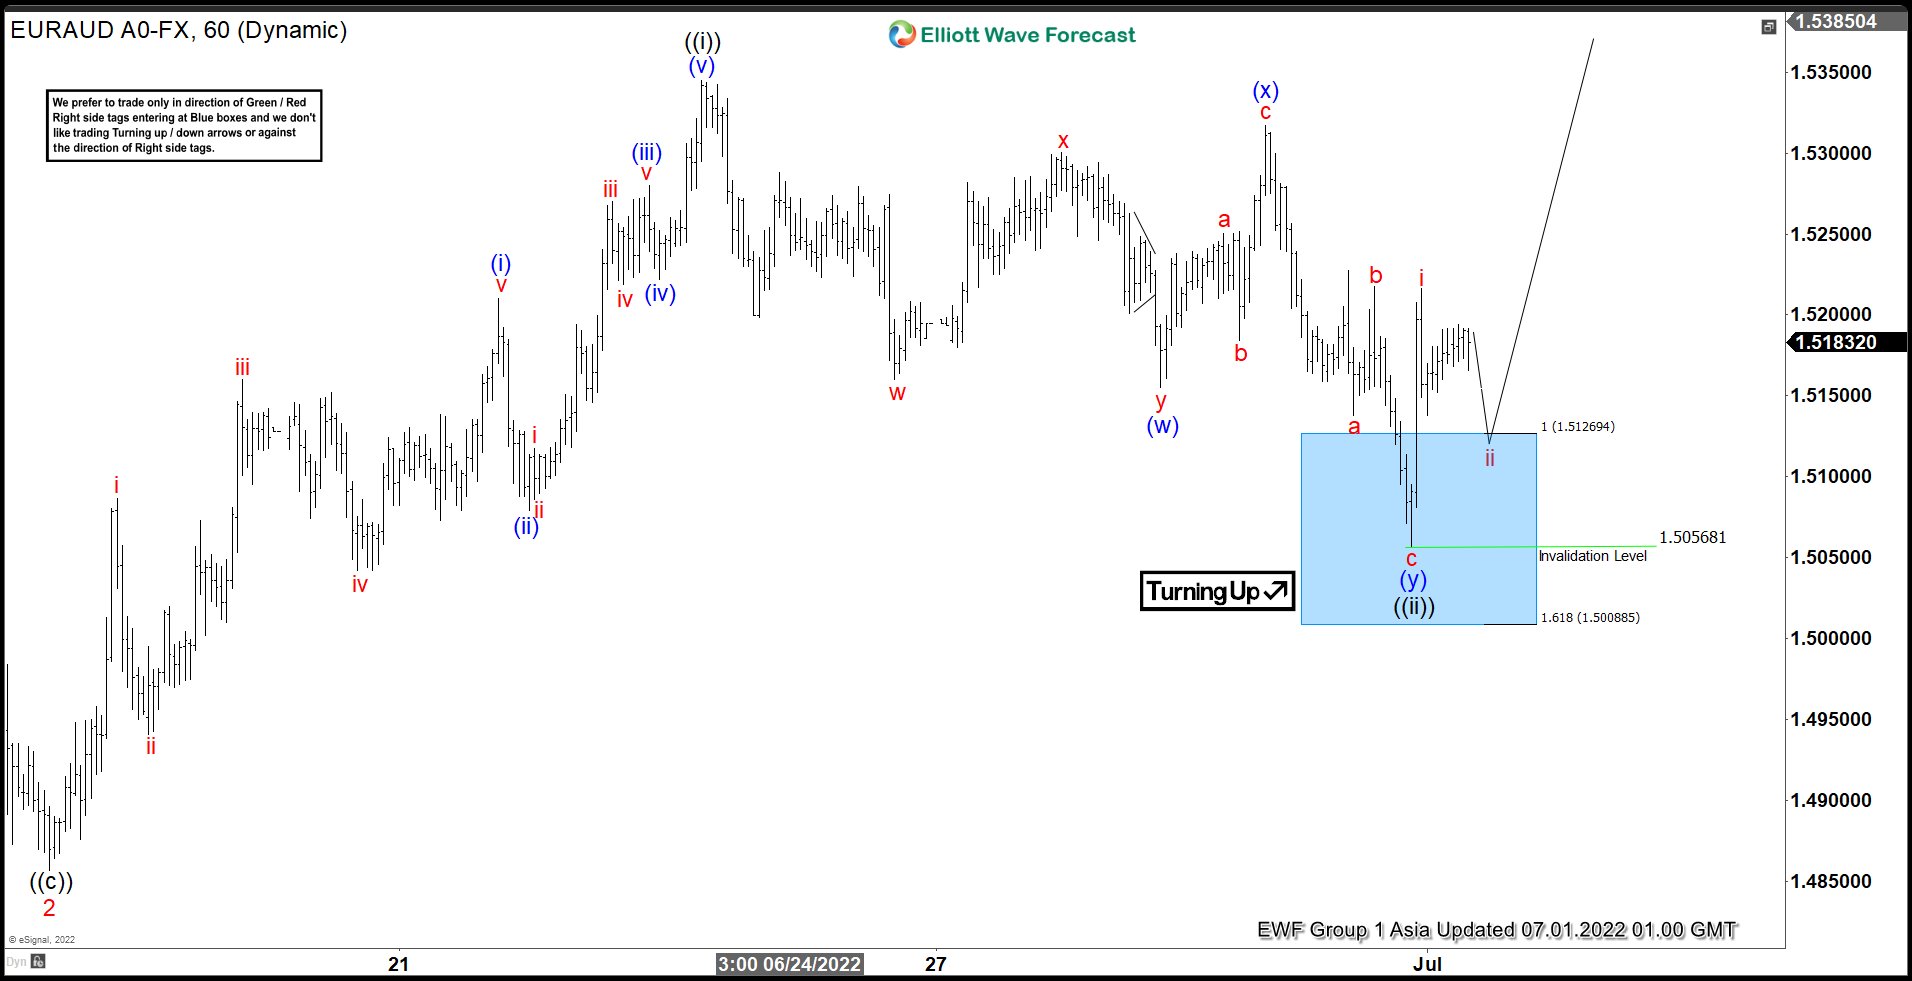
EURAUD Elliott Wave 1 Hour Asia Chart 07.01.2022
EURAUD made leg down as expected. The pair found buyers at the Blue Box area and we are getting good reaction from there. We see Pull back completed at 1.50568 low. The rally from the blue box already reached 50 fibs against the (x) connector. Consequently, we made long trades risk free (put SL at BE). Now we need to see break of 06/23 peak to confirm next leg up is in progress.
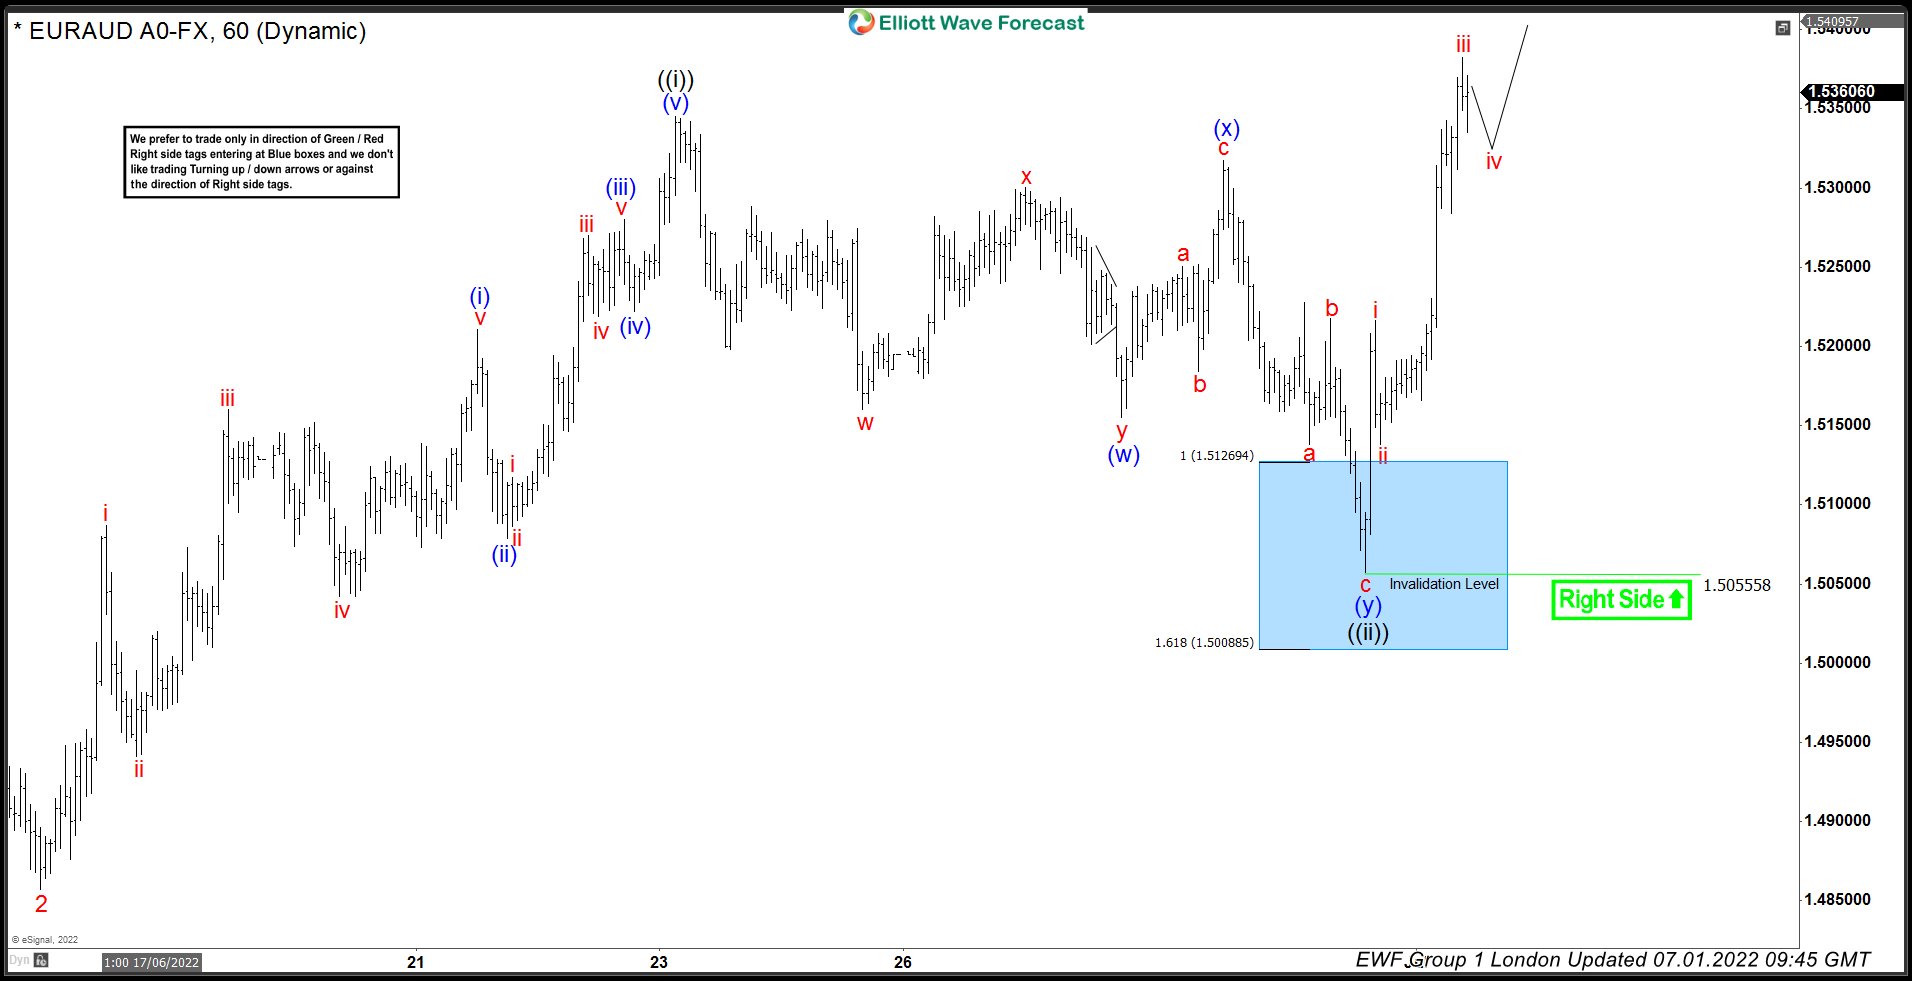
EURAUD Elliott Wave 1 Hour London Chart 07.01.2022
The pair resumed trading higher and broke 06/23 peak as we expected. EURAUD should ideally remain bullish against the 1.50568 low and resume trading higher toward 1.593 area ideally.
Keep in mind that market is dynamic and presented view could have changed in the mean time. You can check most recent charts in the membership area of the site. Best instruments to trade are those having incomplete bullish or bearish swings sequences. We put them in Sequence Report and best among them are shown in the Live Trading Room
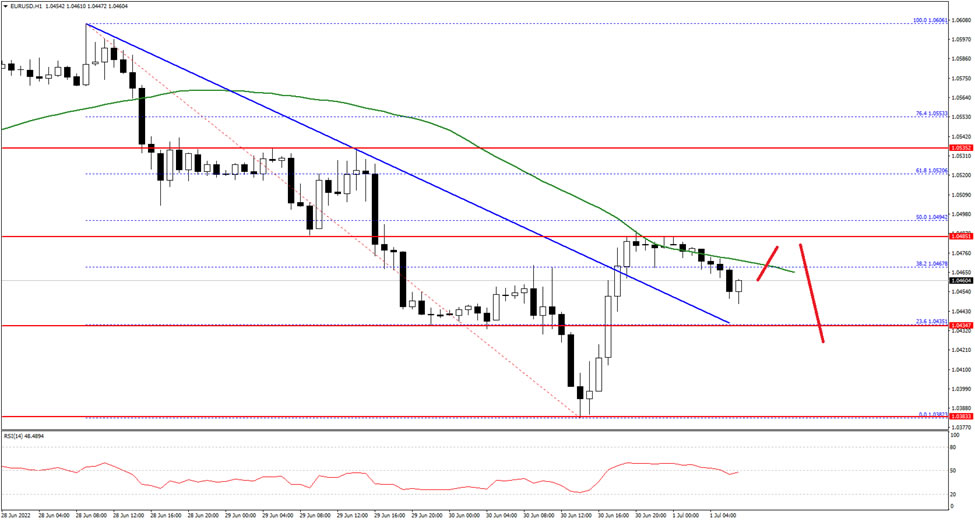
EUR/USD Technical Analysis 1st July 2022
The Euro started a fresh decline below the 1.0500 support zone against the US Dollar. The EUR/USD pair even traded below the 1.0420 level before the bulls appeared near the 1.0380 level.
A low is formed near 1.0382 and the pair is now rising. There was a move above the 1.0450 resistance and a connecting bearish trend line on the hourly chart. The pair is now testing the 1.0475 level and the 50 hourly simple moving average.
On the upside, the next major resistance is near the 1.0485 level on FXOpen. A break above the 1.0475 and 1.0485 resistance levels could start another increase. In the stated case, it could even surpass 1.0540.
An immediate support is near the 1.0435 level. The next key support is near 1.0420, below the pair could decline towards the 1.0380 level in the near term. Any more losses might send the pair towards the 1.0320 level.
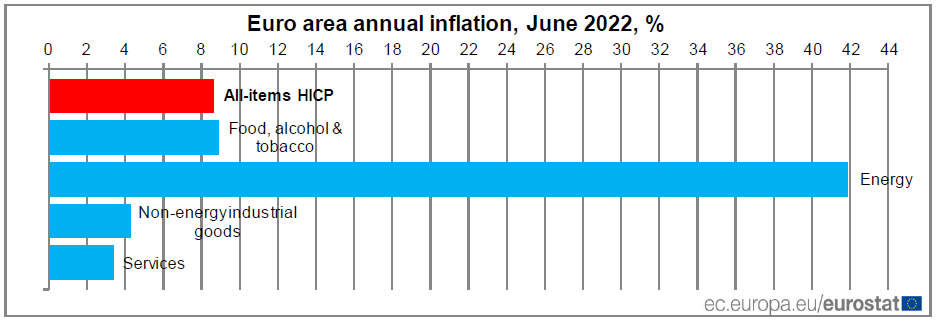
Eurozone CPI accelerated to 8.6% yoy in Jun, but core CPI slowed to 3.7% yoy
Eurozone CPI accelerated from 8.1% yoy to 8.6% yoy in June, above expectation of 8.3% yoy. However, CPI core slowed from 3.8% yoy to 3.7% yoy, below expectation of 3.9% yoy.
Looking at the main components, energy is expected to have the highest annual rate in June (41.9%, compared with 39.1% in May), followed by food, alcohol & tobacco (8.9%, compared with 7.5% in May), non-energy industrial goods (4.3%, compared with 4.2% in May) and services (3.4%, compared with 3.5% in May).
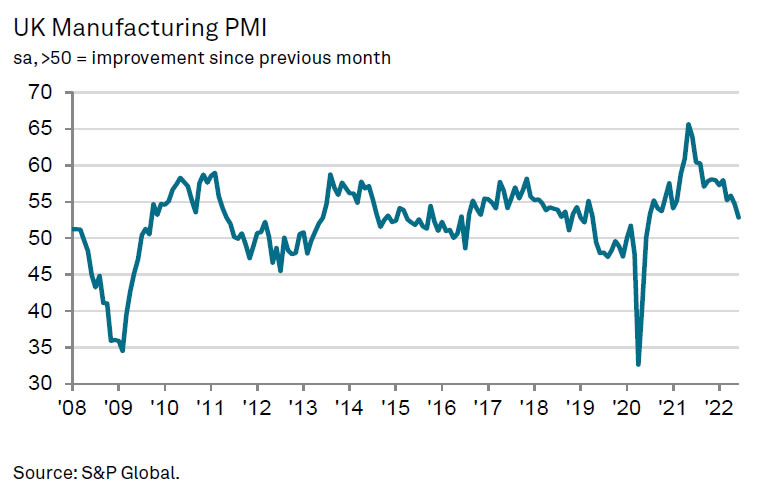
UK PMI manufacturing finalized at 52.8 in Jun, economic backdrop to darken further in H2
UK PMI Manufacturing was finalized at 52.8 in June, down from May's 54.6, a two-year low. S&P Global said output growth slowed to near-stagnation pace as new orders intakes fell for the first time since January 2021. Price inflation remained elevated despite further easing.
Rob Dobson, Director at S&P Global Market Intelligence, said: "UK manufacturing output growth ground to a near standstill in June, as intakes of new work contracted for the first time since January 2021. Domestic market conditions became increasingly difficult and foreign demand fell sharply again... Business confidence took a hit as a result, dipping to its gloomiest since mid-2020...
"There were some welcome signs that supply-chain constraints and cost inflationary pressures may have passed their peaks. However, with these constraints still elevated overall and demand headwinds rising, it is likely that UK manufacturing will see the economic backdrop darken further in the second half of the year."
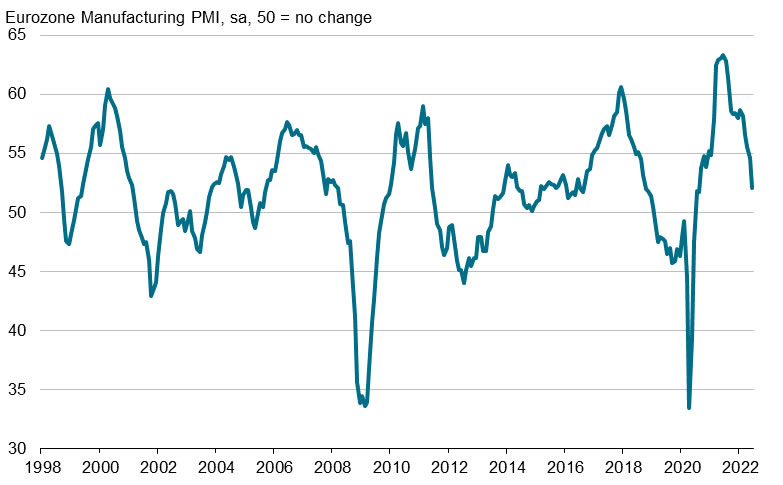
Eurozone PMI manufacturing finalized at 22-mth low at 52.1, increasing likelihood of manufacturing recession
Eurozone PMI Manufacturing was finalized at 52.1 in June, down from April's 54.6. That's also the lowest level in 22 months. Readings of the member states were also weak, with the Netherlands at 19-month low of 55.9, Ireland at 16-month low at 53.1, Spain at 17-month low at 52.6, Germany at 23-month low at 52.0, France at 18-month low at 51.4, Austria at 22-month low at 51.2, Greece at 16-month low at 51.1, Italy at 24-month low at 50.9.
Chris Williamson, Chief Business Economist at S&P Global Market Intelligence said: "Eurozone manufacturing has moved into decline in June, with production dropping for the first time for two years amid a steepening downturn in demand.... The downturn looks set to gain momentum in coming months.... One upside to the recent weakening of demand is an alleviation of some supply chain constraints, which has in turn helped cool inflationary pressures for industrial goods. With the survey data indicating an increasing likelihood of the manufacturing sector slipping into a recession, these price pressures should ease further in the third quarter."
USDCAD Picks Up Momentum as July’s Trading Kicks Off
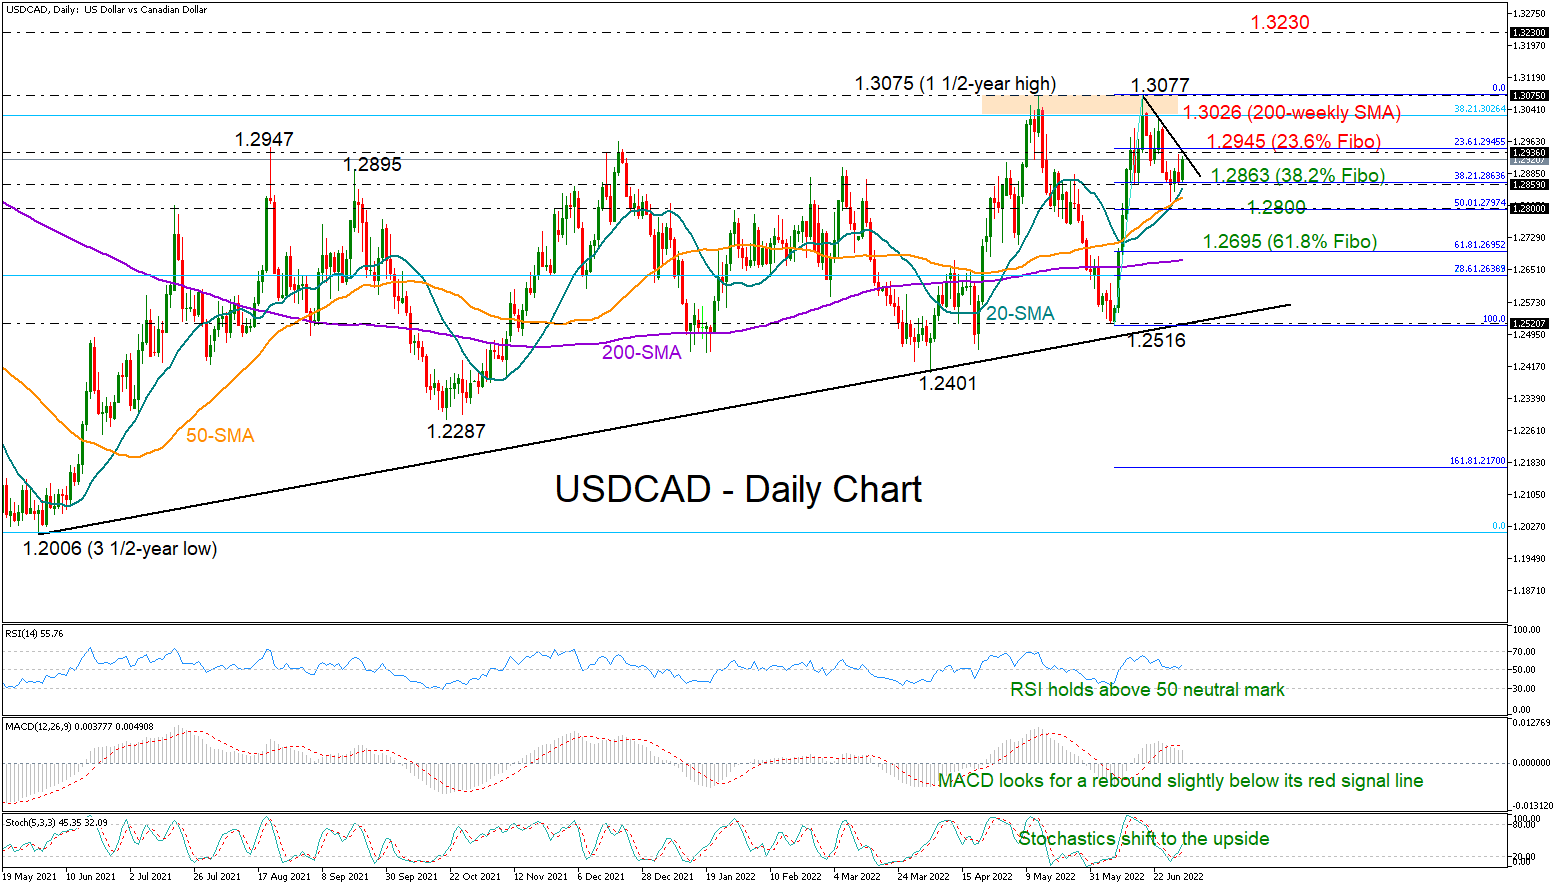
USDCAD started July’s trading on a positive note on Friday after halting its latest bearish correction around June’s support zone of 1.2863, and marginally above its 20- and 50-day simple moving averages (SMAs).
The RSI has avoided a drop below its 50 neutral mark and is currently looking for a rebound, while the Stochastics have also shifted northwards, both endorsing the bullish action in the price.
On the other hand, the MACD is still slightly below its red signal line, preserving some caution, and that seems reasonable as the price is quickly approaching a short-term tentative resistance trendline (more visible in the four-hour chart). The 23.6% Fibonacci retracement of the latest sharp rally from 1.2516 to 1.3077 is in the neighborhood as well, at 1.2945. Hence, traders may wait for a successful move above that bar before targeting the tough resistance zone at 1.3026. Notably, this is where the 200-weekly SMA and the 38.2% Fibonacci of the 2020 sell-off are placed. Hence, any violation here may trigger another exciting bullish phase.
In the event of a downside reversal, the pair may initially retest the foothold at 1.2863, where the 38.2% Fibonacci is located. If selling pressures overwhelm, the next destination could be the 1.2800 psychological mark and the 50% Fibonacci, a break of which could squeeze the price towards the 61.8% Fibonacci of 1.2695 and the 200-day SMA.
Meanwhile, in the long-term picture, the outlook has neutralized following the slide below the 1.2950 area.
Summarizing, the short-term bias is viewed as positive-to-neutral since the latest bullish action still requires confirmation with a move above 1.2945.
Daily Technical Analysis
EUR/USD
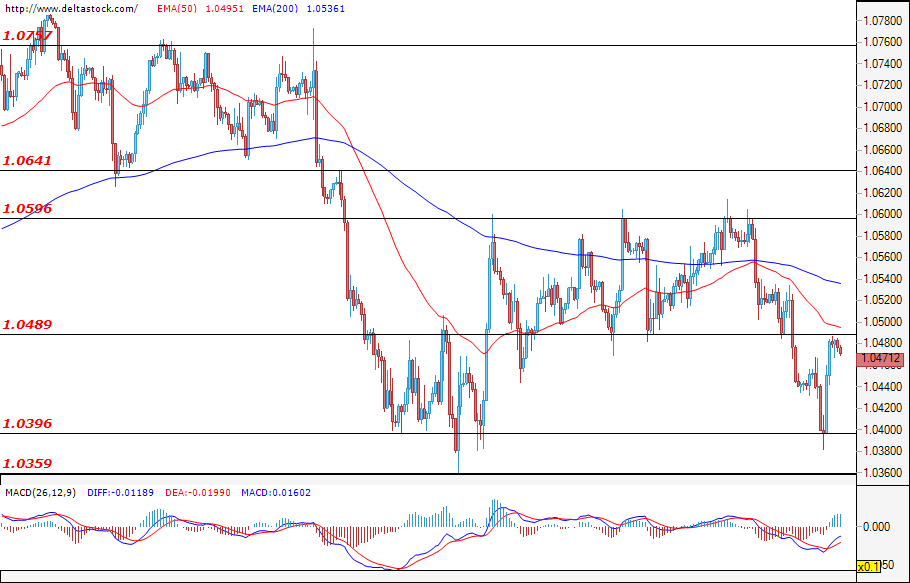
In the early hours of today’s trading session, the euro gained strength against the dollar and bounced back from the resistance level at 1.0490. The expectations for today’s trading session are for the bears to attack the support zone at around 1.0400. In the opposite direction, only a confirmed breach of the psychological level at 1.0500 would pave the way for the pair towards the next resistance zone at 1.0600. However, the market sentiment for today’s trading session remains negative, and we will most likely see further depreciation of the euro and a test of the support at 1.0400, where a confirmed breach would most probably lead to an impulsive downwards movement towards new lows at around 1.0300.
USD/JPY
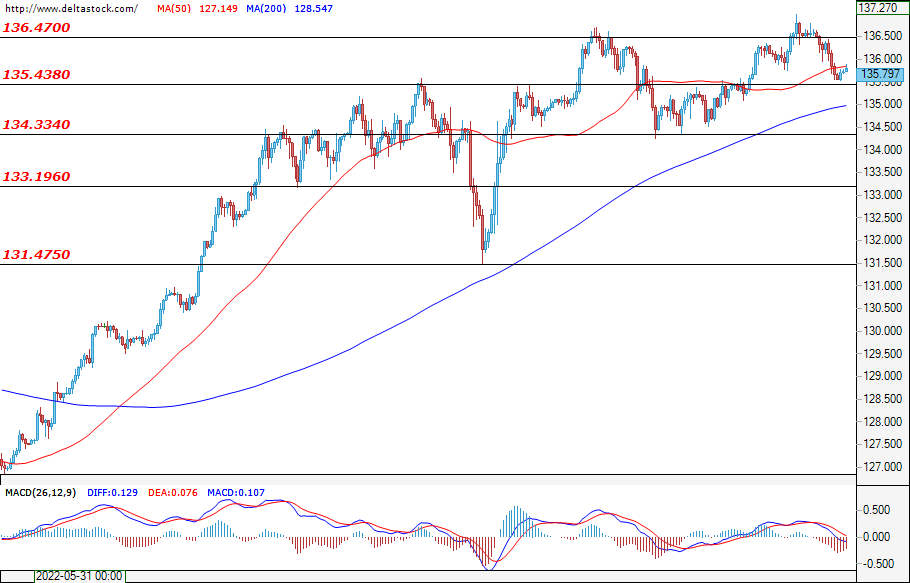
The decline from the previous trading session was limited above the support at 135.40 and the bulls would probably try to lead the pair towards a test of the resistance at 136.47. A short-term consolidation in the narrow range of 135.43 – 136.47 should also not be excluded as a possible scenario for today’s trading session. A more bearish picture could only be drawn after a confirmed breach of the support at 135.43, and a deepening of the sell-offs may result in a steeper price correction, which may lead to a decrease towards the support at 134.30.
GBP/USD
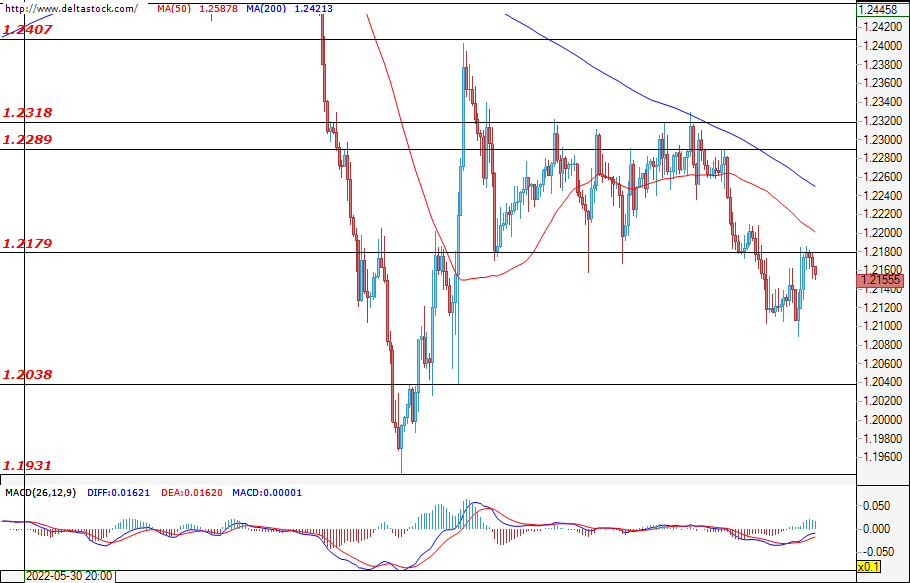
The resistance at 1.2180 managed to hold off the bulls' attack and the currency pair is likely to continue the downtrend, with the next target for the bears being the psychological level at around 1.2000. In case the bears lose their momentum and the bulls manage to violate the resistance at 1.2180, then the pair would most probably head towards the resistance at 1.2290.
EUGERMANY40
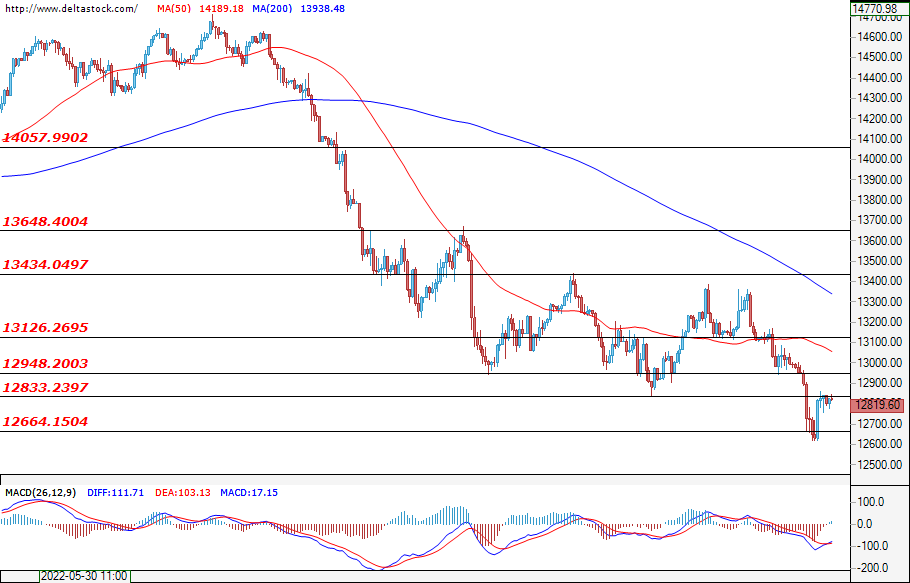
The expectations for today’s trading session are for the bears to re-enter the market and to lead the index towards a test of the key support at 12664, where a successful breach would be considered a signal for a possible deepening of the sell-offs. This, in turn, may lead to a decrease in the price, which is to be expected considering the overall micro- and macroeconomic environment in the EU at this time.
US30
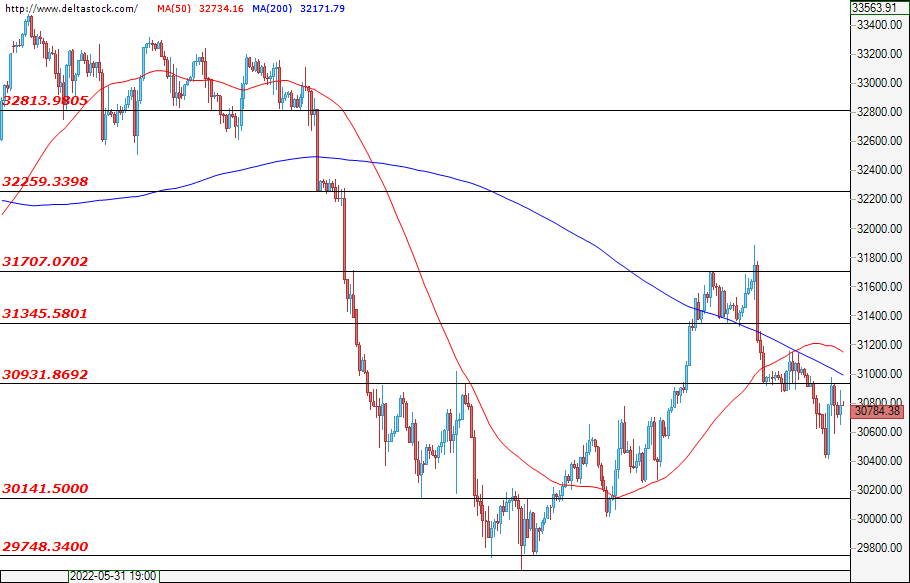
The bears still manage to resist the bulls’ pressure and the index is currently trading below the resistance at 31000. The expectations are for the bears to prevail and to possibly lead the price towards the support zone at 30140. However, if the bulls manage to resist the bears’ pressure instead, then we may witness an increase in the price towards the level at 31350. Let’s not forget, however, that the fundamentals at the moment are definitely on the side of the bears, thus today’s forecast may suggest a decrease towards the support at 29748.
WTI Oil Outlook: WTI Remains in Red on Recession Fears, OPEC Disappointment
WTI oil remains in red on Friday, pressured by growing fears of recession that continues to sour the sentiment, while comments from OPEC that the cartel is not going to increase more its production and will stick to its planned output increases, although being expected, added to negative tone.
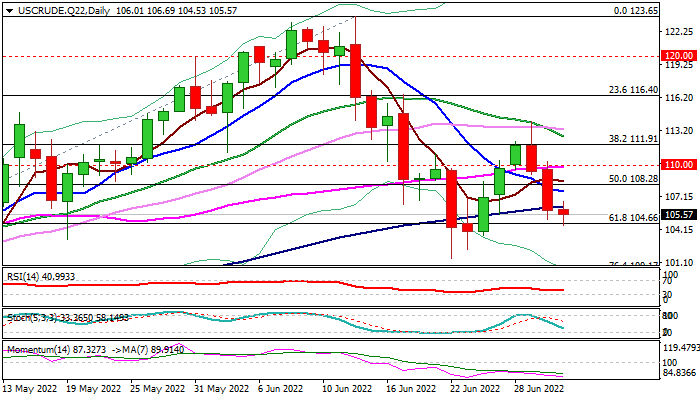
The action on Friday, following 5.3% drop in past two days, is pressuring pivotal support at $104.66 (daily cloud base / Fibo 61.8% of $92.92/$123.65), already cracked last week, with clear break to generate fresh bearish signal.
Oil is on track for the third bearish weekly close and has registered the first monthly loss in seven months (down 11.5% in June) that adds to reversal signals on larger timeframes (weekly / monthly), though signals would require confirmation on break of a higher base at $92.92/$92.64 (Mar/Apr) to complete a failure swing pattern on a weekly chart.
Daily studies show strong negative momentum and MA’s in bearish setup that keeps focus at the downside, though bears may face headwinds at daily cloud base ($104.62), before resuming towards targets at $101.52 /$100.00 (Jun 22 low / psychological).
Broken 100DMA marks initial resistance ($106.30), followed by daily cloud top ($107.06), with daily Tenkan-sen ($107.76) to cap upticks and keep bears intact.
Res: 106.30; 107.06; 107.76; 109.27.
Sup: 104.62; 103.61; 101.52; 100.00.