Sample Category Title
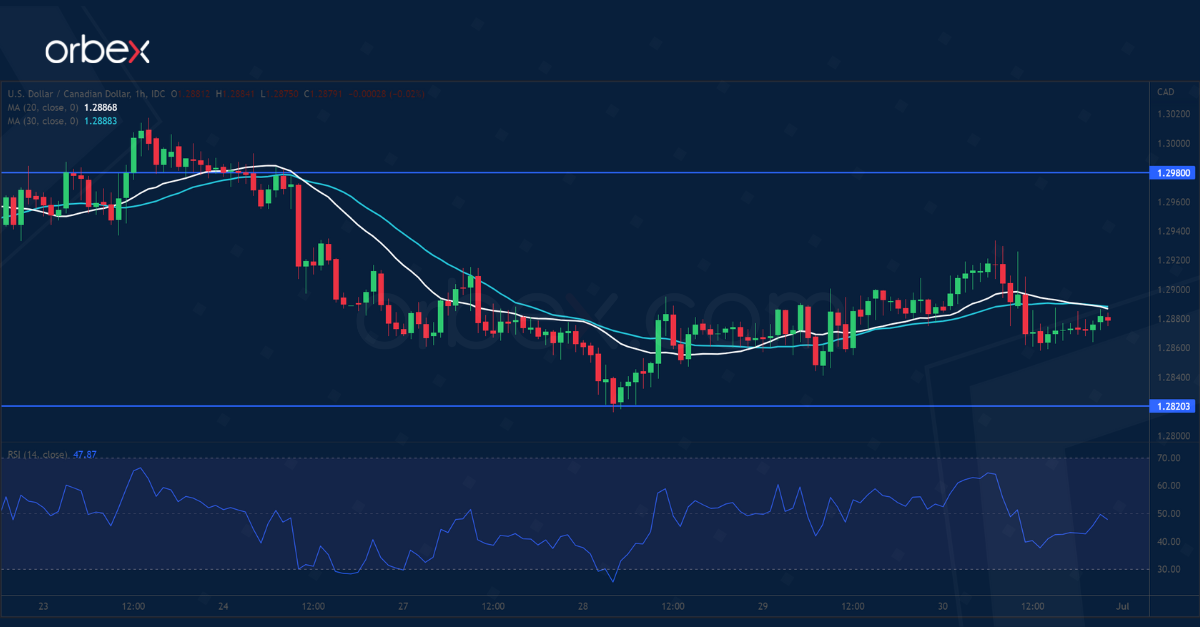
USD/CAD Bounces Higher
The Canadian dollar struggles over a slowdown in April’s GDP growth. Sentiment remains in the US dollar’s favour after a tentative break above May’s high at 1.3070. A bullish MA cross on the daily chart indicates an acceleration to the upside as the pair bounces back. A close above 1.2910 led short-term sellers to cover their positions. 1.2980 from a previous sell-off is a key hurdle and its breach may take out the remaining selling interest and pave the way for an extended rally. On the downside, 1.2820 is a major support.
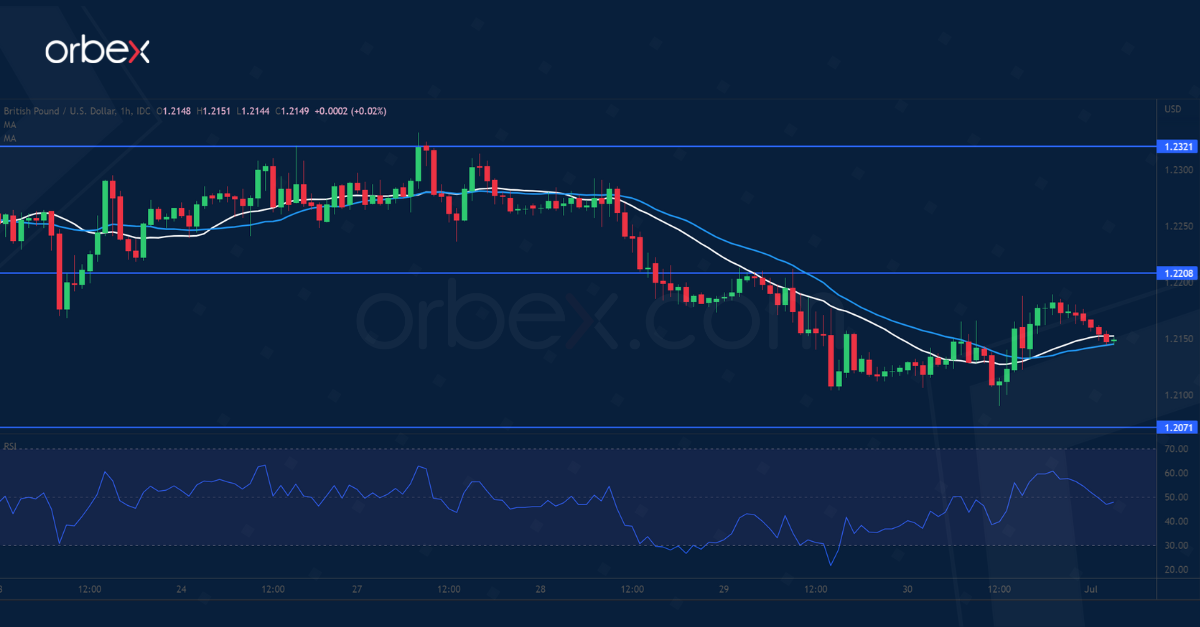
GBP/USD Tests Critical Support
The pound treads water as Britain’s Q1 GDP was in line with expectations. The pair’s struggle to hold above the demand zone near 1.2180 reveals weakness in the latest recovery. The lack of follow-up rally drove the bulls to exit, exacerbating the bearish pressure. The RSI’s oversold condition caused a limited bounce which could be capped by offers around 1.2200. The origin of the mid-June surge at 1.2070 is buyers’ last stronghold and a bearish breakout would trigger a wave of liquidation below the daily support at 1.1900.
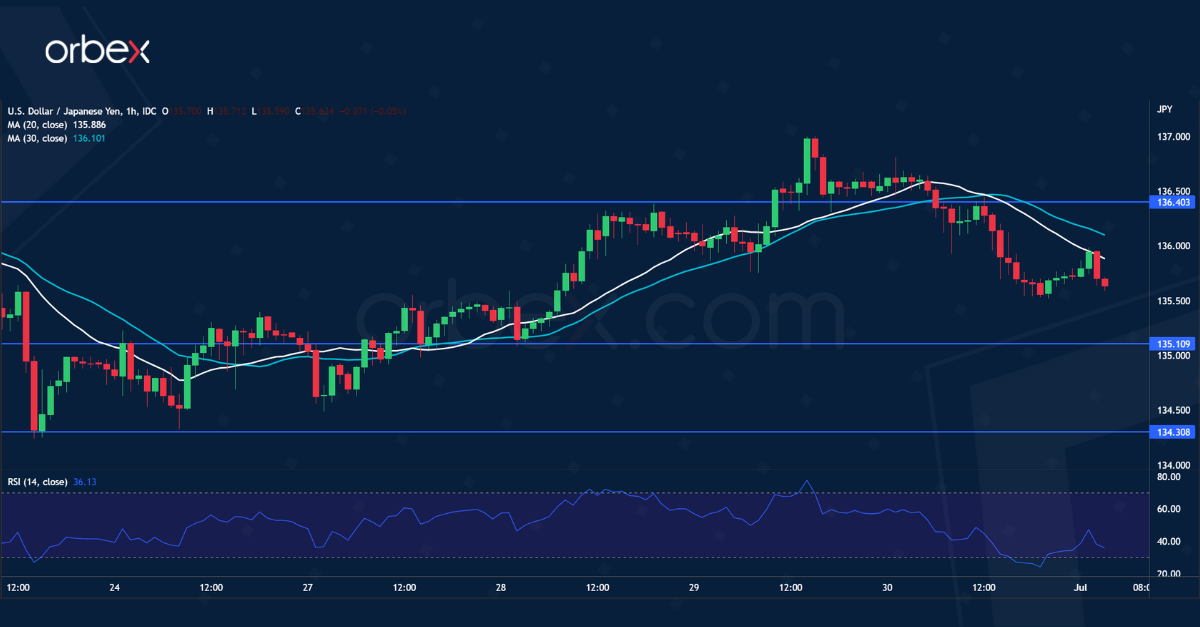
USD/JPY Seeks Support
The US dollar fell back after May’s PCE came out short of expectations. After a brief pullback, the pair found solid support next to the former resistance at 134.30. A pop above the recent high (136.70) suggests that the bulls are back in the game. This is a bullish sign that the overall direction remains up. Though short-term price action may be choppy as the greenback looks for bids below 135.80. 135.10 is the next support to gauge buying interest. The bulls will need to push above 136.40 to continue upward.
First Half Done
The first half is finally over, but the pain is certainly here to stay.
Ugly data
The unemployment rate in the US fell but the average monthly job additions fell from 562 to 488’000, while inflation advanced from 7.1% to 8.5% despite the Federal Reserve (Fed)’s efforts to bring it down, as crude oil jumped more than 70% when the war in Ukraine started, and is still up by more than 40% since the beginning of January. The US 10-year treasury yield more than doubled, from around 1.50% to near 3.50% by mid-June, and more dramatically, the US 2-year yield took the lift and rallied from near 0.70% to almost around 3.50%, as well. The 2-10 year portion of the US yield curve inverted a couple of times during the first half of the year, screaming that a recession may be on the road map for the US in the next 12 to 18 months, and the probability of a global recession advanced to 30 to 50%.
Ugly markets
The S&P500 which saw its last record high on the 4th of January, took a dive, and closed the first half in the bear market, having lost more than 20% since the beginning of the year, while Nasdaq, which is more sensitive to the Fed policy and to the rising interest rates, closed the first half more than 30% down.
Gold did a good job as a hedge to turmoiled markets. It gave a good protection to investors, especially during the start of the Ukrainian war, and is flat year to date. However, the rising US yields, which increased the opportunity cost of holding the non-interest-bearing gold certainly limited the upside potential of the precious metal, and gold starts the second half having stepped into its long-term bearish trend, just a touch above the $1800 per ounce, with the prospect of a further easing toward the $1680 mark, the 2021 lows.
Bitcoin proved to be an imperfect hedge against both inflation and the falling markets. It has been betrayed by a high correlation with the volatile technology stocks. Bitcoin dived 60% since the start of the year and kicks off the second half below the $20K mark.
JP Morgan said that the current phase of deleveraging is now at an advanced stage and that the selloff may not last longer. The cryptocurrencies should yet convince masses that it’s a good investment again. Ff the overall market selloff slows, we may see the cryptocurrencies stop the fast bleeding, but we will hardly see them spike to the moon in the near term.
Among the European indices, DAX is down by more than 20%, and remains under a heavy selling pressure as the war on the continent, and the threat of a massive energy crisis weigh on appetite for German stocks, and FTSE which benefited from surging oil and commodity prices could lose is almost flat, down by less than 4% since the first day of the year.
Funnily, Chinese stocks diverged positively in the latest quarter, to catch up the losses for the year. Nasdaq’s Golden Dragon China index rebounded by more than 65% since the March dip, and is starting the second quarter a touch lower than where we were at the start of the year. That’s not oo bad!
What’s next?
The pain may not be over, as the Fed is expected to remain as aggressive as needed until it sees a material and a persistent softening in inflation. The problem is, inflation doesn’t necessarily come from the demand side, meaning that even with an aggressive policy tightening, the Fed may not achieve its goal soon enough.
So, what will happen now? Nothing new. Inflation will remain the major driving factor of the markets in the second half, and the overall market sentiment will hugely depend on inflation numbers.
The only thing that could help inflation fears ease is lower energy and commodity prices. In this sense, we have some encouraging news. The base metals had their worst quarterly slump since 2008, and Invesco’s base metals fund is about 12% lower than where it started the year. Ishares diversified commodity index has stepped in the bearish consolidation zone after falling below the major 38.2% Fibonacci retracement on year-to-date rally, hinting that further easing is perhaps on the cards.
American crude fell to $106 per barrel yesterday. As expected, OPEC increased its oil production by another 650’000 barrels per day. But the selloff in oil was mostly triggered by the recession fears as investors don’t even know whether OPEC could meet its production targets in the coming months. And even if they did, the refining capacity remains limited and oil giants prefer pocketing the money they make, rather than investing in something that is left to die in just a bit more than a decade.
As a result, the price pullbacks into the $100pb are still seen as opportunity to buy a dip.
Euro Area Flash HICP in Focus
Market movers today
In the euro area the market highlight today will be the HICP figures for June. Due to Germany's energy relief measures, core inflation might hold steady at 3.8%, but we doubt that we have seen the inflation peak yet. Higher food and energy prices should continue to pull headline inflation up to 8.5% (from 8.1% in May), leaving little room for complacency from ECB.
In the US, ISM manufacturing for June will be in focus today and after some gloomy regional PMI readings, could further add to recession fears in the markets.
Swedish manufacturing PMI's are likely to have followed the rest of Europe lower in June. With new orders weakening during May, we also look for a moderate fall in the Norwegian PMI manufacturing to around 54.0, while the unemployment rate probably held steady at 1.7% in June.
The 60 second overview
Riksbank: In line with expectations, Riksbank hiked its policy rate by 50bp yesterday. They also lifted the policy rate path, although less than we had anticipated. Consequently, the RIBA curve priced out some 25-30bp and 2-year swap rates dropped 10bp post decision, while EUR/SEK ended the day higher. Updated economic forecasts now point towards lengthened period of elevated inflation and clearly weaker GDP growth, with unemployment rate turning higher from 2023. Read more from the FX and FI sections below, or see our Flash comment Riksbank - 50bp and front-loaded rate path, 30 June.
China PMI: Caixin Manufacturing PMI surprised to the upside overnight, as the index rebounded to 51.7 (from 48.1). The figure was even stronger than the official PMI released yesterday, and pointed towards easing supply chain issues, recovering production and easing prices pressures after the Covid-lockdowns were lifted.
Energy: Crude oil prices ended the day lower after OPEC+ confirmed the previous communication of faster production hikes in July and August. EIA data released earlier in the week showed much larger drawdown of crude oil stock levels than expected, pointing towards still tight supply conditions. Latest signals from the Gulf countries also suggest that while OPEC+ continues to signal faster production hikes, available capacity might be running low. We believe that the rising supply concerns could continue to support spot oil prices near the current elevated levels in 3-6M, even though the rising recession fears are already weighing on the longer-end of the curve. Read more from Oil comment - Tight supply supports spot despite rising growth risks, 30 June. Supply challenges are even harsher in European natural gas markets, where Russia's decision to curb gas flow via the Nord Stream 1 pipeline has led to prices rising by around 90% from early June levels. Risks are increasingly tilted towards EU having to eventually restrict gas supply to industrial sector to ensure sufficient gas inventories towards next winter.
Germany: While the Italian government is reading another EUR 8bn energy relief package to support consumers according to media reports, Germany's liberal Finance Minister Lindner ruled out further support measures before 2023, citing budgetary constraints and a wait-and-see attitude to assess the full effect of current measures. Lindner is keen to comply with the constitutional 'debt brake' again by 2023, which would constrain net borrowing to some EUR10-15bn per year. This sets the scene for increasing tensions within Germany's 'traffic light' coalition, with Social Democrats and Greens calling for further relief measures such as VAT cuts. On Monday, German chancellor Scholz will hold a meeting with unions, employer representatives and leading economists to discuss ways to support consumers while avoiding a wage-price-spiral. One of the ideas floated by Scholz, a one-off tax-free payment for all employees in exchange for wage moderation in the upcoming bargaining rounds, unsurprisingly received a lukewarm reception from unions. While German inflation eased somewhat in June (from 7.9% to 7.6%), we think the setback will prove temporary and expire with the energy relief measures in September. With the risk of a sudden Russian gas supply-stop still lurking in the background and a government that seems to be falling back into old fiscal habits, just at a time when the post-pandemic consumption boost is fading, Germany's economy is in for challenging times.
FI: A strong rally on the French CPI figure, was gradually extended through the day with Bund yields ending at 1.33%, which was last seen before the ECB meeting, and more than 50bp lower than the peak reached two weeks ago. Similarly the 10y UST is approaching the 3% level, on the general risk aversion in markets. Spreads widened across the board as the EGB curves bull steepened. BTPs caught a bid after Reuters sources reported that Italy, Spain, Greece and similar countries were set to be net receivers of the flexible reinvestment implementation under the PEPP that is set to start as of today. France was set to be a net 'donor' country, which left them slightly weaker on the day. We estimate that around EUR20bn/month on average will mature under the PEPP programme.
FX: Yesterday's session was dominated by quarter-end rebalancing flows generally driving USD selling in the late afternoon countering the initial drop in EUR/USD in the early part of the session. In an odd mix JPY, AUD and NZD gained while HUF erased some of Wednesday's gains. SEK continues to trade poorly and EUR/CHF is trading just around parity.
Credit: Thursday continued what has so far been a poor week for credit spreads and other risk assets. Recession fears were taking hold and Itrax Main widened 3bp to close at 120.5bp, while Xover widened 7.7bp to close at 589.3bp. Both indices have reached new post-Covid 19 peaks this week.
Nordic macro
Sweden: Swedish manufacturing PMI's are likely to have followed the rest of Europe lower in June. The different sub-indices, especially those related to inflation such as delivery times and price expectations, are likely to warrant more interest than the actual headline given that the inflationary development still takes precedence over the cyclical outlook in the Riksbank's eyes.
EUR/USD Daily Outlook
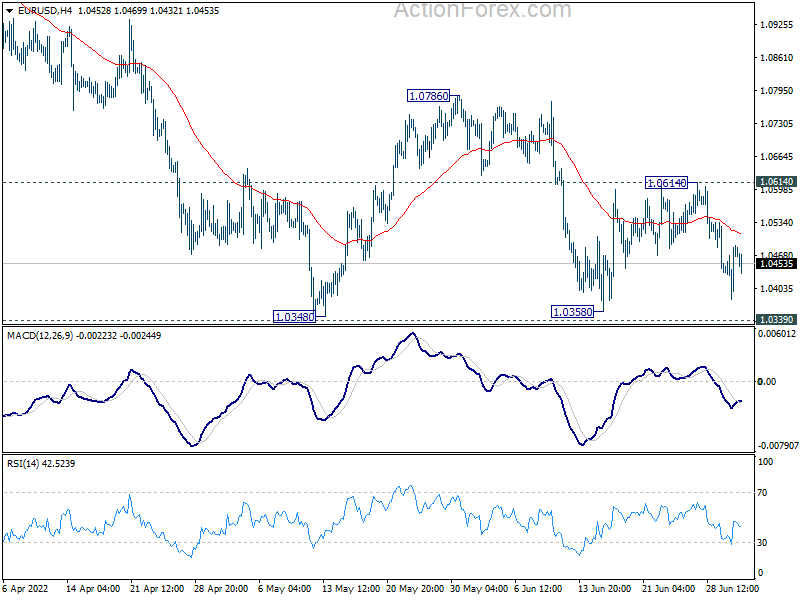
Daily Pivots: (S1) 1.0415; (P) 1.0452 (R1) 1.0521; More...
Range trading continues in EUR/USD and intraday bias remains neutral. Further fall is in favor with 1.0614 minor resistance intact. On the downside, sustained break of 1.0339/48 will resume larger down trend. Next target is long term projection level at 1.0090. On the upside, above 1.0614 will turn bias back to the upside for 1.0786 resistance instead.
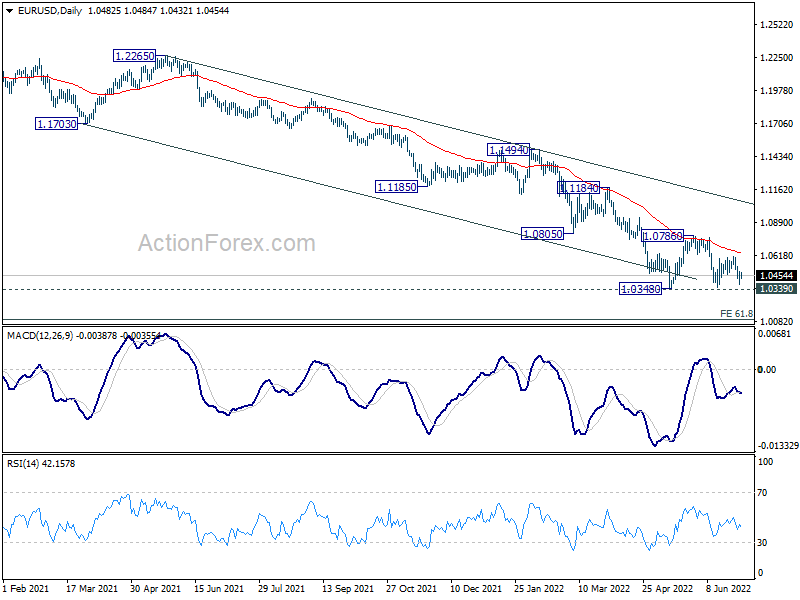
In the bigger picture, focus stays on 1.0339 long term support (2017 low). Decisive break there will resume whole down trend from 1.6039 (2008 high). Next target is 61.8% projection of 1.3993 to 1.0339 from 1.2348 at 1.0090. However, firm break of 1.0805 support turned resistance will delay this bearish case, and bring stronger rebound first.
GBP/USD Daily Outlook
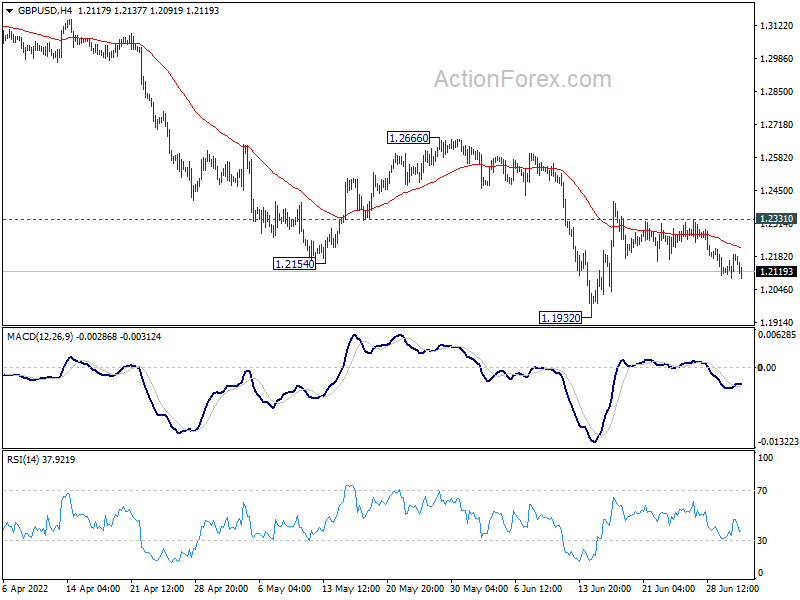
Daily Pivots: (S1) 1.2118; (P) 1.2153; (R1) 1.2215; More...
Range trading continues in GBP/USD and intraday bias remains neutral. Further fall is in favor as long as 1.2331 minor resistance holds. Firm break of 1.1932 will resume larger down trend from 1.4248. On the upside, above 1.2331 will resume the rebound from 1.1932 to 1.2666 resistance. Firm break there will indicate medium term bottoming.
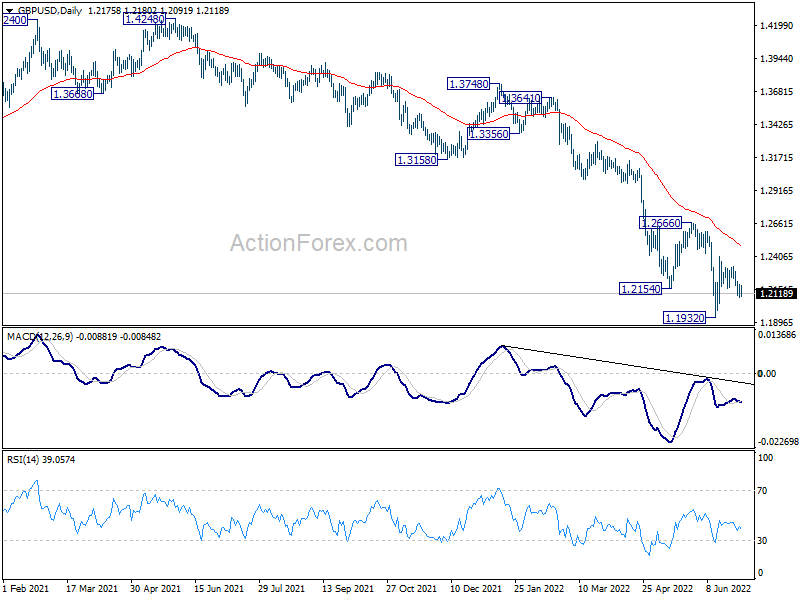
In the bigger picture, fall from 1.4248 (2018 high) could be a leg inside the pattern from 1.1409 (2020 low), or resuming the longer term down trend. Deeper decline is expected as long as 1.2666 resistance holds. Next target is 1.1409 low. However, firm break of 1.2666 will bring stronger rise back to 55 week EMA (now at 1.3140).
USD/JPY Daily Outlook
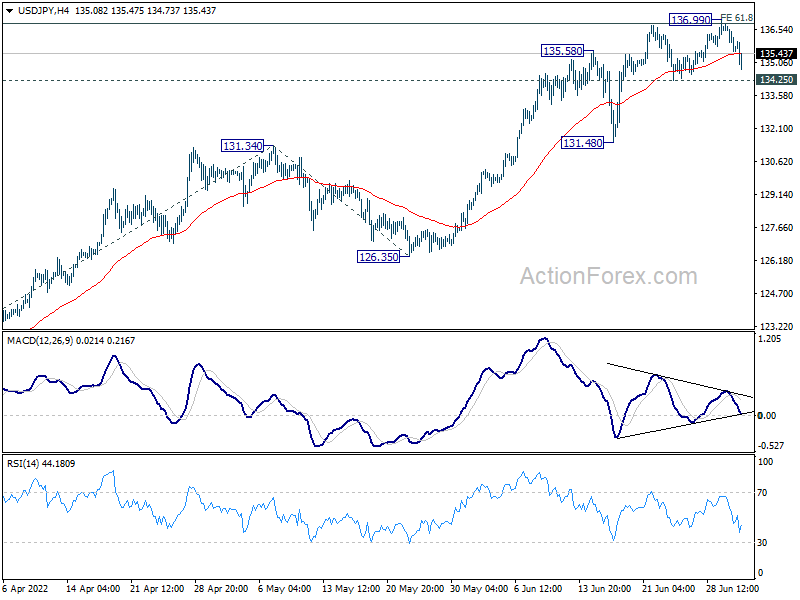
Daily Pivots: (S1) 135.24; (P) 136.03; (R1) 136.49; More...
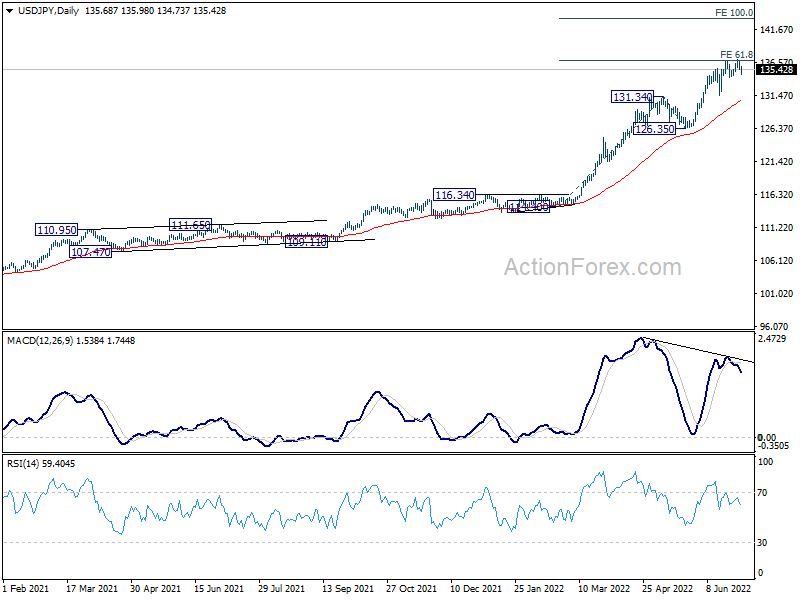
Intraday bias in USD/JPY stays neutral and further rise is still in favor with 134.25 minor support intact. On the upside, sustained trading above of 61.8% projection of 114.40 to 131.34 from 126.35 at 136.81 will extend larger up trend to 100% projection at 143.29. However, break of 134.25 will turn bias back to the downside for 131.48 support instead.
In the bigger picture, current rally is seen as part of the long term up trend from 75.56 (2011 low). Next target is 100% projection of 75.56 (2011 low) to 125.85 (2015 high) from 98.97 at 149.26, which is close to 147.68 (1998 high). This will remain the favored case as long as 126.35 support holds.
USD/CHF Daily Outlook
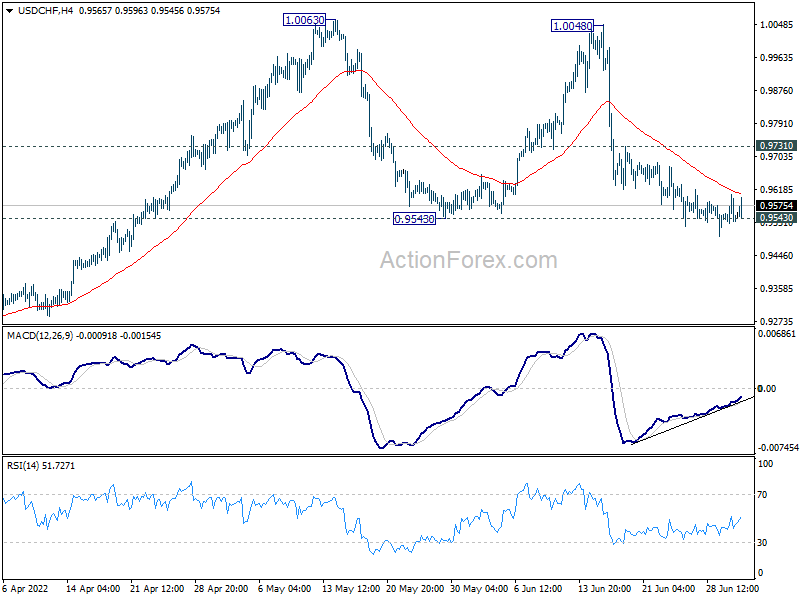
Daily Pivots: (S1) 0.9518; (P) 0.9561; (R1) 0.9593; More...
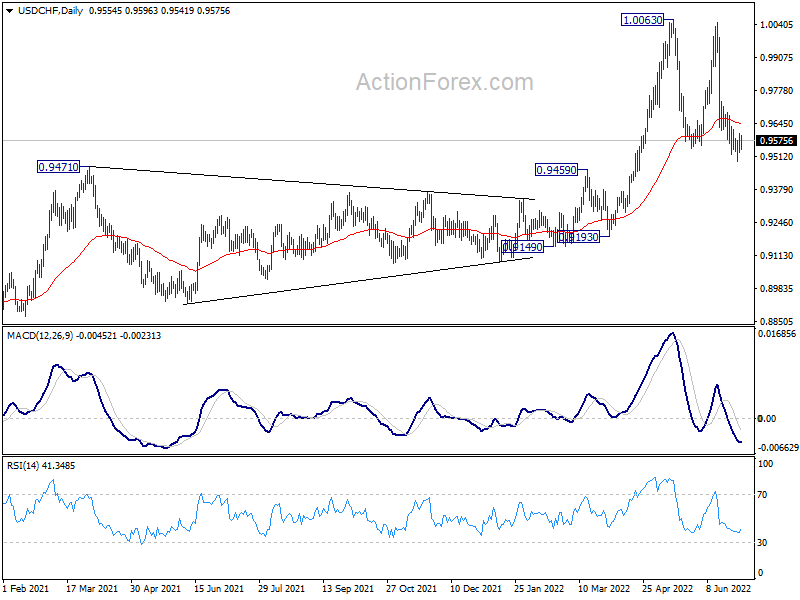
Intraday bias in USD/CHF stays neutral and outlook is unchanged. Fall from 1.0048 is still seen as the third leg of the consolidation pattern from 1.0063. Strong support should be seen around 0.9543 to bring rebound. On the upside, above 0.9731 minor resistance will turn bias back to the upside for retesting 1.0063 resistance. However, sustained break of 0.9543 will bring deeper fall back to 0.9459 resistance turned support.
In the bigger picture, down trend from 1.0342 (2016 high) should have completed with three waves down to 0.8756 (2021 low) already. Rise from 0.8756 is likely a medium term up trend of its own. Next target is 1.0237/0342 resistance zone. This will remain the favored case as long as 0.9471 resistance turned support holds. However, sustained break of 0.9471 will extend long term range trading with another falling leg.
AUD/USD Daily Report
Daily Pivots: (S1) 0.6866; (P) 0.6893; (R1) 0.6931; More...
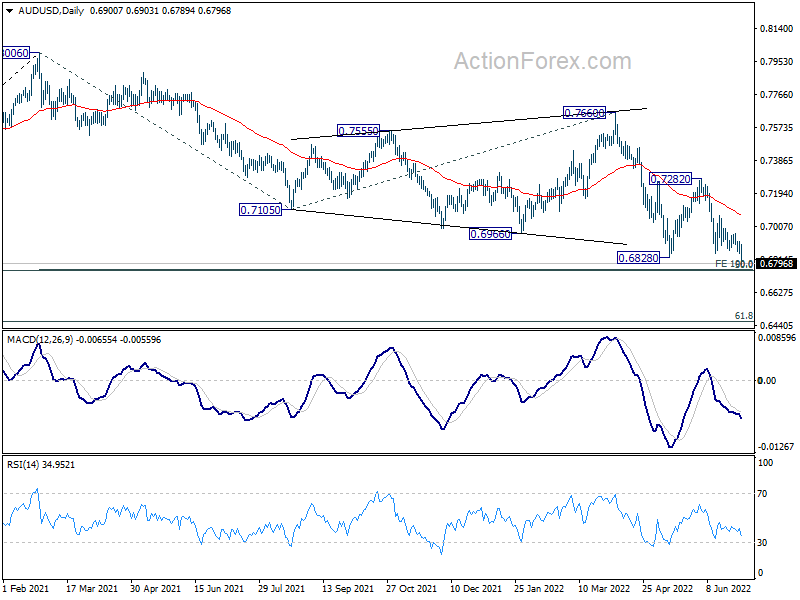
AUD/USD's down trend resumed by breaking through 0.6828 support. Intraday bias is now on the downside for 0.6756/60 cluster support. Strong support could be seen there to bring rebound. On the upside, above 0.6918 resistance will turn bias back to the upside. However, sustained break of 0.6756/60 will carry larger bearish implication and target 0.6461 fibonacci level next.
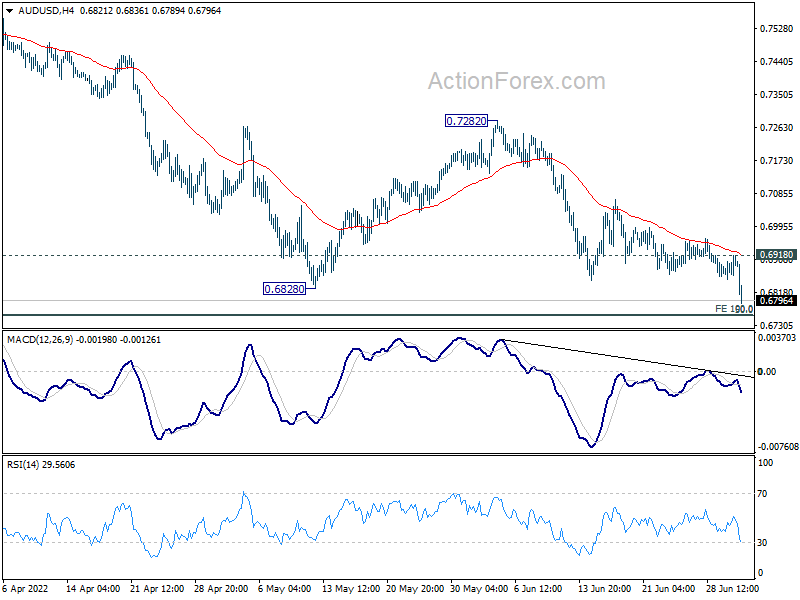
In the bigger picture, price actions from 0.8006 are seen as a corrective pattern to rise from 0.5506 (2020 low). Deeper fall could still be seen to 50% retracement of 0.5506 to 0.8006 at 0.6756. This coincides with 100% projection of 0.8006 to 0.7105 from 0.7660 at 0.6760. Strong support is expected from 0.6756/60 cluster to contain downside to complete the correction. However firm break of 0.6756/60 will raise the chance of bearish reversal and target 61.8% retracement at 0.6461.