Sample Category Title
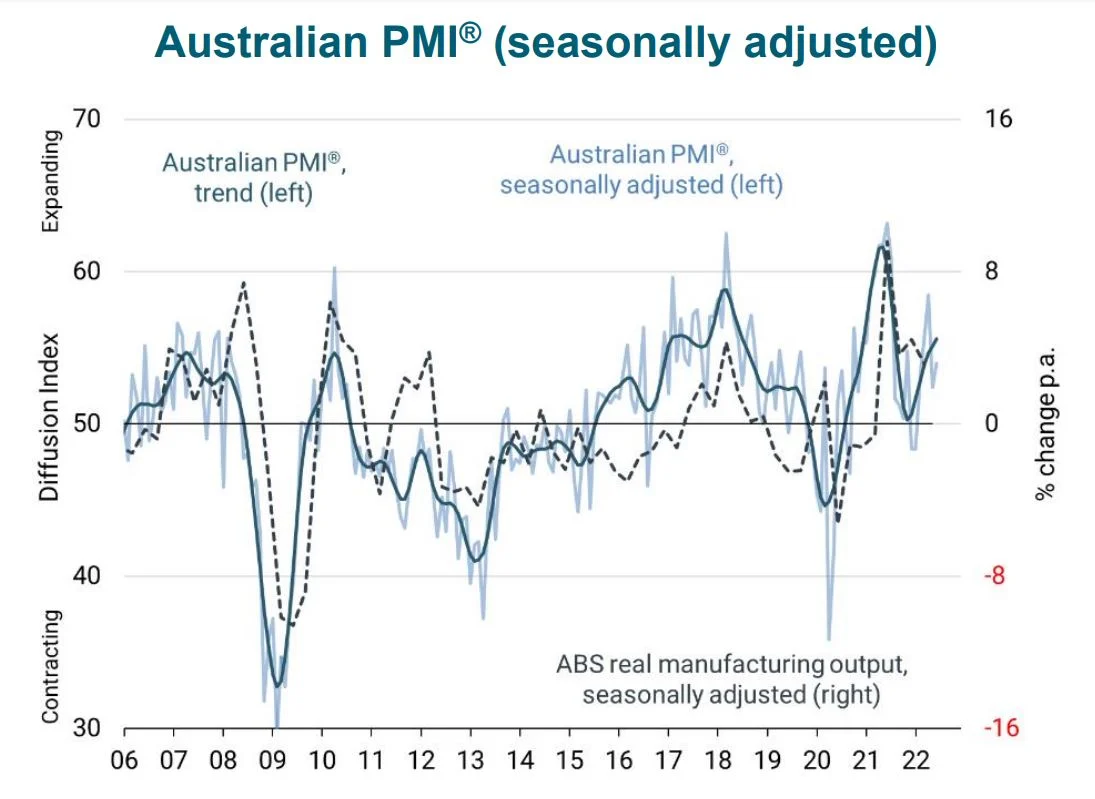
Australia AiG manufacturing rose to 54, exports jumped but domestic sales fell
Australia AiG Performance of Manufacturing rose 1.6 pts to 54.0 in June. Looking at some details, production rose 2.4 to 54.7. Employment rose 0.8 to 51.0. New orders rose 0.7 to 55.7. Exports jumped 10.1 to 53.0. Sales dropped -2.6 to 45.0. Input prices rose 2.1 to 89.3. Selling prices rose 2.1 to 67.8. Average wages dropped -5.5 to 69.3.
Innes Willox, Chief Executive of Ai Group said: "Although input price pressures continued to accumulate, Australia's manufacturing sector expanded again in June with solid increases in production and new orders and a slight lift in employment. While export sales were up, domestic sales fell reflecting the decline in consumer and business confidence in the face of concerns about inflation, interest rates and asset values. Selling prices were higher in June but by a smaller amount than input costs as less robust demand inhibited the ability of manufacturers to fully recover their higher costs in the market."
Cliff Notes: A Reversal of Fortunes
Key insights from the week that was.
Domestically, it was a quiet week. May’s retail sales and private credit data reflected the resilience of Australian consumers and businesses against cost-of-living pressures and the beginning of the RBA’s tightening cycle. Nominal retail sales lifted 0.9% (vs. market f/c: 0.3%), in part capturing inflation, but more so the strength of consumer demand, particularly for non-discretionary goods. Meanwhile, annual private credit growth hit a fresh record high of 9.0%, representing a likely cycle peak centred on strength in business lending. These positive updates support our central view for Australia’s growth outlook in 2022, particularly the concentration of growth in Q2 and Q3, led primarily by the Australian consumer.
Offshore, data was decidedly mixed, with outcomes from China constructive but those for the US and Europe of concern.
Most notable this week for China was the official PMI data. As expected, the manufacturing sector returned to expansion as the latest wave of COVID-zero restrictions were lifted in a staged manner. Within the detail, production jumped 3pts to its highest level since March 2021, while new orders moved above the 50 expansion/contraction level – a rare outcome since mid-2021. Employment in the sector is responding more slowly given COVID-19 and global uncertainties; that said, at June, the employment index was only marginally below its average of the past two years.
Ahead of this release, services were generally anticipated to take longer than manufacturing to rebound. However, the PMI data suggests the composition of the recovery could be the other way round, with the services PMI storming higher in June to 54.7 – its strongest read since May 2021. Importantly, the components of the services survey point to broad-based momentum across the sub-sectors and in employment as well as strength in new business.
Assessed in conjunction with available trade and investment data, the above outcomes point to weak but positive growth in Q2 followed by a strong rebound in activity through the second half, first in production and investment then consumption. As we have continued to argue in recent months, growth near authorities’ 5.5% growth ambition is still within reach; such an outturn would be a stark contrast to the market’s current expectation.
Elsewhere in the world, the focus has remained on policy makers and the outlook for interest rates. Through the first half of the week, the ECB’s Forum on Central Banking was held in Sintra. Of particular significance for markets was the policy panel featuring ECB President Lagarde, FOMC Chair Powell and BoE Governor Bailey. Unsurprisingly, getting inflation to trend quickly back towards target was the priority of all three central bank heads. But there was also a note of caution on growing risks to the activity outlook and a desire for the fight against inflation to not stall their economies or push them into recession.
It is interesting to note that the panel speakers and the market have the greatest confidence in the US economy’s ability to weather this period of tighter financial conditions and high inflation given the strength of their labour market. However, available partial data continues to point to material and growing risks of persistently weak US growth through both 2022 and 2023.
While the third update for Q1 US GDP saw only a very small downward revision in the headline print (from -1.5% to -1.6% annnualised), consumption was revised materially lower (from +3.1% to +1.8% annualised). This change and the net effect of other revisions saw growth in domestic final demand fall from above to below trend in the quarter, the third such outcome in a row.
With the fiscal support of 2020/21 used up, the savings rate having already fallen back near pre-pandemic levels, employment growth moderating, real incomes continuing to decline and consumer confidence at record lows, further weakness in consumption and related business investment seems highly probable. Indeed, following a downside surprise for personal consumption spending in May (and April’s material revision), the Atlanta Fed nowcast for Q2 GDP is now also negative at -1.0% annualised. If this forward indicator proves prescient, and the US used the technical definition of a recession instead of the NBER dating procedure, the US could already be considered as in recession while growth in Europe and the UK remains positive.
We see little value in trying to define whether and when a NBER-defined recession will be seen. Rather we are focused on assessing how large an output gap is likely to develop to the end of 2023 and the consequences for the economy beyond that point. Our current profile, to which there are clear downside risks, points to a further widening of the gap to the potential path circa 1.2ppts by the end of 2023. Such an outcome would likely result in the unemployment rate only increasing by around 1ppt and consumption being able to return to trend as rate cuts are delivered through late-2023 and 2024 (125bps to 2.125% on our forecast). To us, the concern for the US is what impact such a series of events would have on business investment into the medium-term and, against the efficiency and momentum of Asia, the implications for the US dollar.
Technical Outlook and Review
DXY:
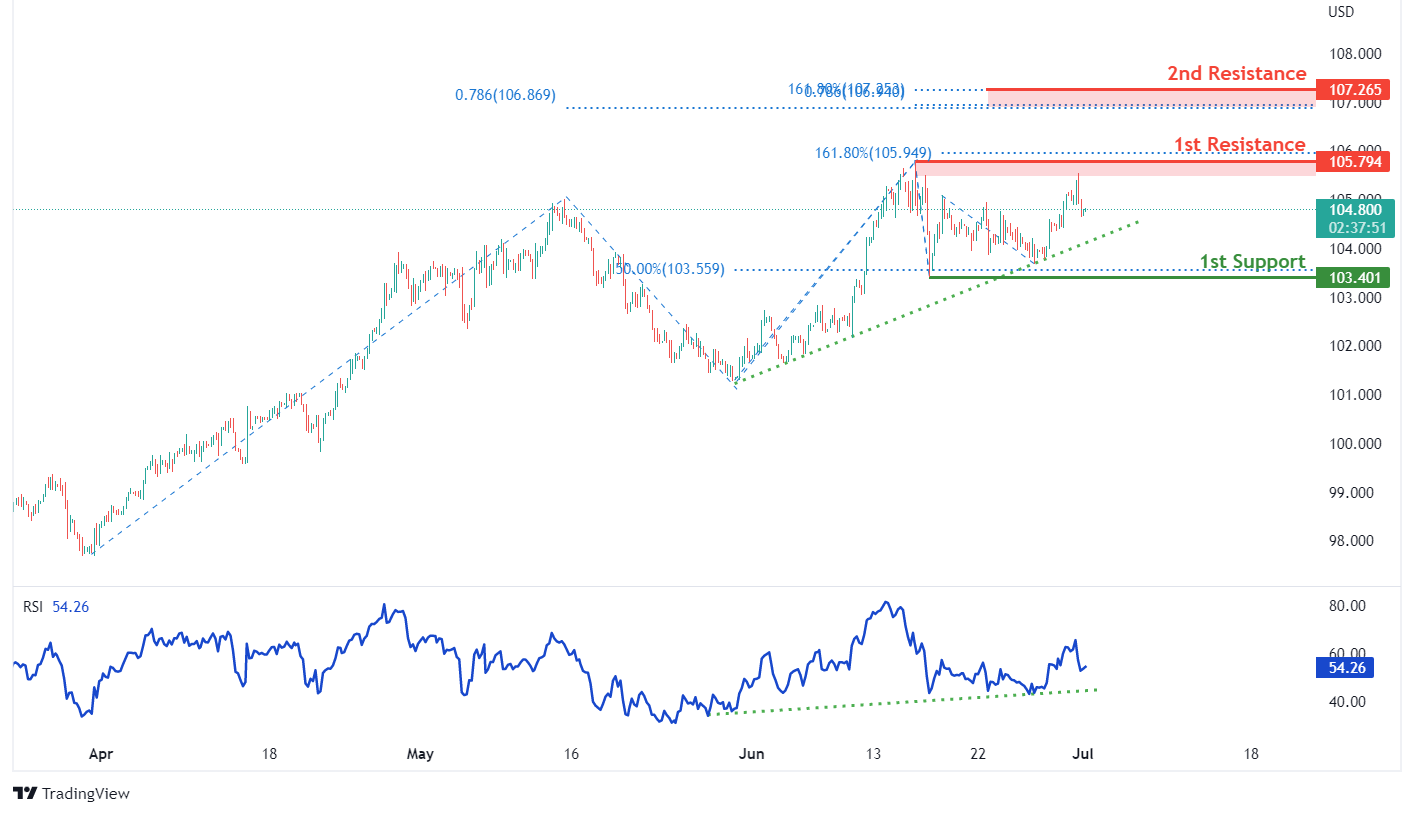
On the H4, with RSI moving along an ascending trendline and prices moving along the ascending trendline, we have a bullish bias that bullish momentum will carry prices to 1st resistance at 105.794 where the swing high resistance and 161.8% fibonacci extension are. Once we have upside confirmation, we would expect bullish momentum to carry prices to 2nd resistance at 107.265 in line with 161.8% fibonacci extension, 78.6% fibonacci projection and 78.6% fibonacci projection. Alternatively, price may drop to 1st support at 103.401 where the horizontal swing low support and 50% fibonacci retracement are.
Areas of consideration:
- H4 time frame, 1st resistance at 105.794
- H4 time frame, 1st support at 103.401
XAU/USD (GOLD):
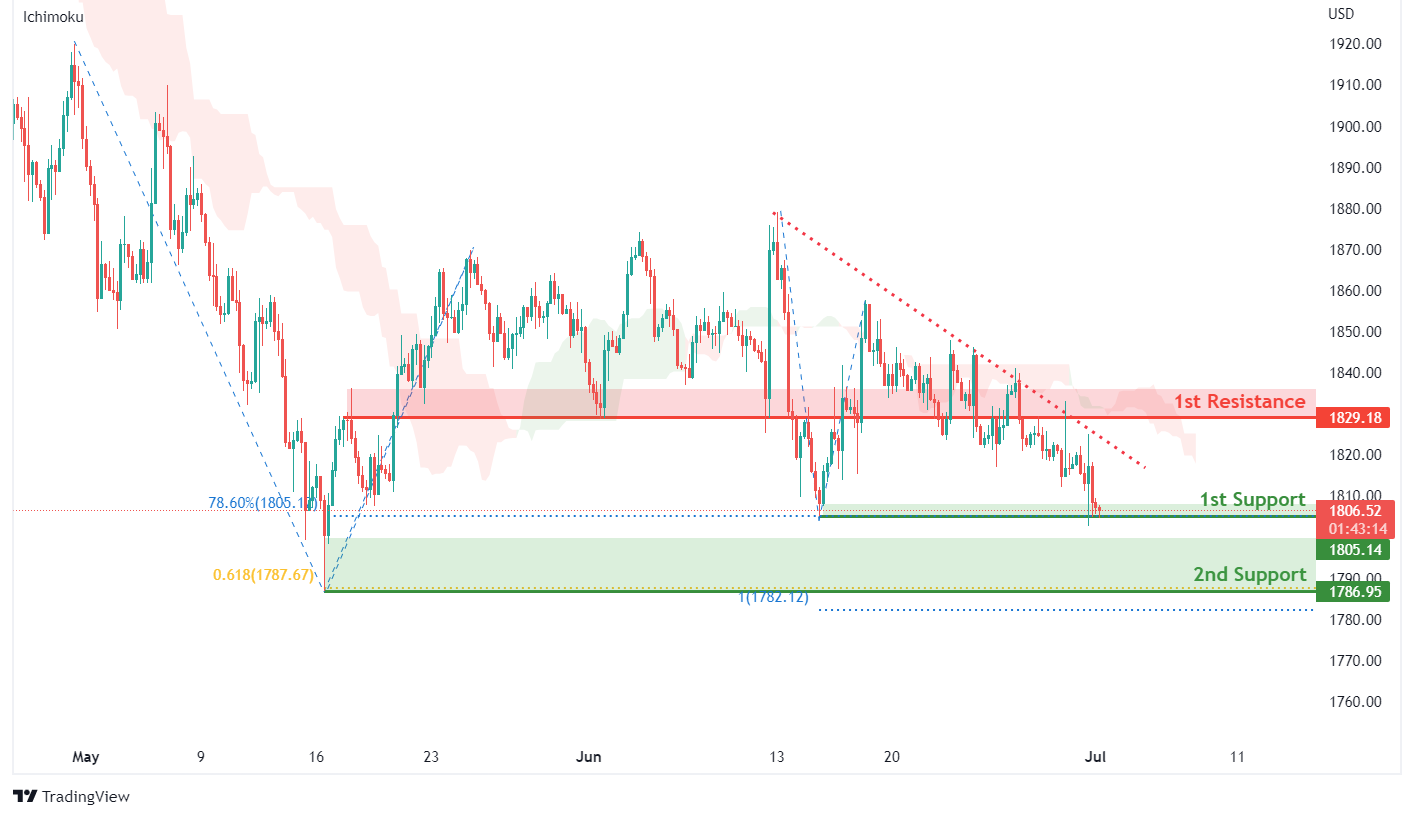
On the H4, with prices moving below the ichimoku indicator and along a descending trendline, we have a bearish bias that prices will drop to our 1st support at 1805.14 where the horizontal swing low support and 78.6% fibonacci retracement are. Once we have downside confirmation, we would expect bearish momentum to carry price to 2nd support at 1786.95 in line with swing low support, 61.8% fibonacci projection and 100% fibonacci projection. Alternatively, price could rise to our 1st resistance at 1829.18 in line with overlap resistance.
Areas of consideration:
- H4 time frame, 1st Resistance at 1829.18
- H4 time frame, 1st Support at 1805.14
GBP/USD:
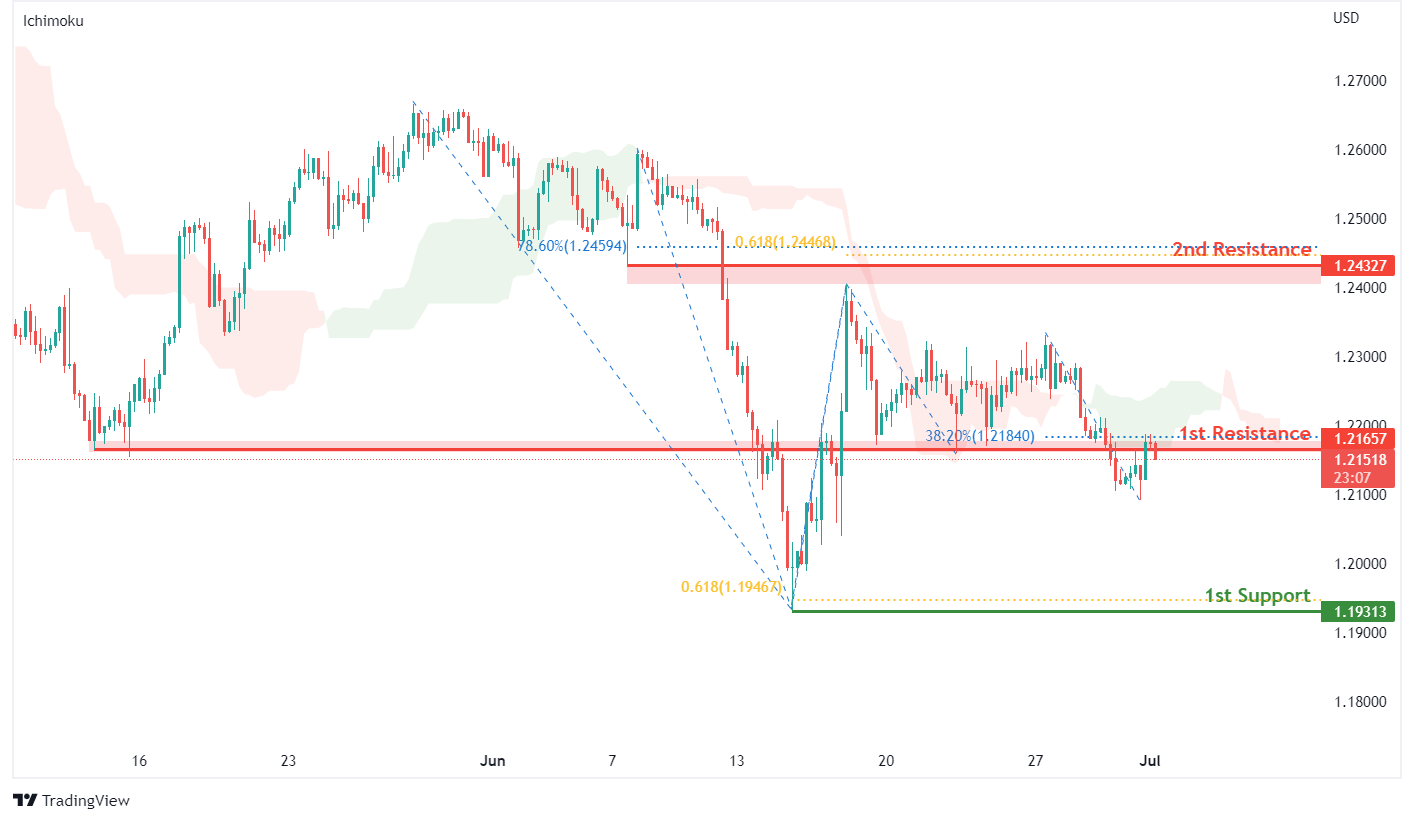
On the H4, with prices reversing off the ichimoku resistance, we have a bearish bias that price will drop from our 1st resistance at 1.21657 where the horizontal overlap resistance and 38.2% fibonacci retracement are to our 1st support at 1.19313 where the horizontal swing low support and 61.8% fibonacci projection are. Alternatively, price could rise above 1st resistance structure and head to 2nd resistance at 1.24327 in line with the 61.8% fibonacci projection, 78.6% fibonacci retracement and pullback resistance.
Areas of consideration:
- H4 1st resistance at 1.21657
- H4 1st support at 1.19313
USD/CHF:
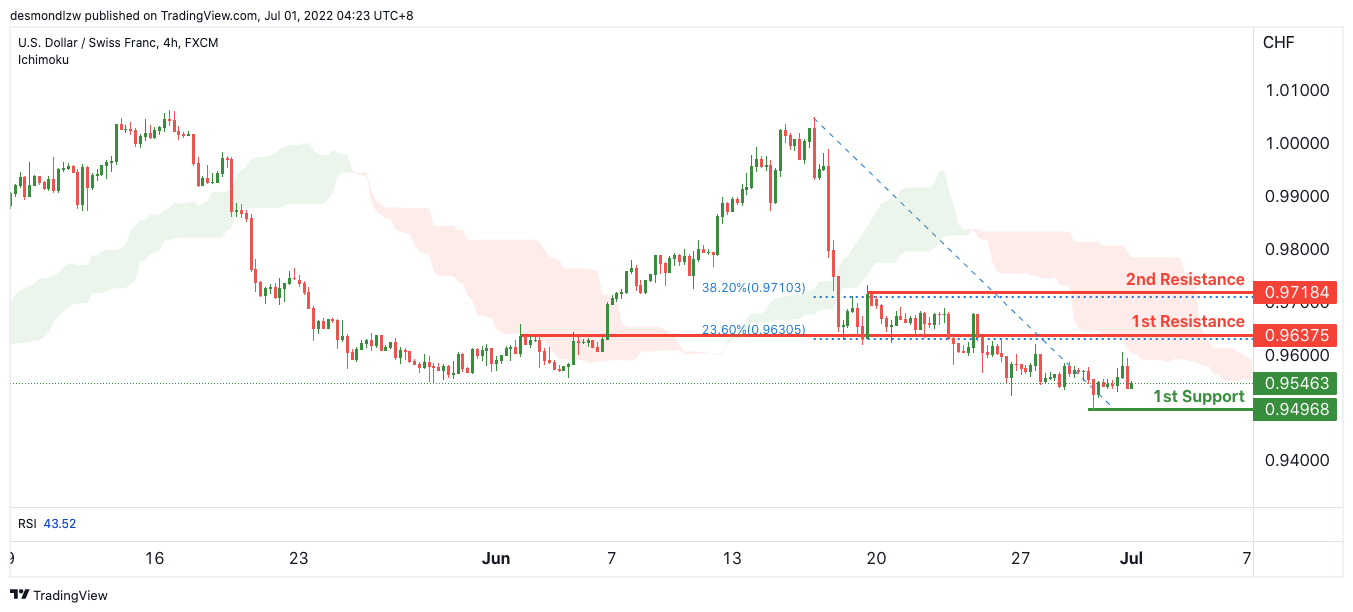
On the H4, with price moving below the ichimoku cloud , we have a bearish bias that price will continue to drop from the 1st resistance at 0.96375 in line with the horizontal pullback resistance and 23.6% Fibonacci retracement to the 1st support at 0.94968 in line with the horizontal swing low support. Alternatively, price may reverse off the 1st resistance and rise to the 2nd resistance where the 38.2% Fibonacci retracement and pullback resistance is.
Areas of consideration
- 1st support level at 0.94968
- 1st resistance level at 0.96375
EUR/USD :
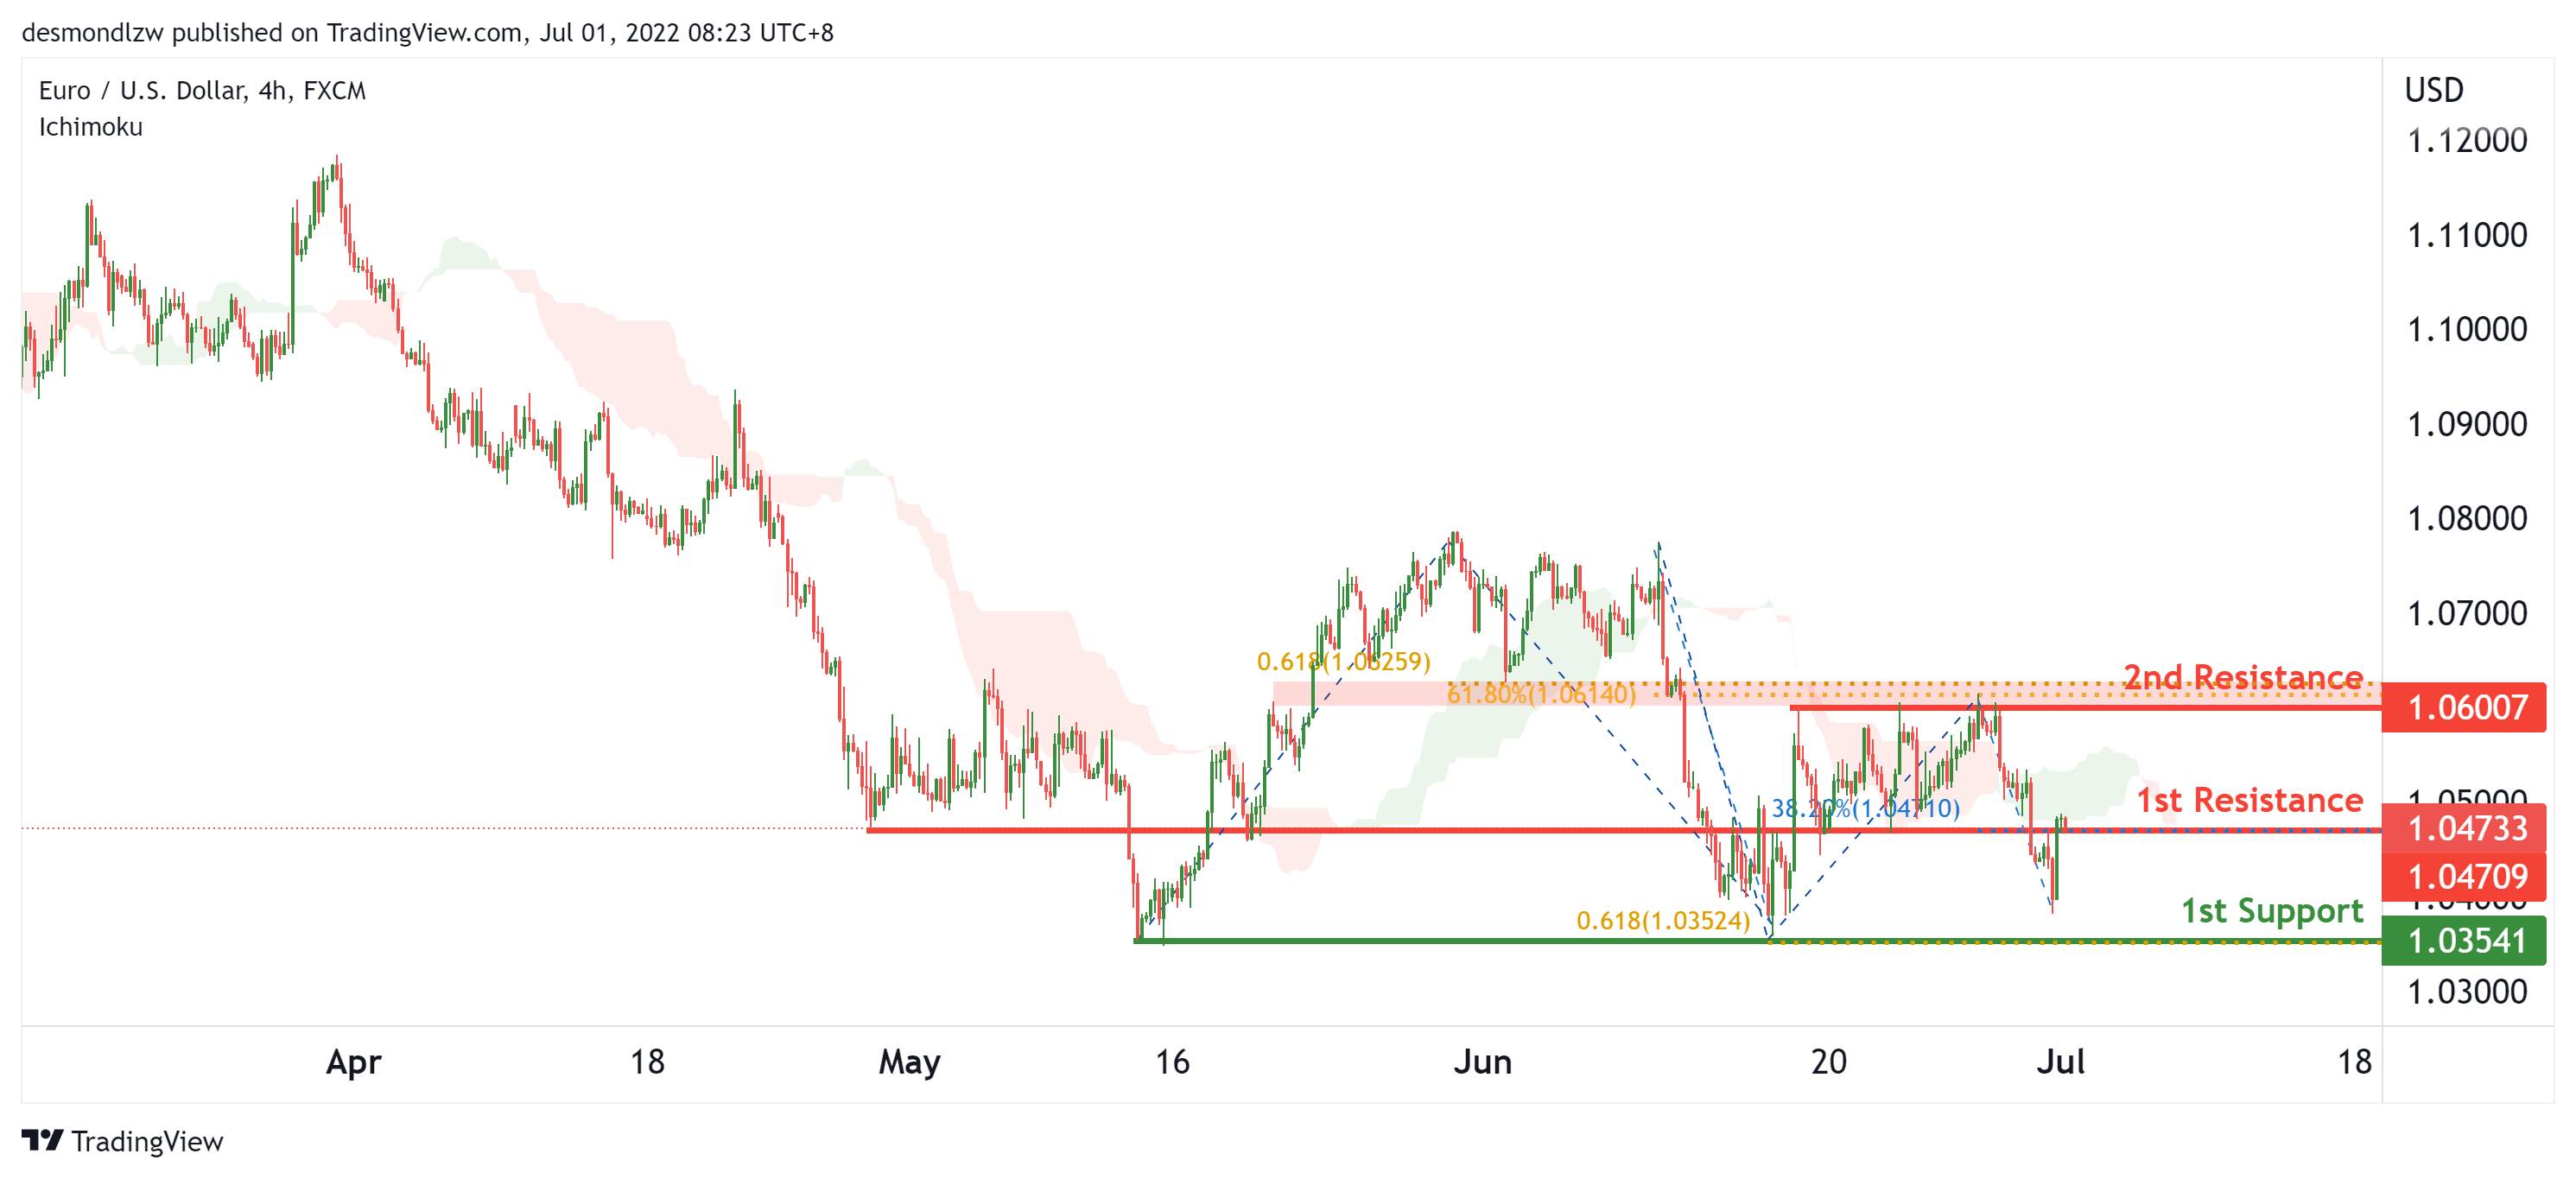
On the H4, with price moving below the ichimoku cloud, we have a bearish bias that price will drop from the 1st resistance at 1.04709 in line with the pullback resistance and 38.2% fibonacci retracement to the 1st support at 1.03541 in line with multiple swing lows and the 61.8% fibonacci projection. Alternatively, price may break resistance an rise to the 2nd resistance at 1.06007 in line with the swing high and 61.8% fibonacci projection and 61.8% fibonacci retracement.
Areas of consideration :
- H4 1st resistance at 1.04709
- H4 1st support at 1.03541
USD/JPY:
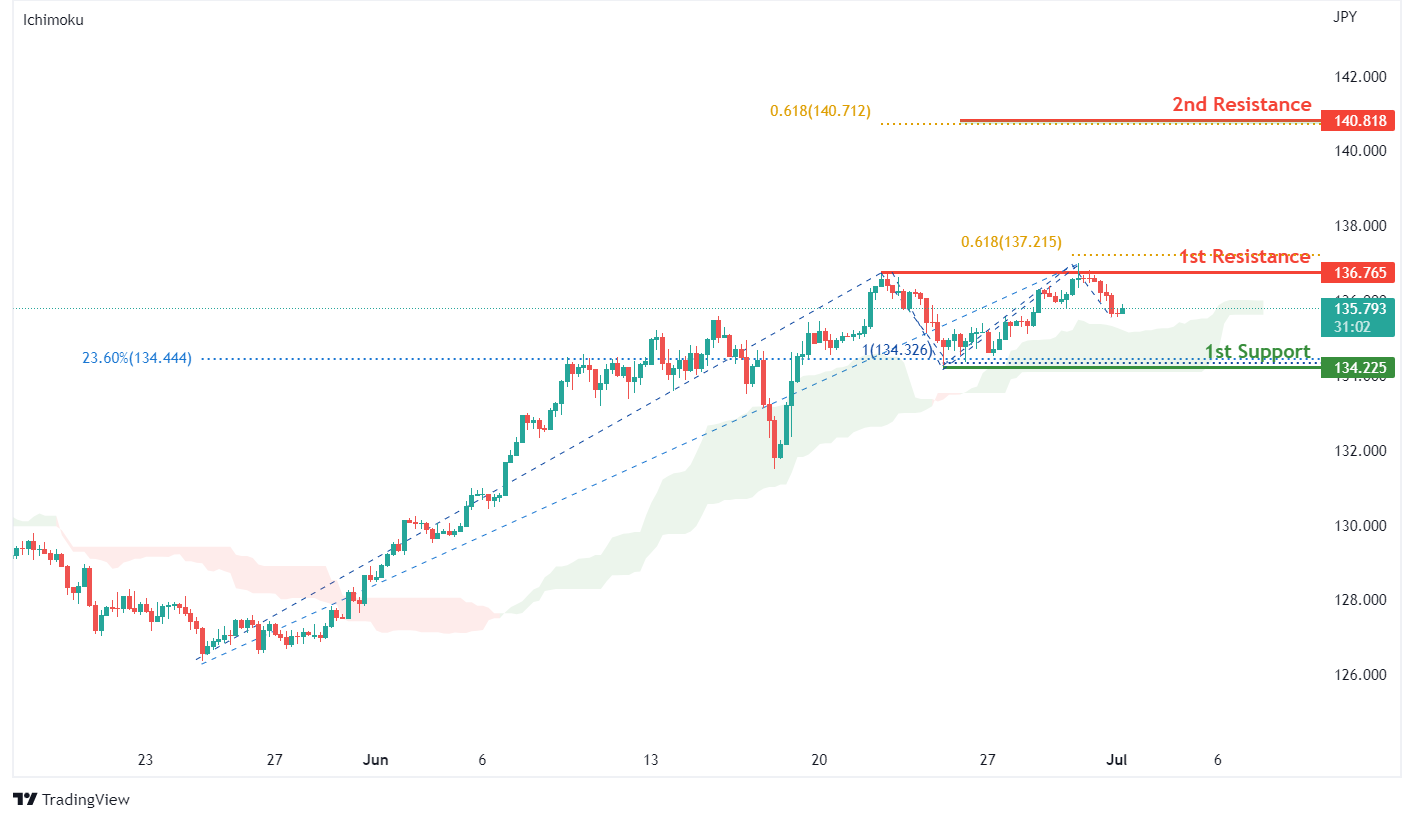
On the H4, with price moving above the ichimoku indicator, we have a bullish bias that price will rise to our 1st resistance at 136.765 where the swing high resistance and 61.8% fibonacci projection are. Once there is upside confirmation, we would expect bullish momentum to carry price to our 2nd resistance at 140.818 where the 61.8% fibonacci projection is . Alternatively, price may drop to 1st support at 134.225 in line with the swing low support, 100% fibonacci projection and 23.6% fibonacci retracement.
Areas of consideration:
- H4 time frame, 1st resistance at 136.765
- H4 time frame, 1st support at 134.225
AUD/USD:
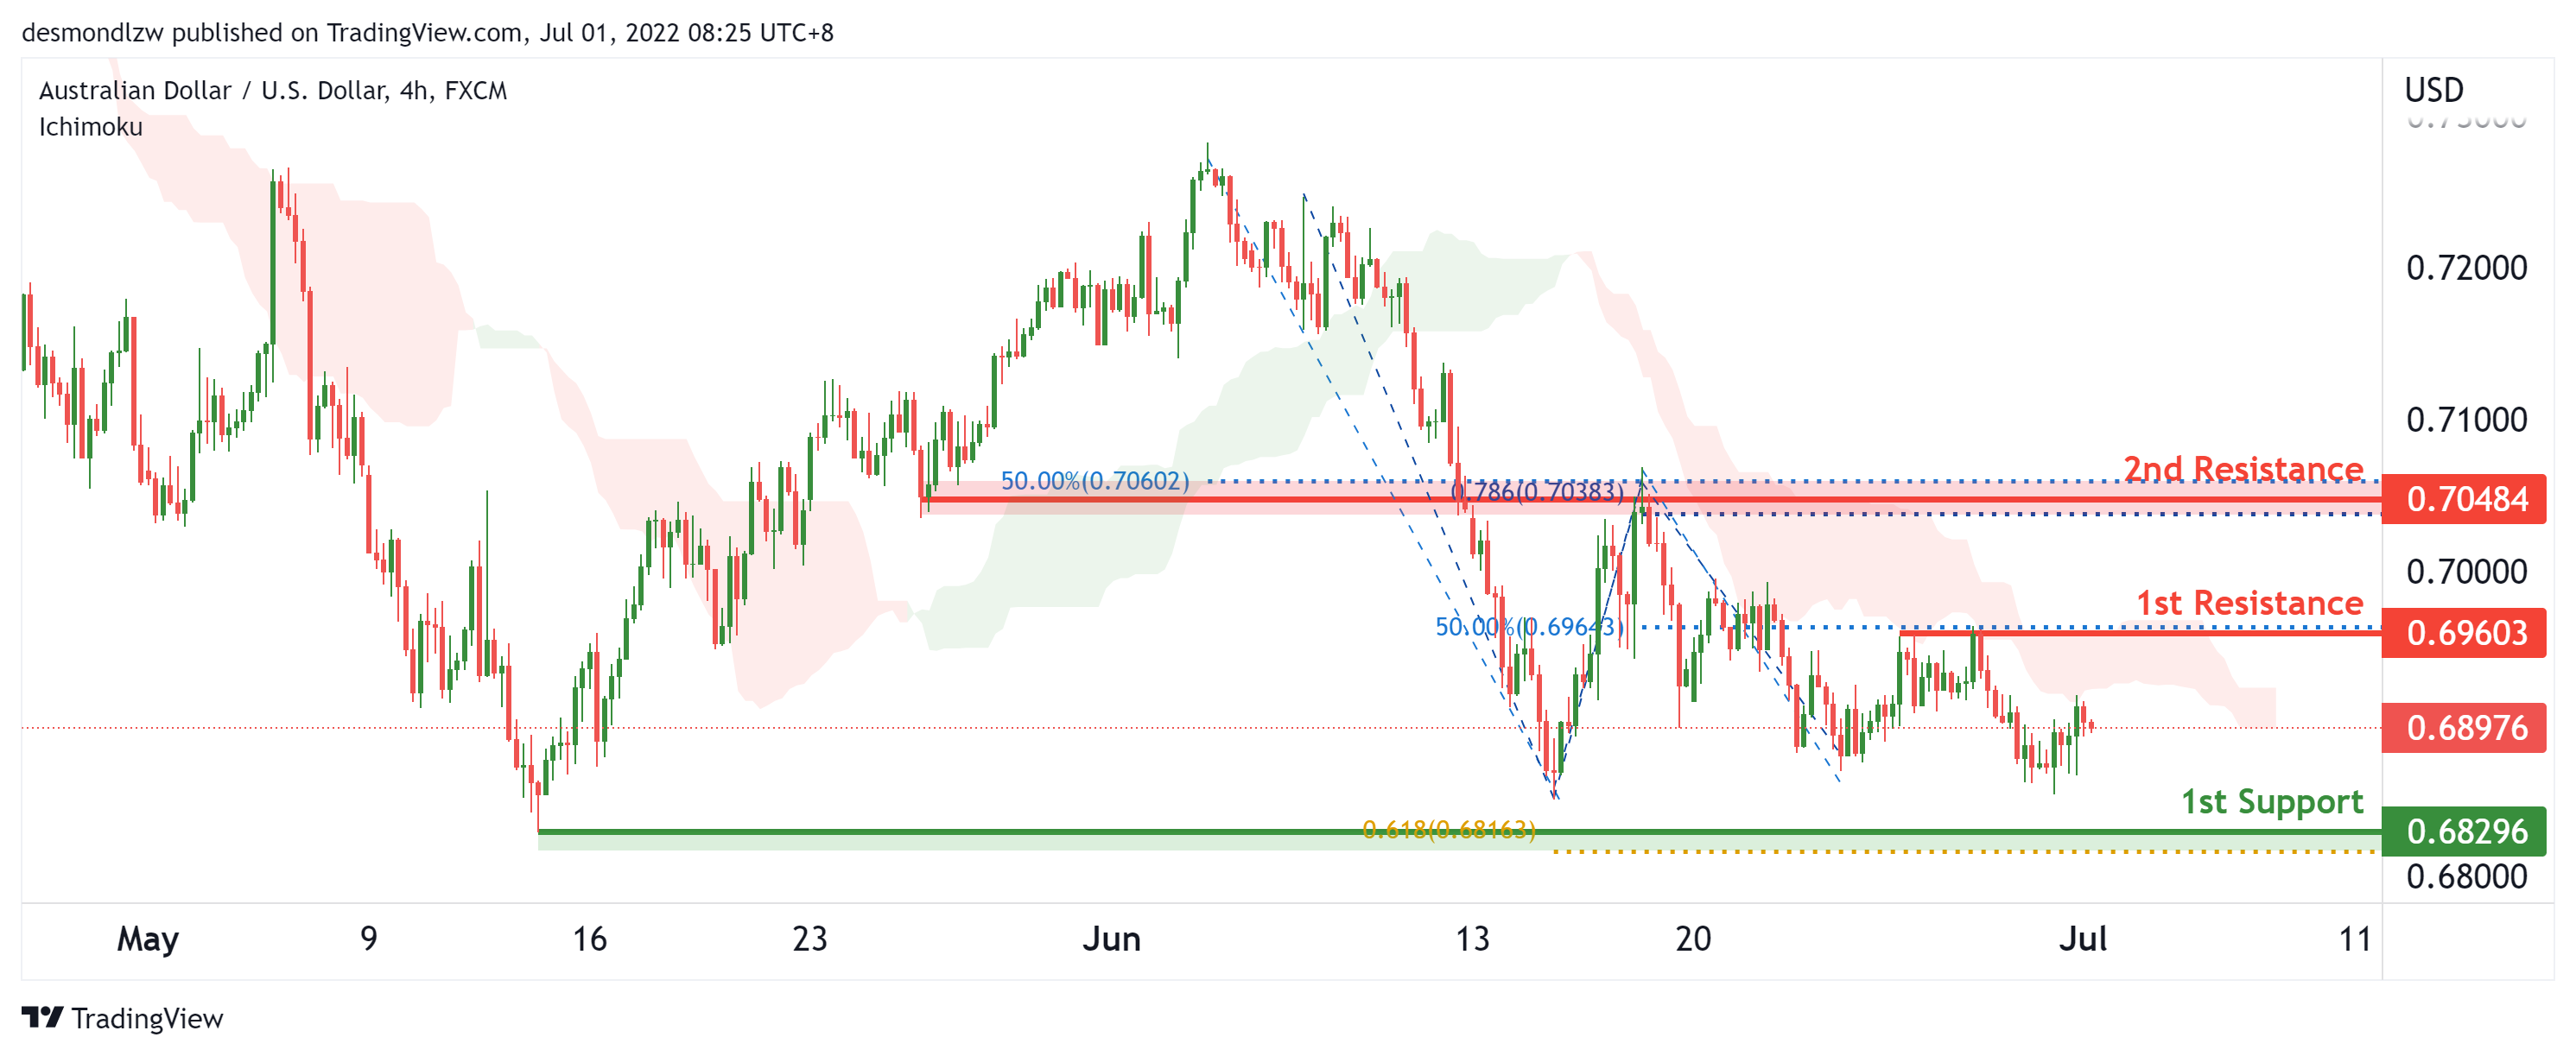
On the H4, with price moving below the ichimoku cloud , we have a bearish bias that price will continue to drop from the 1st resistance at 0.69303 in line with the 50% fibonacci retracement to the 1st support at 0.68296 in line with the horizontal swing low and 61.8% Fibonacci projection .Alternatively, price may reverse off the 1st resistance and rise to the 2nd resistance at 0.70484 in line with the overlap resistance, 78.6% Fibonacci projection and 50% Fibonacci retracement .
Areas of consideration
- H4 1st resistance at 0.68296
- H4 1st support at 0.69303
NZD/USD:
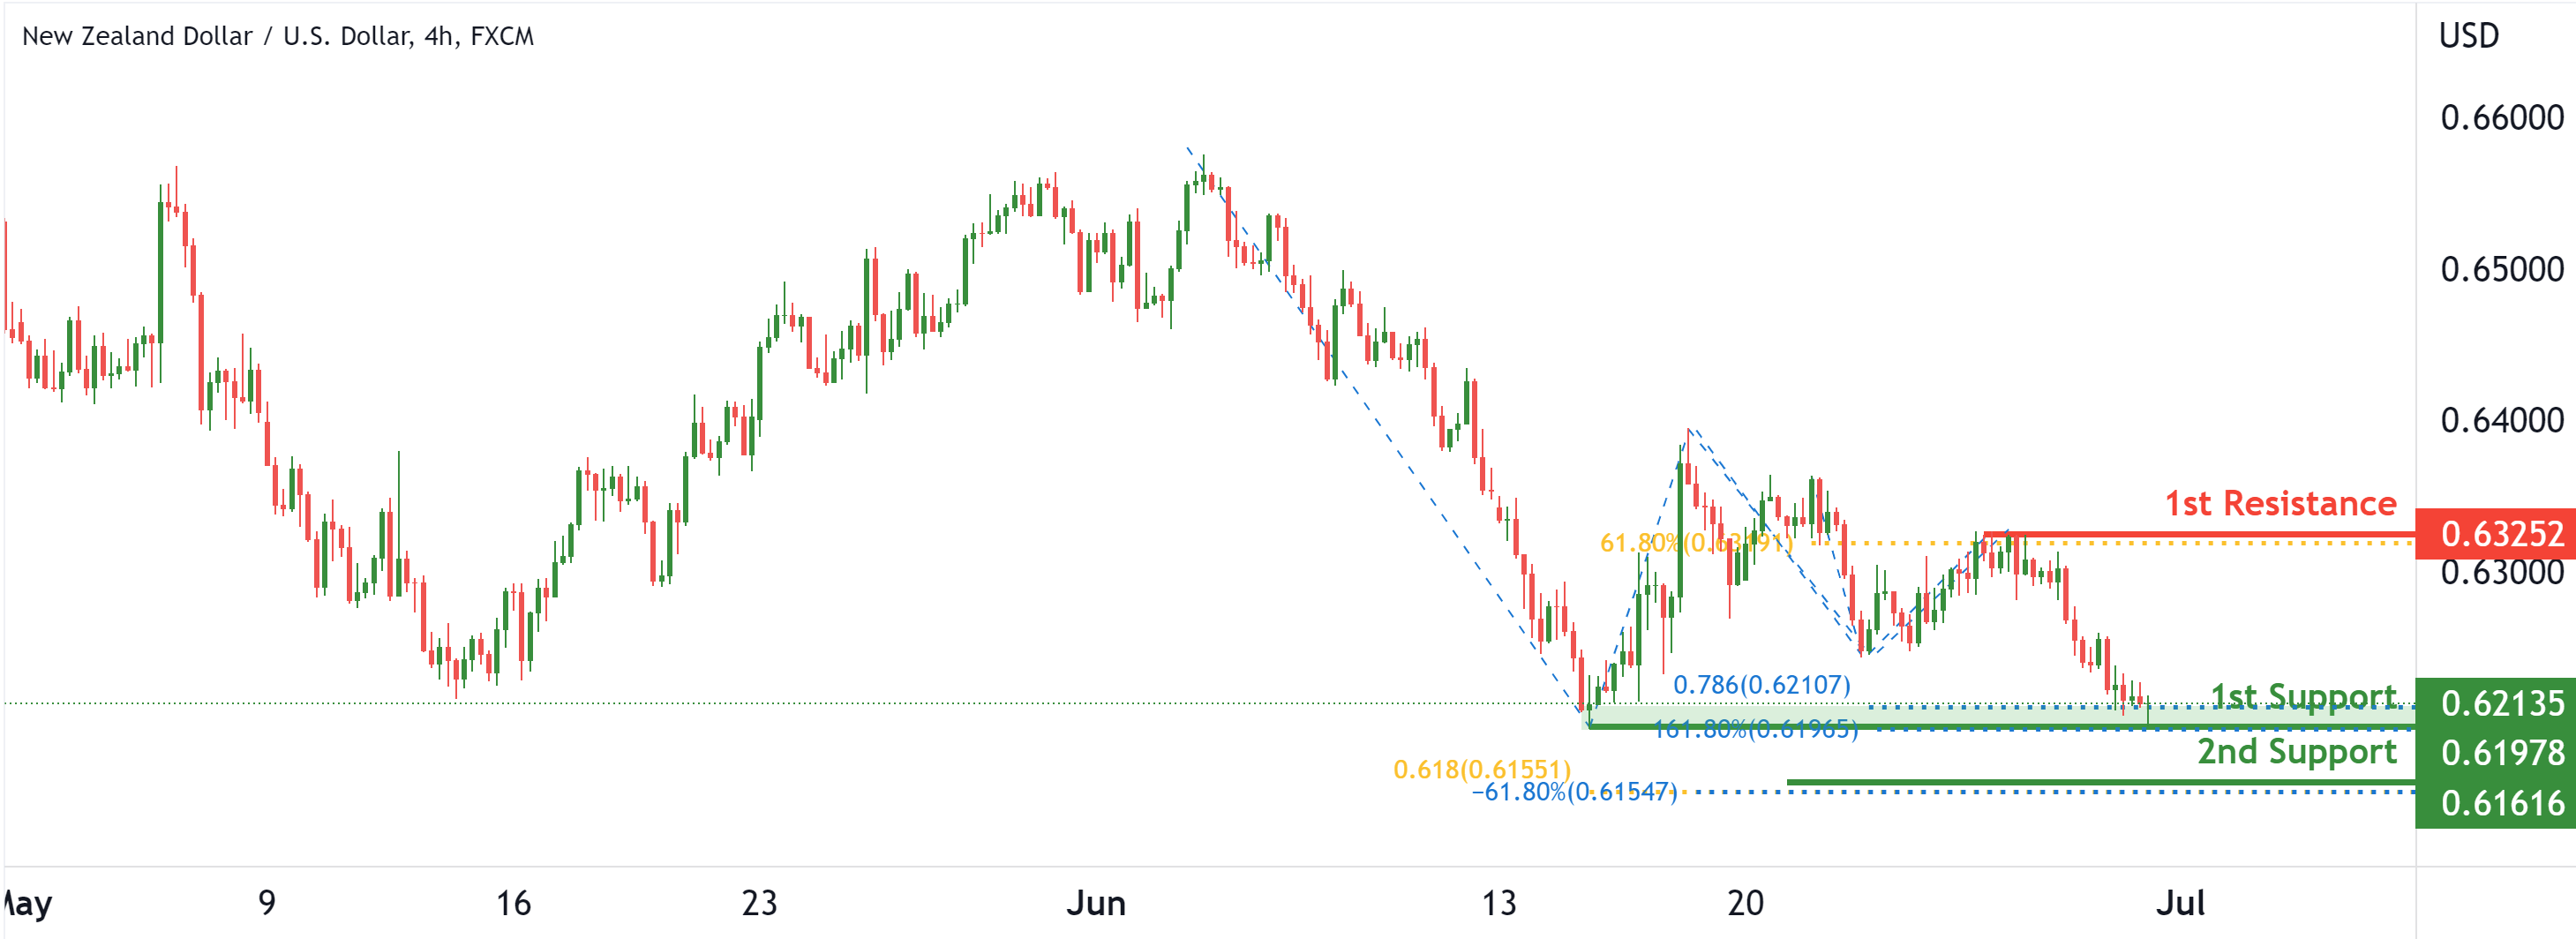
On the H4, with price bouncing off the confluence area at the 1st support, we have a bullish bias that price will rise from the 1st support at 0.61978 at the multiple swing lows in line with the 161.8% fibonacci extension and 78.6% fibonacci projection to the 1st resistance at 0.63252 in line with the swing high and 61.8% fibonacci retracement. Alternatively, price may break the support structure at 1st support and drop to the 2nd support at 0.61616 in line with the -61.8% fibonacci expansion and 61.8% fibonacci projection.
Areas of consideration:
- H4 time frame, 1st support at 0.61978
- H4 time frame, 1st resistance at 0.63252
USD/CAD:
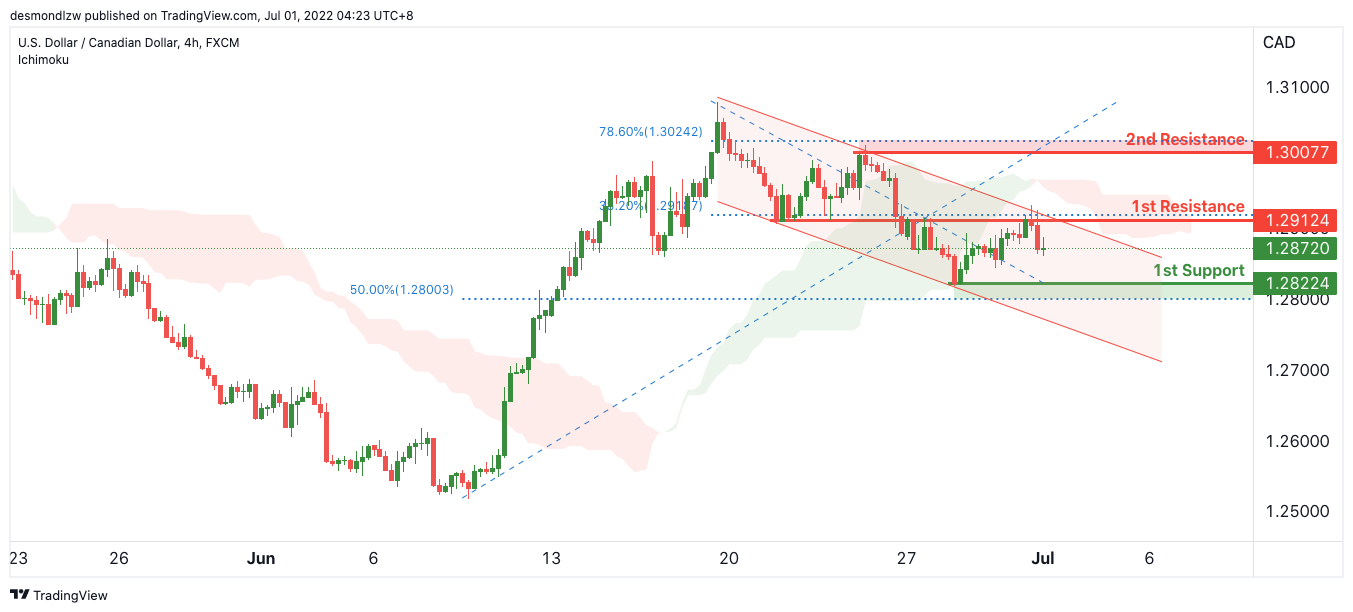
On the H4, with price recent break of the ichimoku cloud , we have a bearish bias that price will continue to drop from the 1st resistance at 1.29124 in line with the horizontal pullback resistance and 38.2% Fibonacci retracement to the 1st support at 1.28224 in line with the 50% Fibonacci retracement and horizontal swing low support. Alternatively, price may reverse off the 1st resistance and rise to the 2nd resistance at 1.30077 where the 78.6% Fibonacci retracement and horizontal swing high resistance is.
Areas of consideration:
- H4 time frame, 1st resistance at 1.29124
- H4 time frame, 1st support at 1.28224
OIL:
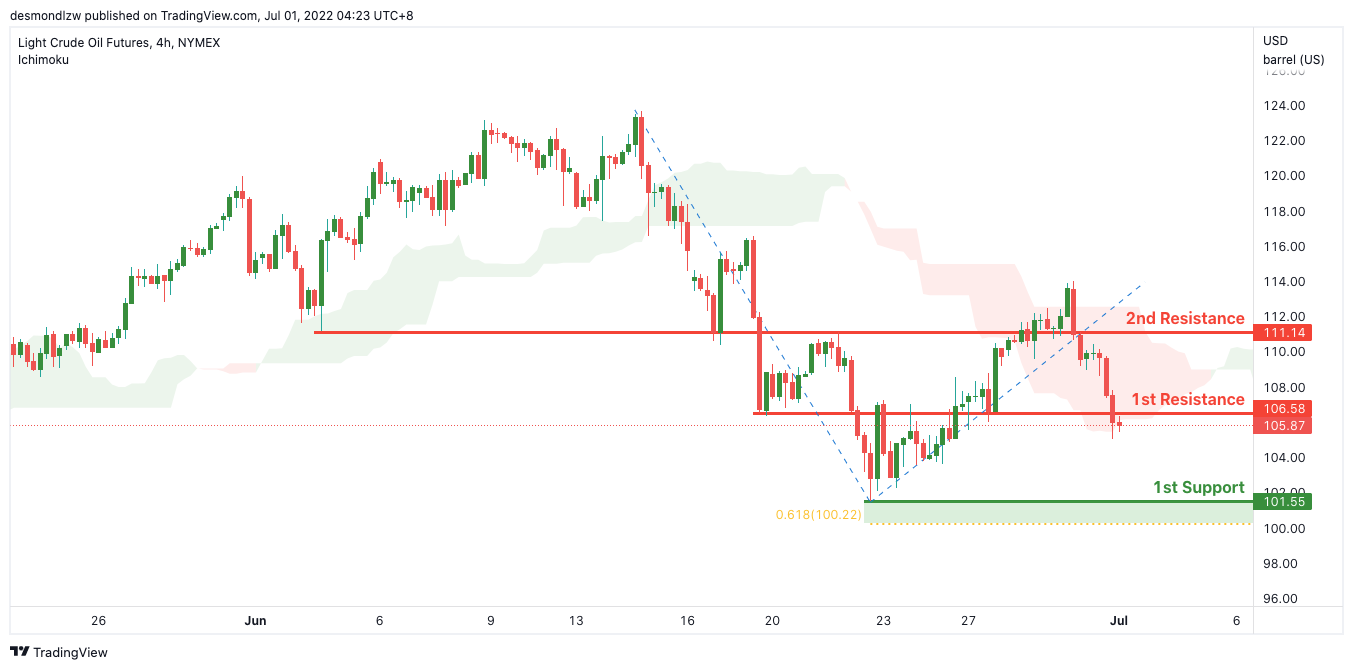
On the H4, with price expected to break the ichimoku cloud , we have a bearish bias that price will continue to drop from the 1st resistance at 106.58 in line with the horizontal pullback resistance to the 1st support at 101.55 in line with the 61.8% Fibonacci projection and horizontal swing low support. Alternatively, price may reverse off the 1st resistance and rise to the 2nd resistance at 111.14 where the horizontal pullback resistance is.
Areas of consideration:
- H4 time frame, 1st resistance of 106.58
- H4 time frame, 1st support of 101.55
Dow Jones Industrial Average:
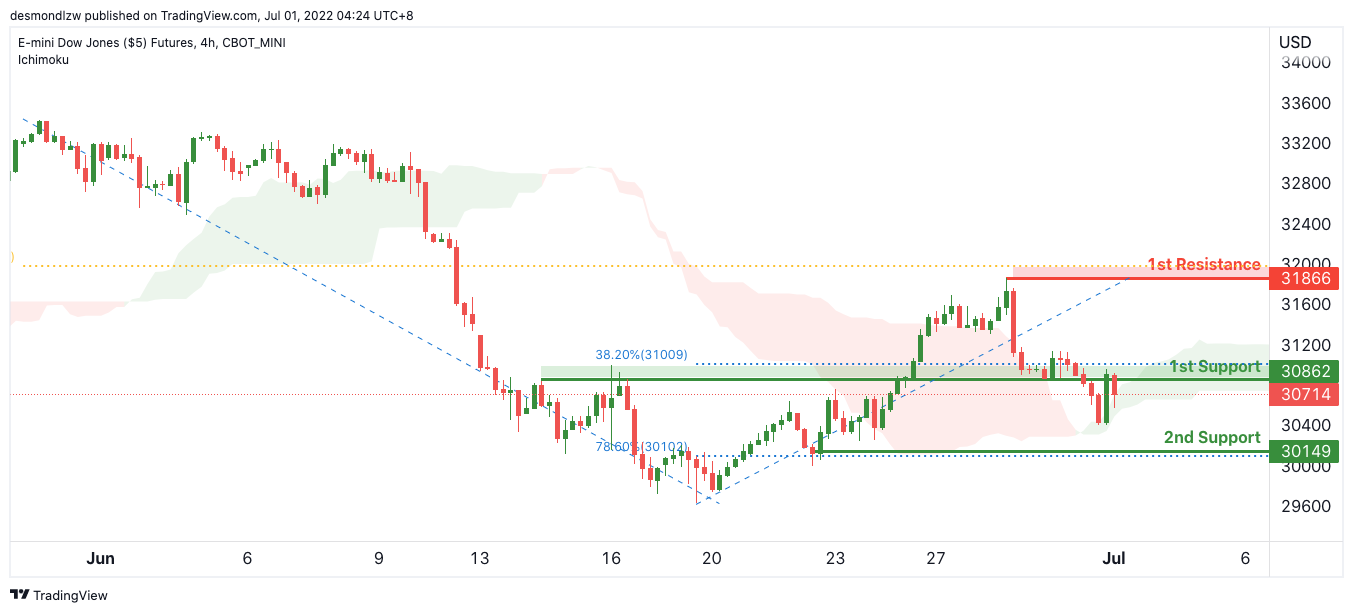
On the H4, with price moving along an ascending channel and ichimoku cloud, we have a bullish bias that price will rise from our 1st support at 30862 where the horizontal pullback support and 38.2% Fibonacci retracement are to our 1st resistance at 31866 in line with the horizontal swing high resistance and 61.8% fibonacci retracement. Alternatively, price may break 1st support and head for 2nd support at 30149 where the horizontal swing low support and 78.6% fibonacci retracement are. Take note we are waiting for the break of the 1st resistance to confirm the bullish move.
Areas of consideration:
- H4 time frame, 1st resistance of 31866
- H4 time frame, 1st support of 30862
EUR/USD Barely Clinging Above 1.04
- EUR/USD on course to end June down by 2.6%
- Price continues to hover over major support, but for how long
June Proved Bad for EUR/USD
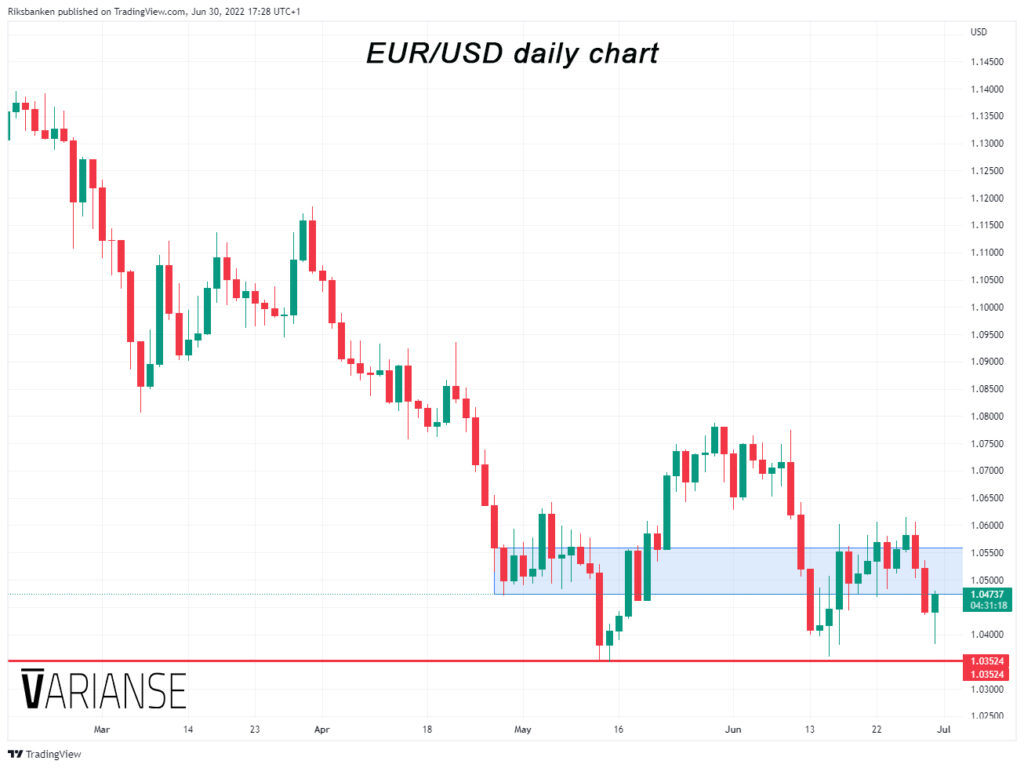
June didn’t work out to be a great month for EUR/USD. At the time of writing, the single currency looked on course to end the month down by 2.62% against the US dollar. May’s gains in hindsight look more like a cadaveric spasm than a serious promise of retracement or reversal of EUR/USD’s monumental fall this year. Twice in June, the pair has lunged uncomfortably close to the 1.0354 region, that once broken, would inevitably open the gates to parity. They follow two outright tests in May, preceded by similar tests in December 2016 and January 2017.
Strong Support a Wolf in Sheep's Clothes?
Conventional wisdom says the more an area acts as support and resistance, the more market significance it gains. For EUR/USD, that may prove more of a hinderance than help, should price experience a sustained break below those levels. Inevitably, some traders will read this as a potential near triple bottom in EUR/USD and they could be right. Despite all the forecasts of EUR/USD at parity, it still seems table to keep its head above water. That said, the more price hugs that critical support level, the more potential buyers should approach with bit of caution.
Plenty of Reasons to Trade Cautiously
Equally, the sort of price congestion that has evolved over 1.047 to 1.056 range in recent month adds to calls for restraint. Rather than support a quick rejection of the 1.0354 region, buyers and sellers are showing some agreement that valuation should be close to that level. That is in sharp contrast to the quick rejection that happened in December 2016 and January 2017, which ultimately led to a sustained uptrend. Technical continue to marry with the fundamental narrative. The Fed is gung-ho on raising interest rates, whilst the ECB is still uncertain about its intentions after July.
NZDUSD Wave Analysis
- NZDUSD reversed from the support level 0.6200
- Likely to rise to resistance level 0.6300
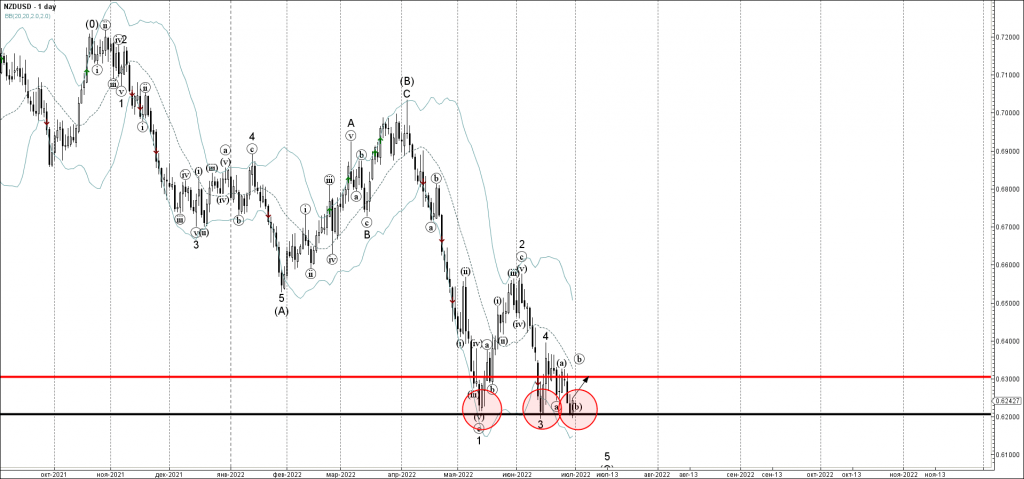
NZDUSD today reversed up from the key support level 0.6200 (which stopped the previous waves 3 and 1, as can be seen below).
The upward reversal from the support level 0.6200 started the active minor corrective wave (b).
Given the strengthening USD outflows, NZDUSD can be expected to rise further toward the next resistance level 0.6300.
EURCHF Wave Analysis
- EURCHF reversed from support level 0.9980
- Likely to rise to resistance level 1.0100
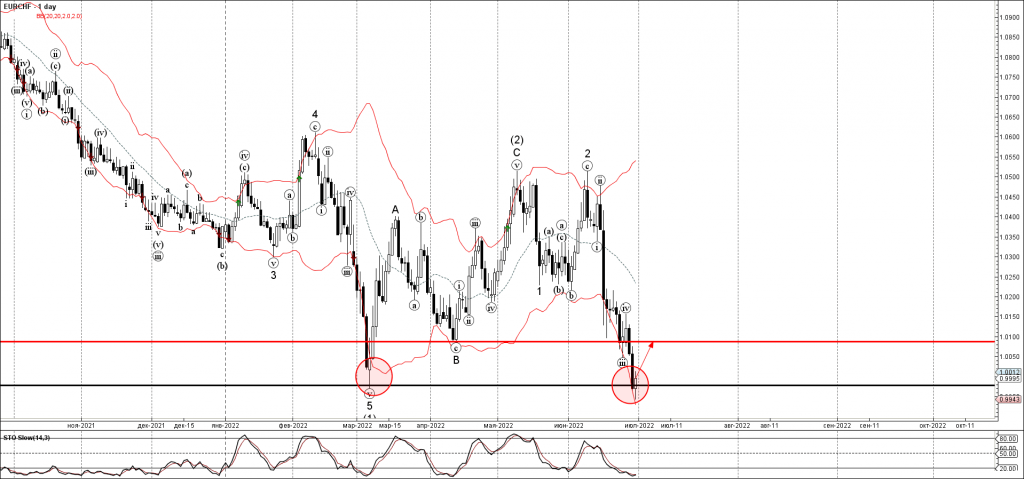
EURCHF currency pair recently reversed up from the multi-month support level 0.9980 (previous monthly low from March), intersecting with the lower daily Bollinger Band.
The upward reversal from the support level 0.9980 stopped the earlier impulse waves (v) and (3).
Given the strength of the support level 0.9980 and the oversold daily Stochastic, EURCHF can be expected to rise further toward the next resistance level 1.0100.
USDJPY Wave Analysis
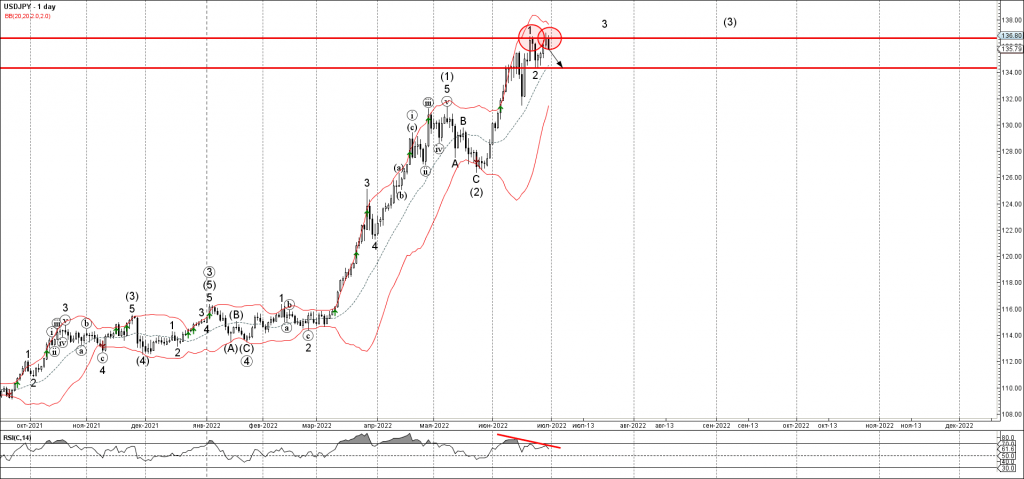
- USDJPY reversed from resistance level 136.60
- Likely to fall to support level 134.00
USDJPY continues to fall after the earlier downward reversal from the resistance level 136.60 (top of the previous impulse wave 1 from the middle of this month).
The downward reversal from the resistance level 136.60 stopped the earlier impulse waves 3 and (3).
Given the strength of the resistance level 136.60 and the bearish divergence on the daily RSI, USDJPY can be expected to fall further toward the next support level 134.00 (low of the previous correction 2).
Eco Data 7/1/22
[php_everywhere instance="1"]
New Zealand Dollar Near 2-year Low
The New Zealand dollar is steady on Thursday. Earlier in the day, NZD/USD fell below the 0.62 line before recovering, coming within a whisker of 0.6996, its lowest level since May 2020.
NZ Business Confidence sags
It was another rough outing for New Zealand ANZ Business Confidence, which fell in June to -62.6, down from -55.6 in May. This not only marked a 12th straight decline but also was a near-record low. There’s no sugar-coating the increasing pessimism that businesses are experiencing about the economic outlook. Domestic demand is holding up well, but businesses continue to report being severely hampered by supply-side disruptions and cost pressures. This is consistent with inflation pressures which remain broad-based and intense.
We’ll get a look at ANZ Consumer Confidence on Friday. Last week, Westpac Consumer Confidence fell sharply to 78.7 in Q1, down from 92.1 in Q4 2021 and I don’t expect the ANZ release to be the bearer of good news. Consumers have been hammered by the cost of living crisis, as food and petrol prices have soared. The pressure on households has been exacerbated by the Reserve Bank of New Zealand continuing to raise interest rates, with more hikes on the way. The rise in mortgage rates has left households with less disposable income, with many seeing a drop in their assets as home prices have fallen.
If the ANZ consumer confidence release confirms that consumer confidence is heading south, this could translate into lower consumer spending, which would be bad news for the New Zealand economy. It could have a significant effect on the Reserve Bank’s policy. If consumer demand sinks, the central bank may have room to ease its rate policy. The RBNZ has been tightening aggressively and the cash rate, which is currently at 2%, is expected to rise to 3% by the end of August and possibly to 4% in 12 months’ time.
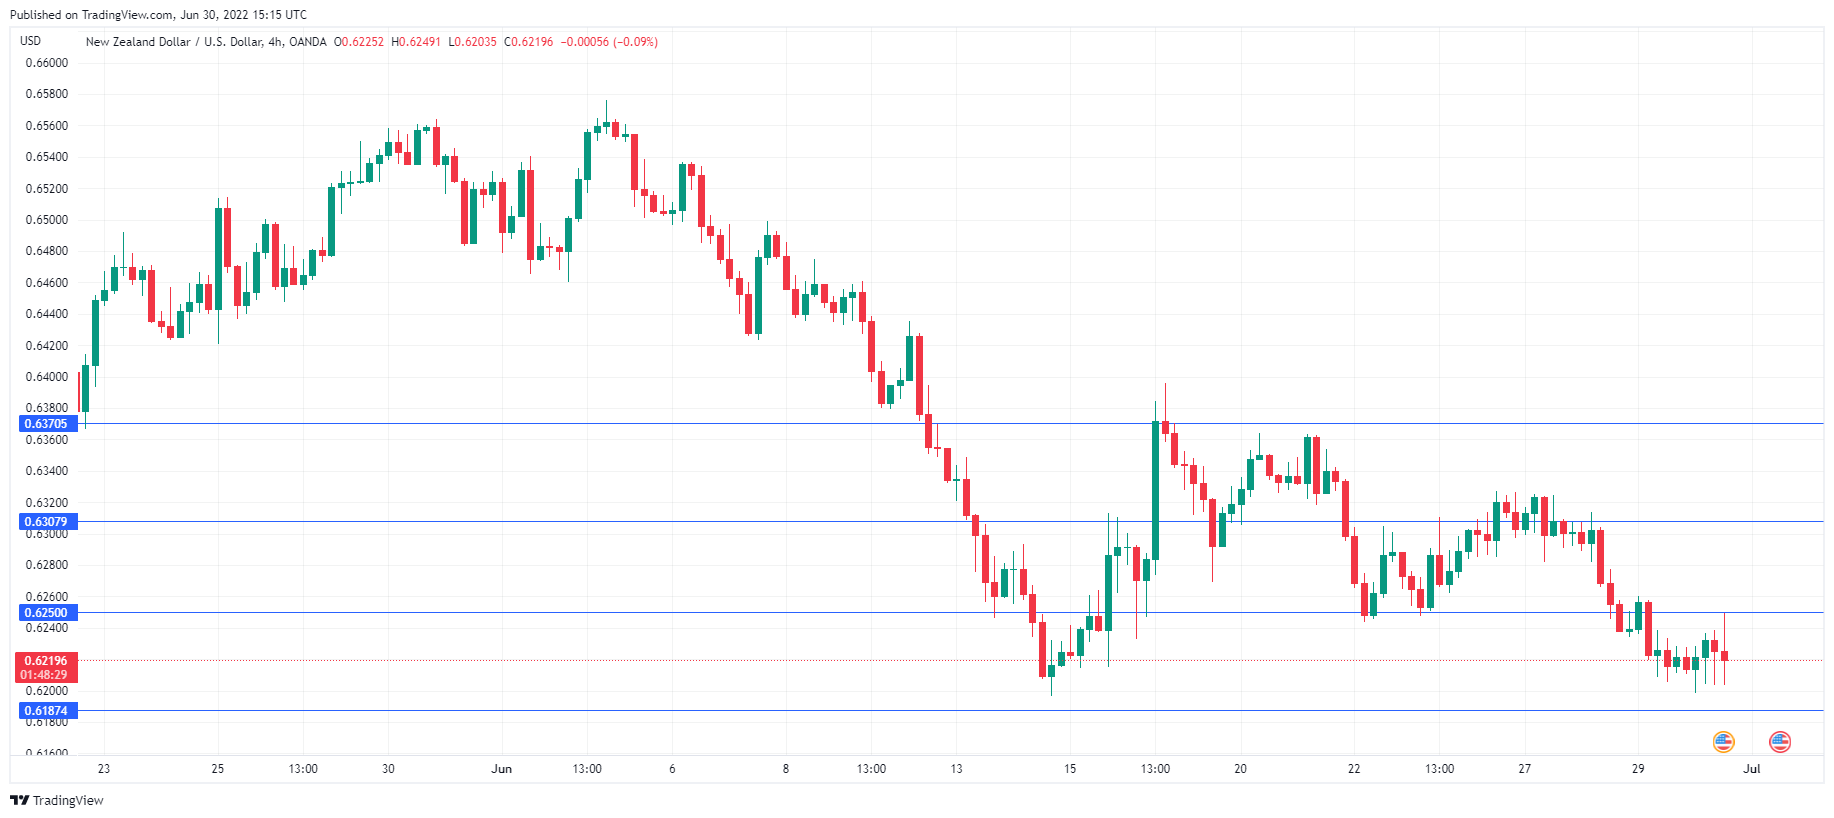
NZD/USD Technical
- NZD/USD faces resistance at 0.6307 and 0.6370
- There is support at 0.6250 and 0.6187
WTI Oil Futures Falter But Still Supported
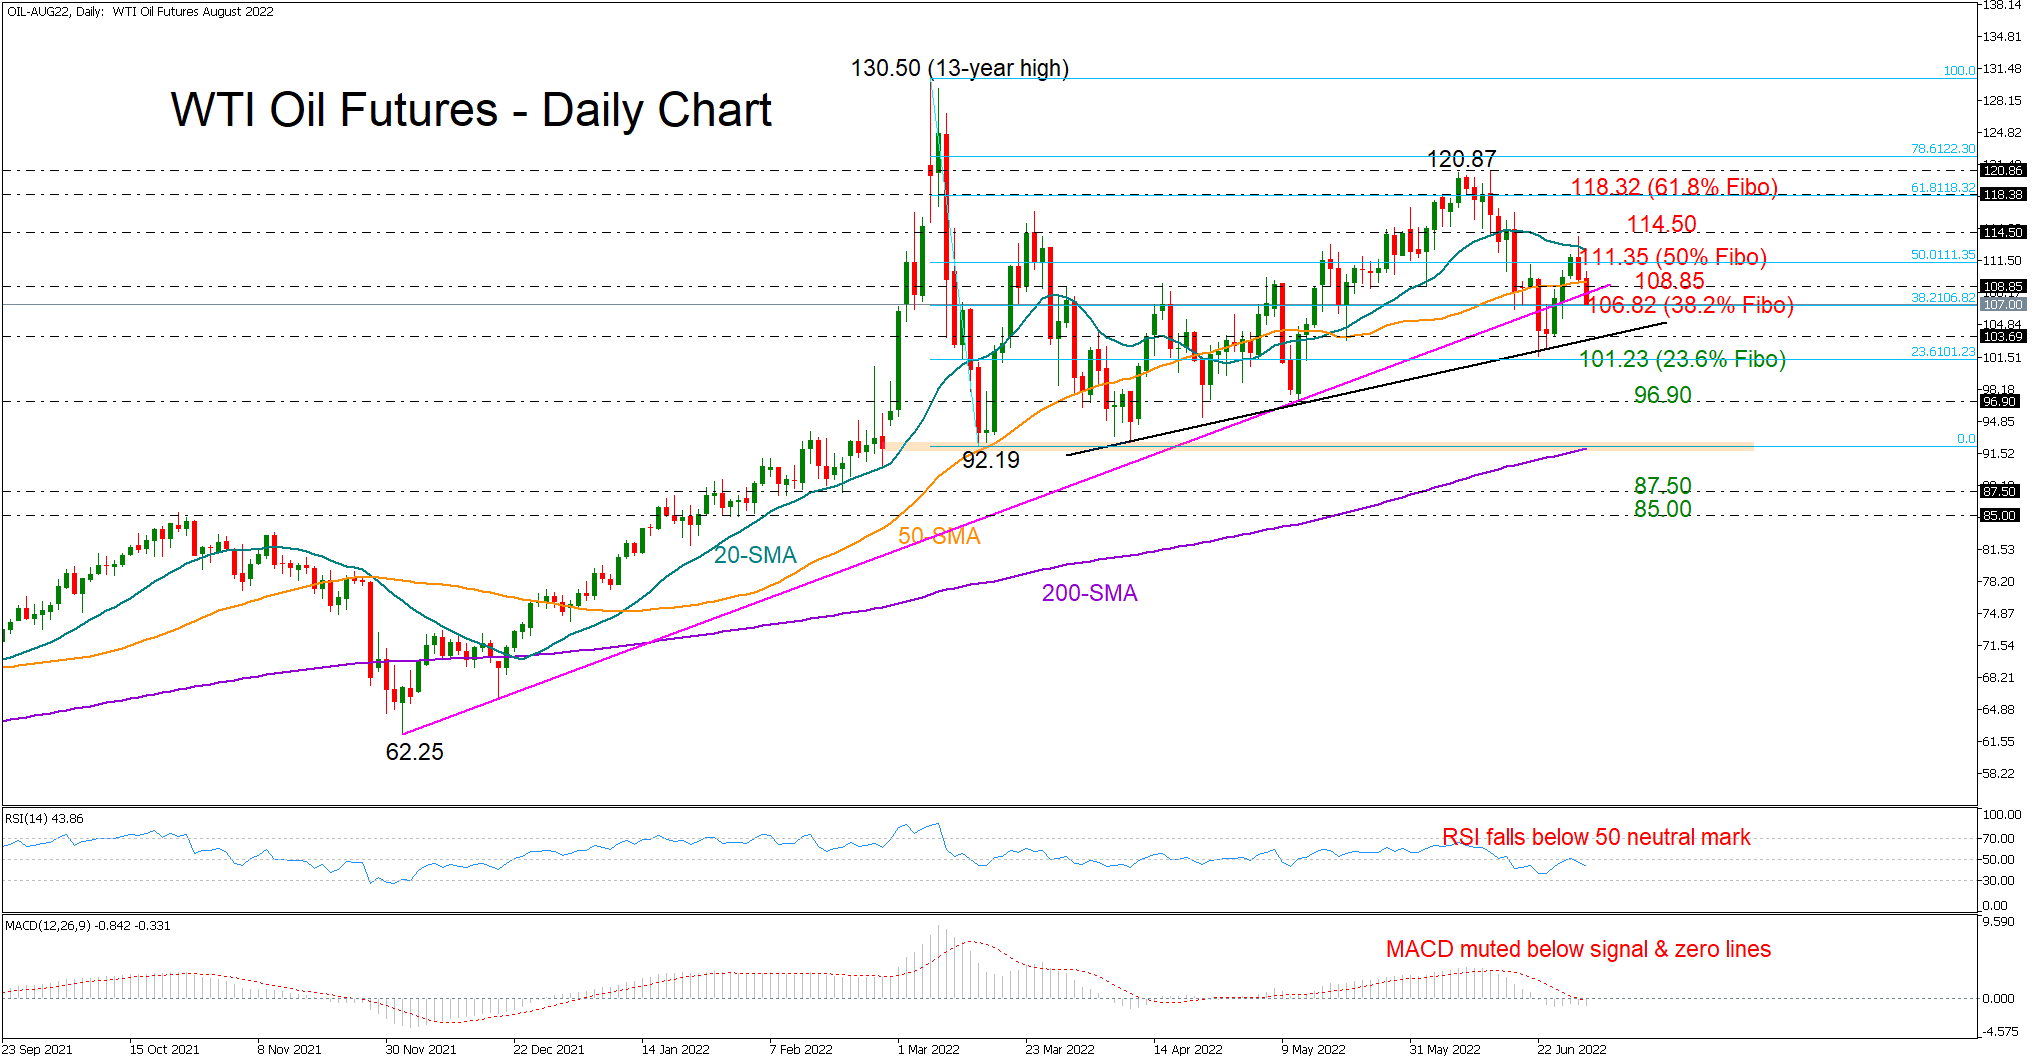
WTI oil futures (August delivery) turned red after failing to close above the 20-day simple moving average (SMA) and the 50% Fibonacci retracement of the $130.50 – $92.19 downfall at $111.35/barrel on Wednesday.
The latest pullback could gain new legs as the RSI has slid back below its 50 neutral mark and the MACD remains muted below its signal and zero lines. If that turns out to be the case and the price retreats below the nearby 38.2% Fibonacci of $106.82 too, the door will open for the shorter-term support trendline at $103.70. A step beneath the latter may immediately halt around the 23.6% Fibonacci of $101.23. Otherwise, the sell-off may stretch towards the $96.90 floor.
Should the price sail northwards instead and above the longer-term ascending trendline, the bulls will again push for a close above the 50% Fibonacci of $111.35 and the 20-day SMA. If they prove successful this time, and the bar at $114.50, which was a crucial constraint to market actions this year, gives way, the rally may speed up to the 61.8% Fibonacci of $118.32 and then meet the June top of $120.87.
All in all, WTI oil futures are technically exposed to additional losses. A decisive close below $106.82 is expected to motivate fresh selling.