Sample Category Title
The Cryptocurrency Market is Stuck at Past Highs
Bitcoin changed little over Wednesday and is trading slightly below $20K on Thursday morning, keeping the controversy at bay, which is now a defining moment for the cryptocurrency market. Ethereum lost 5.1% in 24 hours to $1090. Altcoins in the top 10 fell from 0.7% (Tron) to 8.5% (Solana). The exception was Dogecoin (+0.9%).
The Cryptocurrency Fear and Greed Index was down 2 points to 11 by Thursday and remains in a state of “extreme fear”.
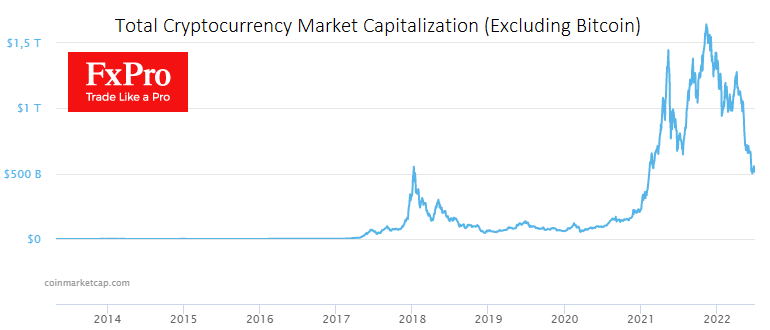
Total crypto market capitalisation, according to CoinMarketCap, sagged 2% overnight to $891bn. Market capitalisation without Bitcoin falls back to 500bn, where it briefly fell from mid-month.
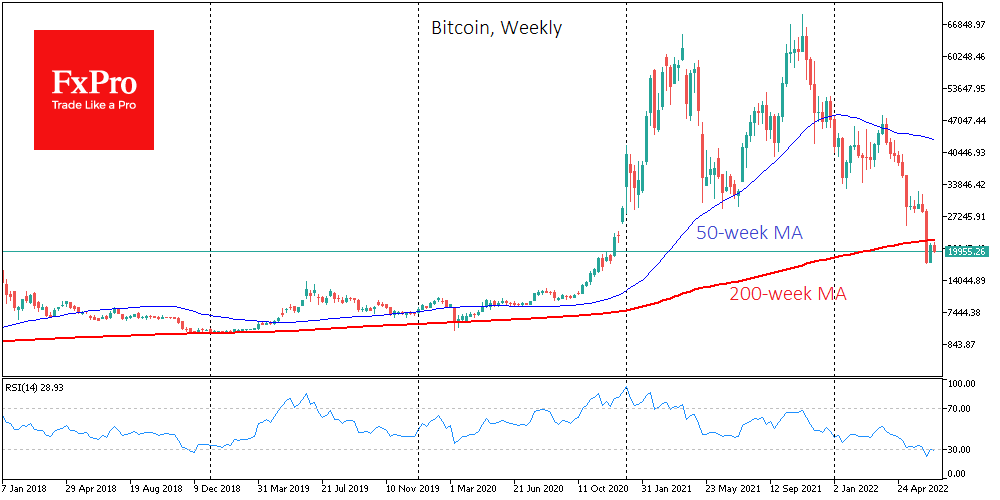
The hypothesis that the crypto market is holding above the highs of the previous peak continues to pass an important test. This applies to Bitcoin with its protracted test of 20k and to altcoins, whose total capitalisation is now near past peaks, at the start of 2018.
MicroStrategy has bought an additional 480 BTC at an average price of around $20,817, CEO Michael Saylor said. As of 28 June, MicroStrategy owns 129,699 BTCs purchased for $3.98bn at an average price of $30,664. Against the backdrop of the first cryptocurrency’s collapse, the company’s loss from bitcoin holdings exceeded $1bn.
A court in the British Virgin Islands has liquidated hedge fund Three Arrows Capital (3AC), headquartered in Singapore. Founded in 2012, the hedge fund had raised tens of billions in investments in the crypto market but suffered losses of at least $400m in the last year when it liquidated its stock positions.
Investment firm Cypherpunk Holdings sold all its assets in bitcoin and Ethereum amid a falling market. The total proceeds from the sale of the cryptocurrencies amounted to almost $5 million.
The current crisis in the cryptocurrency industry will benefit the industry and weed out those who don’t belong in it, American rapper Snoop Dogg said.
A survey by Alto found that nearly 40% of Americans aged 25 to 40 prefer to invest in cryptocurrencies rather than traditional financial instruments. In terms of appeal, digital assets have almost equalled equities.
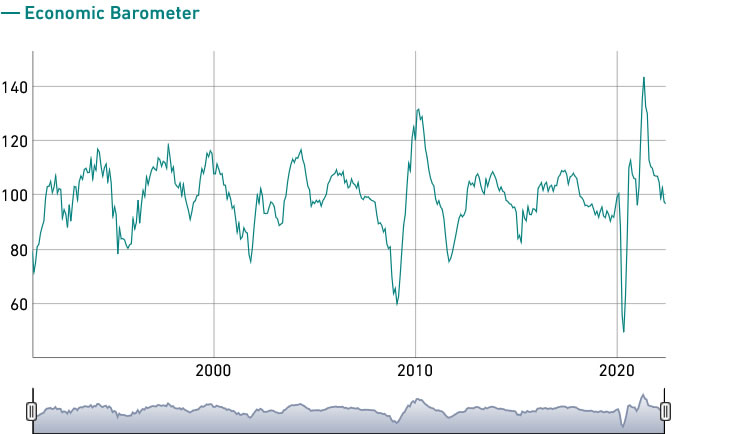
Swiss KOF economic barometer dropped to 96.9 in Jun, subdued outlook in upcoming months
Swiss KOF Economic Barometer dropped from 97.7 to 96.9 in June, slightly above expectation of 96.8. It's now below long-term average for the second month in a row. KOF said, "the outlook for the Swiss economy in the upcoming months therefore remains subdued."
KOF added: "The downward movement of the barometer is primarily driven by bundles of indicators for foreign demand and manufacturing. Only indicators for the financial and insurance services sector and for the construction sector are at a nearly constant level. However, indicator bundles for private consumption show a slight positive trend."
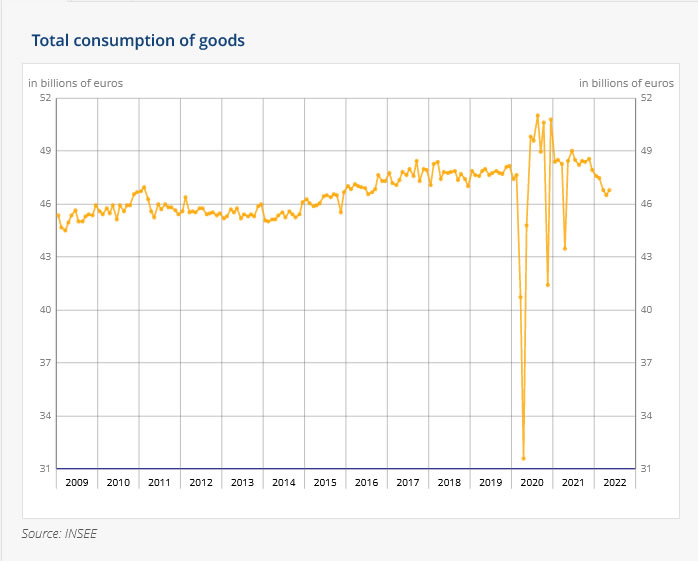
France consumer spending rose 0.7% mom in May, almost exclusively on manufactured goods
France consumer spending rose 0.7% mom in May, slightly above expectation of 0.6% mom. That's the first increase after five months of contraction. The increase was almost exclusively due to the clear rebound in consumption of manufactured goods (+2.7% after -1.3% in April). Food consumption was stable (+0.1% after -1.2%) while energy consumption decreased significantly (-2.6% after +1.9%).
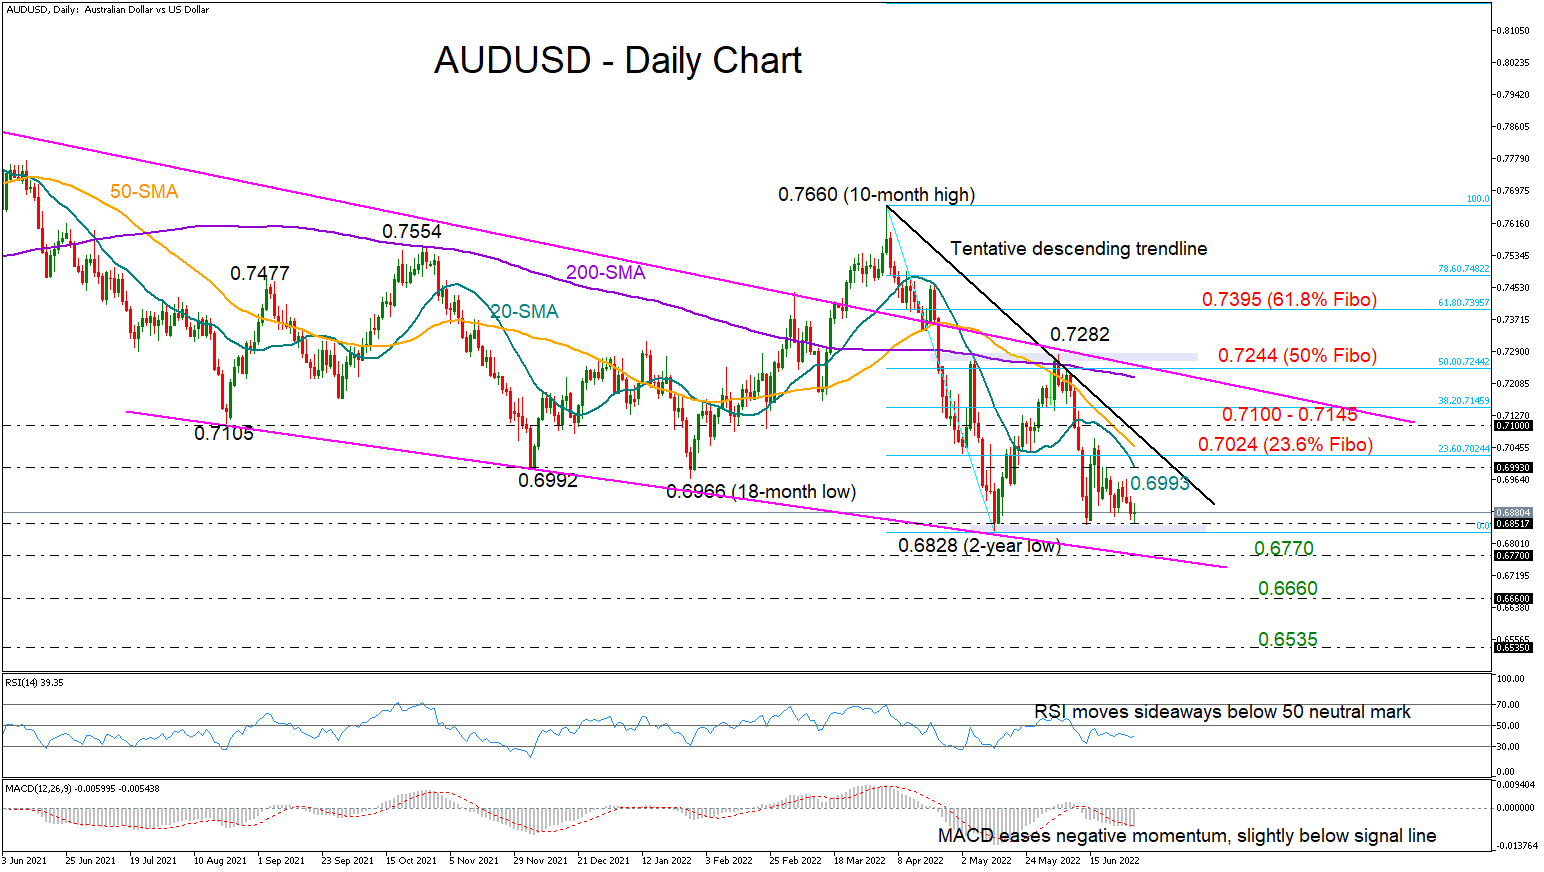
AUDUSD on the Verge of a Downtrend Resumption
AUDUSD has completely reversed its mid-June bullish move to trade at the bottom of its broad downtrend and marginally above the familiar support zone of 0.6850.
The falling simple moving averages (SMAs) are signaling a continuation of the long-term negative trend after a short period of consolidation, though the momentum indicators are rather directionless, with the RSI moving sideways below its 50 neutral mark and the MACD stabilizing its decline slightly below its red signal line.
In the event the price tumbles below the 0.6850 floor, the strong support line drawn from 0.7105 (August 2021) could be an ideal place for a rebound around 0.6770. A clear close below that bar could intensify selling pressures towards the 0.6660 barricade, which had been strongly rejecting upside and downside moves during the 2019 – 2020 period. If that collapses as well, the pair could next visit the 0.6535 mark from May 2020.
In the bullish scenario, where the 0.6850 base keeps a strong footing under the price, the pair may attempt to crawl above last week’s resistance of 0.6993. The 20-day SMA is currently intersecting that barrier, while not far above, the 23.6% Fibonacci retracement of April’s downfall and the tentative descending trendline that is seen at 0.7024 may block the way towards the 0.7100 – 0.7145 zone. Should buying forces dominate from here, the spotlight will immediately turn to the 200-day SMA and the long-term constraining line from the 2021 top of 0.8000 currently sitting around the 61.8% Fibonacci of 0.7260.
Summarizing, AUDUSD is on the verge of an outlook deterioration as the price is testing the bottom of its long-term downtrend. A decisive step below 0.6850 is expected to trigger the next bearish action, while a fast rally above the 0.7024 area is required to bring buyers into play.
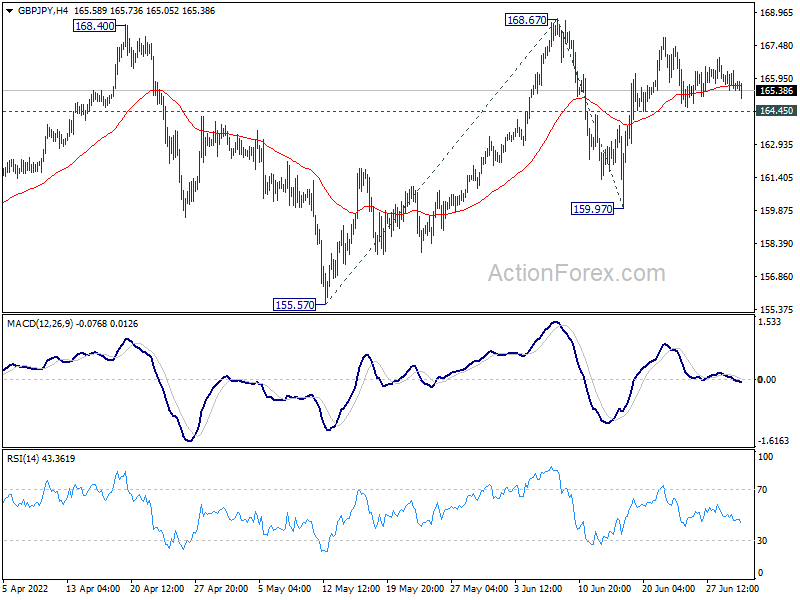
GBP/JPY Daily Outlook
Daily Pivots: (S1) 165.23; (P) 165.79; (R1) 166.17; More...
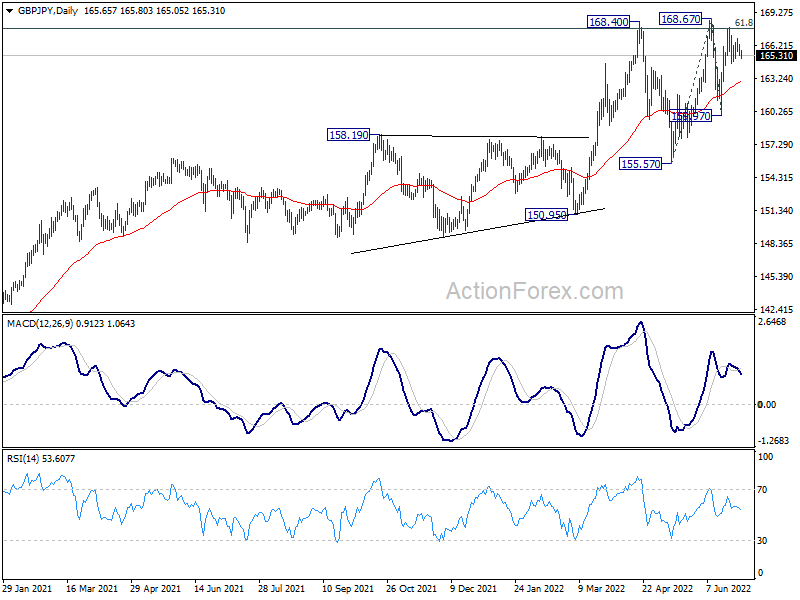
Outlook in GBP/JPY is unchanged and intraday bias stays neutral for the moment. On the upside, decisive break of 168.67 resistance will resume larger up trend. Next near term target is 100% projection of 155.57 to 168.67 from 159.97 at 173.07. On the downside, below 164.45 minor support will turn bias back to the downside for 159.97 support instead.
In the bigger picture, up trend from 123.94 (2020 low) is still in progress. Sustained break of 61.8% retracement of 195.86 (2015 high) to 122.75 (2016 low) at 167.93 will be a long term bullish signal, and could pave the way back to 195.86 high. This will now remain the favored case as long as 155.57 support holds, even in case of deep pull back.
EUR/JPY Daily Outlook
Daily Pivots: (S1) 142.13; (P) 142.99; (R1) 143.50; More....
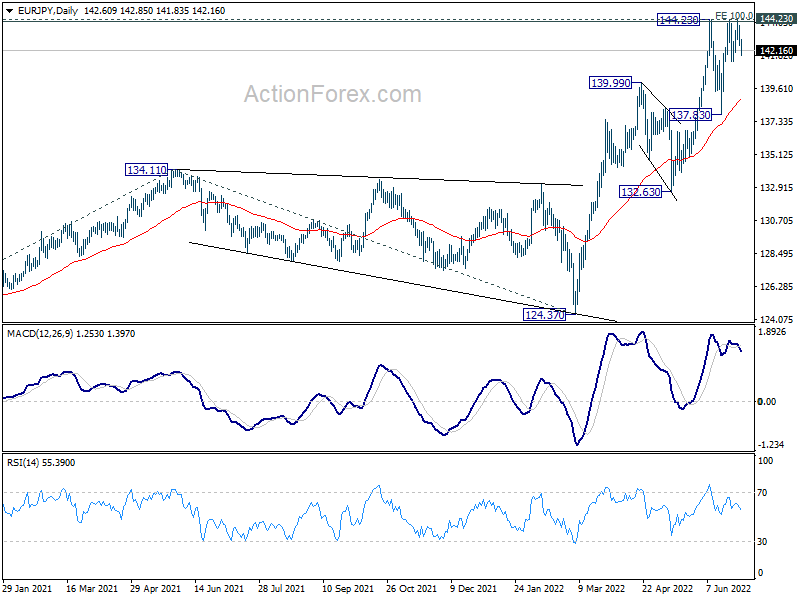
Intraday bias in EUR/JPOY remains neutral as range trading continues. On the upside, decisive break of 144.23 will resume larger up trend. On the downside, below 141.39 minor support will bring deeper fall, to extend the corrective pattern from 144.23.
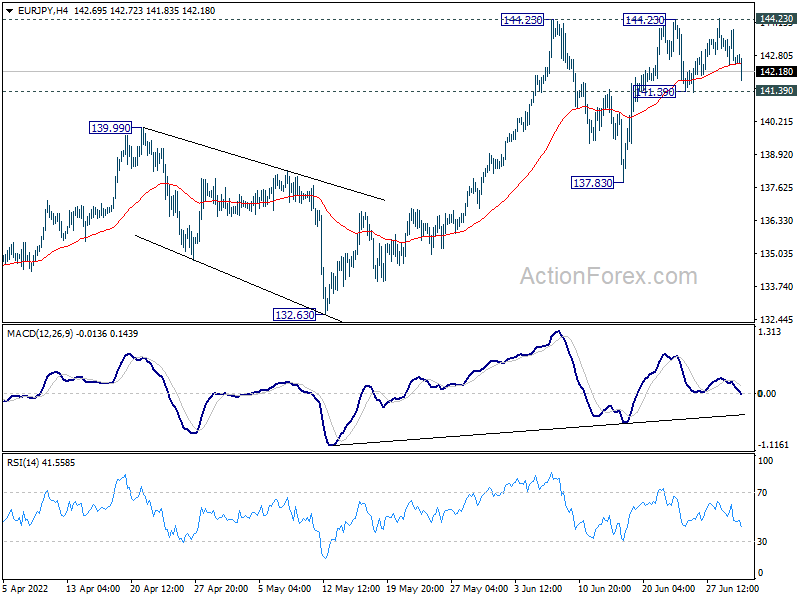
In the bigger picture, up trend from 114.42 (2020 low) is in progress. Such rise is seen as the third leg of the pattern from 109.30 (2016 low). Sustained trading above 100% projection of 114.42 to 134.11 from 124.37 at 144.06 will indicate upside acceleration and target 149.76 long term resistance (2014 high). In any case, outlook will now remain bullish as long as 132.63 support holds, in case of deep pull back..
EUR/GBP Daily Outlook
Daily Pivots: (S1) 0.8590; (P) 0.8626; (R1) 0.8648; More...
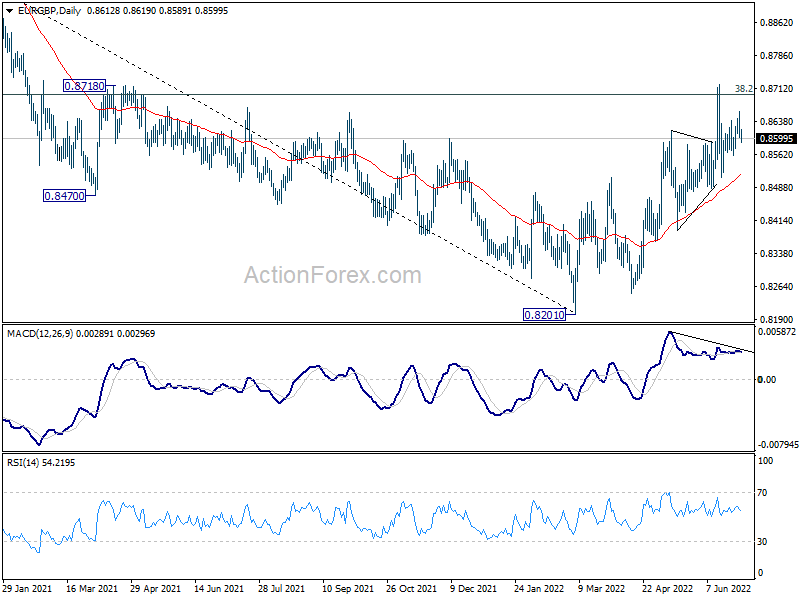
Intraday bias in EUR/GBP remains neutral for the moment. On the downside, break of 0.8484 support will suggest rejection by 0.8697 medium term fibonacci resistance. Outlook will be turned bearish for 0.8248 support next. On the upside, break of 0.8720 and sustained trading above 0.8697 medium term fibonacci level will carry larger bullish implication. Next target is 0.9003 fibonacci level.
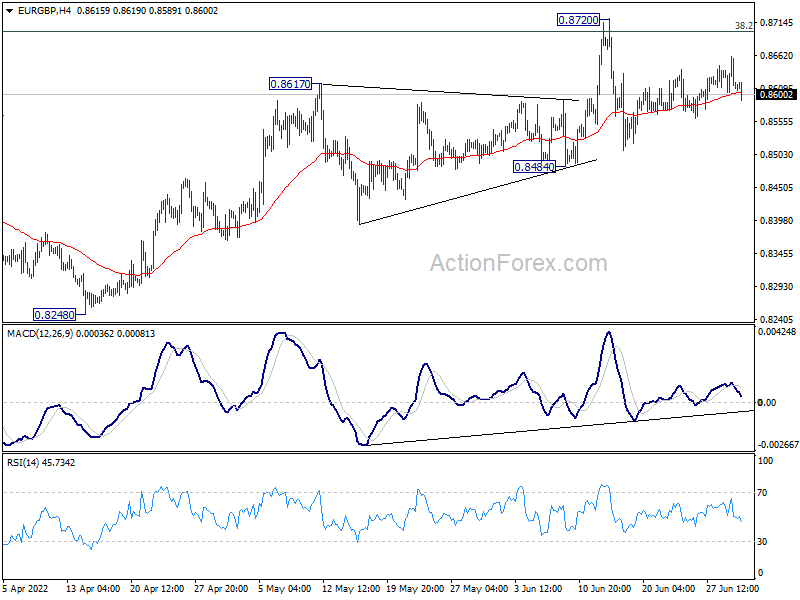
In the bigger picture, rise from 0.8201 medium term bottom could could either be a correction to the down trend from 0.9499 (2020 high), or a medium term up trend itself. Sustained break of 38.2% retracement of 0.9499 to 0.8201 at 0.8697 will affirm the latter case, and pave the way to 61.8% retracement at 0.9003. However, rejection by 0.8697 will maintain medium term bearishness.
EUR/AUD Daily Outlook
Daily Pivots: (S1) 1.5124; (P) 1.5221; (R1) 1.5276; More...
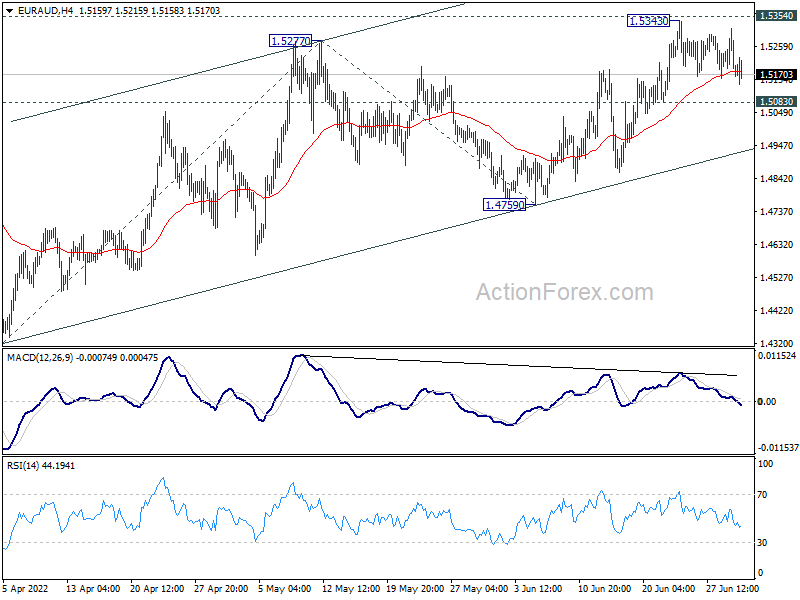
Intraday bias in EUR/AUD remains neutral as range trading continues. On the upside, sustained break of 1.5354 support turned resistance will indicate medium term bottoming at 1.4318. Stronger rally would be seen back to 100% projection of 1.4318 to 1.5277 from 1.4759 at 1.5718. On the downside, however, break of 1.5083 minor support will retain medium term bearishness, and turn bias back to the downside for 1.4759 support instead.
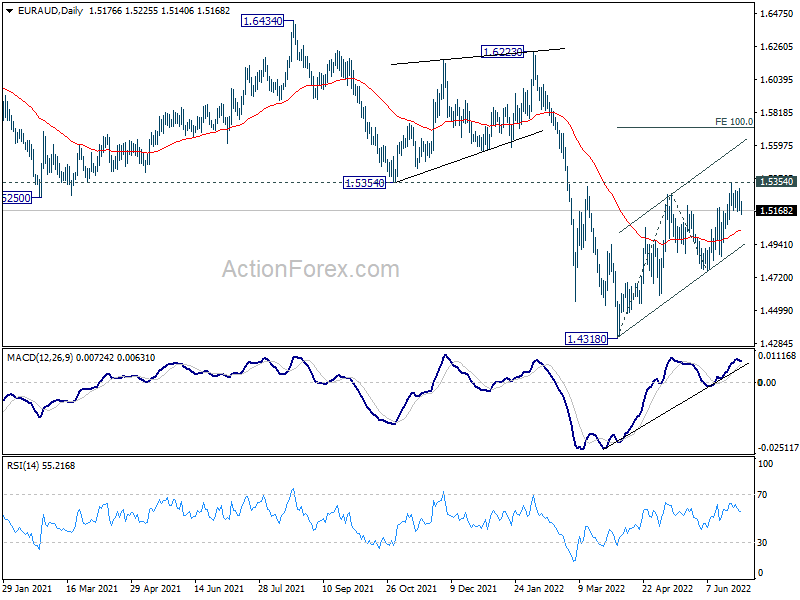
In the bigger picture, as long as 1.5354 support turned resistance holds, larger down trend from 1.9799 (2020 high) is still expected to continue. On resumption, next target is 61.8% projection of 1.9799 to 1.5250 from 1.6434 at 1.3623, which is close to 1.3624 long term support (2017 low). However, firm break of 1.5354 will indicate medium term bottoming and bring stronger rally back to 1.6434 key resistance.
EUR/CHF Daily Outlook
Daily Pivots: (S1) 0.9931; (P) 1.0004; (R1) 1.0041; More....
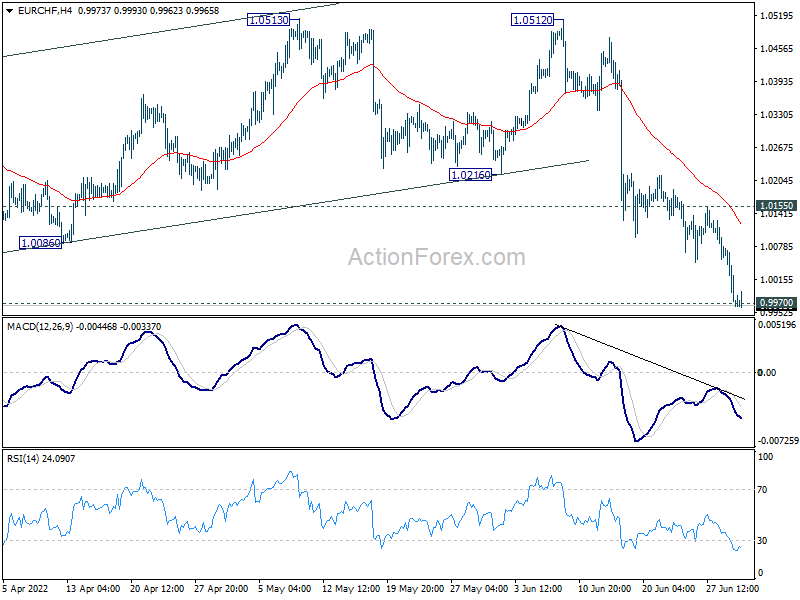
Intraday bias in EUR/CHF stays on the downside at this point. Sustained break of 0.9970 low will resume larger down trend. Next target is 0.9650 long term projection level. On the upside, however, above 1.0214 minor resistance will delay the bearish case, and turn bias back to the upside for stronger rebound.
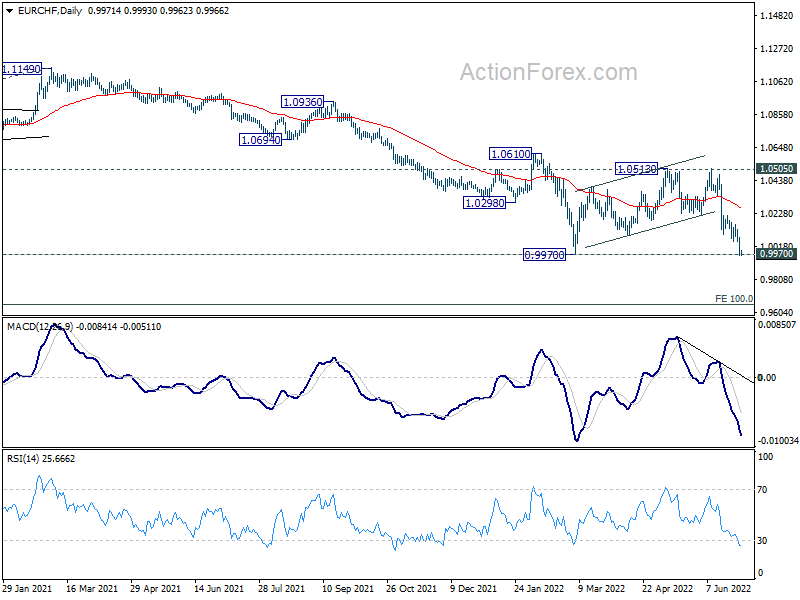
In the bigger picture, as long as 1.0505 support turned resistance (2020 low) holds, long term down trend from 1.2004 (2018 high) is expected to continue. Next target is 100% projection of 1.2004 to 1.0505 to 1.1149 at 0.9650. However, firm break of 1.0505 will suggest medium term bottoming, and bring stronger rebound towards 1.1149 structural resistance.
Daily Technical Analysis
EUR/USD
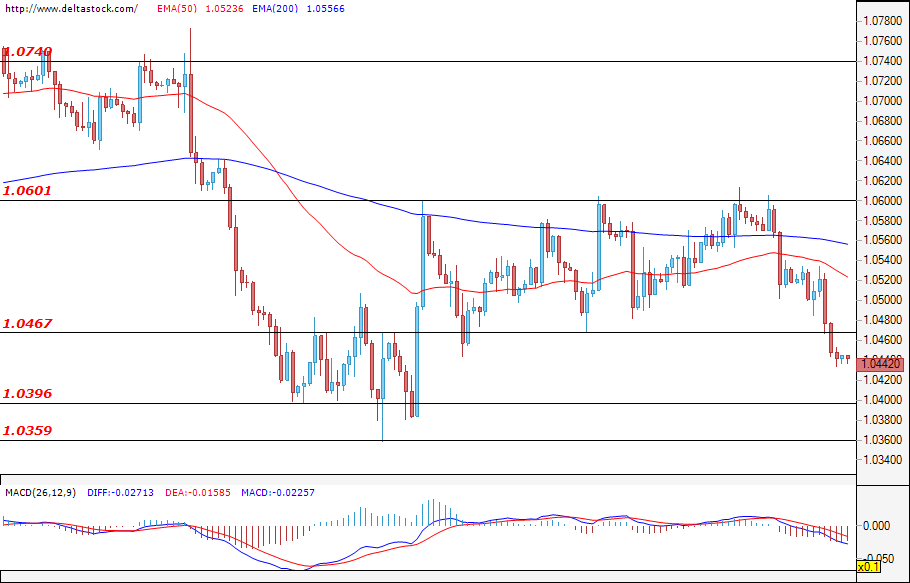
The common European currency lost quite a bit of ground against the dollar and the pair breached the zone at 1.0467. At the time of writing the analysis, the pair is trading just below the level at 1.0467. If the bearish attack continues, then a test of the major support at 1.0396 would be the most probable scenario. A violation of the mentioned level would easily deepen the sell-off towards the low at 1.0359 and would strengthen the negative expectations for the future path of the EUR/USD. If the bulls enter the market, then their first target would be the level at 1.0467, which is currently acting as resistance. Today, increased volatility can be expected around the announcement of the initial jobless claims data for the United States at 12:30 GMT.
USD/JPY
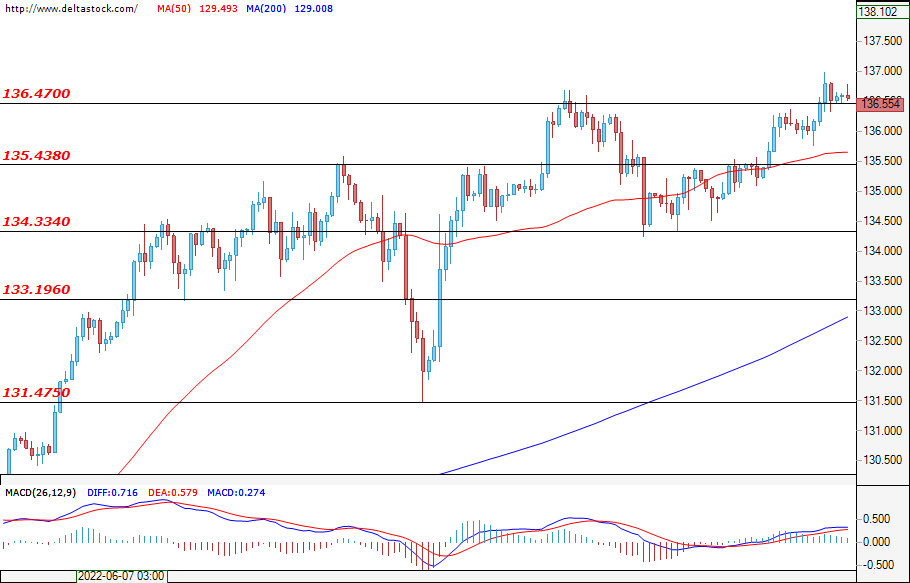
The positive sentiment remained unchanged and the Ninja tested the resistance at 136.47. A successful confirmation of the breach here would easily lead to new gains for the dollar against the yen and could continue the rally towards the zone at 137.00. If the bullish momentum fades, then the bears could try to breach the support at 135.43. А success for them could deepen the decline and could pave the way for a test of the lower zone at 134.33.
GBP/USD
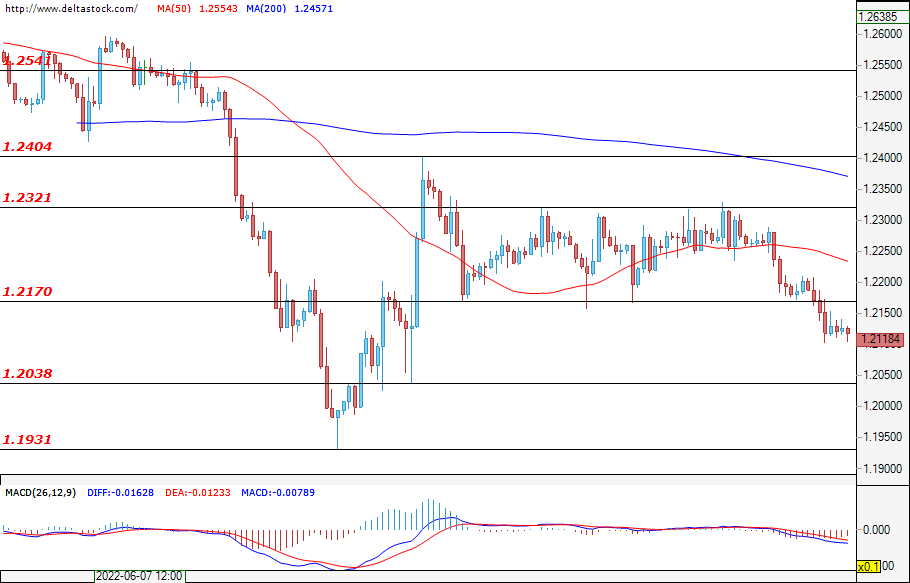
Like all the other major currencies, the sterling lost some ground against the dollar and the pair breached the support zone at 1.2170. It is currently holding positions around the level at 1.2118, but if the sell-off continues, the expectations are for a test of the next target at 1.2038. A successful violation could easily deepen the decline and could strengthen the negative expectations for the future path of the Cable. If the buyers prevail instead, then their first target would be the zone at 1.2170, followed by the upper important resistance at 1.2321.
EUGERMANY40
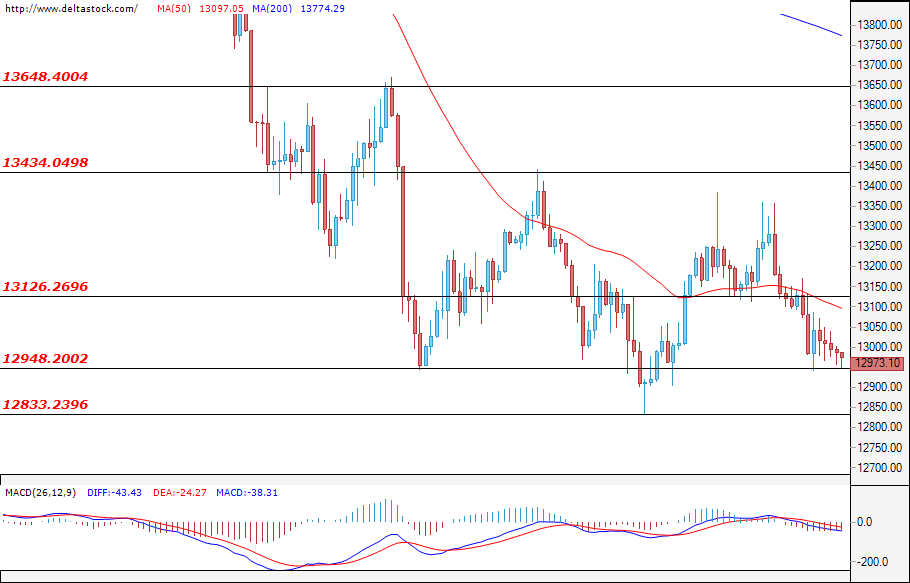
After the successful breach of the zone at 13126, the EUGERMANY40 continued to tumble, and during the early hours of today’s trading, the index is heading for a test of the lower support at 12948. A successful attack for the bears could easily extend the losses and could lead the price towards the lows at 12833. If the bulls manage to limit the sell-off above the mentioned zone at 12948, then they could attempt to violate the zone at 13126 as well. However, only a breach of the upper resistance at 13434 could lead to a change in the current sentiment of the market participants.
US30
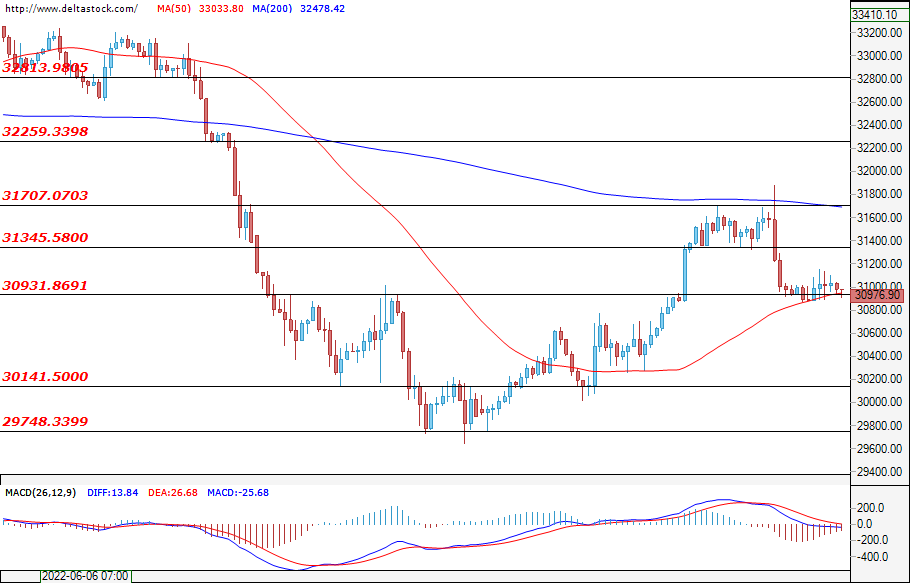
Neither the bears nor the bulls managed to prevail, and at the time of writing the analysis, the U.S. index is hovering around the support zone at 30931. A successful breach for the sellers could lead to future losses and could pave the way for a test of the next target at 30141, followed by the lower zone at 29748. Better-than-expected unemployment change data for the U.S. (today; 12:30 GMT) could encourage the buyers to re-enter the market. A successful attack on the resistance at 31345, followed by a breach of the next zone at 31707, could easily lead to a rally aimed towards 32259.