

Sample Category Title
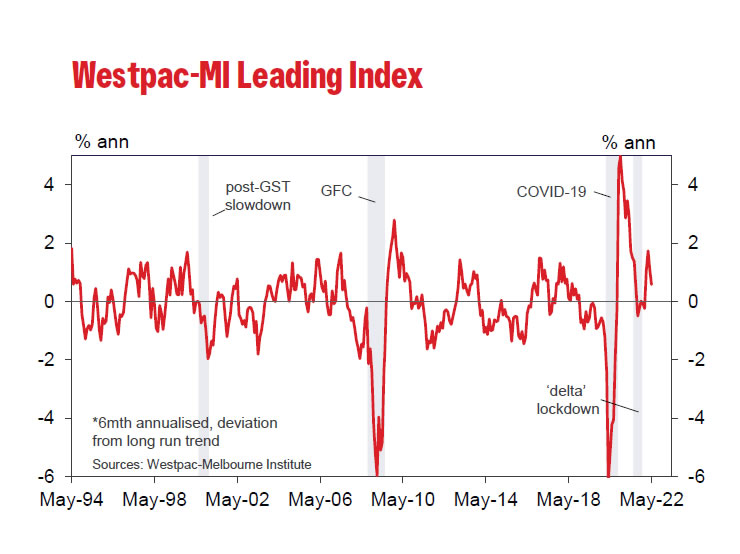
Australia Westpac leading index dropped to 0.58 in May
Australia Westpac leading index dropped from 1.09% to 0.58% in May, still indicating above trend growth for 2022. Westpac said, "the components of the Index are indicating an important emerging theme around Australia's growth prospects – a significant shock to consumer confidence."
On RBA policy, Westpac expects the central bank to hike a further 50bps in July. It assessed that at 1.35% after the hike, interest rate is still below the neutral setting. Given the tight labor market and rising inflation, further monetary tightening can be expected through 2022.
New Zealand goods exports rose 18% yoy in May, imports rose 24% yoy
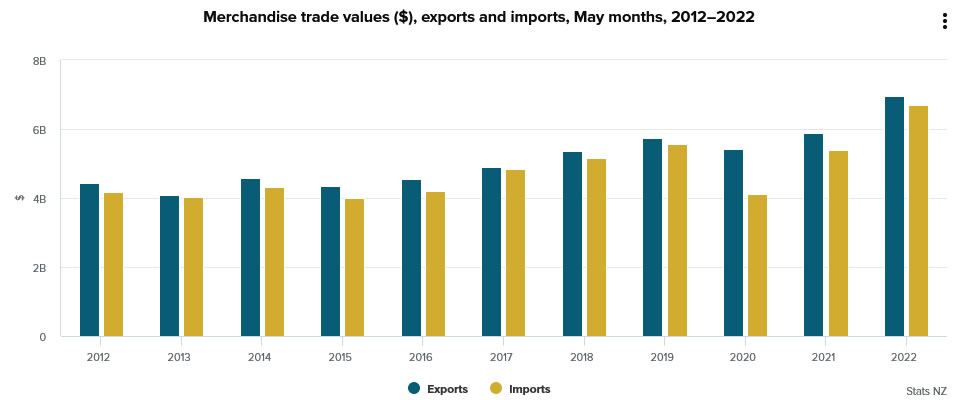
New Zealand goods exports rose 18% yoy or NZD 1.1B to NZD 7.0B in May. Goods imports rose 24% yoy or NZD 1.3B to NZD 6.7B. Monthly trade surplus narrowed from NZD 440m to NZD 263m, smaller than expectation of NZD 580m.
Exports to all top destinations rose except to China: China (down -3.8%), Australia (up 49%), US (up 18%), EU (up 23%), Japan (up 0.7%).
Imports from most partners rose except from the US: China (up 25%), EU (up 12%), Australia (up 18%), US (down -5.5%), Japan (up 41%).
BoJ firm on maintaining ultra-loose monetary policy
In the minutes of April 27-28 meeting of BoJ indicated that while the board was concerned with fluctuation in Yen's exchange rate, it remained firm on the stance to continue with ultra-loose monetary policy.
One board member noted that Japan's economy was "still on its way to recovery". As a "commodity importer", the rise in commodity prices would "lead to an outflow of income from Japan and thus exert downward pressure on the economy." Hence, it's "necessary" to "continue with the current powerful monetary easing and thereby firmly support the economy."
Another member noted that "the challenge of monetary policy in Japan was not to curb inflation, as in the case of the United States and Europe, but to overcome inflation that was still too low". A different member commented that," with the addition of Russia's invasion of Ukraine to the existing downside risks to the economy, the situation had further changed significantly; against this backdrop, it was not appropriate for the Bank to make any big changes to its monetary policy stance."
Regarding Yen's depreciation, "a few members said excessive fluctuations in the foreign exchange market over a short period of time, such as those observed recently, would raise uncertainties about the future and make it more difficult for firms to formulate their business plans".
Some member noted, "it was necessary for the Bank to clearly communicate to the public that the aim of monetary policy conduct was to fulfill its mandate of achieving price stability, rather than to control foreign exchange rates."
Technical Outlook and Review
DXY:
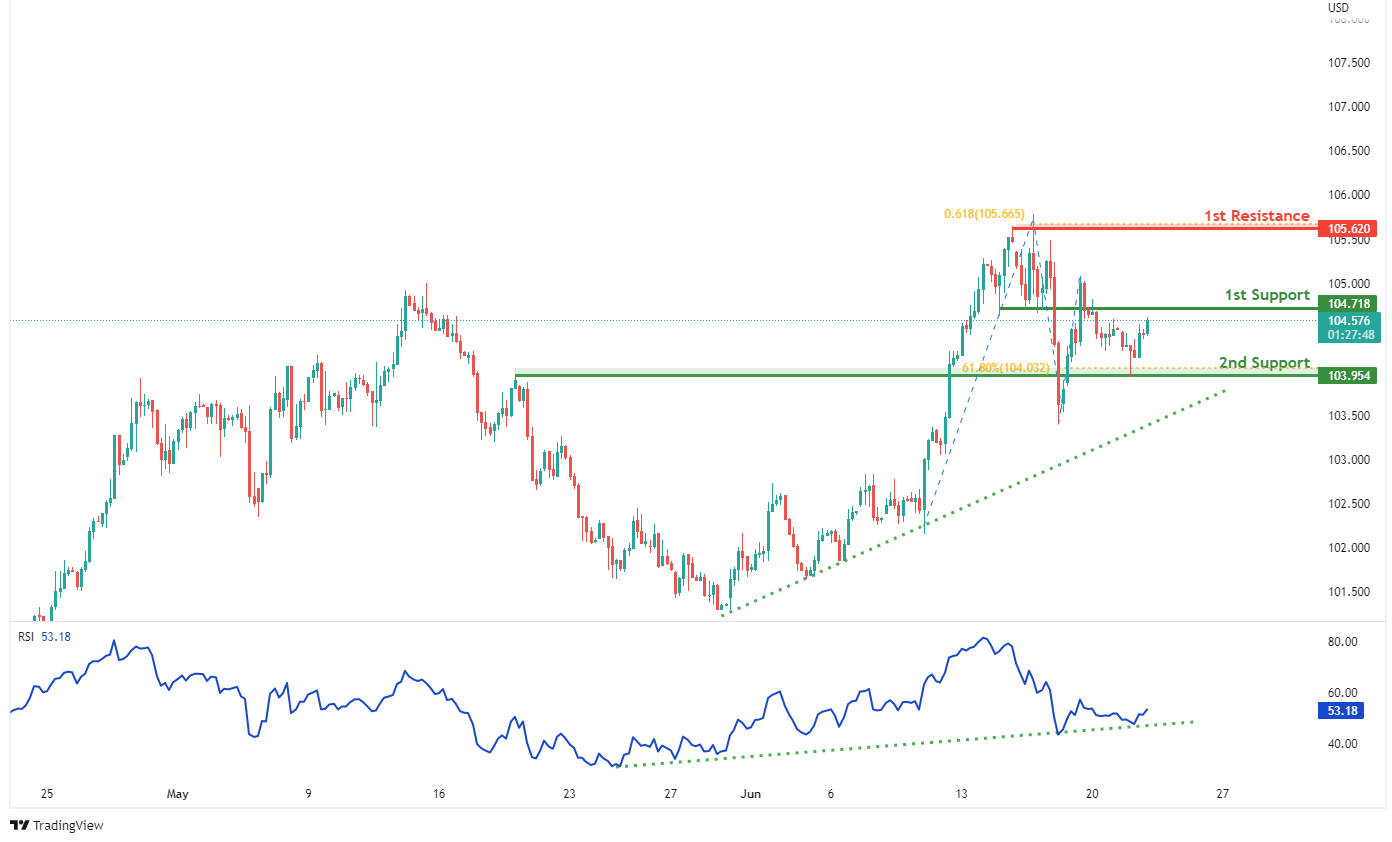
On the H4, with RSI moving along an ascending trendline and prices moving along the ascending trendline, we have a bullish bias that bullish momentum will carry price to our 1st resistance at 105.620 where the 61.8% fibonacci projection and swing high resistance are after price rises to our 1st support at 104.718 in line with the horizontal overlap support. Alternatively, price may break 1st support structure and head for 2nd support at 103.954 where the horizontal pullback support and 61.8% fibonacci retracement.
Areas of consideration:
- H4 time frame, 1st resistance at 105.620
- H4 time frame, 1st support at 104.718
XAU/USD (GOLD):
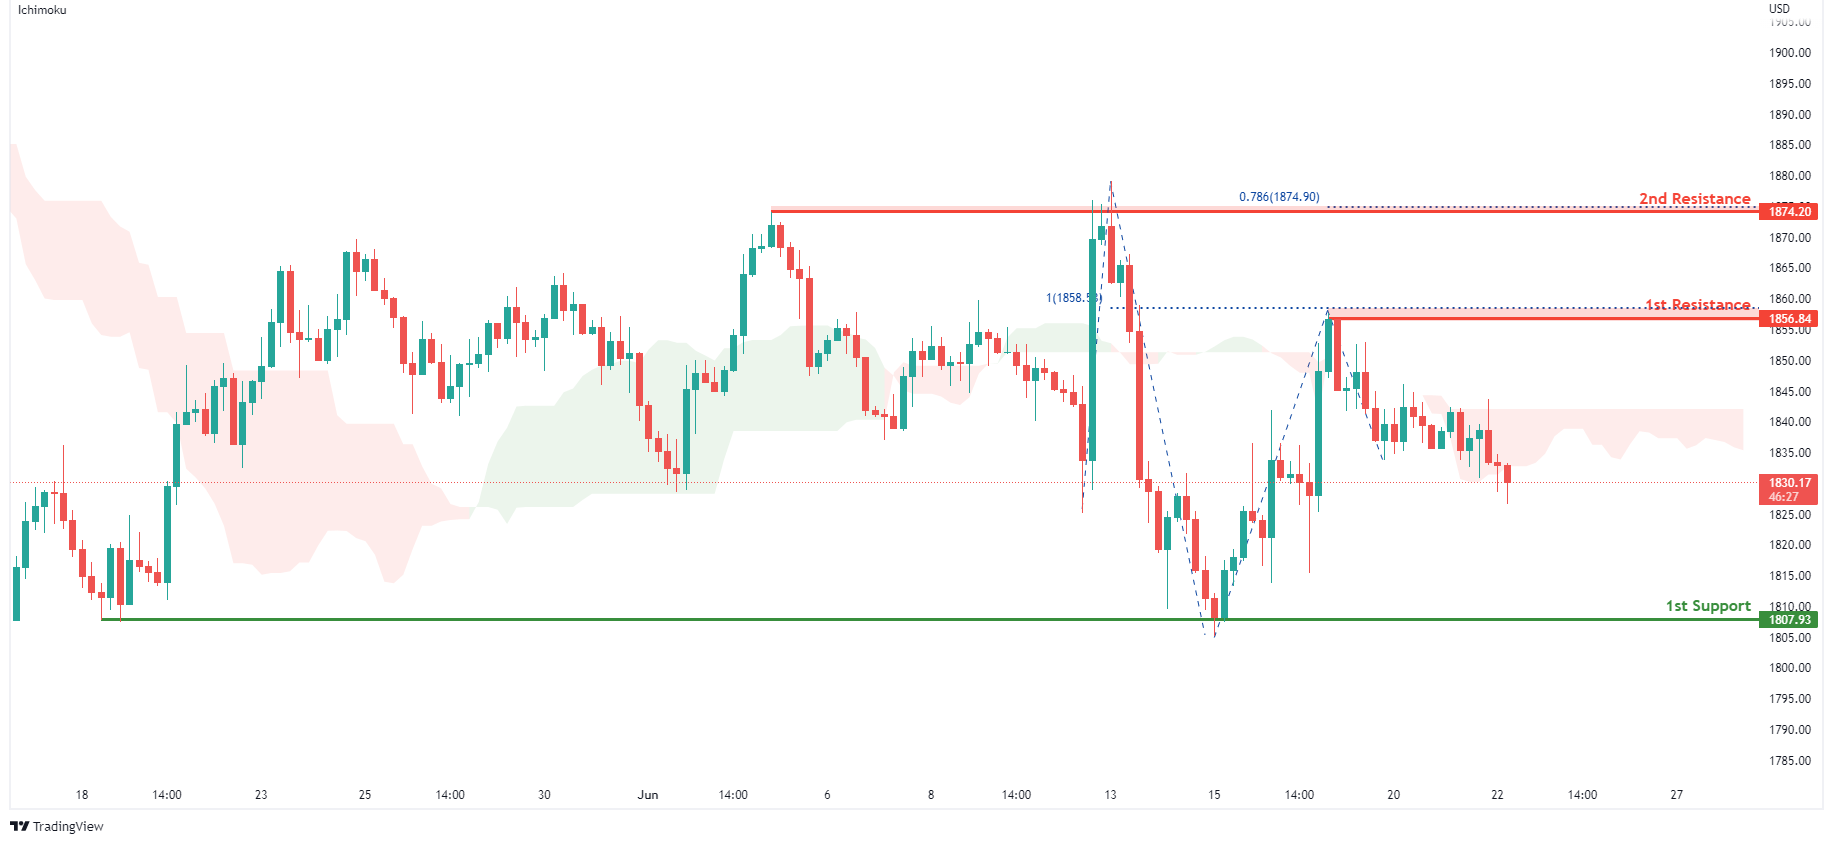
On the H4, with prices moving below the ichimoku indicator, we have a bearish bias that prices will drop from our 1st resistance at 1856.84 where the horizontal swing high resistance and 100% fibonacci projection are to our 1st support at 1807.93 in line with swing low support. Alternatively, price may break 1st resistance structure and head for 2nd resistance at 1874.20 in line with swing high resistance and 78.6% fibonacci projection.
Areas of consideration:
- H4 time frame, 1st Resistance at 1856.84
- H4 time frame, 1st Support at 1807.93
GBP/USD:
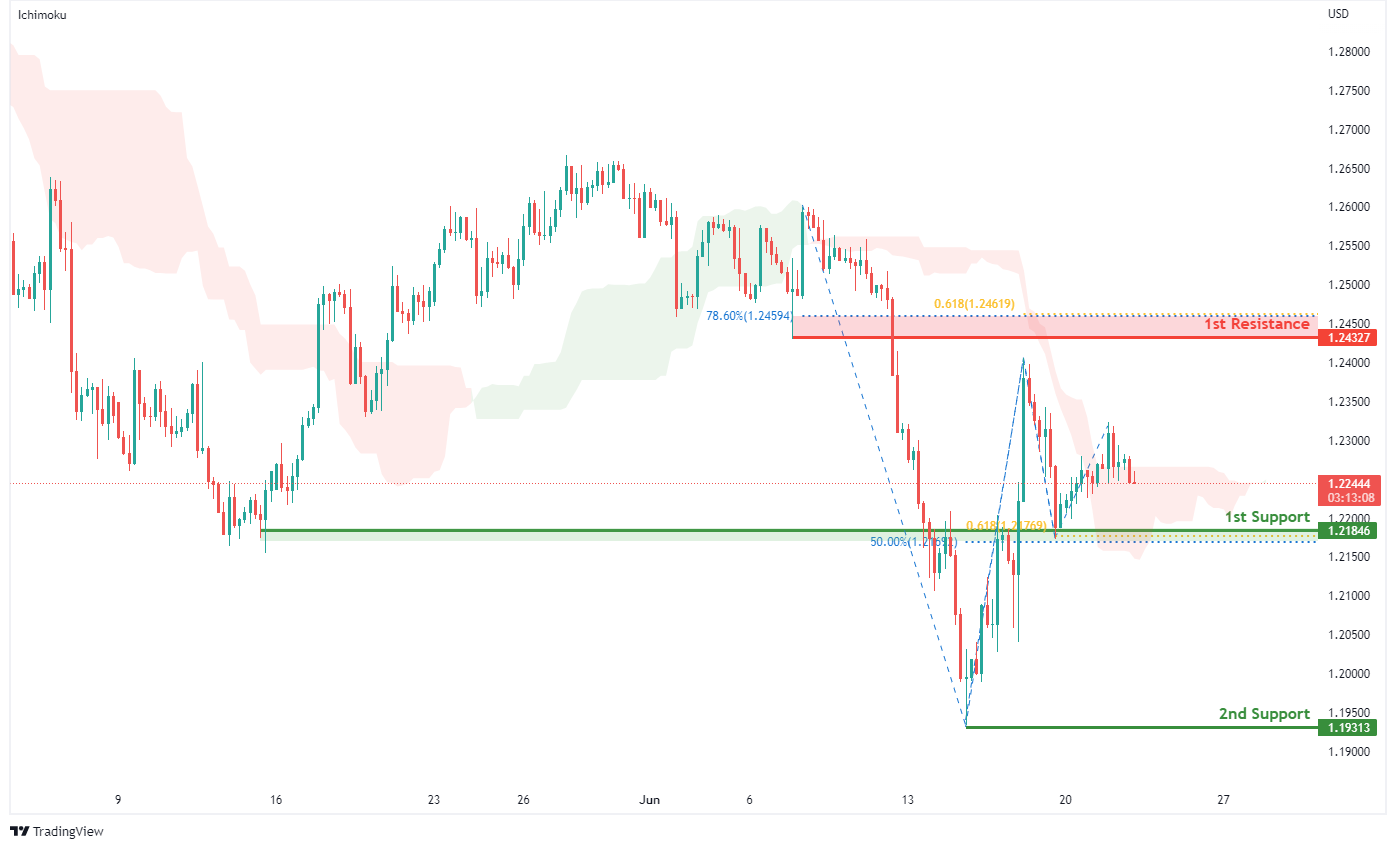
On the H4, with prices expected to bounce off the ichimoku support, we have a bullish bias that price will rise from our 1st support at 1.21846 where the horizontal overlap support,50% fibonacci retracement and 61.8% fibonacci projection to our 1st resistance at 1.24327 in line with the 61.8% fibonacci projection, 78.6% fibonacci retracement and pullback resistance. Alternatively, price may break 1st support structure and head for 2nd support at 1.19313 where the horizontal swing low support is.
Areas of consideration:
- H4 1st resistance at 1.24327
- H4 1st support at 1.21846
USD/CHF:
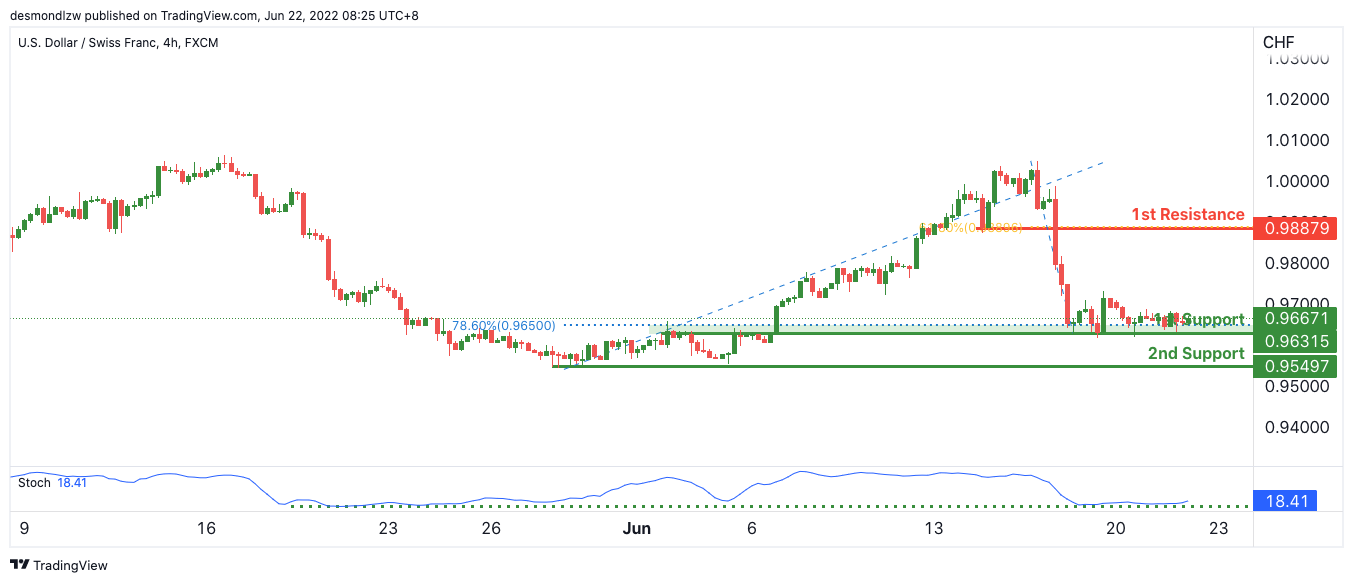
On the H4, with price expected to bounce off the stochastics indicator, we have a bullish bias that price will rise from our 1st support at 0.96315 where the horizontal pullback support and 78.6% Fibonacci retracement is to our 1st resistance at 0.98879 in line with the horizontal pullback resistance and 61.8% Fibonacci retracement. Alternatively, price may break structure and head for 2nd support where the horizontal swing low support is.
Areas of consideration
- 1st support level at 0.96315
- 1st resistance level at 0.98879
EUR/USD :
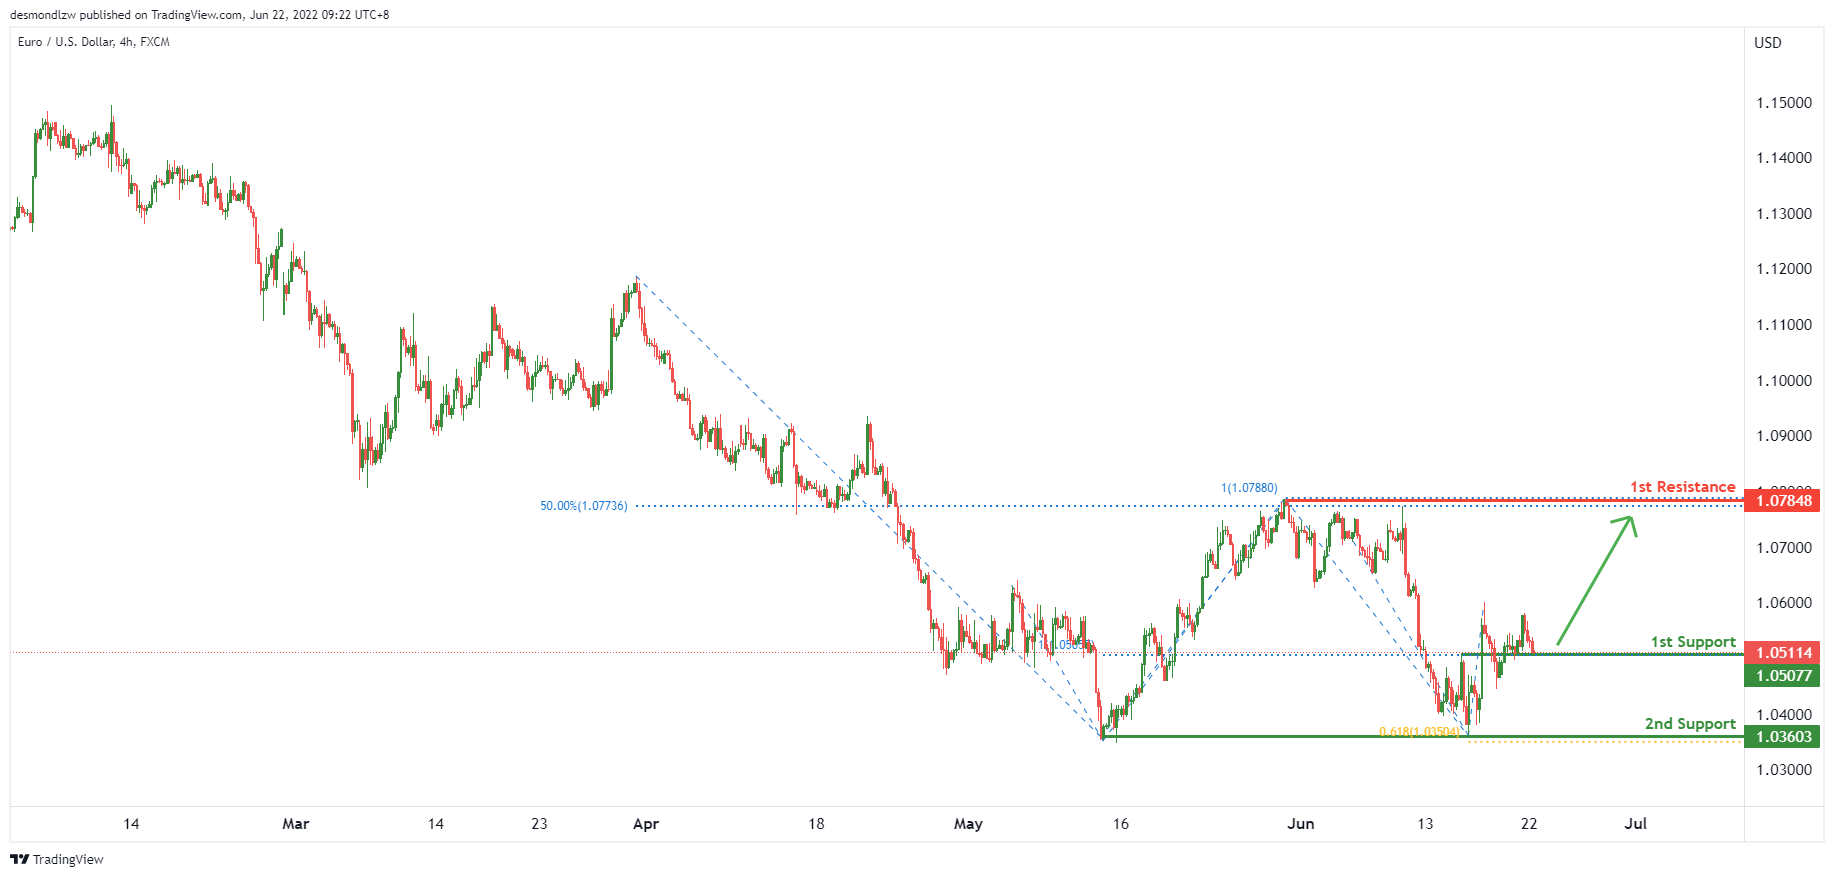
On the H4, with price reaching the key support level at 1.05077, we have a bullish bias that price will rise from the 1st support at 1.05077 in line with the pullback support and 100% fibonacci projection to the 1st resistance at 1.07848 in line with the swing high, 100% fibonacci projection and 50% fibonacci retracement. Alternatively, price may reverse off the 1st support and drop to the 2nd support at 1.03603 in line with the multiple swing lows and 61.8% fibonacci projection.
Areas of consideration :
- H4 1st resistance at 1.07848
- H4 1st support at 1.05077
USD/JPY:
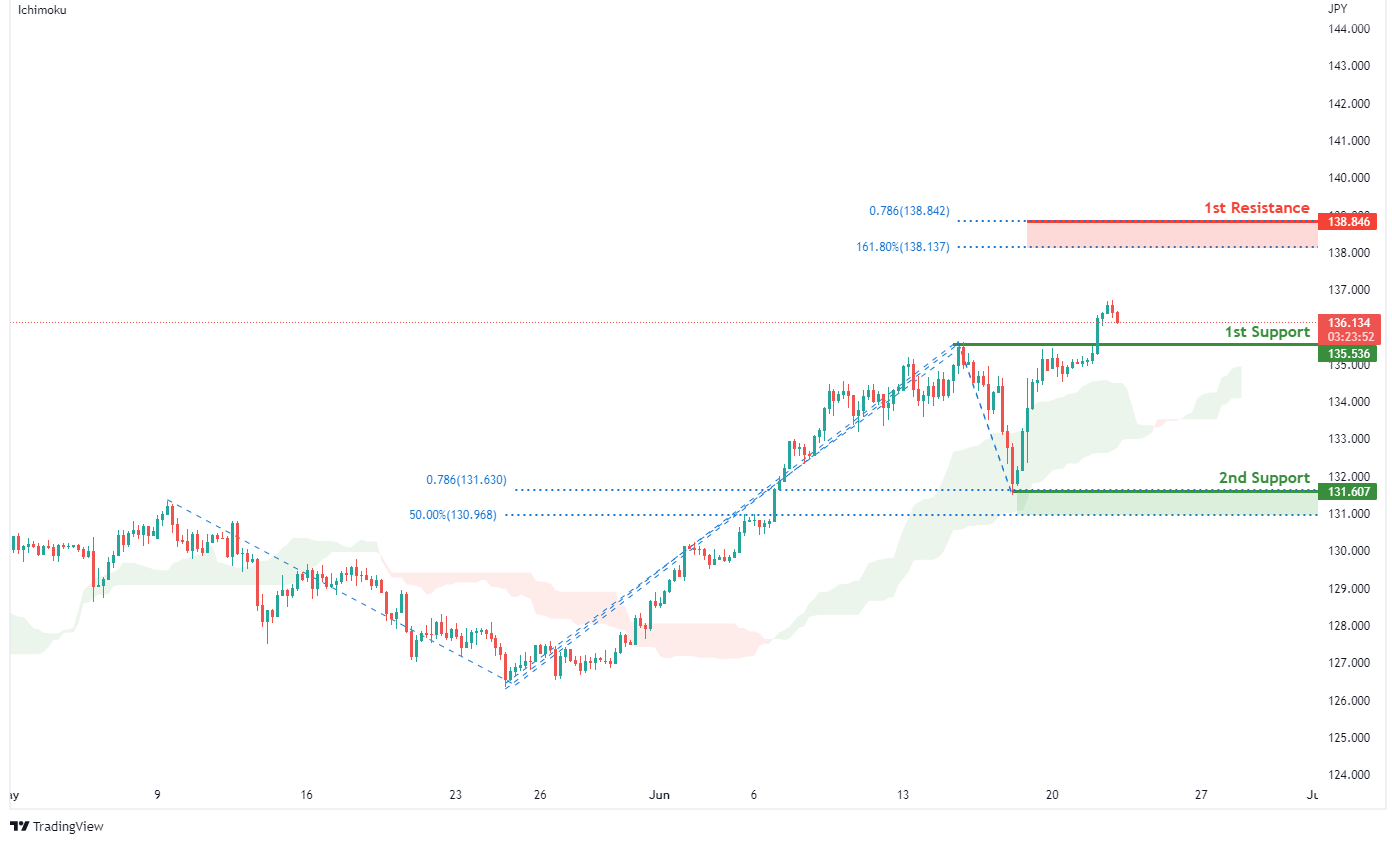
On the H4, with price moving above the ichimoku indicator, we have a bullish bias that price will rise from our 1st support at 135.536 in line with the pullback support to our 1st resistance at 138.846 where the 161.8% fibonacci extension and 78.6% fibonacci projection are . Alternatively, price may break 1st support structure and head for 2nd support at 131.607 in line with the swing low support,78.6% fibonacci projection and 50% fibonacci retracement.
Areas of consideration:
- H4 time frame, 1st resistance at 138.846
- H4 time frame, 1st support at 135.536
AUD/USD:
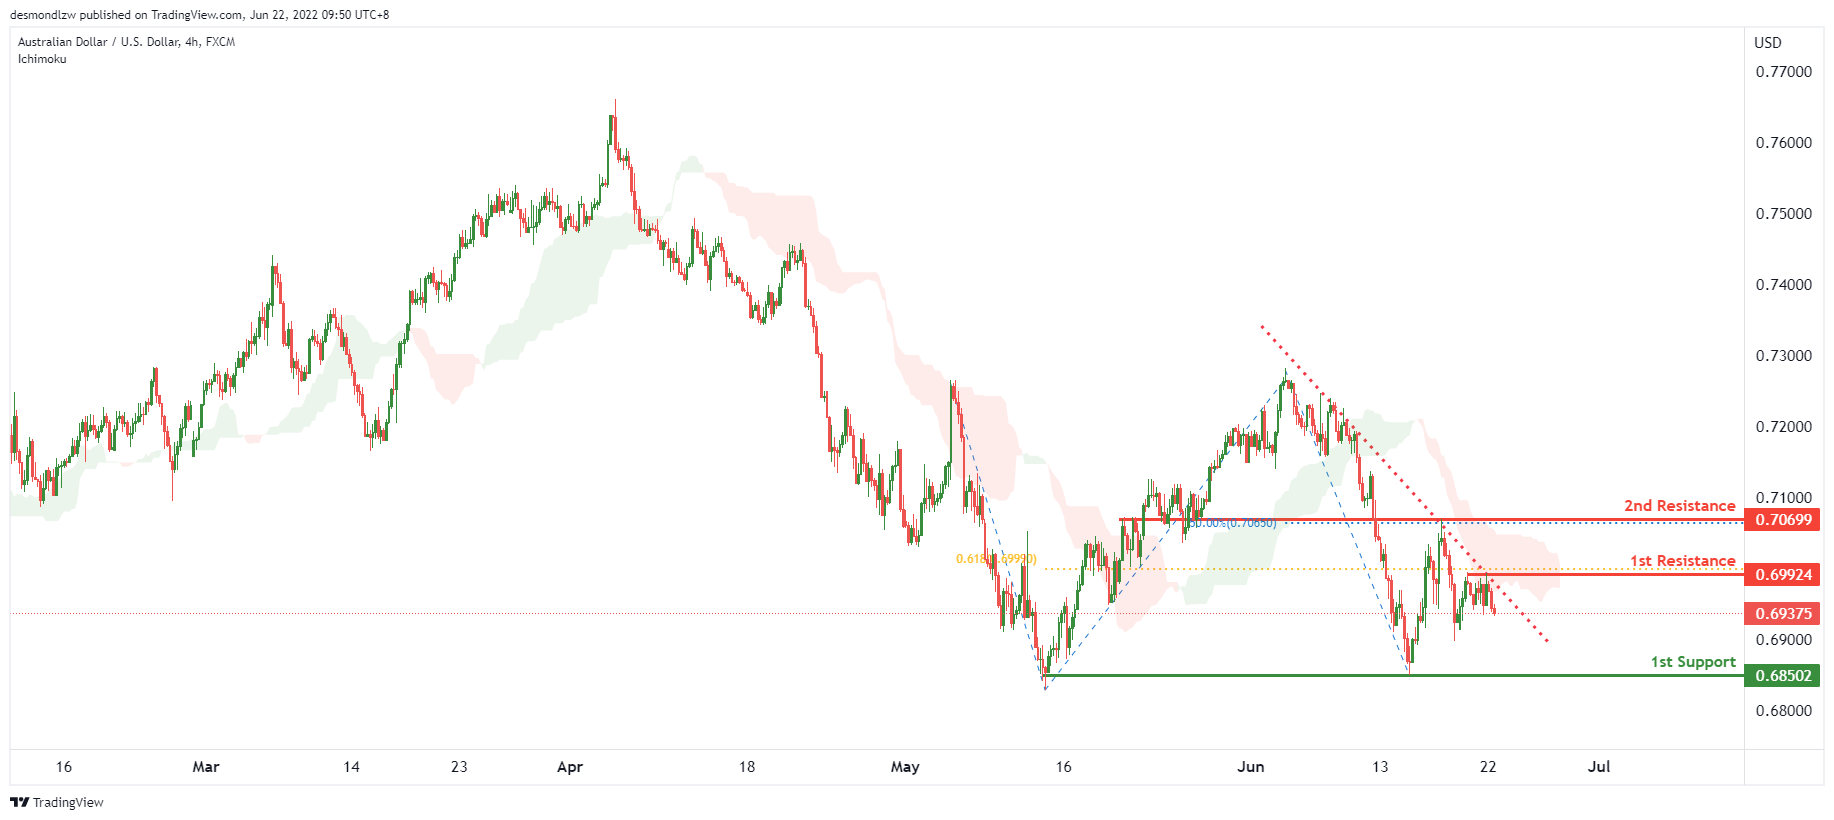
On the H4, with price moving below the icihimoku cloud and in a descending trendline, we have a bearish bias that price will continue to drop from the 1st resistance at 0.69924 in line with the 61.8% fibonacci projection to the 1st support at 0.68502 at the horizontal swing low. Alternatively, price may reverse off the 1st resistance and rise to the 2nd resistance at 0.70699 in line with the pullback resistance and 50% fibonacci retracement.
Areas of consideration
- H4 1st resistance at 0.69924
- H4 1st support at 0.6850
NZD/USD:
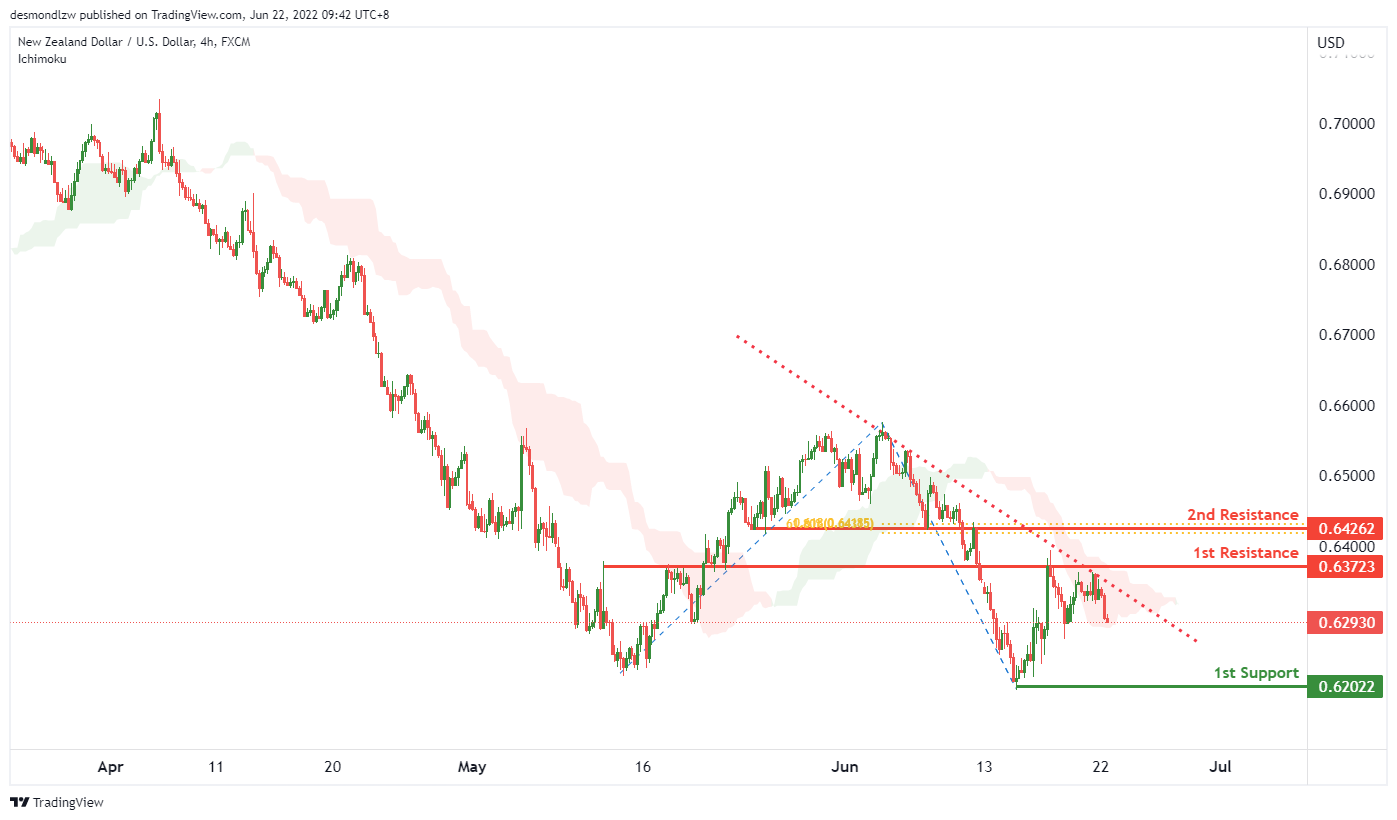
On the H4, with price moving within the ichimoku cloud and in a descending trendline, we have a bearish bias that price will drop from the 1st resistance at 0.63723 at the pullback resistance to the 1st support at 0.62022 at the horizontal swing low. Alternatively, price may reverse off the 1st resistance and rise to the 2nd resistance at 0.64262 in line with the 61.8% Fibonacci projection and 61.8% Fibonacci retracement.
Areas of consideration:
- H4 time frame, 1st support at 0.62022
- H4 time frame, 1st resistance at 0.63723
USD/CAD:
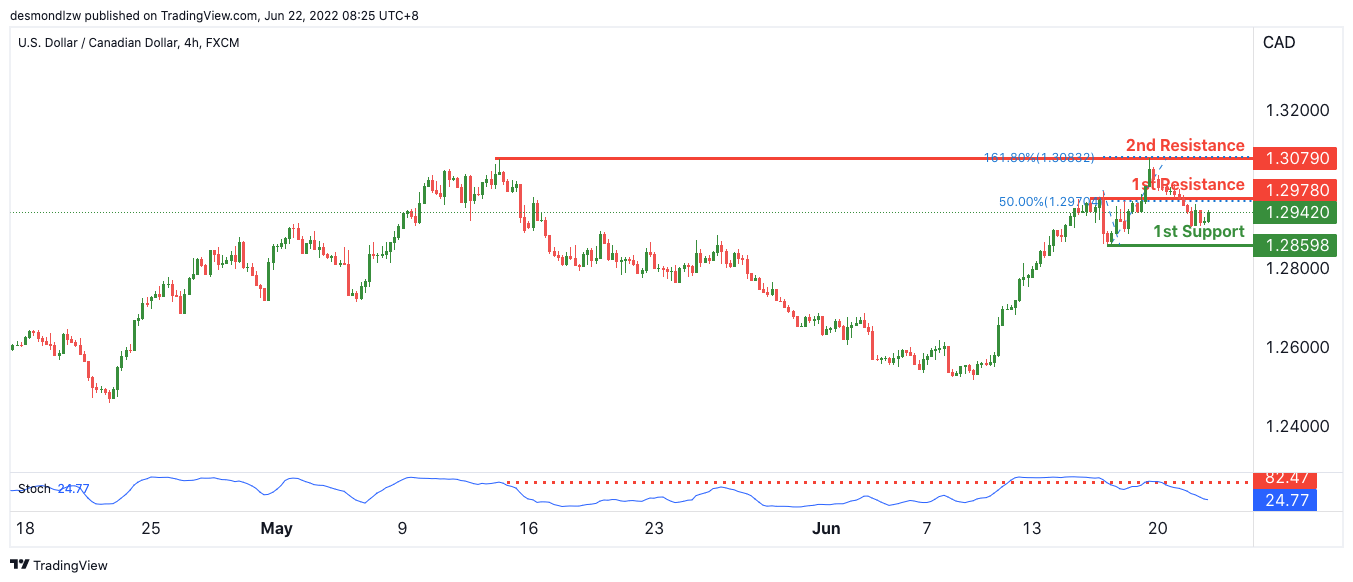
On the H4, with price expected to reverse off the stochastics indicator, we have a bearish bias that price will rise from our 1st resistance where the 50% Fibonacci retracement is to our 1st support at 1.28598 in line with the horizontal pullback support and 50% Fibonacci retracement. Alternatively, price may head for 2nd resistance where the horizontal swing high resistance and 161.8% Fibonacci projection is.
Areas of consideration:
- H4 time frame, 1st resistance at 1.30780
- H4 time frame, 1st support at 1.28598
OIL:
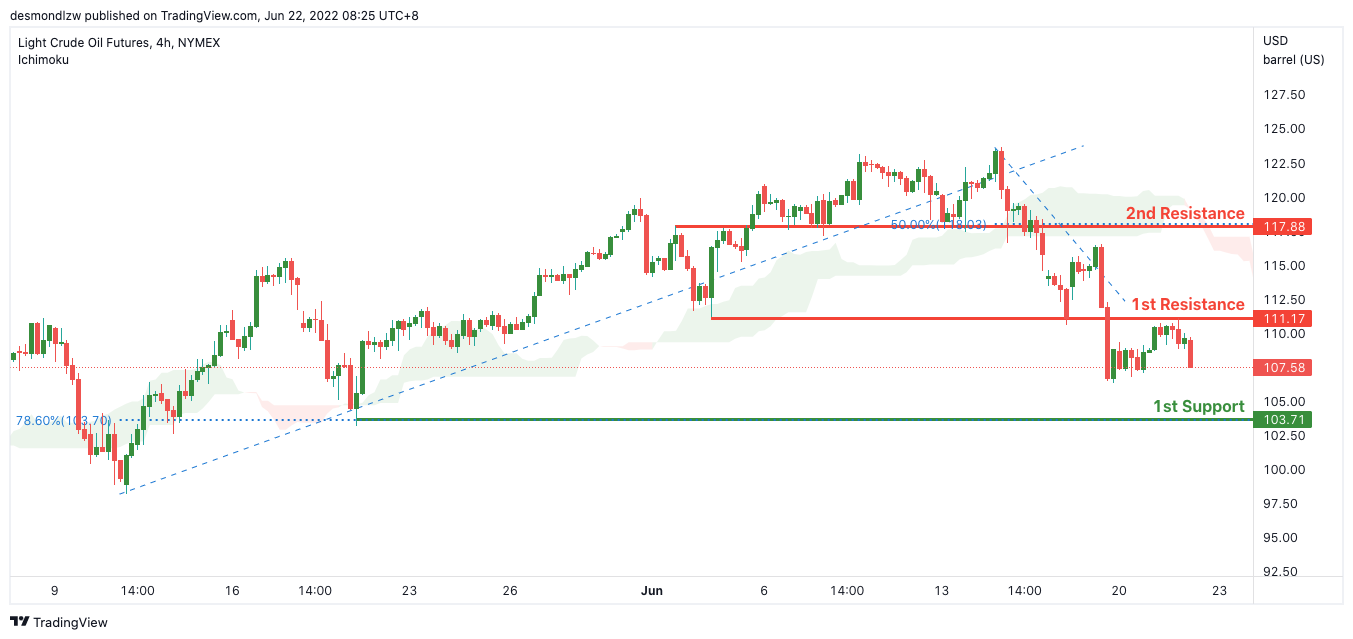
On the H4, with price moving below the ichimoku cloud, we have a bearish bias that price will rise from our 1st resistance at 111.17 where the horizontal pullback resistance is to our 1stsupport at 103.71 in line with the horizontal swing low support. Alternatively, price may head for 2nd resistance where the horizontal pullback resistance and 50% Fibonacci retracement is. Take note that we are waiting for the break of 1st resistance to confirm the bearish continuation.
Areas of consideration:
- H4 time frame, 1st resistance of 112.51
- H4 time frame, 1st support of 103.71
Dow Jones Industrial Average:
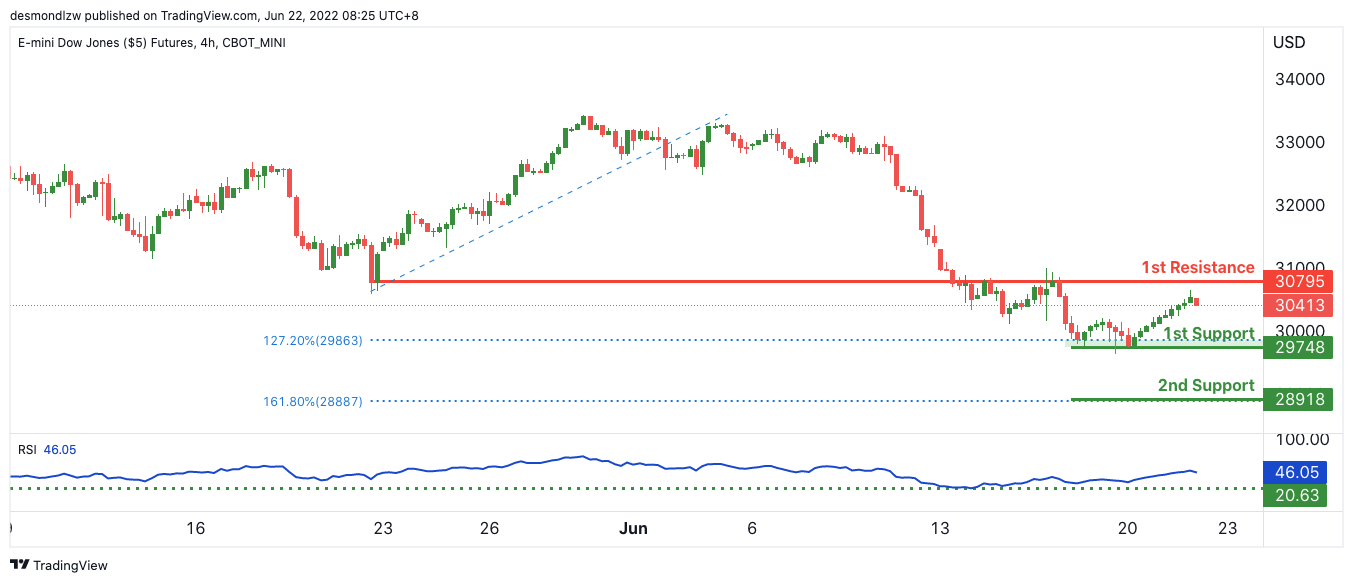
On the H4, with price expected to bounce off the stochastics indicator, we have a bullish bias that price will rise from our 1st support at 29748 where the 127.2% Fibonacci extension is to our 1st resistance at 30795 in line with the horizontal pullback support. Alternatively, price may break structure and head for 2nd support where the 161.8% Fibonacci extension is.
Areas of consideration :
- H4 time frame, 1st resistance at 30795
- H4 time frame, 1st support at 29748
Bitcoin Reclaims $20,000 after Weekend Bloodbath But Downside Risks Linger
Last weekend, Bitcoin collapsed to $17,590, marking the first time ever that the king of cryptocurrencies has fallen below its previous cycle's high. Moreover, Bitcoin is challenging its historical records as it is trading below its 200-week simple moving average (SMA), which was essentially the bottom of all its previous bear markets. Although monetary tightening and regulatory woes continue to undermine cryptocurrencies' prospects, investors are increasingly tilting towards the idea that the market is currently hovering near its bottom. Does the recent bounce indicate that history will repeat itself or is there further downside on the menu?
Macro headwinds weigh on cryptos
Since the beginning of 2022, a barrage of negative developments has negatively affected the performance of risky assets. The persistently high inflation that is increasingly eroding people's disposable income combined with the aggressive monetary tightening and mounting fears over a recession have dented investors' risk appetite.
On top of that, the recent sell-off has triggered a massive round of liquidations to cover margin calls, which has further deteriorated the downfall. Specifically, investors who stepped into the market with leverage have been forced to offload their positions, while companies that used cryptocurrencies as collateral for granting loans have suffered the same fate. This debt swirling around crypto markets has amplified recent declines, which are further bolstered by constrained liquidity as crypto exchanges have been suspending transfers and withdrawals.
Cryptocurrency industry jitters accelerate fall
Many cryptocurrency-related companies have announced mass layoffs amid fears of an upcoming 'crypto winter', which is anticipated to deal a significant blow to their financial performance. More precisely, the US exchange platform Coinbase announced that it is going to sack 1,100 employees due to the broader market downturn. Furthermore, Gemini, a cryptocurrency exchange is planning to reduce its workforce by 10%, while the online app Crypto.com will cut 5% of its staff.
Additionally, following Celsius and Binance, Babel Finance - a Hong Kong-based crypto lender - paused withdrawals and redemptions, citing unusual liquidity pressures. Also, a crypto hedge fund called Three Arrows failed to meet its margin calls from lenders, fueling rumours that many crypto-related firms might suffer collateral damage. Overall, as crypto companies continue to face operational crackdowns and fire personnel, investors' sentiment towards cryptos could continue to deteriorate.
The first short Bitcoin ETF
Eight months after establishing the first US Bitcoin ETF, the investment provider ProShares announced on Monday that it plans to launch the first short Bitcoin-linked ETF by next week. This investment vehicle will be designed to allow investors to gain from declines in Bitcoin's price or enable them to hedge their spot crypto holdings.
Is this the bottom?
The recent sharp sell-off in crypto markets caused Bitcoin's price to fall to a fresh 2022 low and slash through its 200-week SMA for the first time since March 2020, before bouncing back slightly.
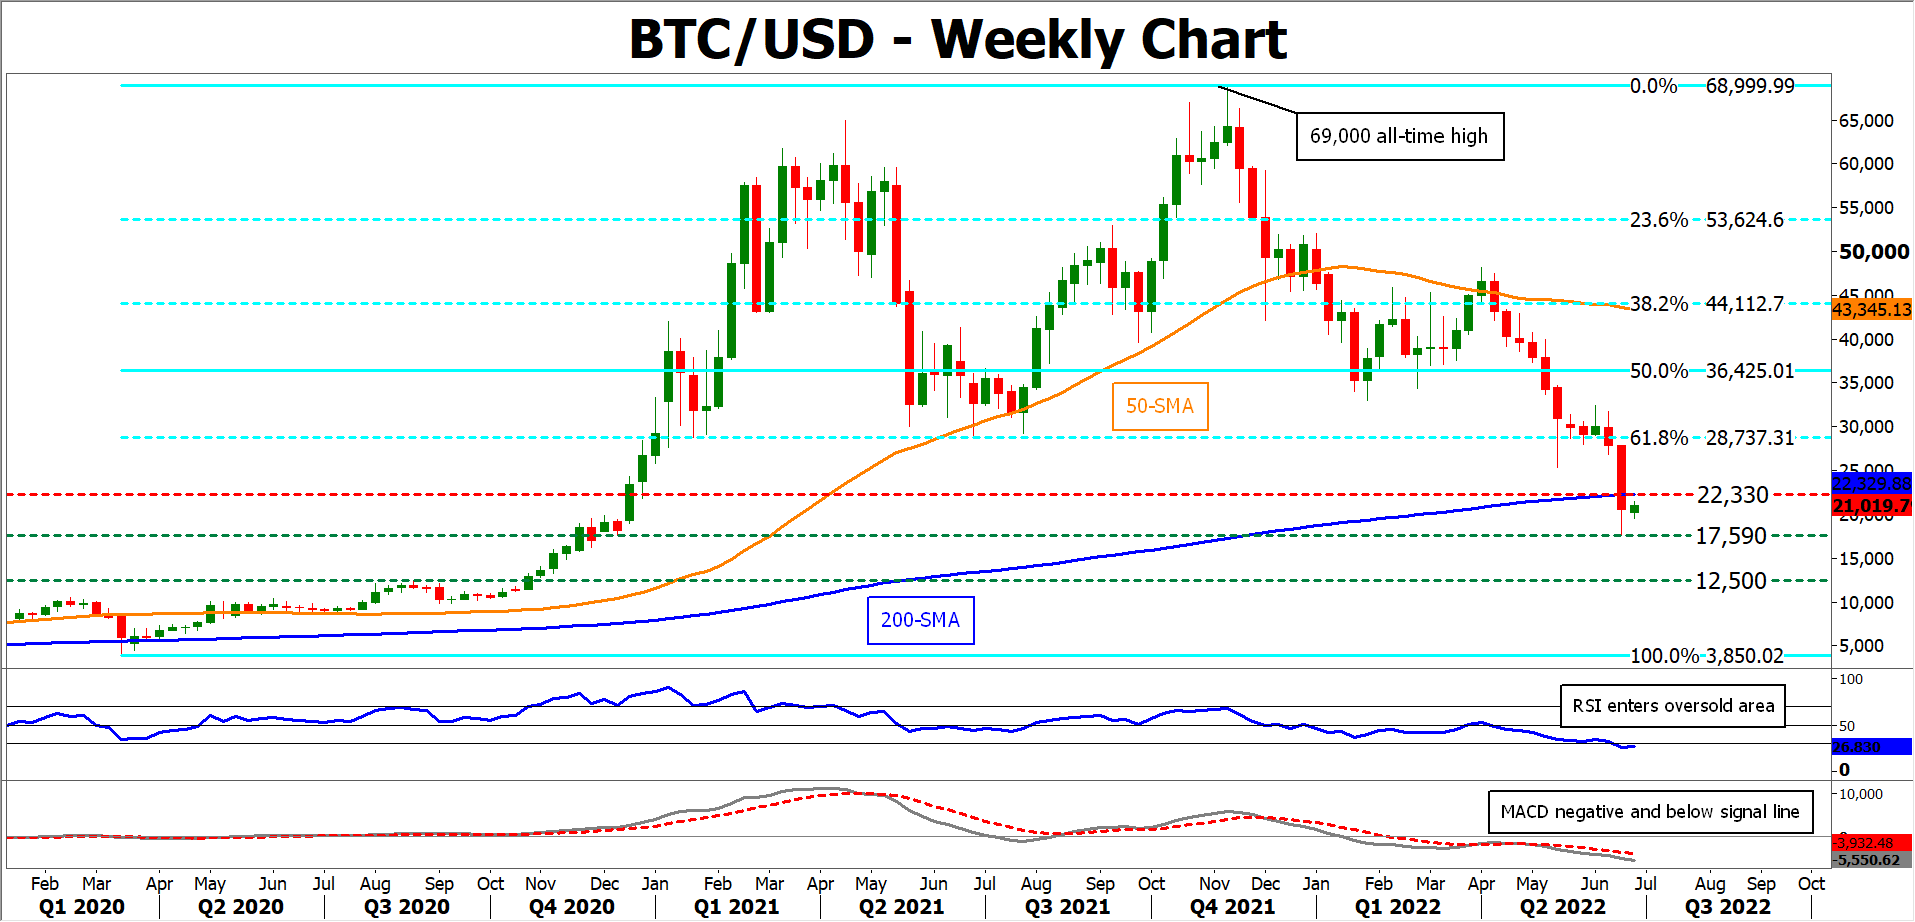
Should negative momentum strengthen, the recent low of $17,590 may act as the first line of defense. Failing to halt there, the price could descend to form fresh multi-year lows and the next crucial barrier could be met at the August 2020 resistance of $12,500.
To the upside, bullish actions might encounter initial resistance at the 200-week SMA, currently at $22,330. An upside violation of the latter may open the door for the $28,737 level, which is the 61.8% Fibonacci retracement of the 3,850-68,999 upleg.
Elliott Wave View: Further Downside in Nasdaq
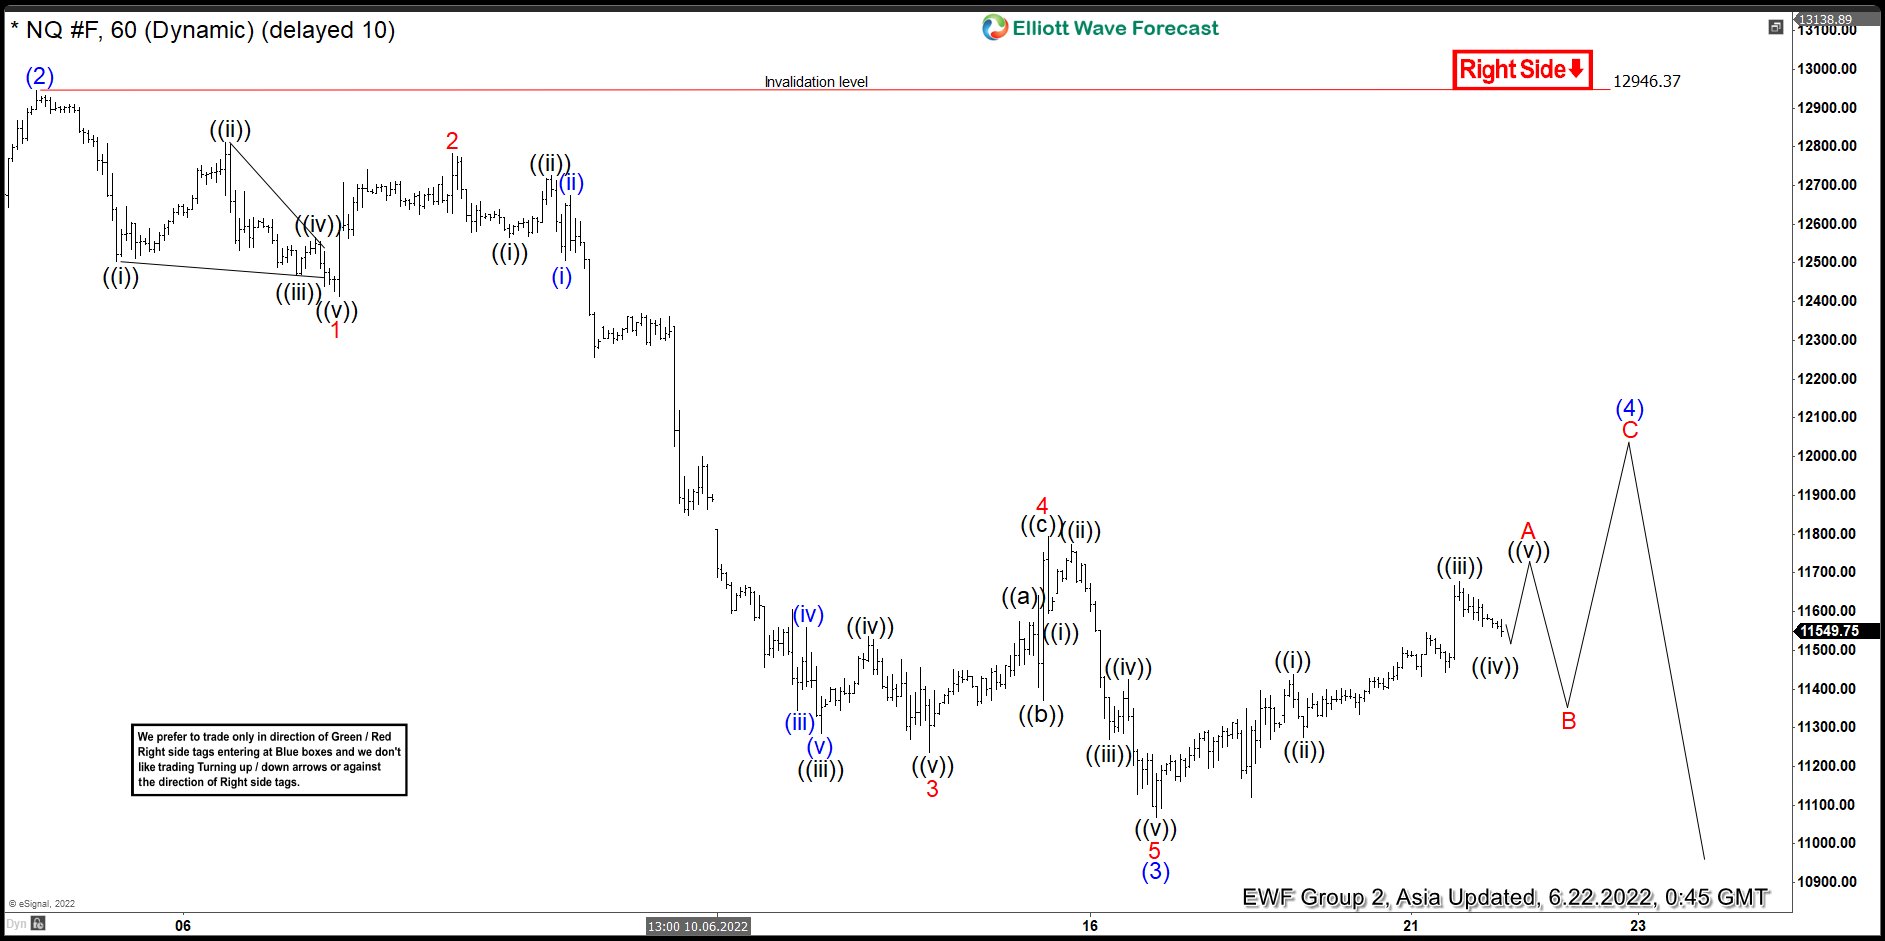
NASDAQ ($NQ) broke below previous low on 5/20/2022 at 11490.50 and opens up a bearish sequence favoring further downside. The entire decline from 11/22/2021 high is unfolding as a zig zag Elliott Wave structure. A zig zag structure is a 3 swing corrective structure where A, B, and C subdivides into 5-3-5 waves. Down from 11/22/2021 high, wave ((A)) ended at 13024.50, and rally in wave ((B)) as expanded flat ended at 15275.75. Index then extended lower with subdivision as an impulse in wave ((C)). Wave ((C)) has internal subdivision of 5 waves.
The 60 minutes chart below shows the decline from wave (2) of ((C)) high unfolded as an impulse Elliott Wave structure to complete wave (3) of ((C)). Down from 12966.37, wave 1 ended at 12412.14 and rally in wave 2 ended at 12786.04 Index then extended lower in wave 3 towards 11235.06. Rally in wave 4 finished at 11794.52 and last push lower to complete wave 5 of (3) ended at 11068.88. Currently the Index is rallying in 3 swing higher in wave (4) before the decline resumes as far as pivot at 12966.37 stays intact.
Nasdaq ($NQ) 60 Minutes Elliott Wave Chart
Brent Wave Analysis
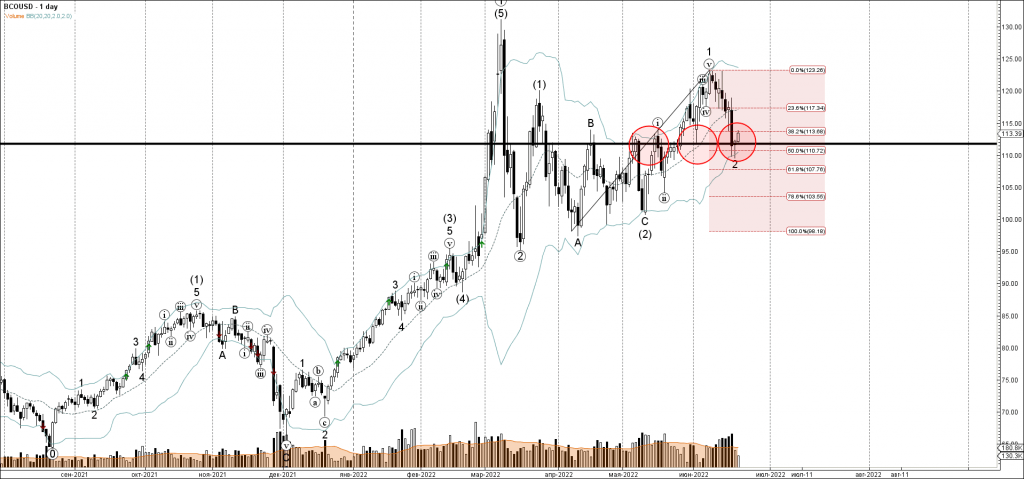
- Brent reversed from key support level 111.80
- Likely to rise to resistance level 115.00
Brent crude oil earlier reversed up from the key support level 111.80 (former strong resistance from April and May) – which completed the earlier correction 2.
The support level 111.80 was further strengthened by the lower daily Bollinger Band and by the 50% Fibonacci correction of the upward impulse from April.
Given the predominant daily uptrend, Brent crude oil can be expected to rise further toward the next resistance level 115.00.
USDJPY Wave Analysis
- USDJPY broke key resistance level 135.50
- Likely to rise to resistance level 137.25
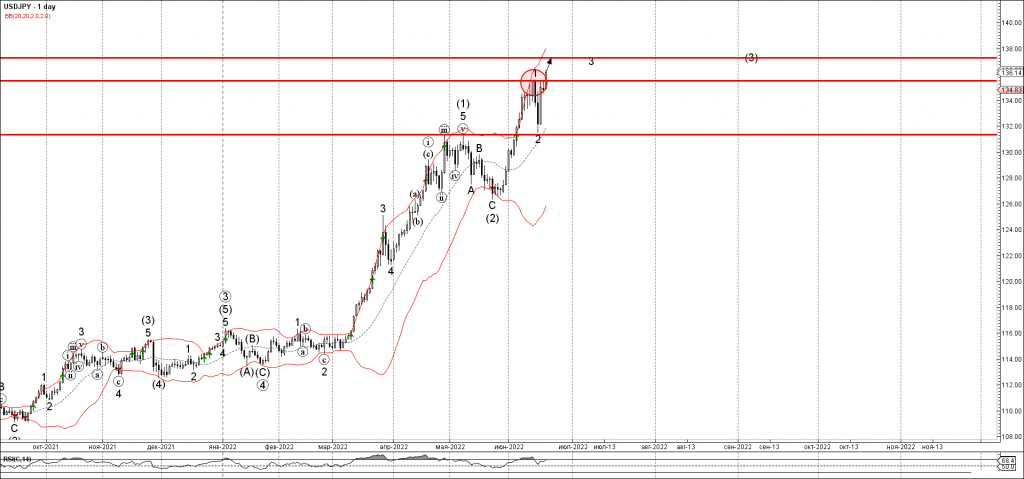
USDJPY currency pair today broke above the key resistance level 135.50 (which stopped the earlier minor impulse wave 1 at the start of June).
The breakout of the resistance level 135.50 should accelerate both of the active impulse waves 3 and (3).
Given the clear daily uptrend and the continued yen outflows, USDJPY currency pair can be expected to rise further toward the next resistance level 137.25 (target for the completion of the active minor impulse wave 3).
Eco Data 6/22/22
[php_everywhere instance="1"]
Eurozone PMIs: Slowing Down But No Recession Yet
The flash PMI releases by S&P Global are one of the monthly highlights of the Eurozone calendar as the forward-looking indices tend to track GDP growth in the euro area quite closely. The first look at the June readings is due Thursday (08:00 GMT) and investors will be scouring for clues about how close the Eurozone economy is to stagflation. The forecasts suggest the danger is quite low for now. But can the data offer the bruised euro any relief?
No let-up in energy crisis
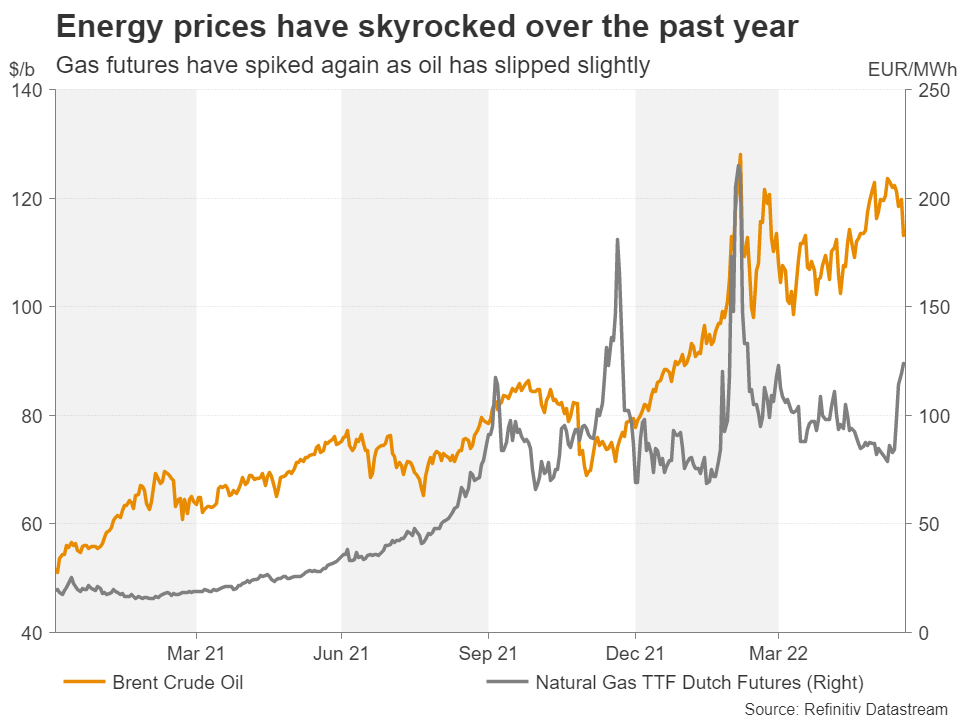
Ever since the war in Ukraine erupted, there has been no let-up in Europe’s energy crisis. Just as oil prices have started to pull a little lower, gas futures are spiking again after Russia began to reduce shipments to major European buyers. The prospect of energy prices staying elevated for longer does not bode well for the monetary policy outlook.
The European Central Bank is almost certain to hike interest rates by 25 basis points at its July meeting and calls for a larger increase in September are growing louder. Although the policy paths of the ECB and Federal Reserve have diverged significantly this year, the two central banks are similar in that they are both leaning against the strength of their respective economies as they plough ahead with tightening policy during these highly uncertain times.
Eurozone GDP grew a lot faster than projected in the first quarter, but inflation has also been a lot stronger than anticipated; the headline CPI rate hit 8.1% y/y in May. The massive energy-driven surge in inflation since the beginning of the year combined with a surprisingly resilient economy make it all the more likely that the ECB will hike interest rates very aggressively over the coming months.
Still expanding
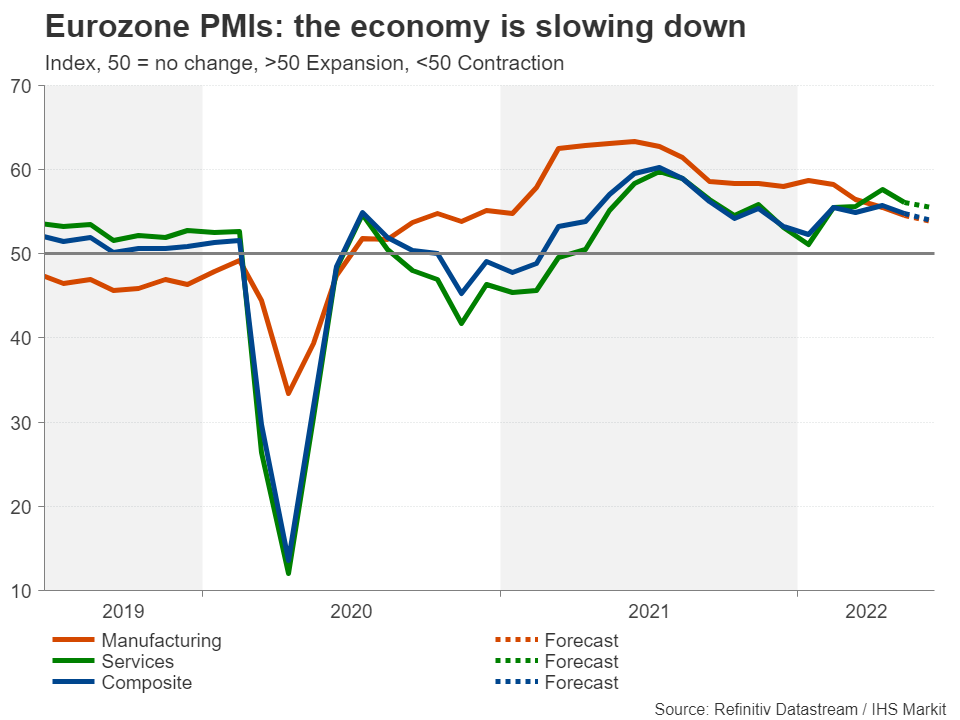
But this would carry a lot of risks as raising rates too rapidly could choke off economic growth. Survey data already point to some loss of momentum. The euro area’s composite PMI, consisting of the manufacturing and services sectors, fell slightly to 54.8 in May and is expected to have moderated further in June to 54.0. The slowdown in manufacturing seems to be more pronounced amid the shift to services, as European economies fully reopen, as well as the ongoing supply constraints. The manufacturing PMI could hit the lowest in June since November 2020.
Nonetheless, stagnation does not appear to be on the near-term horizon, let alone a recession. Even Europe’s rigid labour market has come out of the pandemic in stronger shape than before, giving policymakers additional credence to begin normalizing policy.
Euro is bouncing higher, but does it have enough legs?
Should the June PMIs underscore the view that the Eurozone economy is merely losing steam but is far from recessionary territory, the euro could extend its latest bounce back. Euro/dollar is currently testing the 50% Fibonacci retracement of the May uptrend at $1.0567. A climb above this level would bring into focus the 50-day moving average, which is about to intersect the 38.2% Fibonacci of $1.0619, before traders turn their attention to the May peak of $1.0786.
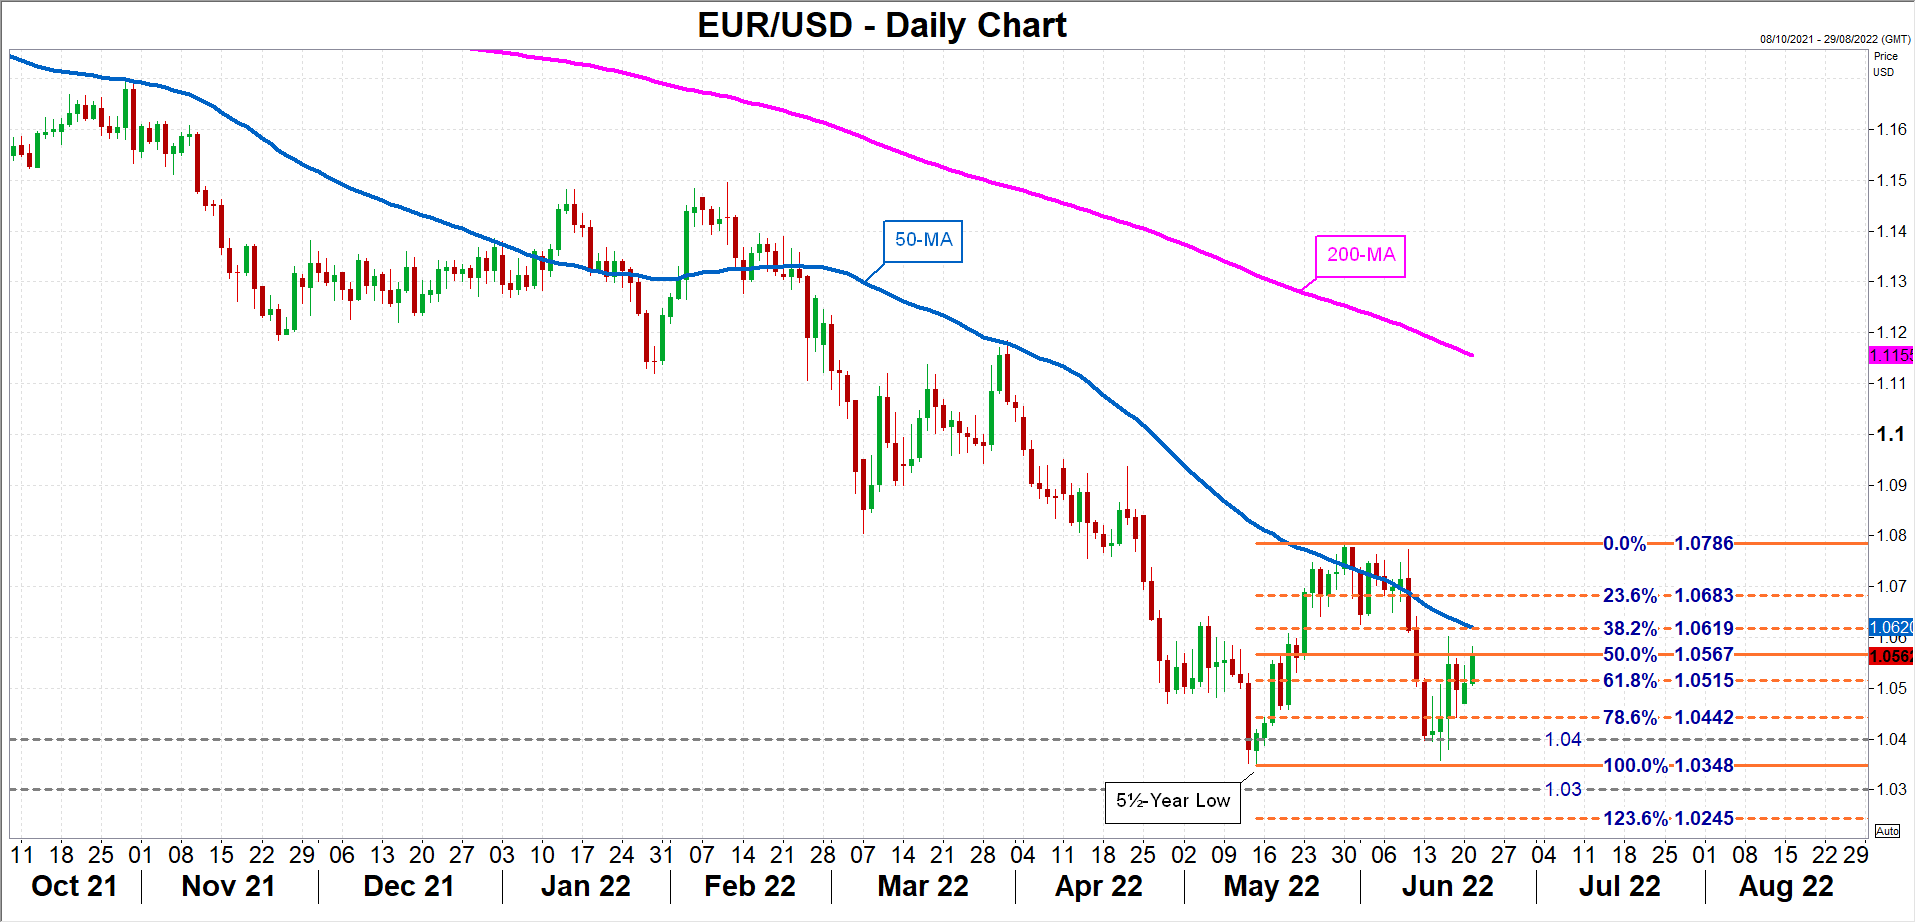
However, any negative shocks in the PMI data could cause the rebound to falter, risking a re-test of the $1.04 level. Breaching this support could accelerate the selloff initially towards the May tough of $1.0348 and then towards the 123.6% Fibonacci extension of $1.0245.
In the somewhat more medium term, the euro is likely to consolidate during the course of the summer as investors will be watching how the growth and inflation outlooks evolve for clues as to how aggressively the ECB will act later in the year. Though, whether the Fed remains as hawkish as it currently is will be just as crucial in determining the euro’s direction.