Sample Category Title
USD/JPY: Bulls Pausing Under New Multi-Year High Before Fresh Push Higher
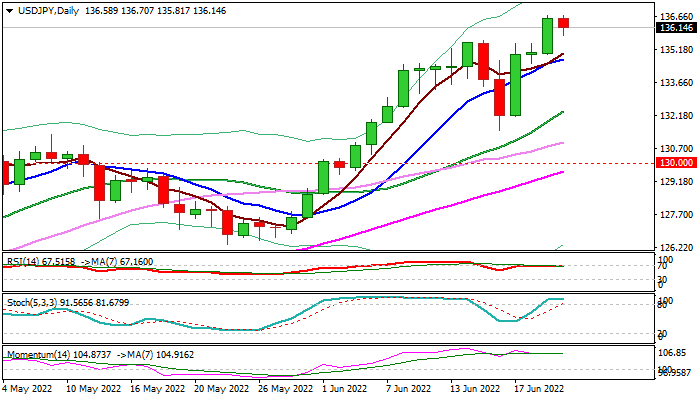
The USDJPY is taking a breather under new 24-year high on Wednesday, as overbought conditions prompt some profit-taking after the pair advanced 3.3% in past three days and traded at levels last seen in 1998.
Overall picture shows bulls fully in play, as dollar remains well supported by strong safe-haven demand, expectations for Fed to remain hawkish in coming months and weakness of its major counterpart.
Shallow dips signal positioning for fresh push higher, with former top at 135.57 and rising 10DMA (134.73) to ideally contain.
Fibonacci projections at 137.13 and 138.09 mark next target, with violation of the latter to unmask psychological 140 barrier.
Res: 136.70; 137.13; 137.61; 138.09.
Sup: 135.81; 135.57; 134.73; 134.09.
JP 225 index maintains cloudy outlook
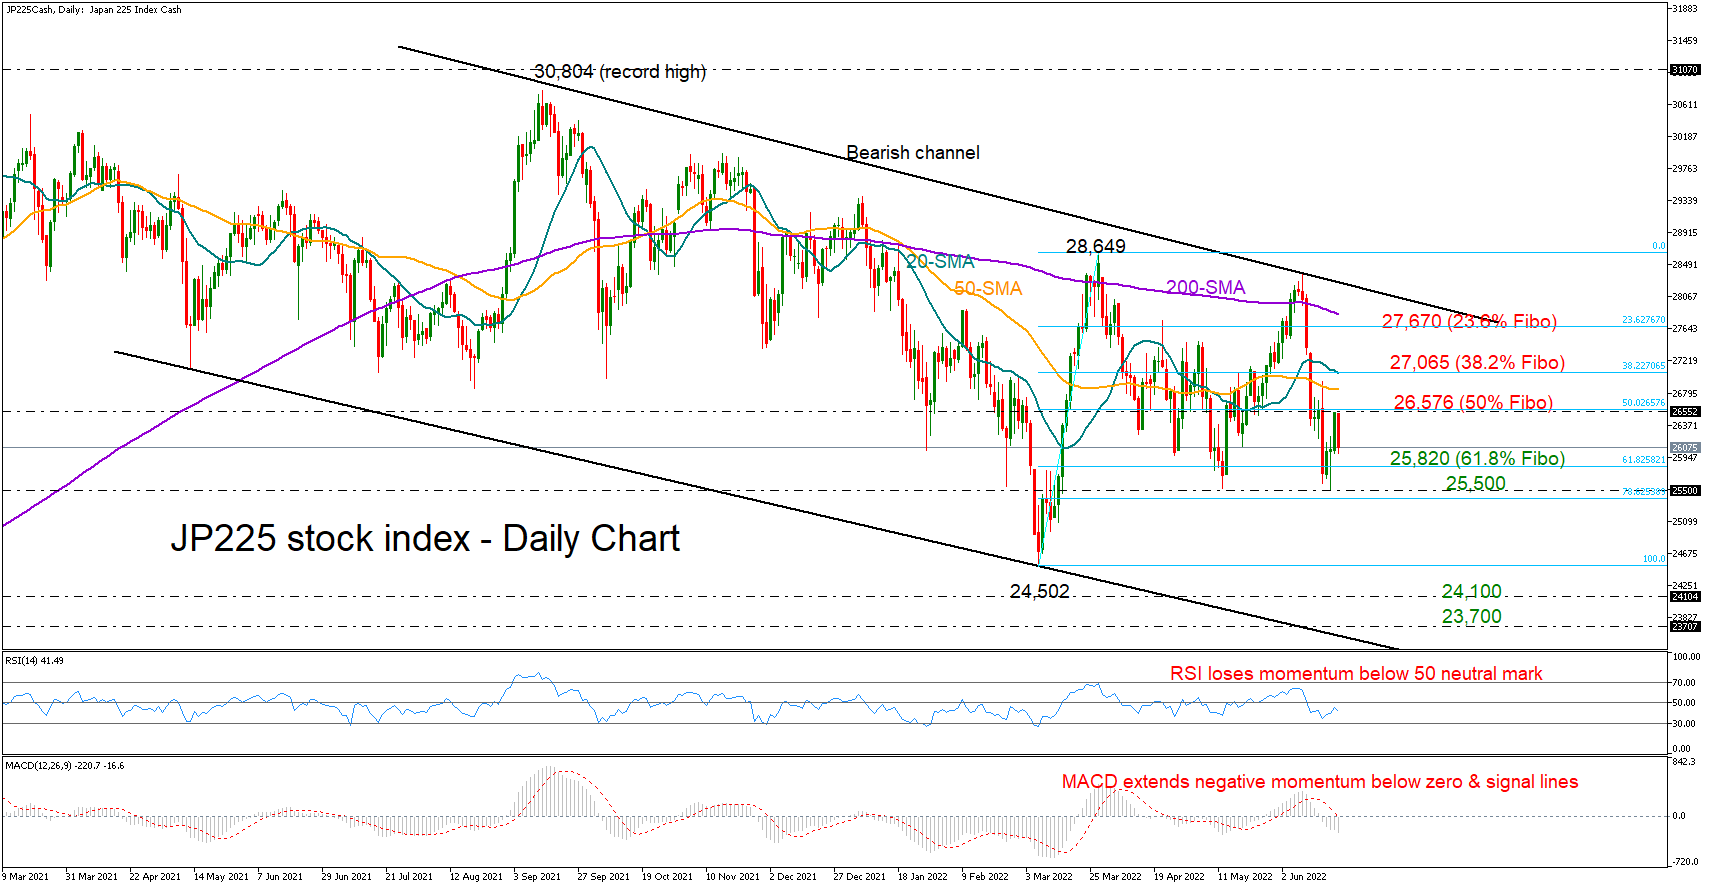
Japan’s 225 stock index (cash) got rejected near the 50% Fibonacci retracement of the 24,500 – 28,649 upleg at 26,576 soon after departing from May’s base of 25,508.
The bearish bias is still in play as the RSI is retracing its latest rebound below its 50 neutral mark, while the MACD keeps extending its negative momentum below its red signal line.
If the 61.8% Fibonacci of 25,820 gives way on the downside, the bears will push harder to escape the trap around 25,508 and pressure the price towards the March 16-month low of 24,502. Even lower, the 2020 resistance territory of 24,100 – 23,700 may attract special attention before all eyes turn to the channel’s lower boundary seen around 23,600.
On the upside, the bulls will need to clear the wall at 26,576 in order to meet the 38.2% Fibonacci level at 27,065. The 23.6% Fibonacci of 27,670 and the 200-day simple moving average (SMA) could be the next obstacles on the way up, though a decisive close above the bearish channel at 28,000 will be more meaningful, especially if the index officially violates its downtrend above the March high of 28,649.
All in all, the short-term risk for Japan’s 225 index is skewed to the downside, with traders likely looking for support within the 25,800 - 25,500 zone during the coming sessions.
UK Inflation Indicates that Bank of England is Moving Too Slow
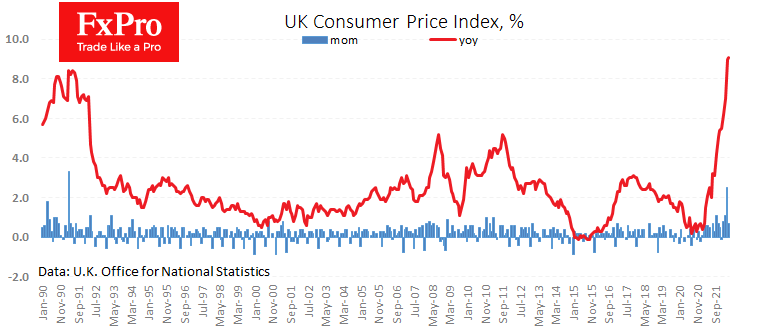
Consumer inflation continues to gain momentum in the UK. Data for May showed that CPI accelerated to 9.1% y/y – a record among the G7 and a 40-year high. The monthly price growth rate was 0.7% compared to 2.5% and 1.1% in the previous two months. However, apart from the reversal to lower base commodity and energy prices in the last couple of weeks, there is little indication that the Bank of England can relax. Moreover, it needs to double the pace of the rate increase from 25 points at once.
Last month producer input prices rose by 2.1% and output prices by 1.6%, reaching an annual rate of 22% and 15.6%, respectively. Under these conditions, producers and retailers will continue to pass increasing costs down to consumers. Unlike in the early years after the financial crisis, retail sales and employment are strong, which allows such a shift of rising outlays to end consumers.
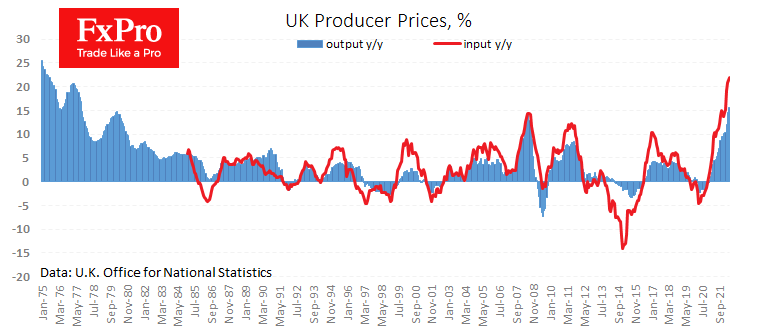
It could take another two months of waiting for a turning point in inflation, the CPI will reach a high base effect, and in that time, the CPI could get double-digit y/y growth rates.
In this environment, the Bank of England’s moves to raise the rate by 25 points at each meeting are not capable of curbing inflation.
Perhaps the main positive effect of this policy is the devaluation of the pound’s purchasing power and the reduction of the debt burden in real terms. However, the more obvious consequence of such policies is a drop in confidence in local financial markets and the pound, which we see with the Japanese yen at its lows against the dollar in 24 years.
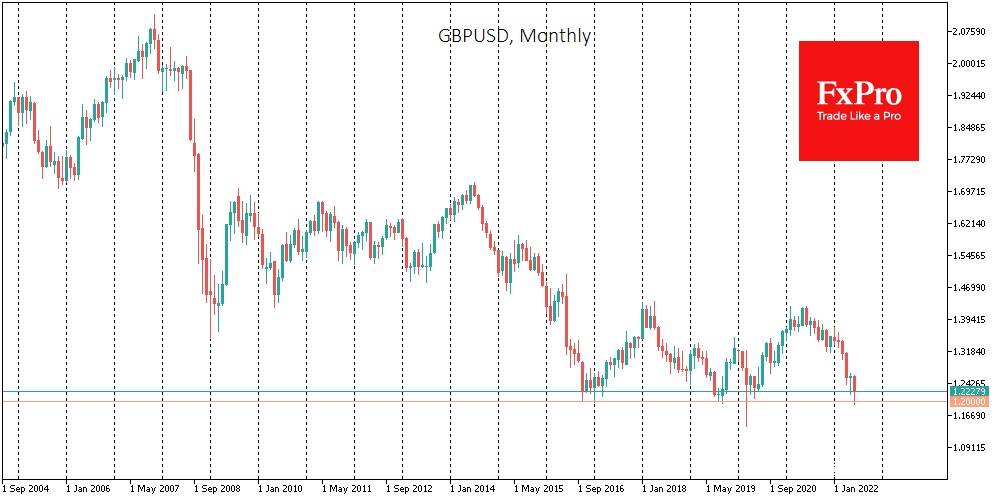
GBPUSD is now trading at 1.22 – near the psychological low of 1.2000, where it received critical support in 2017 and 2020. But that support may not survive the third test of strength due to an increasingly threatening gap between inflation and interest rates, which would devalue debt. But this is a risky policy that could undermine confidence in the financial system, which will require decisive and brutal measures for the economy to restore.
WTI Oil: Oil Price Falls Over $5 as US Biden Pushes for Lower Fuel Prices
WTI oil fell sharply on Wednesday, losing around 5.6% in Asian and early European session, following push by US President Biden to bring down soaring fuel prices, which cause a huge problem to Americans as the summer driving season started.
The measures include pressure on America’s major energy companies to drive down fuel prices as they made huge profits and a call for temporary suspension of a federal tax on gasoline.
Representatives of oil companies are set to meet President Biden tomorrow, as many already complained about measures, but the immediate response from the White House left no space for oil producers to escape from the plan.
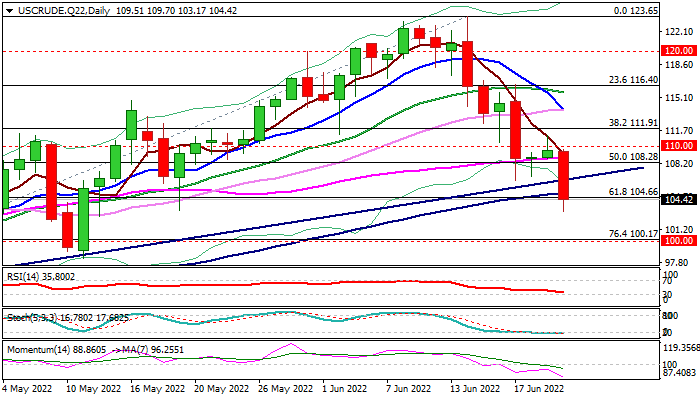
Daily chart shows a number of large bearish candles, signaling the near-term price action is in steep downtrend, which extends into the second straight week, after last week’s 12% drop that completed a reversal pattern on weekly chart.
Weak daily studies complement negative fundamentals, as bearish momentum continues to strengthen and the latest fall broke through important technical supports at: $106.55 (trendline support), $105.07 (100DMA) and $104.66 (Fibo 61.8% of $92.92/$123.65) with close below these levels to boost negative signals.
Bears could stretch towards $100 zone (Fibo 76.4% / psychological) on persisting negative sentiment, with corrective upticks on oversold conditions and profit-taking, to offer better levels to re-join bearish market.
Broken bull-trendline offers solid resistance at $106.55) which should ideally cap and guard upper pivots at $108.28 /$110.00 (broken Fibo 50% / psychological).
Res: 105.08; 105.68; 106.55; 108.28.
Sup: 103.17; 102.65; 100.17; 100.00.
ECB de Guindos: Fragmentation instruments should not interfere with monetary policy approach
ECB Vice-President Luis de Guindos said today "fragmentation is a significant worry." The central bank is " speeding up process to ready a tool against fragmentation," but the governing council has "still not discussed the details yet".
But he emphasized, "fragmentation instruments should not interfere with the overall monetary policy approach, which should be focused on fighting inflation." Also, the new tool should be different to previous PEPP, APP or OMT programs as "circumstances are not the same.
Cryptocurrencies are Attracting Investors, But it Will Pass
Bitcoin rallied from $20.5K to $21.6K during the day on Tuesday but later reversed to decline and went back on Wednesday morning. Ether corrected deeply, losing 4.4% over the last 24 hours. The top ten altcoins showed mixed dynamics, ranging from a 6.5% decline (Solana) to a 3.6% gain (Dogecoin).
Total crypto market capitalisation, according to CoinMarketCap, declined 1.9% to $900bn. Bitcoin’s dominance index dropped 0.2 points to 43.5%. The Cryptocurrency Fear and Greed Index is up 2 points to 11 by Wednesday and remains in a state of “extreme fear”.
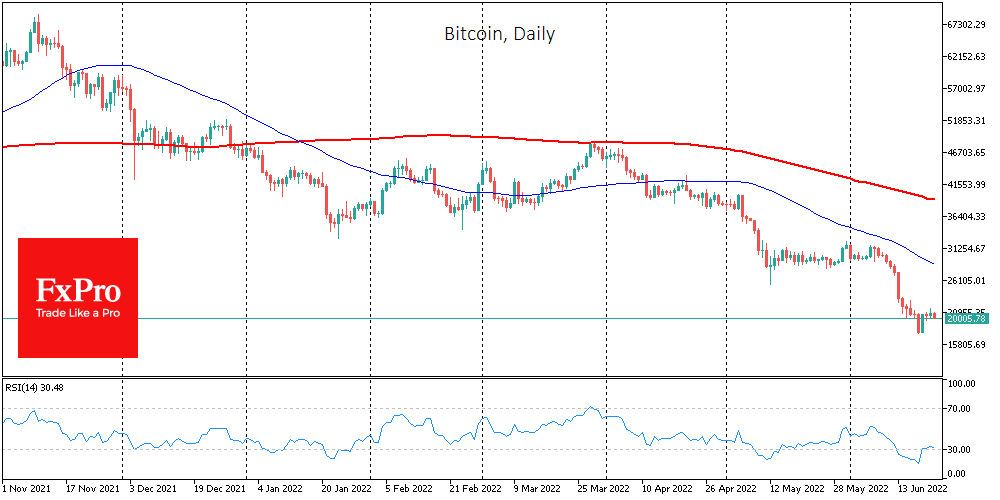
After a strong move down last week and a retreat from the extremes on Sunday, BTCUSD failed to gain ground with buyers and remained pegged at the round level of $20K.
Bitcoin’s recent drop below $20K triggered a new wave of deleveraging and liquidations that affected miners and long-term investors, Glassnode claims.
Ethereum co-founder Vitalik Buterin criticised the popular Stock-to-Flow model for predicting bitcoin exchange rates, saying it is wrong and only gives people unwarranted confidence in the predetermination of exchange rate movements.
Investors are buying bitcoin despite the market’s decline. According to CoinShares, crypto funds saw capital outflows of $39m last week, while there were inflows of $28m into BTC.
Investors have, in our view, false confidence in their strengths. It is commonly believed in the media that retail investors were the first to buy out the 2020 bottom and who managed to beat the funds in 2021 using the r/wallstreetbets forum.
But then the Fed and many other central banks, along with governments, were on the buyers’ side, conducting unprecedented policy easing and handing out monetary stimulus. Now they are doing the opposite: rolling back support programmes and raising rates at the highest rate in decades.
Retail shoppers risk being caught swimming against the financial current, which is hardly a successful strategy. History suggests that enthusiasts risk running out of steam soon, being left with depreciating assets, and losing confidence for years that equity or cryptocurrency markets are a worthwhile place for their money.
Daily Technical Analysis
EUR/USD
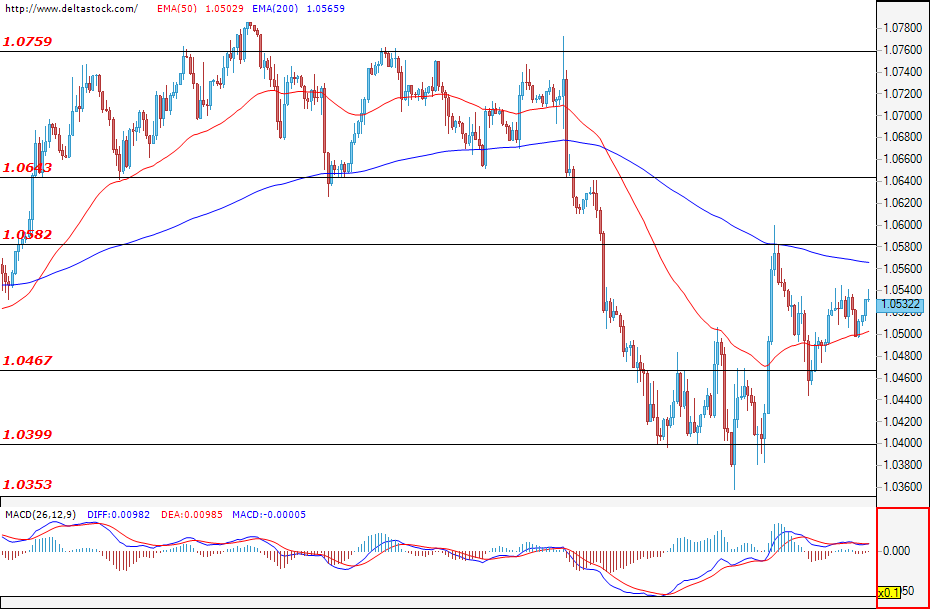
In the early hours of today, the euro was gaining strength against the dollar, and after testing the key levels at around 1.0500 and subsequently bouncing off it, the single European currency continued to grow in value against the greenback after the European session started. A few hours later, it even managed to reach its weekly peak of 1.0582 – a level that was also touched on last week. However, this level played the role of resistance and the bulls gave up on their next attack, as the euro fell to levels at around 1.0535 shortly before the end of the day. Today, there is no data in the macroeconomic calendar that would affect the rate of the euro against the U.S. dollar. Traders will focus their attention on Thursday’s data on German managers’ production and services assessment, scheduled at 7:30 GMT. If we see a high score, this may prompt the bulls to launch a new attack and possibly breach 1.0582, but for now, there is still a high probability that the dollar will continue its upward trend.
USD/JPY
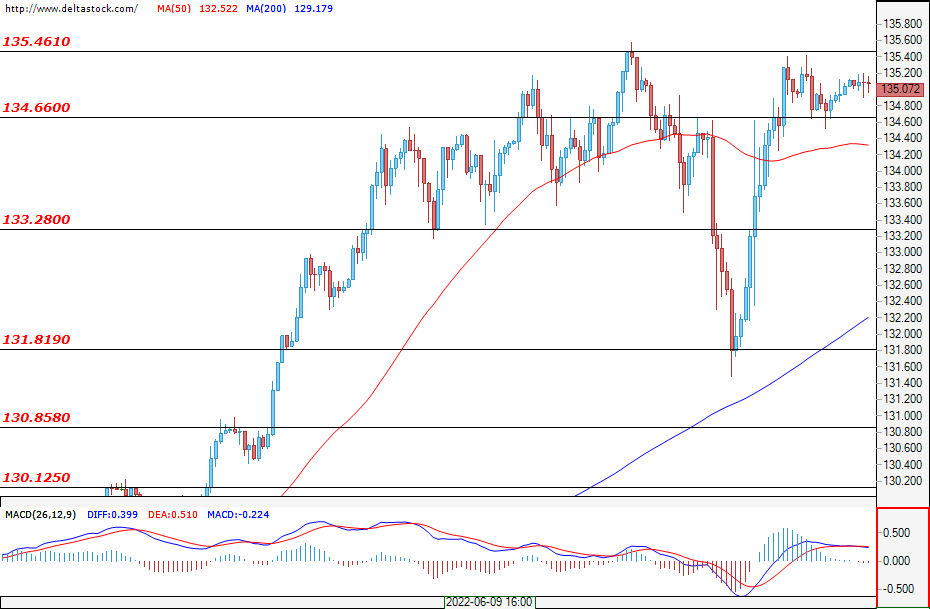
At the moment, it seems like nothing could stop the USD/JPY’s uptrend. The currency pair started its rise in the early hours of today, and sometime around the opening of the European session, it convincingly breached its previous resistance of 135.46 and reached a new monthly peak of 136.68 just before the end of the day. There are currently no expected macroeconomic events that could help the yen to gain some ground and the current trend will most likely be preserved. Of course, market corrections that provide the bulls with convenient entry points are not to be excluded, similar to those of last week which downed the Ninja to 131.80.
GBP/USD
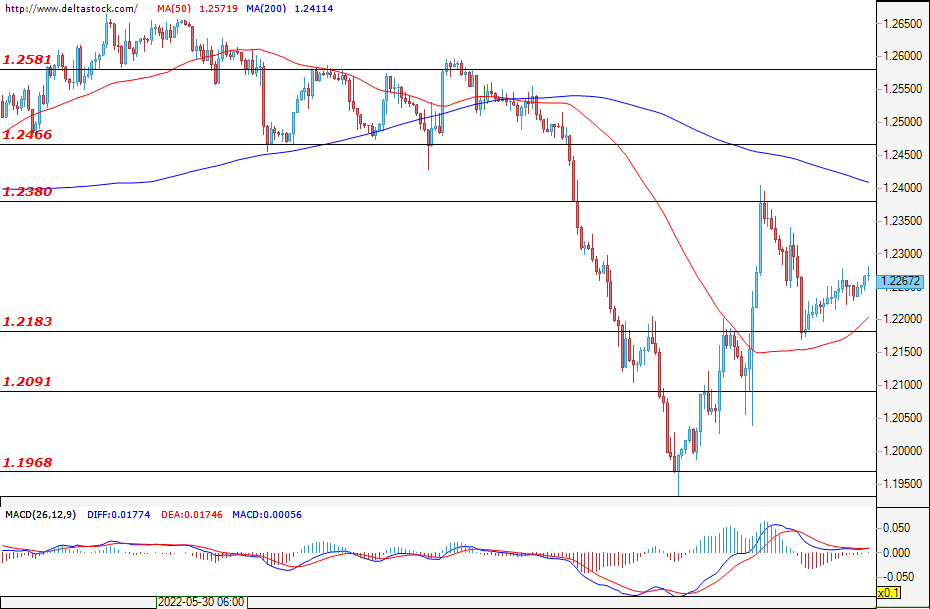
The sterling also managed to take advantage of the weakening dollar and continued its upward trend. After the opening of the London Stock Exchange, we saw a successful bull attack and the currency once again reached its key level of 1.2320 – a level that played the role of resistance throughout the previous week. Today, it played the same role as it stopped the bull attack and the session ended at around 1.2269 as the day drew to a close. Traders will be focusing on the UK’s May inflation data on an annual basis. The macroeconomic calendar will show the information at 6:00 GMTand the movements are expected to come after that. The ongoing trend in the pound will largely depend on the bulls’ and bears’ reaction to а possible further inflation rise.
EUGERMANY40
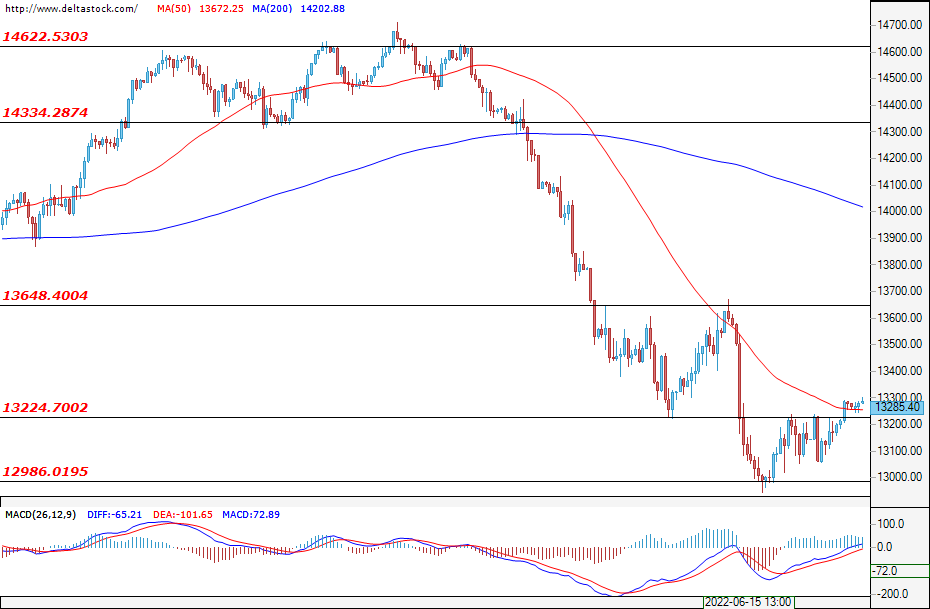
The EUGERMANY40 managed to rise by 240 points, and in the early hours of today and following a short test of the breached level of 13224, the index managed to bounce off it. Before the opening of the U.S. stock market, it also reached a weekly peak of 13439 – a level that, however, played the role of resistance in today's session. At Wall Street’s opening bell, the correlation with the American indices was severed and the German index went into a decline, closing the day at 13258, or around the key level mentioned above. Whether this level will be able to support the price and breach 13439 will largely depend on the market’s reaction to the managers’ German production and services assessment that is due on Thursday at 7:30 GMT.
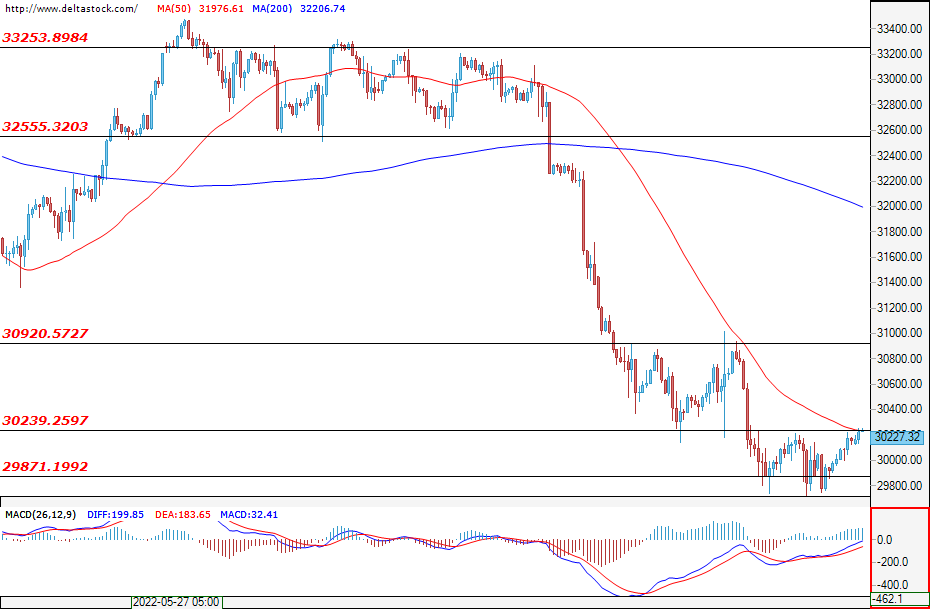
US30
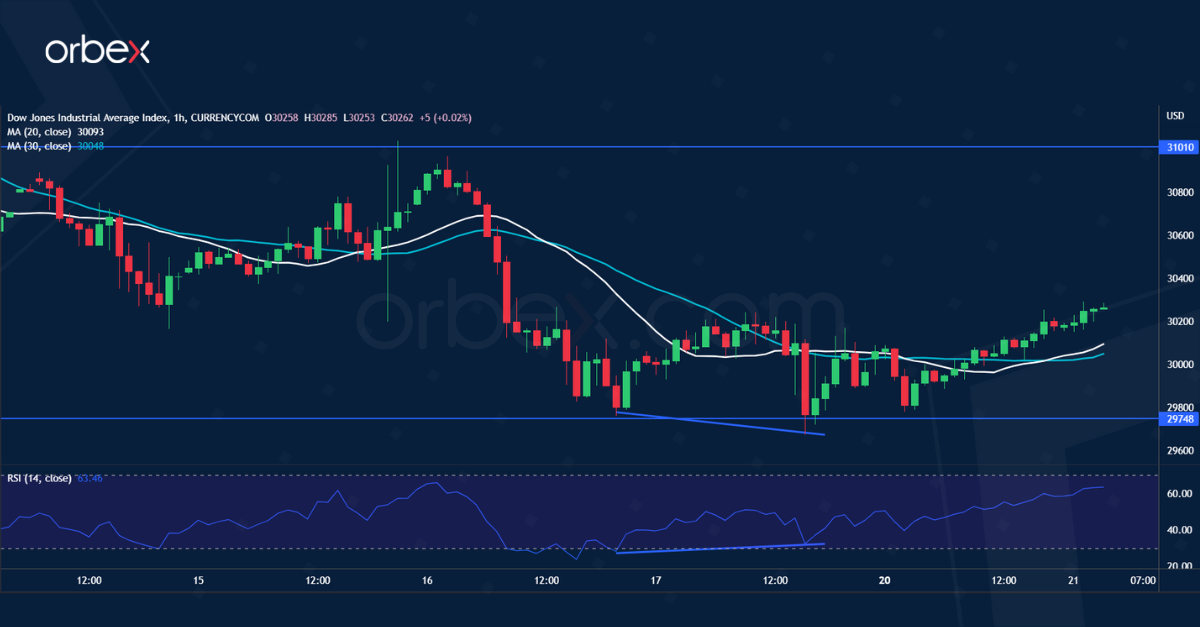
The fall in the dollar managed to positively affect the U.S. stocks as well, allowing the U.S. indices to continue their rally that started on Monday. In the early hours of today, the key resistance at 30239 was breached and the index managed to reach a weekly peak of 30653 shortly before the closing bell on Tuesday. However, since this level played the role of resistance, the closure happened at 30546. Today's statements by Fed chair Jerome Powell at 13:30 GMT may be just what the market needs to fuel a rally, but whether this will end up being just another correction or a new sell-off wave will depend on the reaction of the traders to his comments.
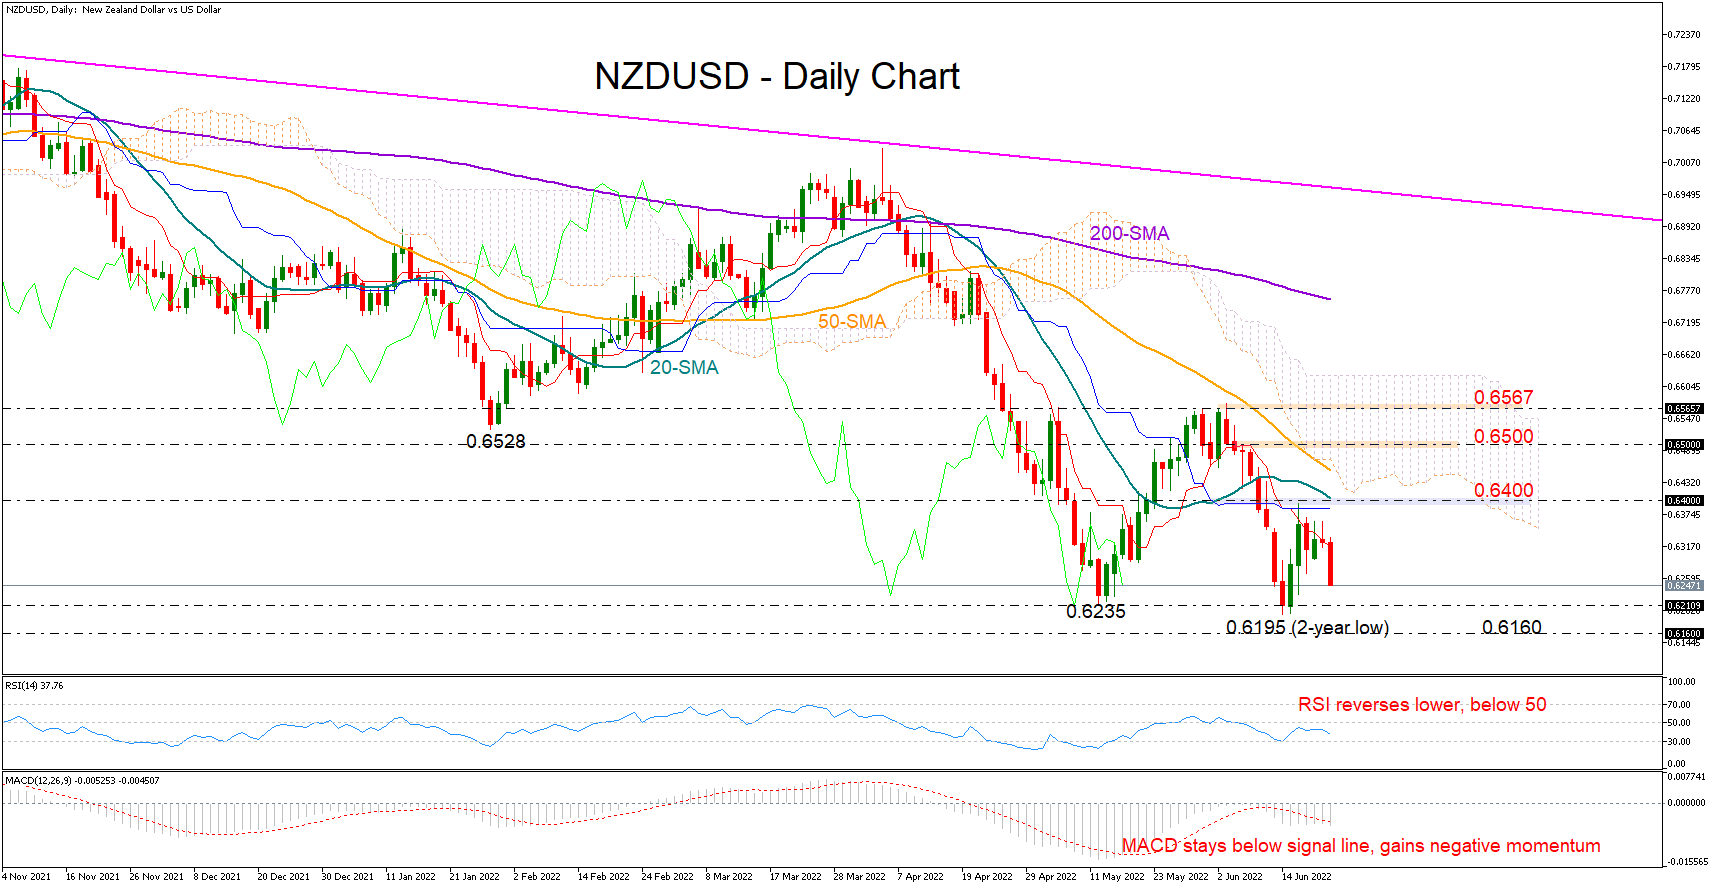
NZDUSD Eyes June’s Lows as Bears Regain Control
NZDUSD resumed its slide on Wednesday, bringing the key 0.6335 – 0.6195 bottom area back under the spotlight after a four-day-long unsuccessful battle with the red Tenkan-sen line.
The RSI and the MACD remain negatively charged within the bearish zone, while the negative intersection between the red Tenkan-sen and blue Kijun-sen lines is another indication that the bears may hold onto control in the coming sessions.
Should the price close below 0.6235, the former resistance zone around 0.6160 may immediately attract some attention before selling pressures intensify towards the 0.6000 round-level. Below that, there is another important barrier around 0.5916.
Conversely, a decisive move above the red Tenkan-sen line currently at 0.6316 may continue towards the 20-day simple moving average (SMA) at 0.6400. If the 50-day SMA proves an easy obstacle too at 0.6452, the pair may visit the 0.6500 psychological mark, though only a durable rally above June’s topline of 0.6567 would make any rebound credible.
Summarizing, the odds are in favor of the bears in the NZDUSD market, and the next downside target is the May-June floor of 0.6235 – 0.6197.
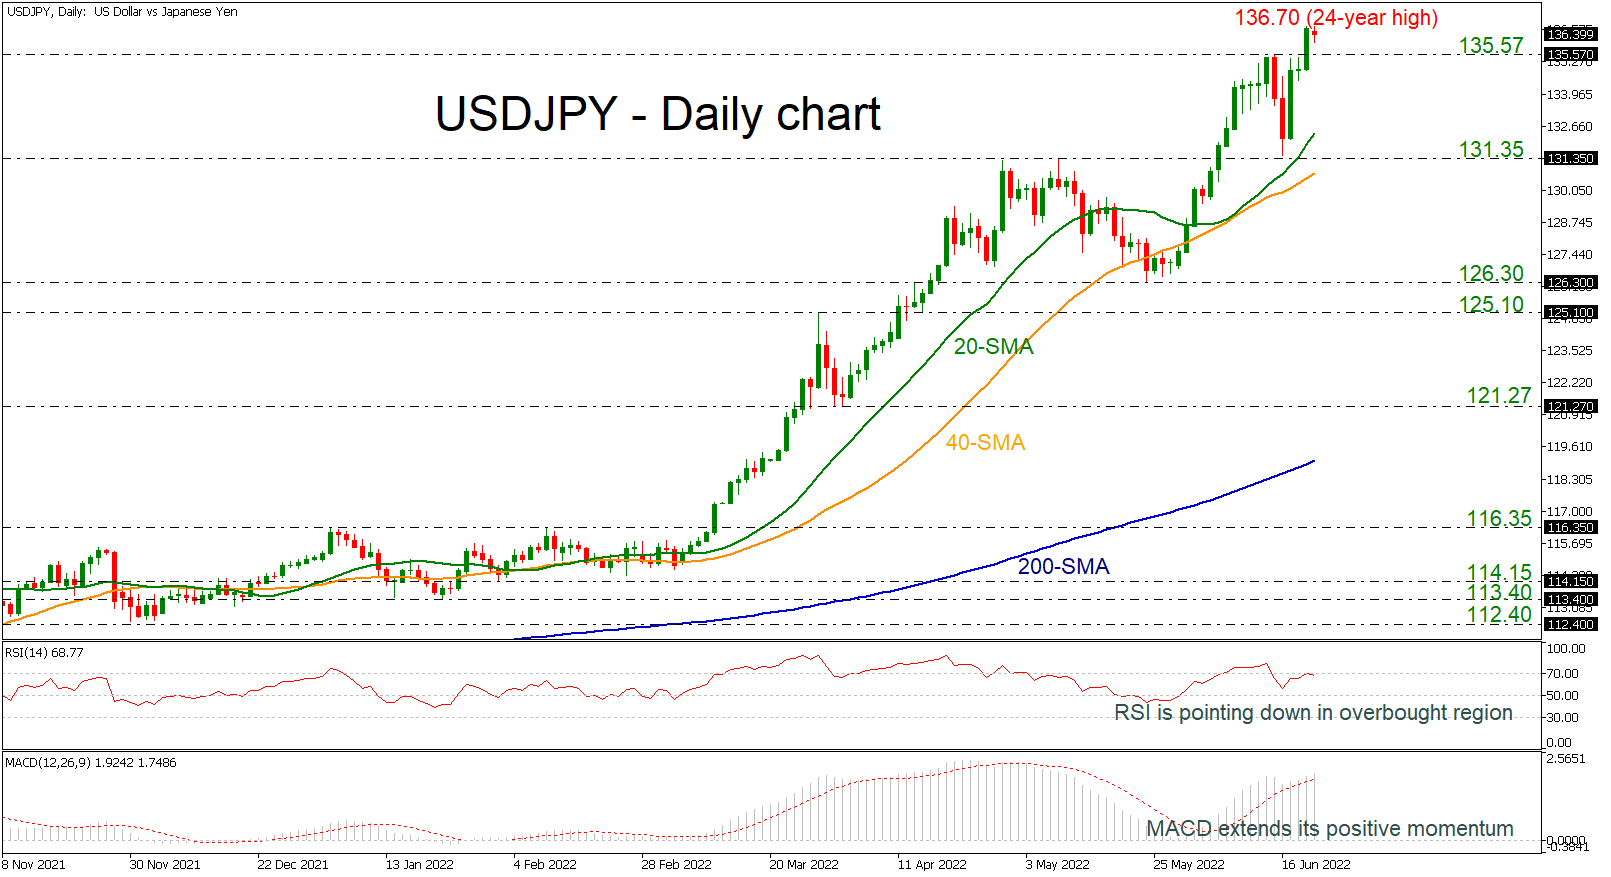
USDJPY Slips Slightly Below the New 24-Year Peak
USDJPY is holding around the fresh 24-year high at 136.70, surpassing successfully the previous highs of 135.57 and endorsing the bullish view.
The MACD is moving further above its red signal line, and the RSI is pointing down after it reached the 70 level. However, the latter could also be an indication that the advance has been exaggerated, and as a result, bearish corrections in the upcoming sessions should not come as a surprise to investors.
In the event that the price moves in the opposite direction, the immediate support could come from the 135.57 barrier ahead of the 20-day simple moving average (SMA) around 132.35, which the bears were unable to break over the previous week. As the price moves lower, attention will shift to the support level at 131.35, though, a violation of the 40-day SMA located at 130.70 would boost speculation that the current bullish phase may transition into a neutral phase in the near future.
Traders will be avidly watching for a break above today's peak of 136.70 in the alternative scenario, which would result a rally towards the next psychological levels. If that turns out to be the case, the upswing can continue until the price reaches 140.00.
The recent bullish activity has made the wider picture more optimistic as well, and traders may expect additional improvement in the market as the shorter-term SMAs continue to increase their distance above the longer-term SMAs.
CAD/CHF Grinds Demand Zone
The Canadian dollar recoups losses as April’s retail sales beat market expectations. The price action is hovering above the origin of a mid-April rally around 0.7400. A bullish RSI divergence indicates a slowdown in the liquidation momentum, and in conjunction with a demand zone, sellers could be taking some chips off the table. A rebound will need to clear 0.7580 before it could gain traction. Otherwise, a fall below 0.7400 may trigger a new round of sell-off towards 0.7300.