

Sample Category Title
Technical Outlook and Review
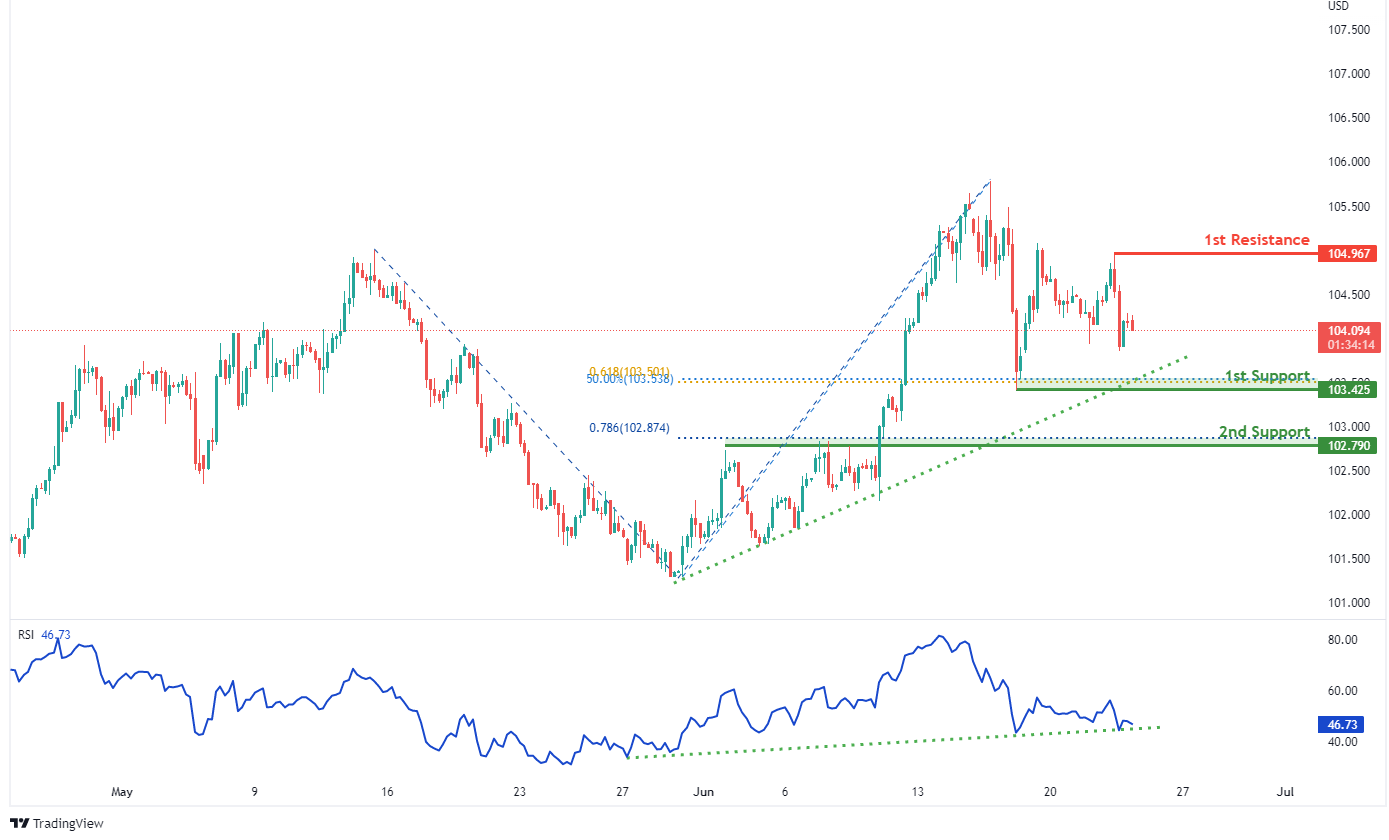
DXY:
On the H4, with RSI moving along an ascending trendline and prices moving along the ascending trendline, we have a bullish bias that bullish momentum will carry prices from our 1st support at 103.425 where the 61.8% fibonacci projection, 50% fibonacci retracement and swing low support are to our 1st resistance at 104.967 in line with the horizontal swing high resistance. Alternatively, price may break 1st support structure and head for 2nd support at 102.790 where the horizontal overlap support and 78.6% fibonacci projection.
Areas of consideration:
- H4 time frame, 1st resistance at 104.967
- H4 time frame, 1st support at 103.425
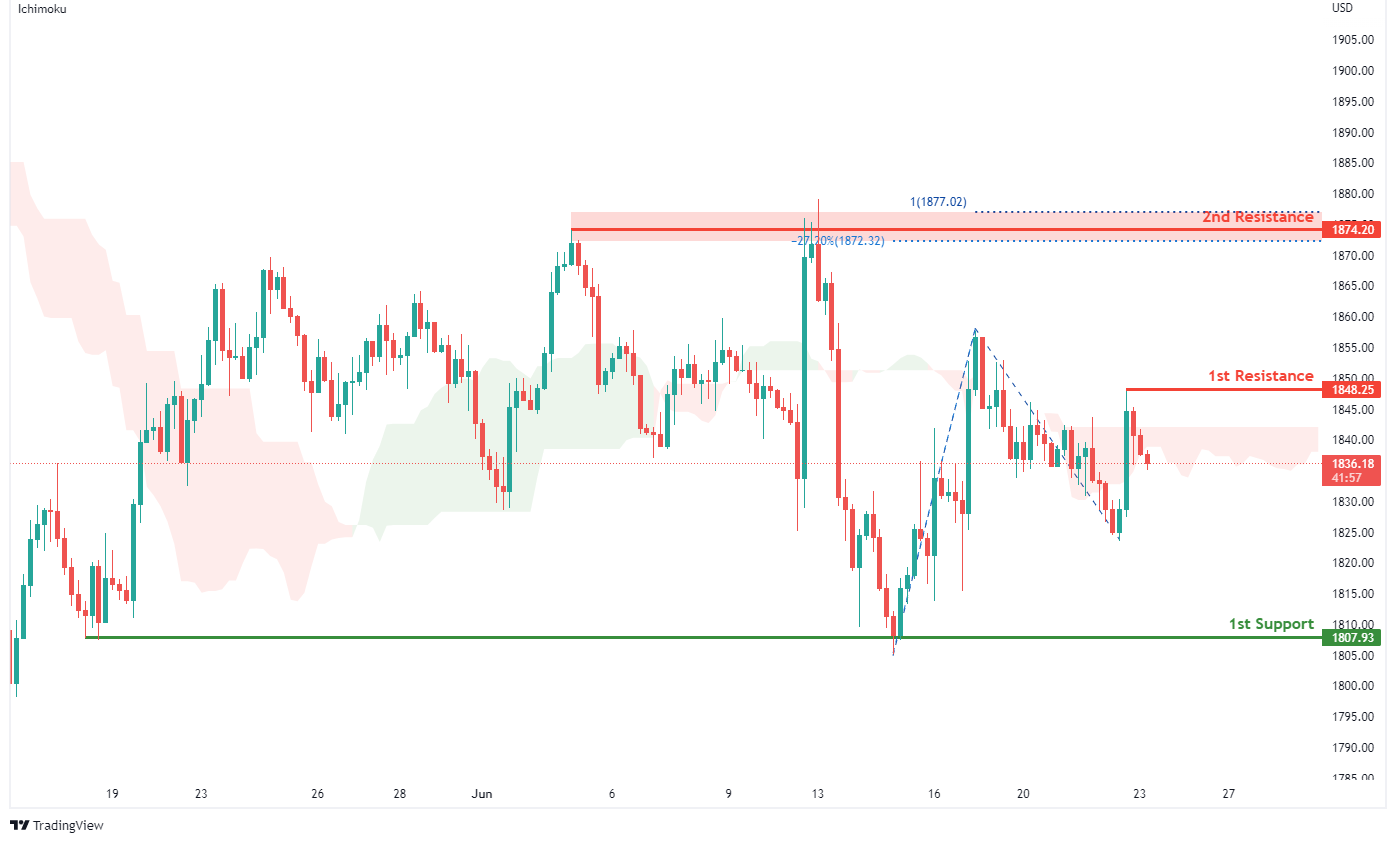
XAU/USD (GOLD):
On the H4, with prices moving below the ichimoku indicator, we have a bearish bias that prices will drop from our 1st resistance at 1848.25 where the horizontal swing high resistance is to our 1st support at 1807.93 in line with swing low support. Alternatively, price may break 1st resistance structure and head for 2nd resistance at 1874.20 in line with swing high resistance, -27.2% fibonacci expansion and 100% fibonacci projection.
Areas of consideration:
- H4 time frame, 1st Resistance at 1848.25
- H4 time frame, 1st Support at 1807.93
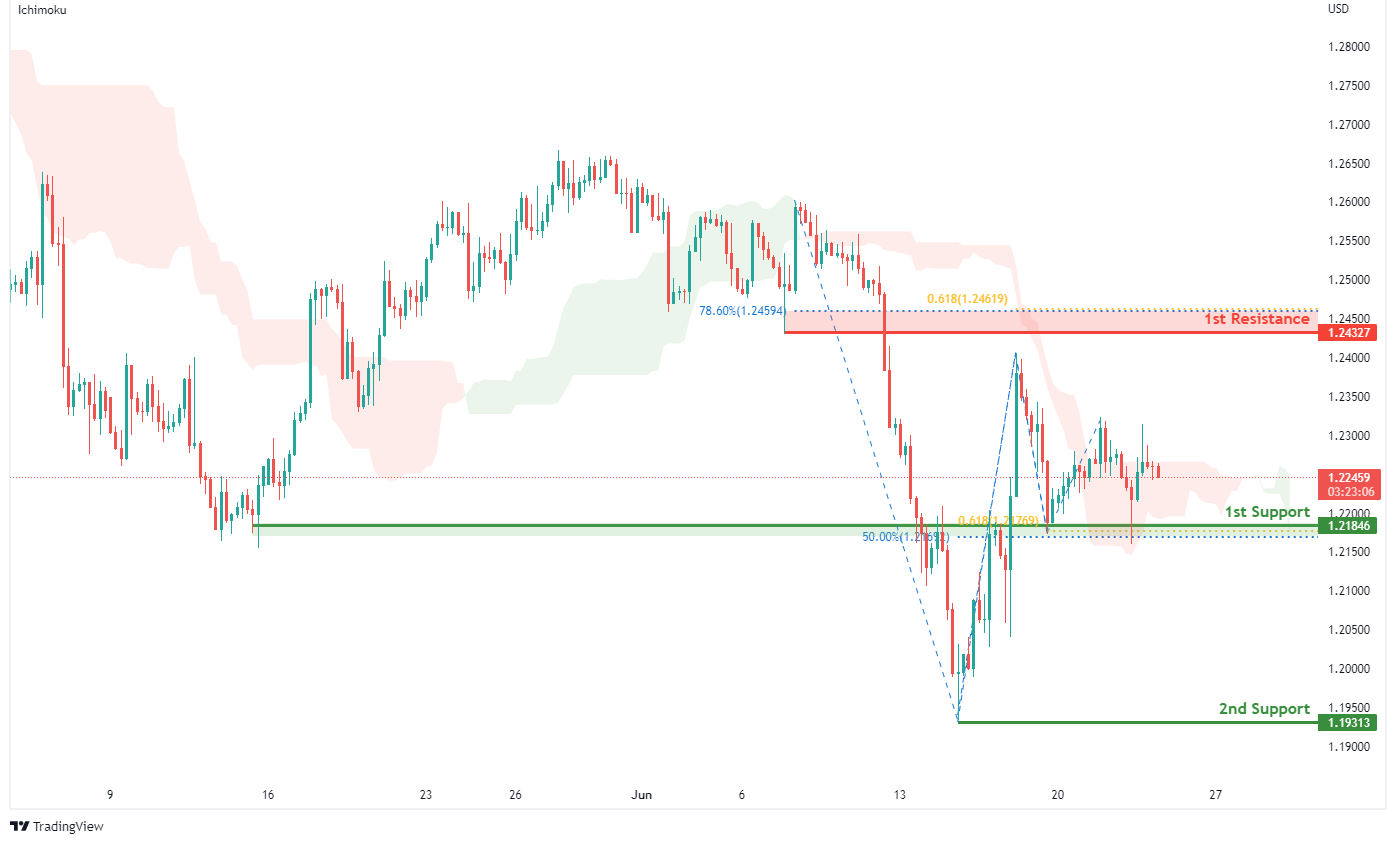
GBP/USD:
On the H4, with prices expected to bounce off the ichimoku support, we have a bullish bias that price will rise from our 1st support at 1.21846 where the horizontal overlap support,50% fibonacci retracement and 61.8% fibonacci projection to our 1st resistance at 1.24327 in line with the 61.8% fibonacci projection, 78.6% fibonacci retracement and pullback resistance. Alternatively, price may break 1st support structure and head for 2nd support at 1.19313 where the horizontal swing low support is.
Areas of consideration:
- H4 1st resistance at 1.24327
- H4 1st support at 1.21846
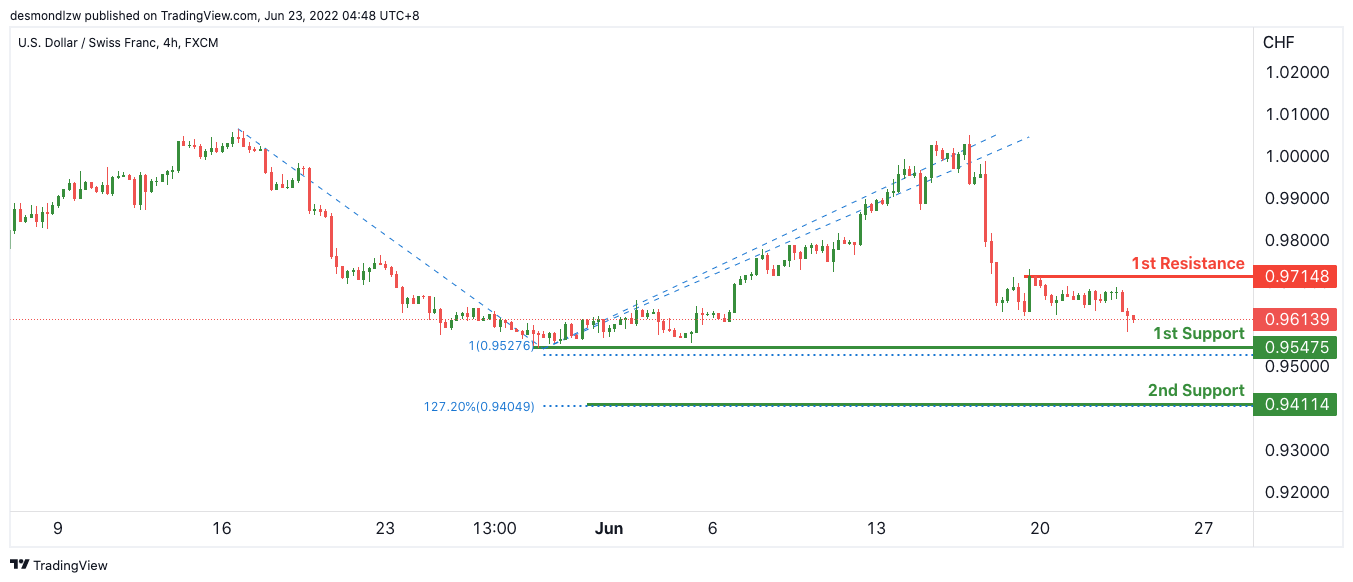
USD/CHF:
On the H4, with price expected to bounce off the stochastics indicator, we have a bullish bias that price will rise from our 1st support at 0.95475 where the horizontal pullback support and 78.6% Fibonacci retracement is to our 1st resistance at 0.987548 in line with the horizontal pullback resistance and 61.8% Fibonacci retracement. Alternatively, price may break structure and head for 2nd support where the 127.2% Fibonacci extension is.
Areas of consideration
- 1st support level at 0.95475
- 1st resistance level at 0.987548
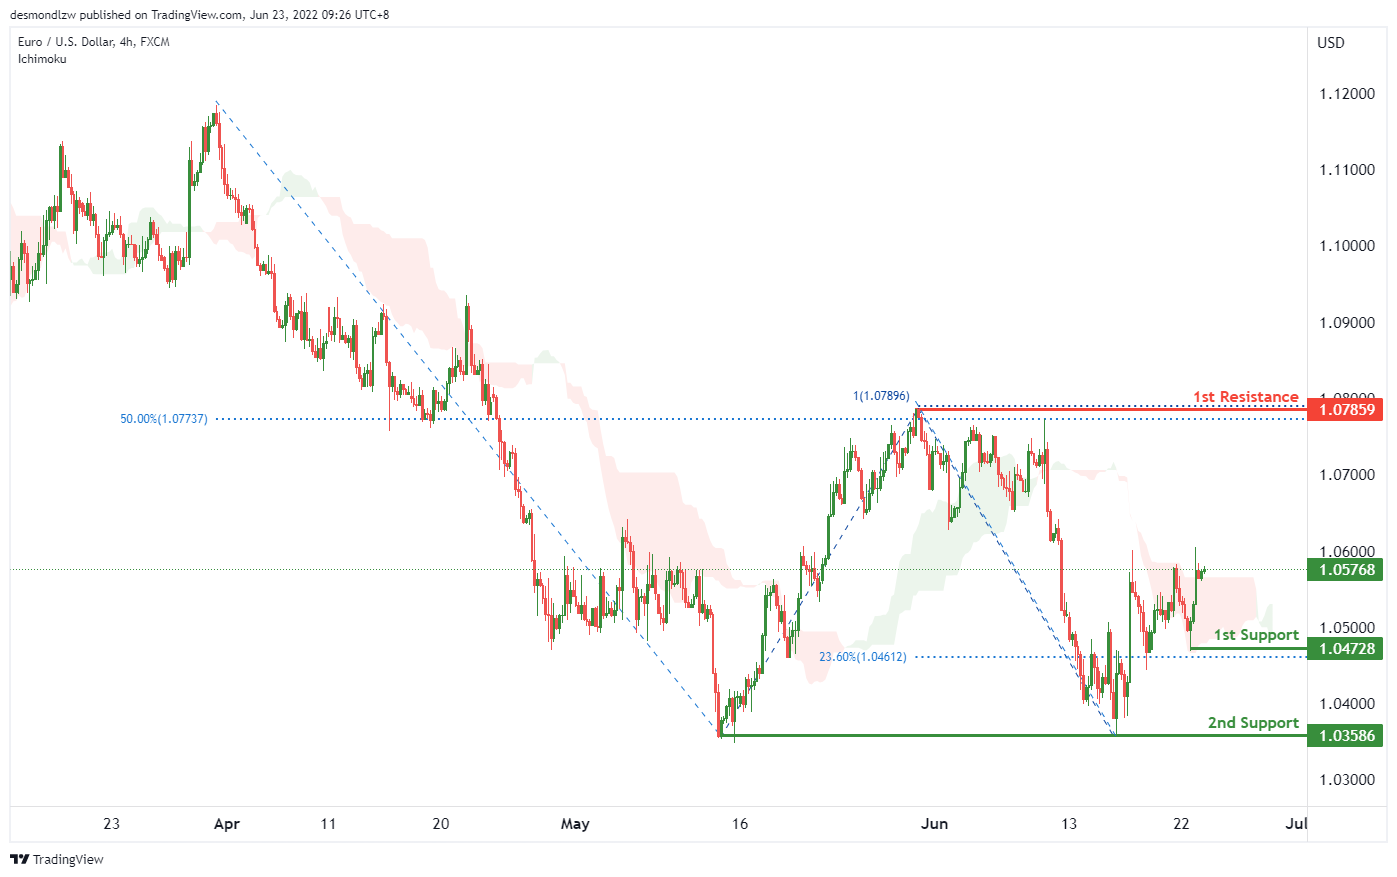
EUR/USD :
On the H4, with price moving above the ichimoku cloud, we have a bullish bias that price will continue to rise from the 1st support at 1.04728 in line with the 23.6% fibonacci retracement and swing low to the 1st resistance at 1.07859 at the swing high in line with the 100% fibonaci projection and 50% fibonacci retracement. Alternatively, price may drop from the 1st support to the 2nd support at 1.03586 at the horizontal swing lows.
Areas of consideration :
- H4 1st resistance at 1.07859
- H4 1st support at 1.04728
USD/JPY:
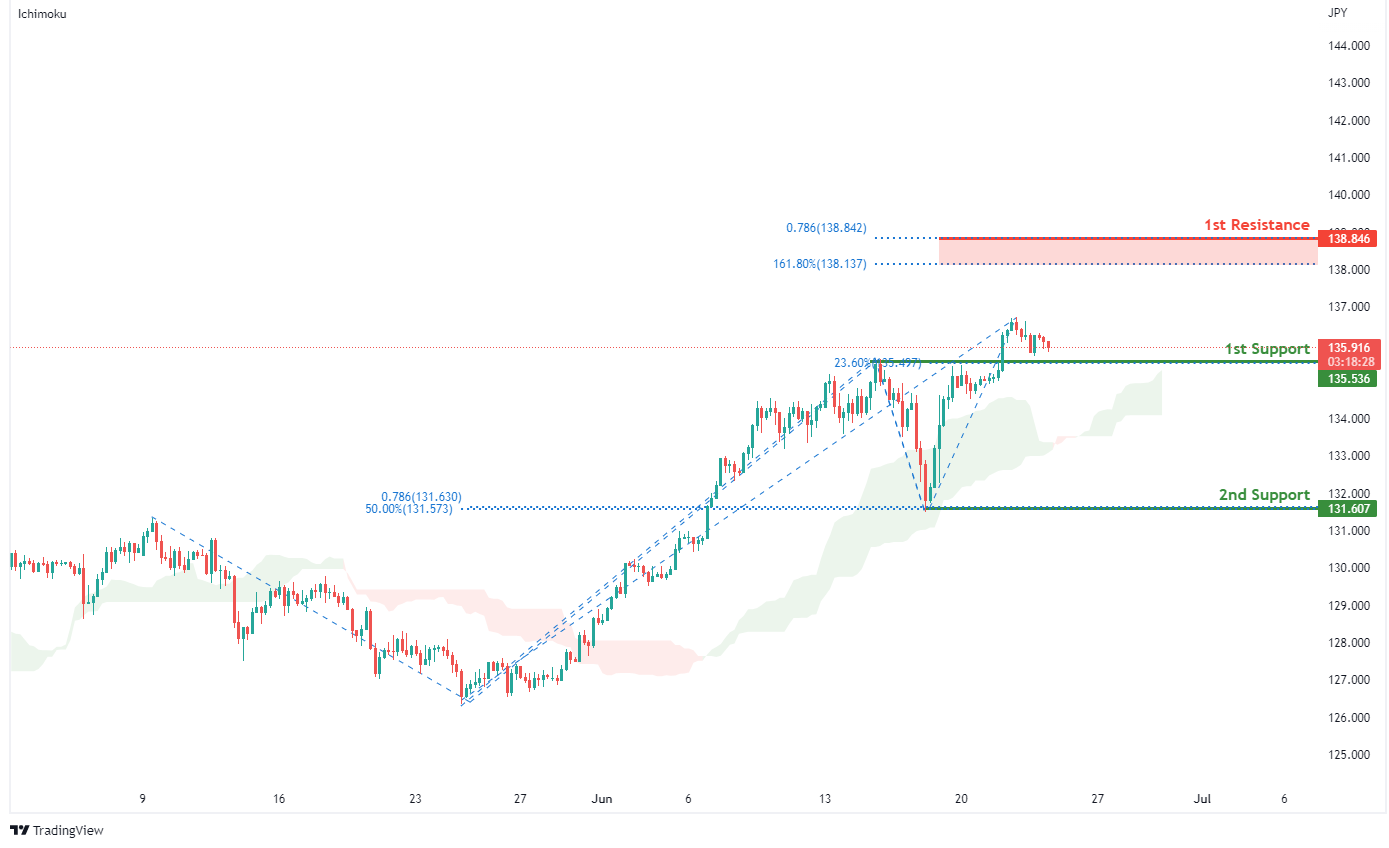
On the H4, with price moving above the ichimoku indicator, we have a bullish bias that price will rise from our 1st support at 135.536 in line with the pullback support and 23.6% fibonacci retracement to our 1st resistance at 138.846 where the 161.8% fibonacci extension and 78.6% fibonacci projection are . Alternatively, price may break 1st support structure and head for 2nd support at 131.607 in line with the swing low support,78.6% fibonacci projection and 50% fibonacci retracement.
Areas of consideration:
- H4 time frame, 1st resistance at 138.846
- H4 time frame, 1st support at 135.536
AUD/USD:
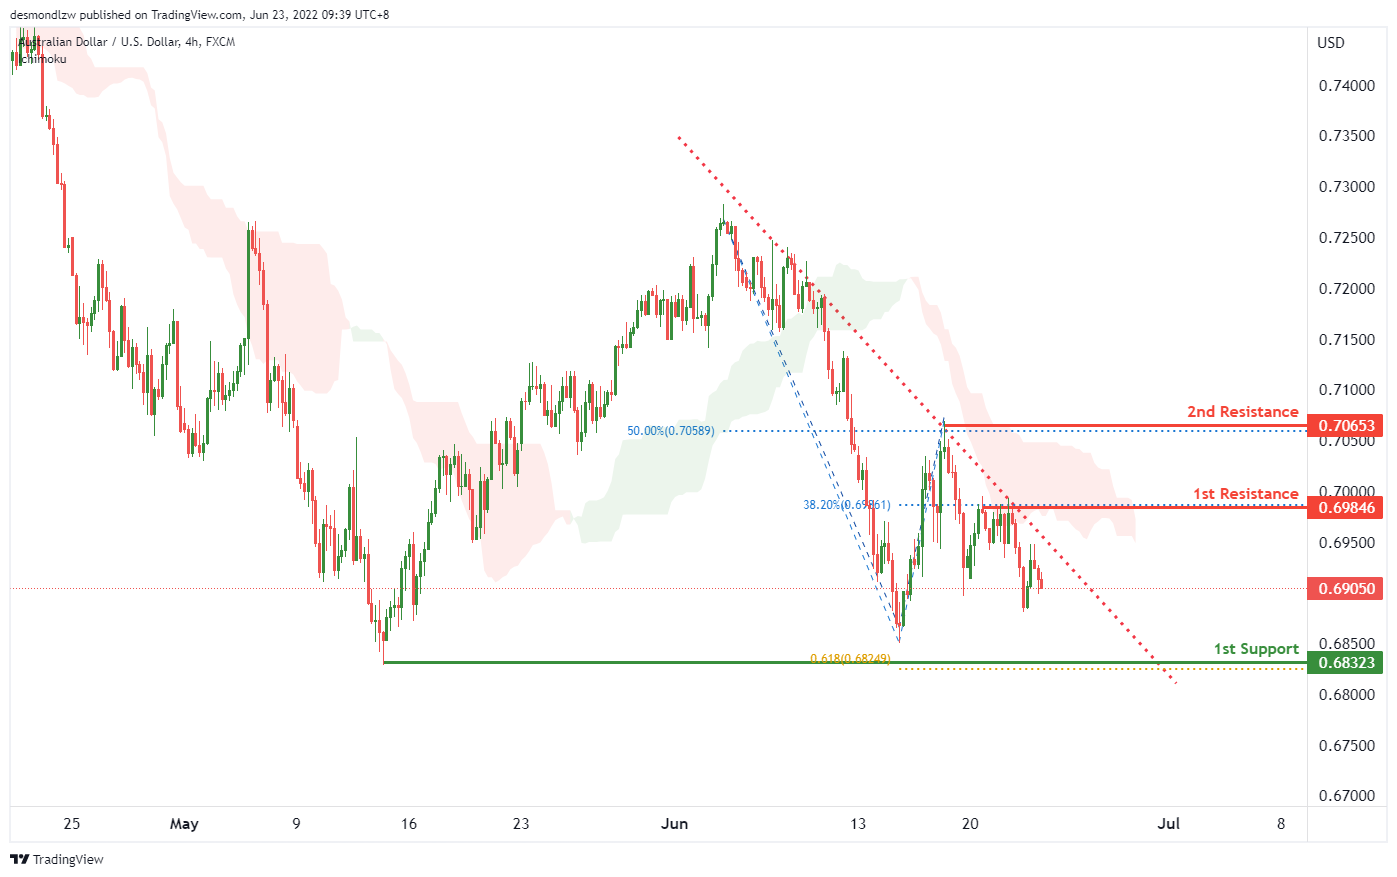
On the H4, with price moving below the ichimoku cloud and in a descending trendline, we have a bearish bias that price will continue to drop from the 1st pullback resistance at 0.69846 in line with the 38.2% fibonacci retracement to the 1st support at 0.68323 in line with the horizontal swing low and 61.8% fibonacci projection. Alternatively, price may reverse off the 1st resistance and rise to the 2nd resistance at 0.70653 in line with the 50% fibonacci retracement and swing high.
Areas of consideration
- H4 1st resistance at 0.69846
- H4 1st support at 0.68323
NZD/USD:
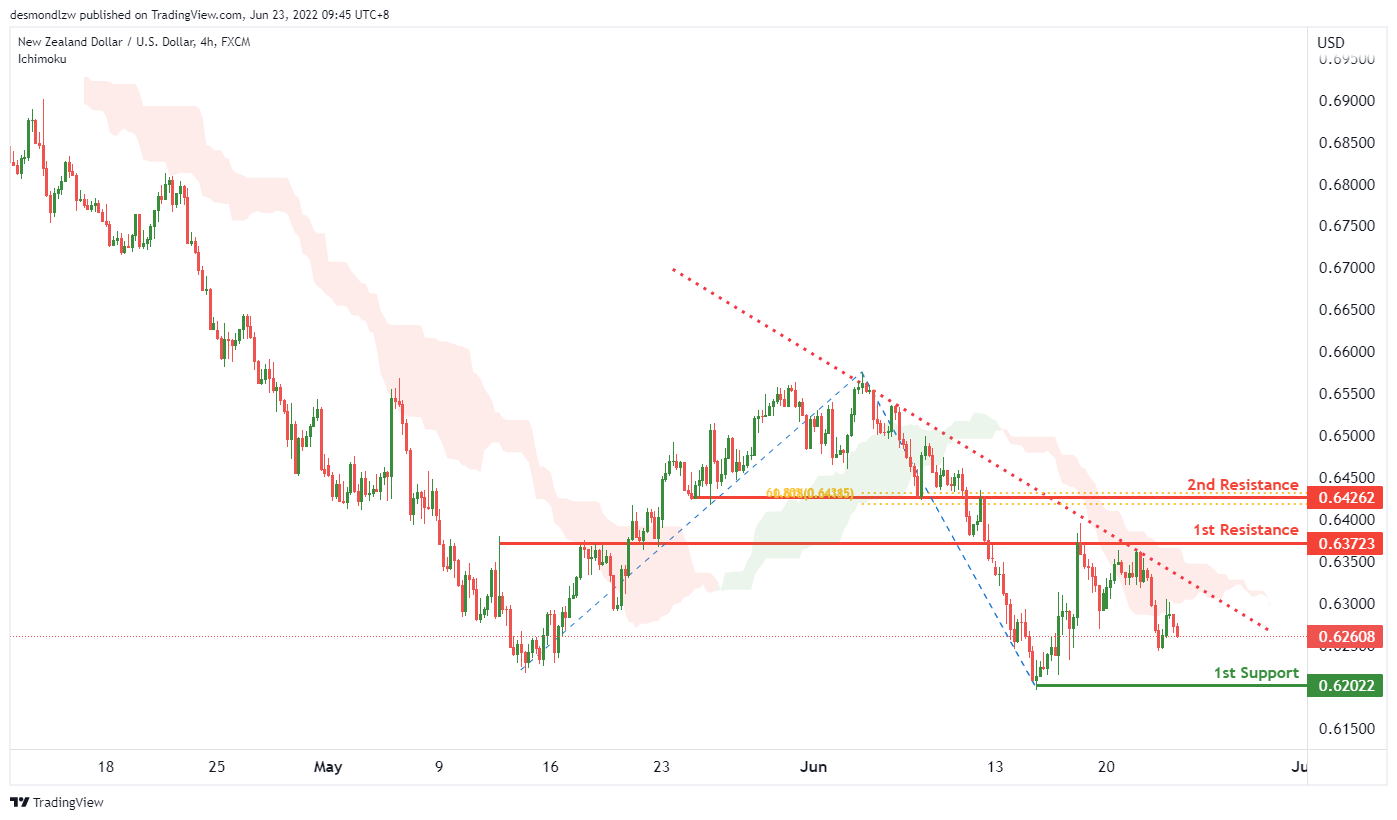
On the H4, with price moving within the ichimoku cloud and in a descending trendline, we have a bearish bias that price will drop from the 1st resistance at 0.63723 at the pullback resistance to the 1st support at 0.62022 at the horizontal swing low. Alternatively, price may reverse off the 1st resistance and rise to the 2nd resistance at 0.64262 in line with the 61.8% Fibonacci projection and 61.8% Fibonacci retracement.
Areas of consideration:
- H4 time frame, 1st support at 0.62022
- H4 time frame, 1st resistance at 0.63723
USD/CAD:
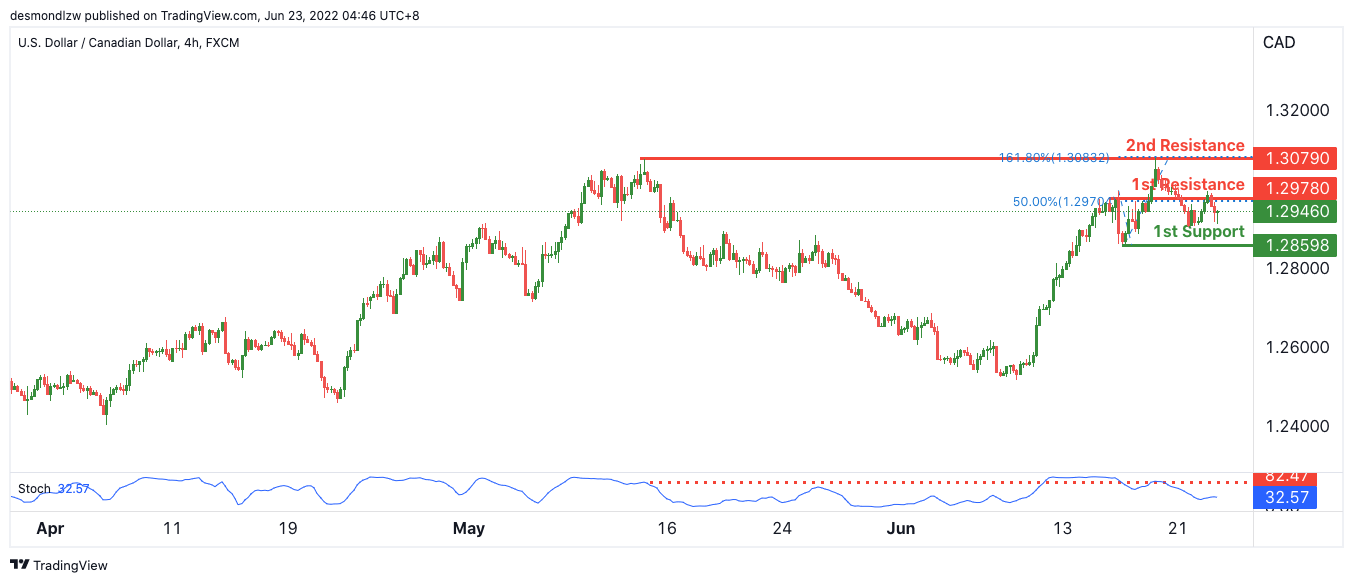
On the H4, with price expected to reverse off the stochastics indicator, we have a bearish bias that price will rise from our 1st resistance where the 50% Fibonacci retracement is to our 1st support at 1.28598 in line with the horizontal pullback support and 50% Fibonacci retracement. Alternatively, price may head for 2nd resistance where the horizontal swing high resistance and 161.8% Fibonacci projection is.
Areas of consideration:
- H4 time frame, 1st resistance at 1.29780
- H4 time frame, 1st support at 1.28598
OIL:
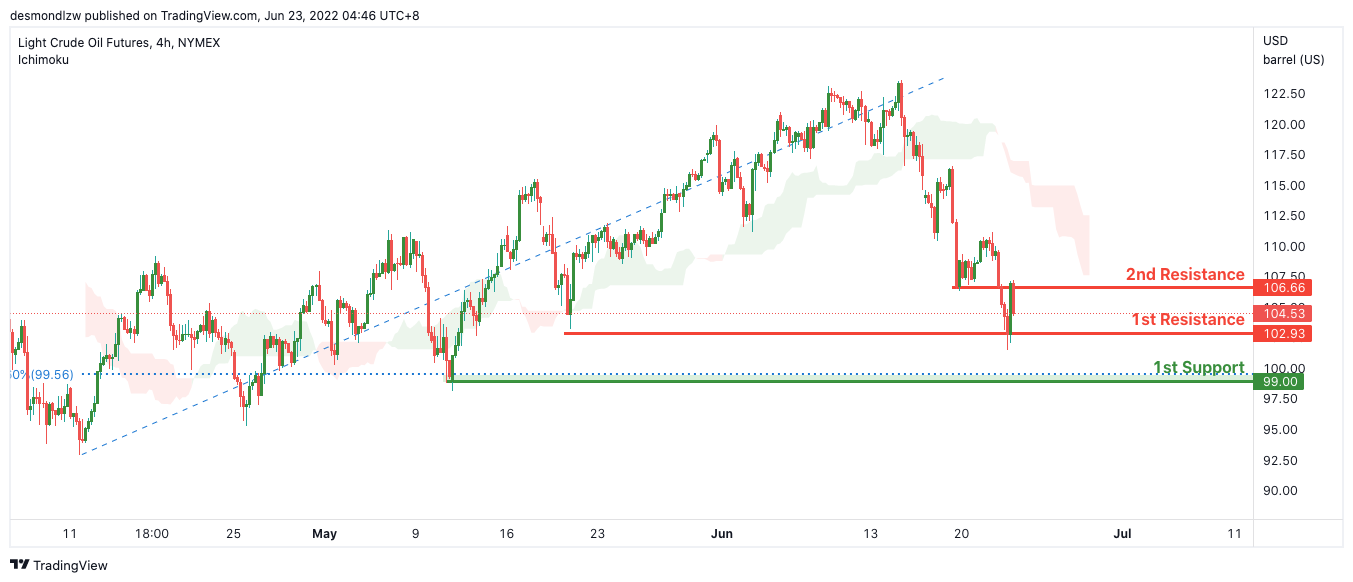
On the H4, with price moving below the ichimoku cloud, we have a bearish bias that price will rise from our 1st resistance where the horizontal pullback resistance is to our 1st support in line with the horizontal swing low support. Alternatively, price may head for 2nd resistance where the horizontal pullback resistance is. Take note that we are waiting for the break of 1st resistance to confirm the bearish continuation.
Areas of consideration:
- H4 time frame, 1st resistance of 102.93
- H4 time frame, 1st support of 99.00
Dow Jones Industrial Average:
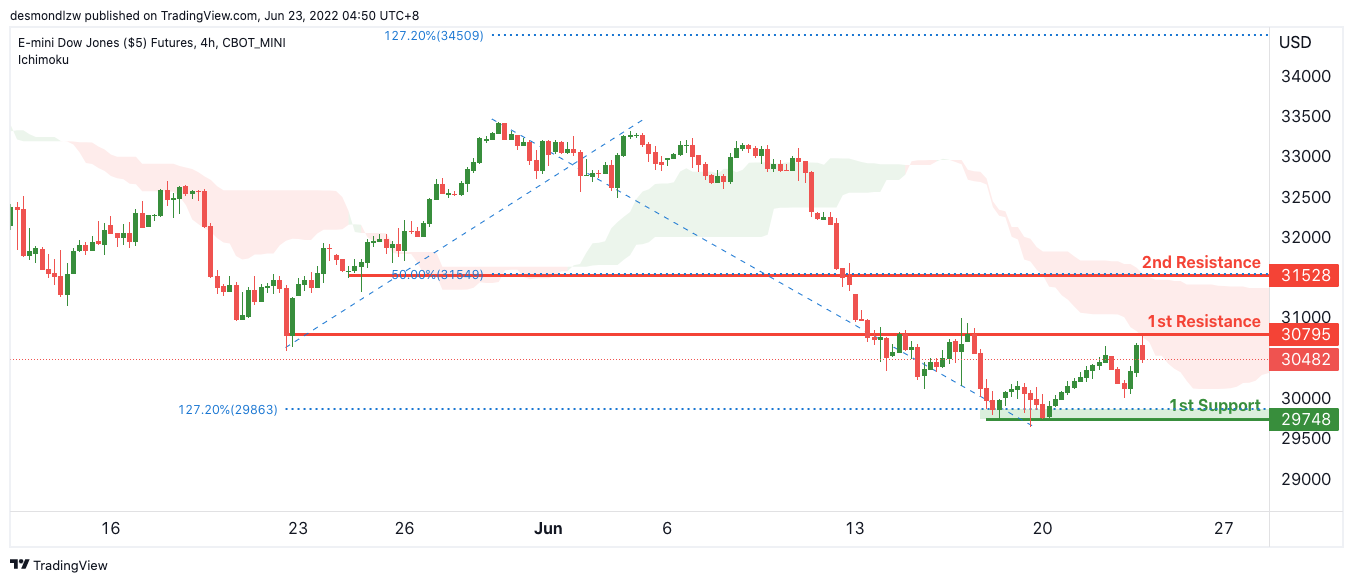
On the H4, with price moving below the ichimoku cloud, we have a bearish bias that price will rise from our 1st resistance at 30795 where the horizontal pullback resistance is to our 1st support at 29748 in line with the horizontal swing low support. Alternatively, price may head for 2nd resistance where the horizontal pullback resistance and 50% Fibonacci retracement is.
Areas of consideration :
- H4 time frame, 1st resistance at 30795
- H4 time frame, 1st support at 29748
RBA to Hike Rates by 50 Basis Points in Both July and August – Terminal Rate to Reach 2.6%
Last week we lifted our forecast for the terminal US federal funds rate in December from 2.675% to 3.375%.
We now expect this more aggressive approach to see the US economy stalling, with the risk of a mild recession in the second half of 2023.We expect a need for a series of rate cuts from December 2023 eventually taking the federal funds rate back to 2.125% through 2024.
That cycle for the remainder of 2022 will entail increases of 75bps in July; 50bps in September; 25bps in November and 25bps in December.
This shift toward higher global rates has also led us to lift our terminal rate for the RBA's tightening cycle, from 2.35% to 2.6%. Note that this is still significantly short of the market's forecast terminal rate of around 4.5% and only a 25bp upward revision compared to the 75bp lift in the federal funds profile.
The 2.6% is broadly in line with the '2.5% guideline' the RBA Governor has given in speeches and other commentary (from his ABC interview on June 14: "I think it's reasonable that the cash rate gets to 2½ per cent at some point").
The sensitivity of the Australian economy to the RBA cash rate is markedly higher than the sensitivity of the US economy to the federal funds rate. Around 60% of Australian mortgages are on floating rate terms with a further 75% of the remaining fixed rate loans set to mature by the end of 2023.
Effectively 90% of mortgage borrowers are directly exposed to moves in the RBA cash rate over the next year and a half. The rate affects borrowers and homeowners through multiple channels, including: the cash flow of existing borrowers; the capacity of prospective borrowers to obtain and service new loans; the wealth effect from associated adjustments in house prices; and via confidence effects.
In the US, the current surge in the mortgage rate only affects new borrowers directly as existing borrowers typically have fixed rate mortgages up to 30 years.
The more direct impact of the federal funds rate on financial assets in the US is through the equity market and confidence. This 25bp upward revision in the forecast terminal rate is likely to manifest as a 50bp increase in the cash rate at the August Board meeting – revised up from our previous forecast of 25bps.
That would push the cash rate from our forecast 1.35% (following the expected 50bp lift at the upcoming July meeting) to 1.85% after the August meeting – firmly in our estimated 'neutral zone' for policy in Australia of 1.5-2.0%.
The August Board meeting will respond to what is expected to be a very unsettling June quarter inflation report set to be released on July 27.
We expect headline inflation to lift 1.5% in the quarter taking annual inflation from 5.1%yr to 5.8%yr. Underlying inflation, as represented by the trimmed mean, is expected to print 1.2% in the quarter for a lift in annual inflation from 3.7%yr to 4.5%yr.
We see the risks to these numbers to the upside.
After responding firmly to the further significant uplift in inflation – moving the cash rate into the 'neutral zone' and signalling a clear commitment to containing inflation and inflationary expectations – we expect the RBA to pause.
Consistent with our previous view, we expect the pause for two months to assess the impact of the rapid cumulative 175bp increase over four months.
As the Governor noted in this week's speech to the American Chamber of Commerce, the key high frequency data he will be watching will be around consumer spending, particularly consumer durables and the housing market – not just house prices (as a pointer to wealth effects) but also with respect to dwelling construction and other housing-related expenditure.
It is noteworthy that a swift move to 1.85% will still only restore the cash rate to slightly above the 1.5% that held for nearly three years between August 2016 and May 2019, when inflation persistently undershot the Bank's 2-3% target zone.
Moving swiftly to reverse what is clearly an over-stimulatory policy setting and then pausing before moving into the 'contractionary zone' is the best approach, and one that is most likely to avoid the damaging overshoot we are forecasting for the FOMC.
Such a strategy would also assist in the central objective of the tightening cycle: to signal clearly to economic agents – households and trade unions in particular – that the Bank is committed to returning inflation to target over the medium term, thereby containing any lift in inflation expectations.
In his speech, the Governor made a major point around the key objective of containing inflationary expectations.
Our central case remains that, following the release of the September quarter inflation report on October 26, a further tightening will be seen as necessary at the November Board meeting.
In that report we expect annual headline inflation to be steady at 5.7%yr (due in part to state government subsidies temporarily forestalling the effect of a big rise in electricity costs), but underlying inflation to have lifted from 4.5%yr to 4.8%yr.
The next move would put policy into the contractionary zone. As such, it would be prudent to revert to proceeding in 25bp increments given the added uncertainty around the impact of each move.
We continue to expect a further move in December and a final 25bp lift at the February Board meeting in response to the December quarter inflation report.
The December quarter is expected to see the peak in both headline and underlying inflation. (6.6% and 4.8% respectively). Having responded to that move it would be prudent to go on hold to assess the economy's response to a cumulative increase in the cash rate over nine meetings of 250bp.
Such a move would be the second fastest tightening cycle since 1990, exceeded only by the 275bp increase over five meetings in the second half of 1994.
Our forecast is that, along with the clear slowing in the economy over the December and March quarters in particular, the March quarter inflation report will provide evidence that the slowing in demand and the freeing up of supply has brought demand and supply into closer alignment easing inflation pressures.
In the March inflation report we expect annual headline inflation to have fallen from 6.6%yr to 5.6%yr and underlying inflation to have fallen from 4.8%yr to 4.2%yr.
That evidence would be available by the May 2023 Board meeting, allowing the Board to move to a 'wait and see' approach, potentially signalling the end of the tightening cycle with the cash rate having reached 2.6%.
We also expect that the evidence around the sharp slowdown in the US economy will be a signal to the Board that steady policy is appropriate.
Markets have no sympathy with our view that the RBA can chart this course. They would point to the unsustainability of Australia's cash rate settling 87.5bp below the federal funds rate.
Australia's soft landing will allow the RBA to hold rates steady in 2023 and 2024 as inflation gradually eases back into the 2-3% target zone.
On our forecasts, after the FOMC is forced to reset policy in the aftermath of its economy stalling and potentially falling into recession, the RBA cash rate would settle around 50bps above the federal funds rate by the second half of 2024.
We accept that our forecasts for the cash rate assume a successful navigation of a very narrow path towards a soft landing.
In particular, the risks that we have seen recently with large increases in wage settlements are unsettling. That is why it is so important for the RBA to be decisive in the early stages of the tightening cycle with that clear message that it is committed to containing inflation risks.
A swift move into the neutral zone is a critical step and we strongly support adopting those three consecutive 50bp moves before a pause in September.
Elliott Wave View: EURUSD 7 Swing Rally
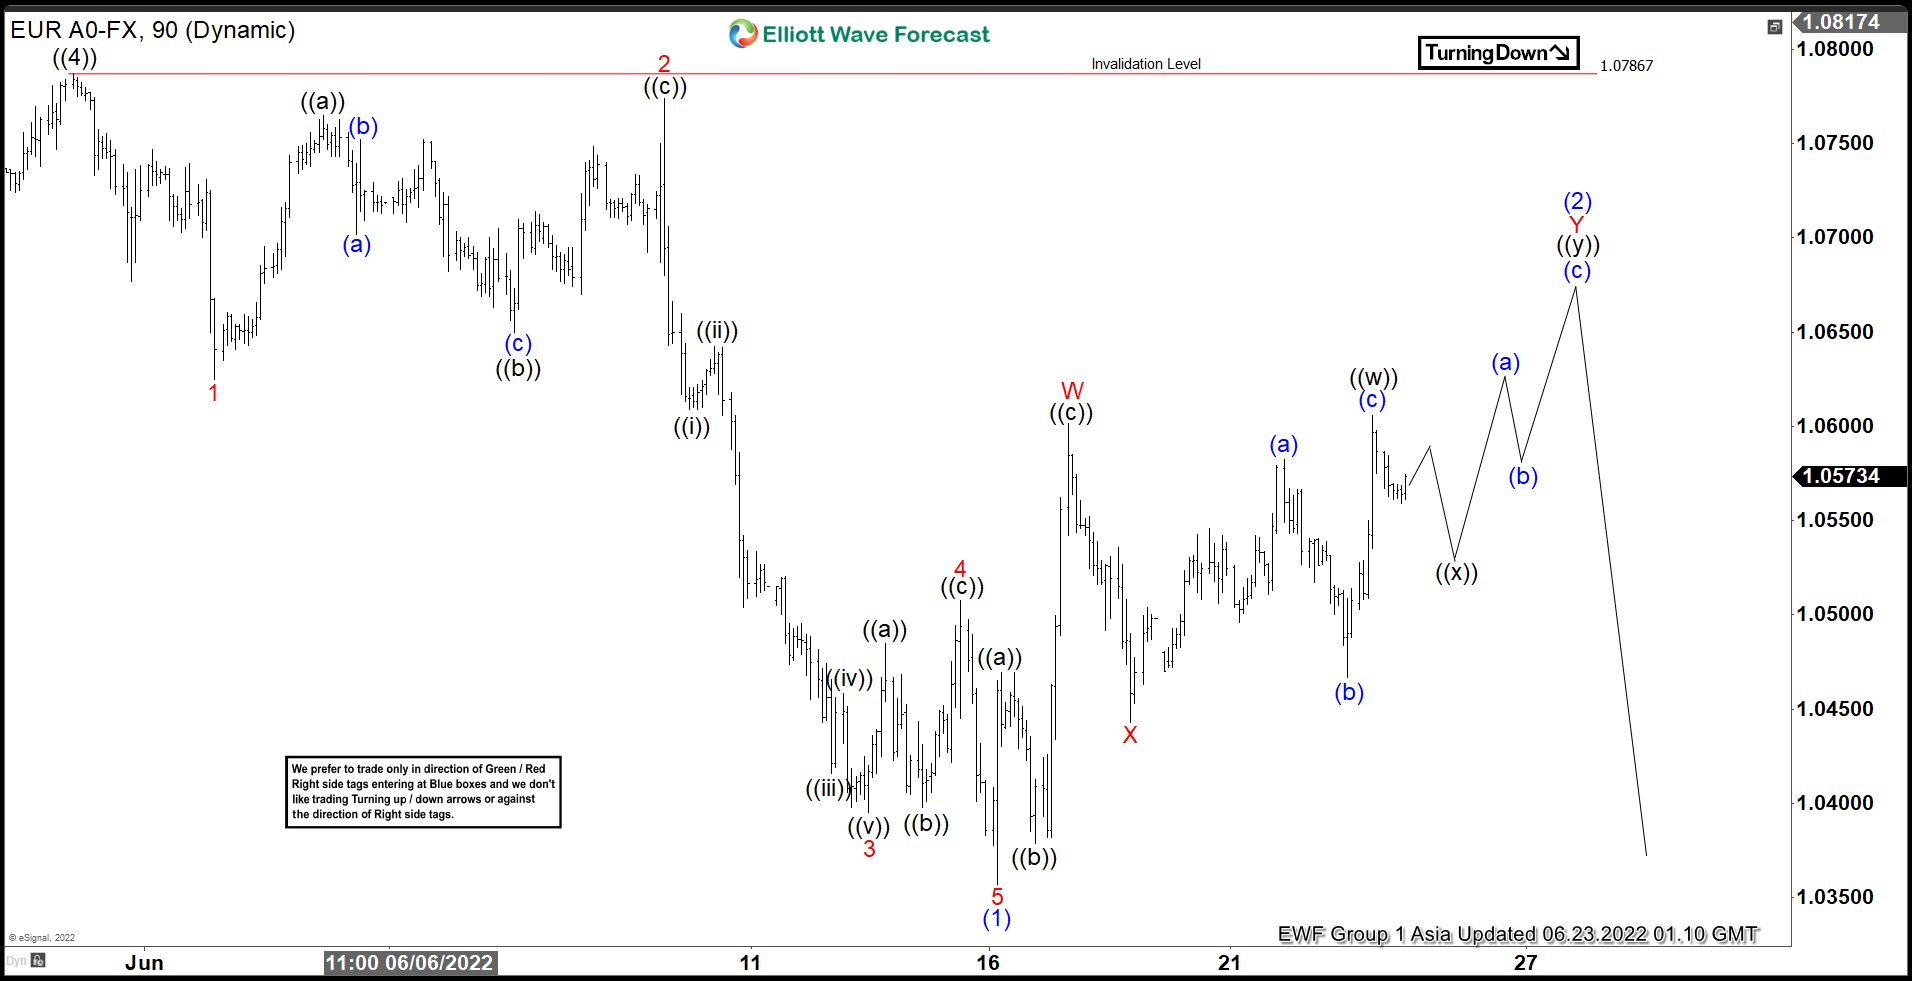
Short term Elliott Wave in EURUSD suggests rally to 1.078 ended wave ((4)). Wave ((5)) lower is currently in progress with subdivision as a 5 waves impulse Elliott Wave structure. Pair however still needs to break previous wave ((3)) low at 1.0348 on May 13, 2022 to rule out a double correction. Down from wave ((4)), wave 1 ended at 1.0625 and rally in wave 2 ended at 1.0774. Pair then resumes lower in wave 3 towards 1.0395, and rally in wave 4 ended at 1.0508. Final leg lower wave 5 ended at 1.0357 which also completed wave (1) in higher degree.
Wave (2) rally is in progress to correct cycle from 5/31/2022 high before the decline resumes. Subdivision of wave (2) is unfolding as a double three Elliott Wave structure. Up from wave (1), wave ((a)) ended at 1.0469 and pullback in wave ((b)) ended at 1.0379. Wave ((c)) higher ended at 1.0601 which completed wave W. Pullback in wave X ended at 1.044 and pair can extend higher in wave Y of (2) now towards 1.069 – 1.0746 area before the decline resumes. Near term, as far as pivot at 1.078 holds, expect rally to fail in 3, 7, 11 swing for further downside.
EURUSD 90 Minutes Elliott Wave Chart
Eco Data 6/23/22
[php_everywhere instance="1"]
Fed Harker not ready to make a final decision on the next hike
Philadelphia Fed's Harker said he's "not ready to make a final decision" on the next rate hike yet.
"If we start to see demand soften — and we are seeing some signs that demand is starting to soften in certain sectors of the economy. And if it's softening quicker than I anticipate, then it may be appropriate to go with a 50," he added. "If it's not, then it's probably appropriate to go with the 75. But let's see how the data turns out in the next few weeks."
"I think we've been very clear that we need to move to a restrictive stance," he said. "How we get there is dependent on the data. So we can't be that precise, [with] what we're going to be doing in September or December right now. I mean, the data will dictate that."
Fed Powell: Ongoing rate increases will be appropriate
In the prepared remarks for his semi annual testimony to Congress, Fed chair Jerome Powell said, "over coming months, we will be looking for compelling evidence that inflation is moving down".
"We anticipate that ongoing rate increases will be appropriate; the pace of those changes will continue to depend on the incoming data and the evolving outlook for the economy", he added. The decisions will be made "meeting by meeting.
Sunset Market Commentary
Markets
Here we go again. It has been a reliable roadmap over the past few months: the inflation scare dominates in the run-up to actual price data releases and central bank meetings at which policymakers sound more hawkish each time. When both events took place, markets start pondering what an aggressive tightening cycle will mean for growth. Recession concerns then take over and result in some sharp moves similar to the ones we’re seeing today. Core bond yields tumble with Bunds outperforming Treasuries. German yields shed 11.7 bps (2y) to 16.1 bps (10y) in a flattening move. The US curve bull steepens with changes ranging from -13 bps (2y, 3y) to -9 bps (30y). Nowhere in the advanced economies is growth this much of a concern than it is for the UK. Momentum already fell considerably on the British island according to recent data. On risk-off days like these, Gilts tend to outperform peers for this reason. UK yields drop a mammoth 20 bps at the front-end (2y, 5y) as markets contemplate the aggressive BoE tightening approach currently discounted (3 x 50 bps, 1 x 25 bps for the remainder of the year). This is taking place even as UK price data this morning showed headline inflation accelerating to 9.1% y/y. Core inflation eased a tad to 5.9% but remains at historically high levels. Producer price inflation isn’t showing any signs of abating soon. Yields further down the curve lose 16/17 bps too (30y/10y). Commodity markets were under strain as well today. Brent oil slips more than 6% to $107.5 per barrel. Stocks already erase part of (US) or more then (Europe) yesterday’s gains. The EuroStoxx50 (-1.85%) is flirting with the previous YtD closing low. Wall Street opens with losses of <1%.
The Japanese yen takes the lead on currency markets. USD/JPY (135.81, down from 136.57) forfeits some of yesterday’s gains that brought it to a 24-year high. The Swiss franc comes in second. EUR/CHF eases to 1.015. The euro and dollar are more or less on par with the former even having a small advantage over the greenback. EUR/USD left behind an intraday low at 1.047 to trade in the 1.055 area – slightly up from 1.053. EUR/GBP continues to flirt with the 0.86 area within a tight trading range. That’s actually not that bad from sterling’s point of view given the significant Gilt outperformance. The Czech koruna eases towards EUR/CZK 24.74 following the Czech National Bank decision to raise rates by no less than 125 bps to 7%. The supersized move was at least partially expected and it may well mark the end of the tightening cycle. The next time the CNB meets it will be I na very different, more dovish, composition. The CZK downleg has a smell of being capped by FX interventions though. News HeadlinesInflation in South Africa in May jumped more than expected. Headline inflation was reported at 0.7% M/M and 6.5% y/y (was 5.9% in April). Core CPI (ex. food, non-alcoholic beverages, fuel and energy) also rose further to 4.1% Y/Y from 3.9% Y/Y in April. The headline figure was the highest since January 2017. The SARB targets inflation to stay between 3.0% and 6.0%. The SARB since the start of the hiking cycle in November last year raised the policy rate 3 times by 0.25% but stepped up the pace with a 50 bps hike last month. Higher inflation in South Africa, central bankers in core major economies raising rates faster than expected and a weakening of the rand raises speculation that the SARB also might have to consider 75 bps hikes later this year. USD/ZAR trades stable just below 16.According to the monthly consumer survey of the National Bank of Belgium, consumer confidence in June rose for the third consecutive month to -11 from -13. Even so, the confidence indicator is still below its long-term average. The indicator only reversed one third of the sharp drop in May over the previous three months. Consumers became more positive on their assessment of the economic situation in Belgium (-31 from -35) and are positive about their savings (7 from 4). The assessment on their financial situation only improved marginally (-8 from -9). Consumers downwardly revised their assessment on the job market (unemployment indicator from 10 to 12).
XAU/USD: Rises on Growing Uncertainty But Bulls Look for More Evidence to be Validated
Spot gold edged higher on Wednesday after three days in red, boosted by risk aversion on lower stocks, political uncertainty and fears of recession, as raging inflation hurts economies while major central banks raise interest rates to curb rising prices that risks economic growth slowdown.
Traders are still cautious in taking positions but turn focus on safe-haven metal, due to a variety of factors which signal that migration into safety would be a possible preferred scenario.
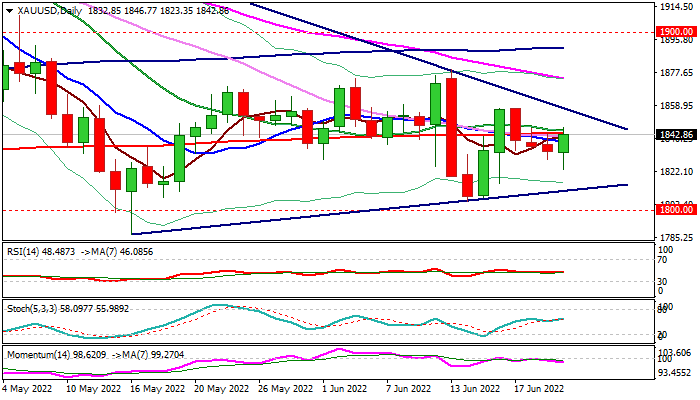
Fresh advance probes through strong barrier at $1842/43 (50% retracement of $1879/$1809 bear-leg / 200DMA), close above which would improve near-term structure and shift focus towards pivotal levels at $1850 (Fibo 61.8%) and 1857 (Jun 16/17 double-top).
Despite positive initial signals, caution is still required as momentum remains negative on daily chart and falling thick daily cloud continues to weigh on near-term action .
Watch reaction on 200DMA for initial signal, with failure to break higher to keep the structure fragile and keep last week’s low ($1805) at risk, while sustained break higher would require confirmation on lift above $1857.
Res: 1850; 1857; 1861; 1874.
Sup: 1833; 1823; 1815; 1805.
Don’t Get Too Excited by Bear-Market Rallies
European stock markets are falling heavily again on Wednesday, reminding us all once more why we shouldn't get excited by the bear-market rallies.
There's a desperation to add substance to the, often sizeable, rallies that pop up in equity markets despite little or no rationale behind them and today is once again a lesson in why we shouldn't bother. In much the same way that "if it seems too good to be true, it probably is", if stocks are rallying for seemingly no reason, there probably isn't one. So it won't last.
On Friday I noted that triple witching days should be taken with a pinch of salt; that probably extends to the day or two after as markets readjust. And that's in normal times which this most certainly is not. Another reason not to get carried away by the trade at the start of the week, which also occurred over a US bank holiday; another possible red flag.
Last week, investors had to contend with an avalanche of monetary tightening, some expected, some certainly not. That's not so easy to just brush off, particularly in the run-up to Jerome Powell's two-day testimony in Congress. The "R" word is likely to come up a lot today and the Chairman will have a tough time dodging it, especially with mid-terms in five months. Naturally, he'll do his best to remain apolitical but I'm not sure investors will be able to ignore so much recession chat.
BoE may be slightly encouraged by inflation data
The UK public can't ignore the reality of recession either. A summer of discontent is coming as the cost-of-living crisis rears its head in the form of strike action. Day two of travel disruption begins tomorrow amid more failed negotiations earlier this week. With Brexit now behind us (ish) and mask mandates a thing of the past, it's only natural that we Brits have found the next thing to argue about this summer. How exciting.
Inflation is unfortunately a very real and significant problem though, as evidenced by the May CPI data this morning. The BoE may be slightly encouraged by the core reading which fell a little faster than expected. Energy and food continue to drive the headline reading which the central bank can't ignore but today's data may encourage them to continue on the gradual tightening path against expectations of super-sized hikes.
Are we seeing a recession being priced into oil markets?
Is oil prices getting whacked the clearest sign yet of recession fears spreading across financial markets? With equity markets, it's been a death by a thousand cuts, as inflation panic has morphed into tightening and growth fears and finally the reality of a recession. Oil market dynamics mean crude has rallied throughout this as demand has been strong and supply insufficient. Is all of that about to change?
There's been a clear shift over the last week and as far as I'm aware, there hasn't been a miraculous oil discovery that solves all of the supply issues. But there's been a far greater acceptance that a recession may be unavoidable if central banks are going to get control of inflation again. WTI is falling rapidly back towards $100 where it could see strong support.
Gold the outlier
It seems everything is making moves at the moment, everything except gold that is. The yellow metal is trading around a very familiar level - $1,840 - and showing little indication of deviating from here in any significant way. Perhaps Powell can spur it back to life. If not, the $1,800-1,870 range remains intact, as it has broadly speaking for the last six weeks.
Cryptos dotcom moment?
Bitcoin is clinging onto $20,000 for dear life, the fear being that the loss of it again could see it spiral out of control. The market environment remains very unfavourable, as have the headlines of late. I don't expect either to improve which could make life very uncomfortable in the short term.
One interesting story that has grabbed my attention today is BoE Deputy Governor Jon Cunliffe suggesting that this could be cryptos dotcom crash. The sink or swim moment which unearths the Amazon and eBays of the crypto space and rids it of the many that only exist to be the get-rich-quick vehicles many pray they will be. Crumbling prices aside, this could be a big moment for cryptocurrencies.
USDJPY May Find a Ceiling as High as 150
The Japanese yen leads in losses against the dollar amongst the G10 currencies. And so far, there are indications that the USDJPY’s rising trend will only be interrupted by technical corrections in the coming weeks or months.
The main fundamental driver for the USDJPY is the substantial divergence in the US and Japanese monetary policy. The former has raised its key rate by 150 points in the last three meetings and started selling assets off the Fed balance sheet. The latter has maintained its crisis rhetoric, promising to continue with QE and increasing bond purchases to keep 10-year yields close to 0.25%.
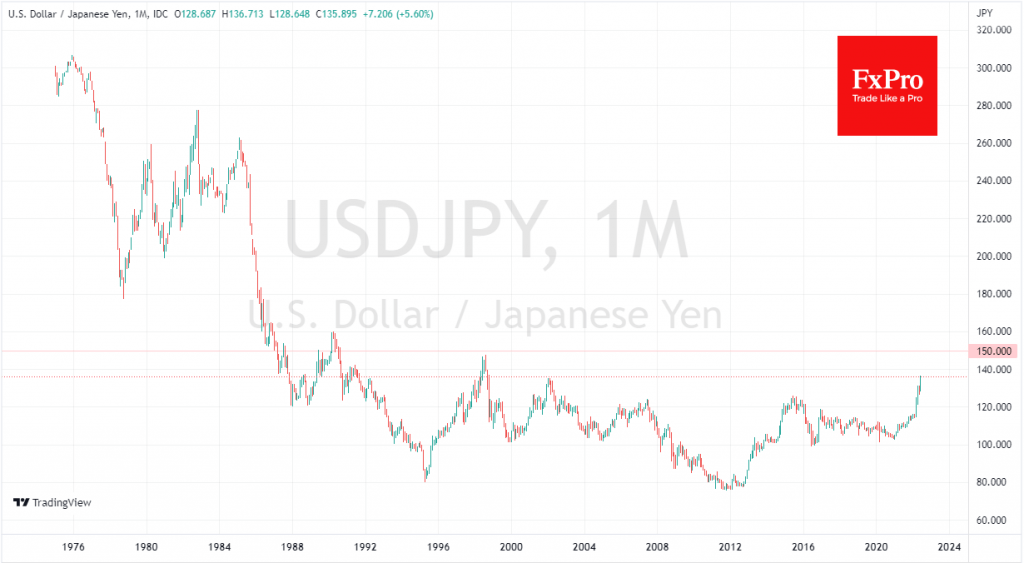
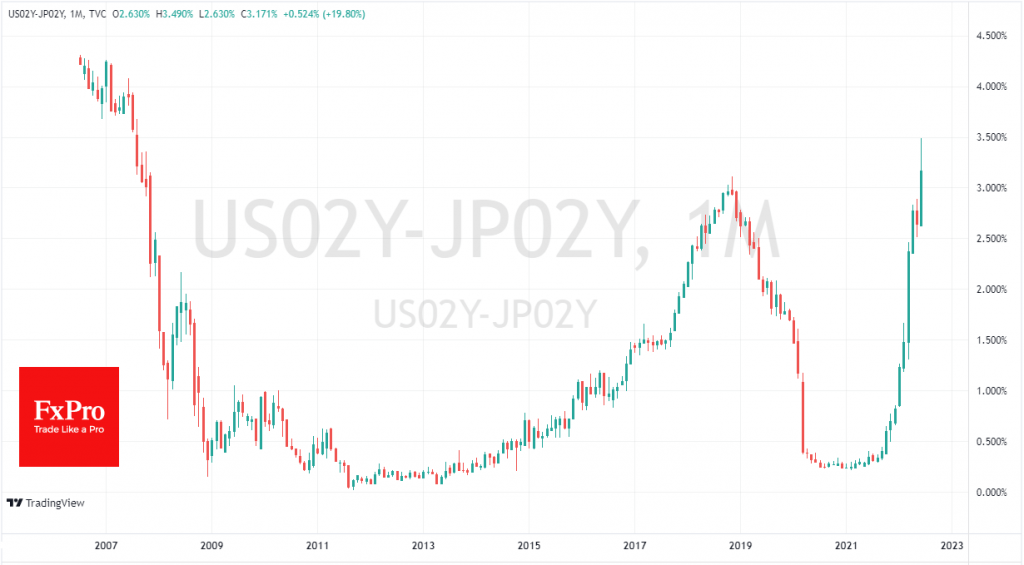
The currency market is not only wagering on the present but is actively putting expectations into prices. From this perspective, the USDJPY exchange rate results from an overlay of the key rate expectations, which are best reflected in 2-year bond yields. The spread started rising steadily in early 2021, at the same time as USDJPY began to rise.
The spread between the US and Japanese 2-year yields exceeded 3% this month, reaching 3.5%, the highest since 2007, although it was only 0.25% at the beginning of last year. Approaching a spread of 3% has not stopped the Fed from tightening, nor the Japanese rhetoric, so it makes sense to tune in to a return to pre-World Financial Crisis norms, i.e., above 4.3% versus 3.2% now, leaving the potential for around a third of the movement that already passed.
If these correlations between the USDJPY and US-JP 2-year yield spreads remain in place, we could see the dollar continue to rise to 150 yen, last seen in 1990 and twice as high as the historic lows of 2011.
Suppose the Japanese monetary authorities and the Ministry of Finance manage to steer the yen through such a devaluation, preserving confidence in the financial system. In that case, this could revive the economy by raising export competitiveness, potentially returning the Land of the Rising Sun to export-oriented status.