Sample Category Title
Fed to hike by 75bps? 10-year yield heading to 4%?
FOMC rate decision is the major focus today. Just before last Friday, markets have well received Fed's communication on the 50bps hike per meeting "plan". But it's another world now after data showed CPI inflation reaccelerated in May. Fed fund futures are pricing in near 100% change of a 75bps rate hike at this meeting. The question now is what Fed is going to deliver.
The new economic projections will also be closely watched too. The stubborn inflation reading should be reflected in the new forecasts, as well as it's impact on growth and employment. More importantly, the dot plot will again catch most attention. Back in March, only 7 of 16 FOMC member penciled in interest rate above 2% by the end of 2022. The balance would likely shift further to the hawks' side. But by how far?
Some suggested readings on FOMC:
- Fed Policy Meeting: Switching to Sharper Rate Hikes?
- FOMC Meeting Preview – The Meeting the World is Watching
- Heads Up: Brace for a Hawkish FOMC Meeting
- Markets Jumped the Gun, Expecting Hawkish Fed Tomorrow
- FOMC Preview: Could the Committee Hike 75bps?
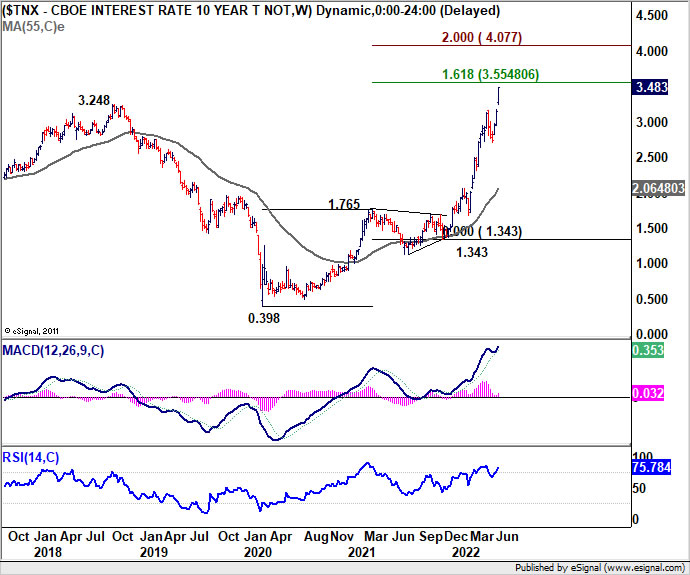
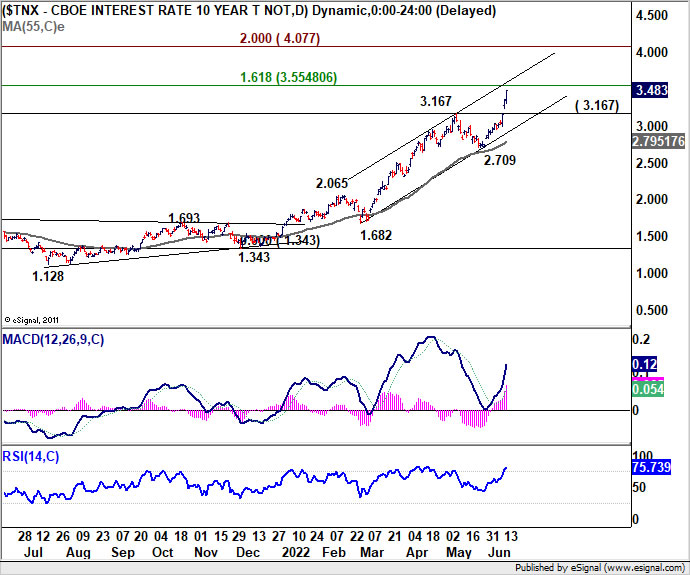
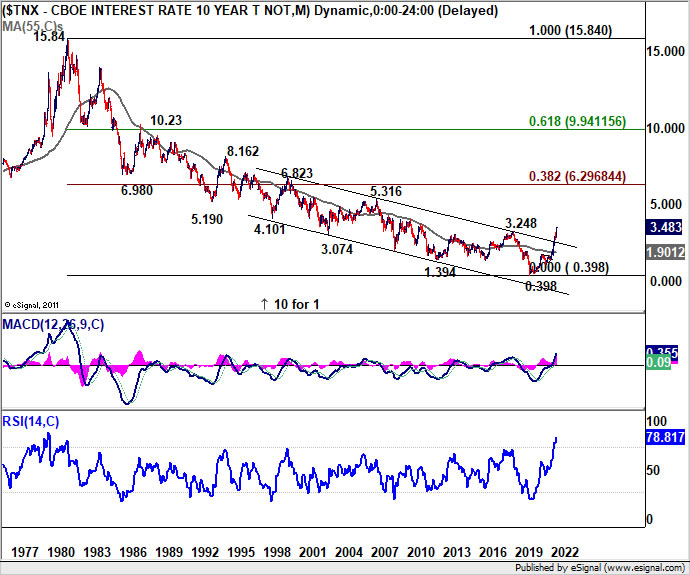
The strong rally, with acceleration in 10-year yield this week is a big surprise. 2018 high at 3.248 was taken out with ease and it's now close to 161.8% projection of 0.398 to 1.765 from 1.343 at 3.554. Break of 3.167 resistance turned support is needed to signal short term topping, or any retreat should be relatively brief. Sustained break of 3.554 will pave the way to 200% projection at 4.077, which is close to 4% handle.
Technical Outlook and Review
DXY:
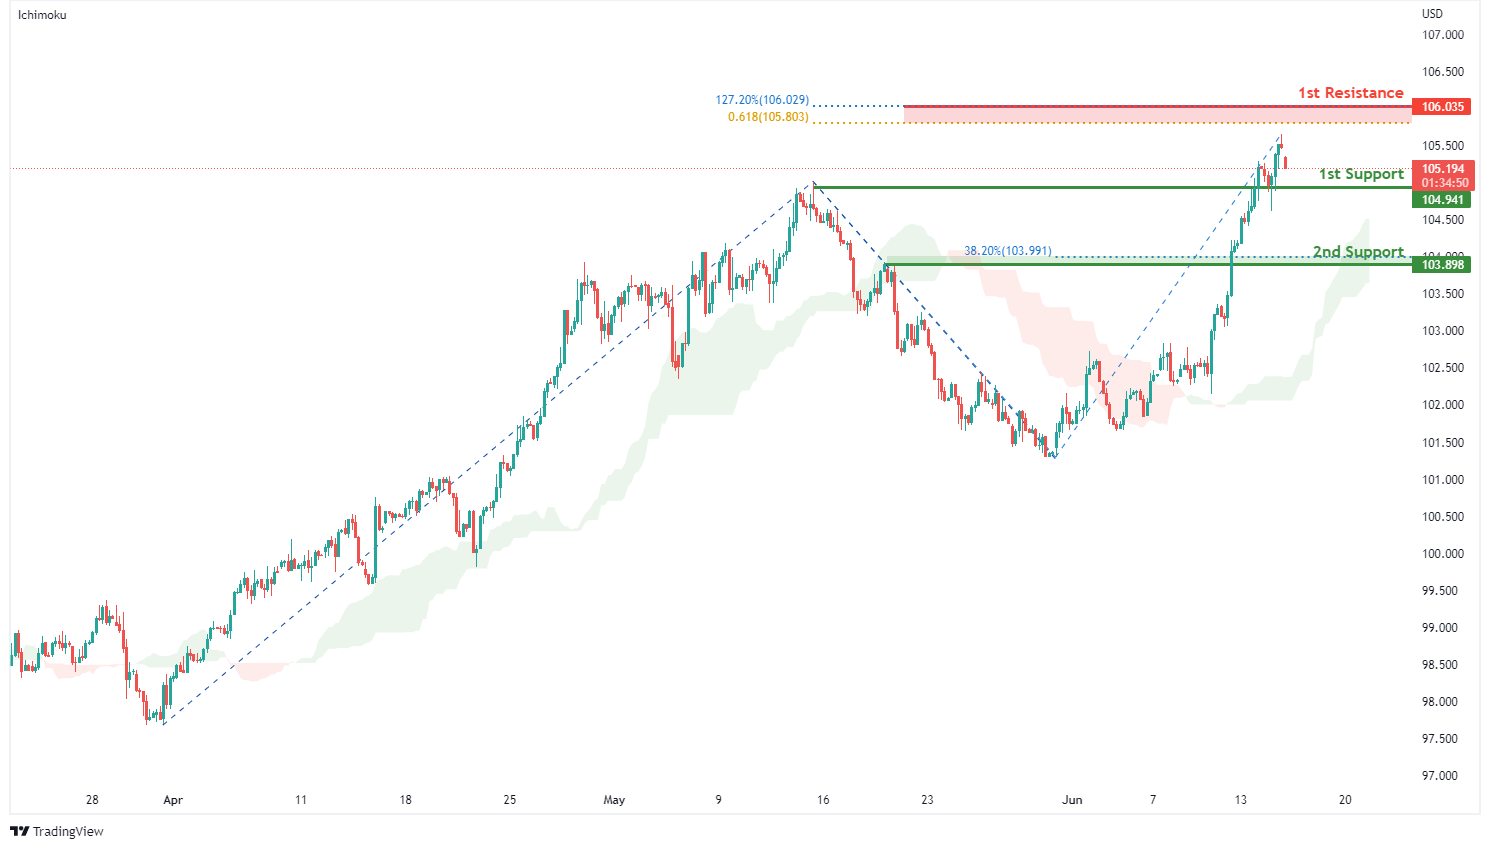
On the H4, with prices moving above the ichimoku indicator, we have a bullish bias that price will rise to our 1st resistance at 106.035 where the 127.2% fibonacci extension and 61.8% fibonacci projection are from our 1st support at 104.941 in line with the horizontal overlap support. Alternatively, price may break 1st support structure and head for 2nd support at 103.898 where the horizontal pullback support and 38.2% fibonacci retracement are.
Areas of consideration:
- H4 time frame, 1st resistance at 106.035
- H4 time frame, 1st support at 104.941
XAU/USD (GOLD):
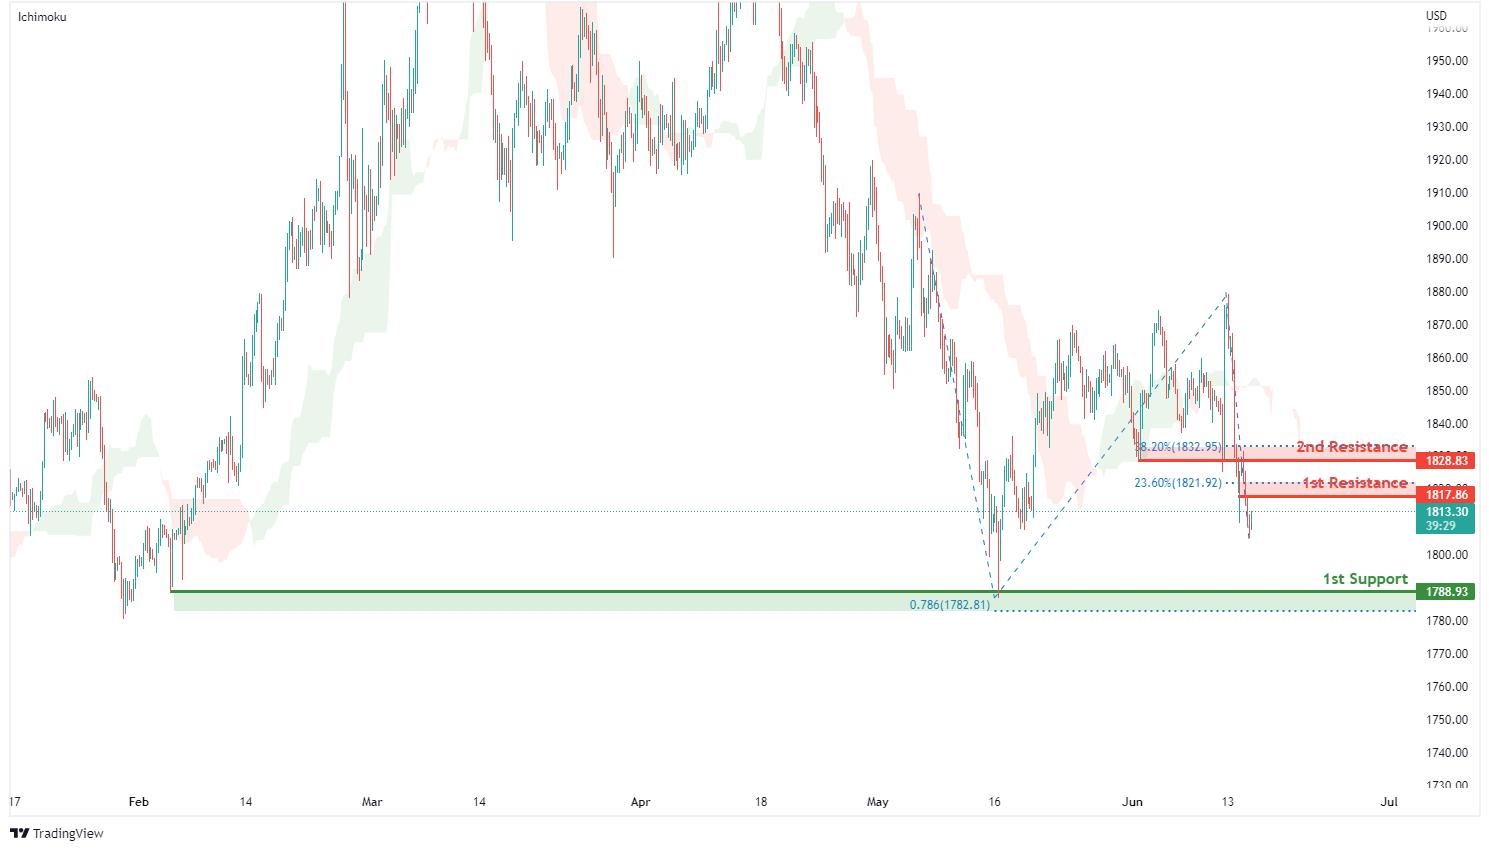
On the H4, with prices moving below the ichimoku indicator, we have a bearish bias that prices will drop from our 1st resistance at 1817.86 where the horizontal pullback resistance and 23.6% fibonacci retracement are to our 1st support at 1788.93 in line with swing low support and 78.6% fibonacci projection. Alternatively, price may break 1st resistance structure and head for 2nd resistance at 1828.83 in line with overlap resistance and 38.2% fibonacci retracement.
Areas of consideration:
- H4 time frame, 1st Resistance at 1817.86
- H4 time frame, 1st Support at 1788.93
GBP/USD:
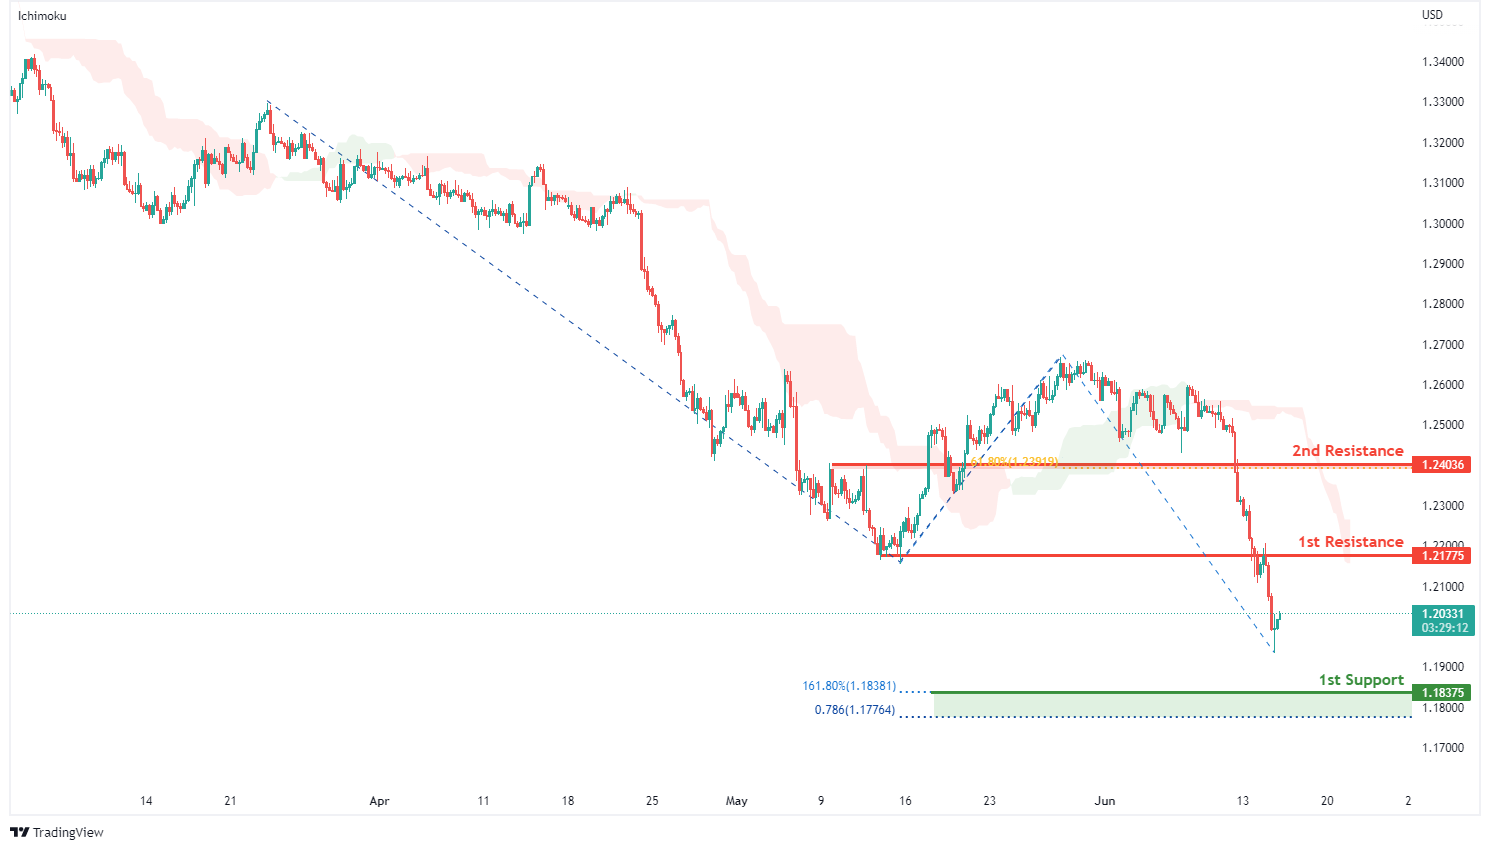
On the H4, with prices moving below the ichimoku indicator, we have a bearish bias that price will drop from our 1st resistance at 1.21775 where the horizontal overlap resistance is to our 1st support at 1.18375 in line with the 78.6% fibonacci projection and 161.8% fibonacci extension. Alternatively, price may break 1st resistance structure and head for 2nd resistance at 1.24036 where the horizontal overlap resistance and 61.8% fibonacci retracement are.
Areas of consideration:
- H4 1st resistance at 1.21626
- H4 1st support at 1.18375
USD/CHF:
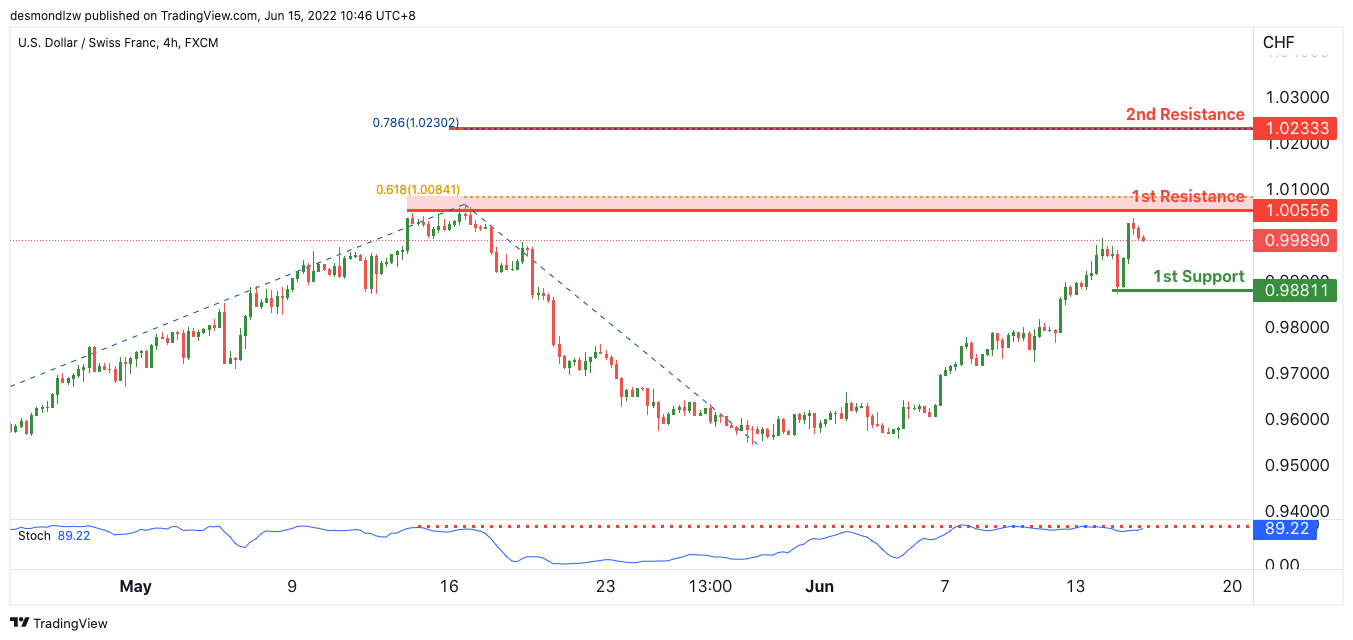
On the H4, with price expected to reverse off the stochastic indicator, we have a bearish bias that price will drop to our 1st support in line with the horizontal pullback support from our 1st resistance is where the pullback resistance is. Alternatively, price may break structure and head for our 2nd resistance in line with the horizontal swing high resistance and 78.6% Fibonacci projection.
Areas of consideration
- 1st support level at 0.98769
- 1st resistance level at 0.99786
EUR/USD :
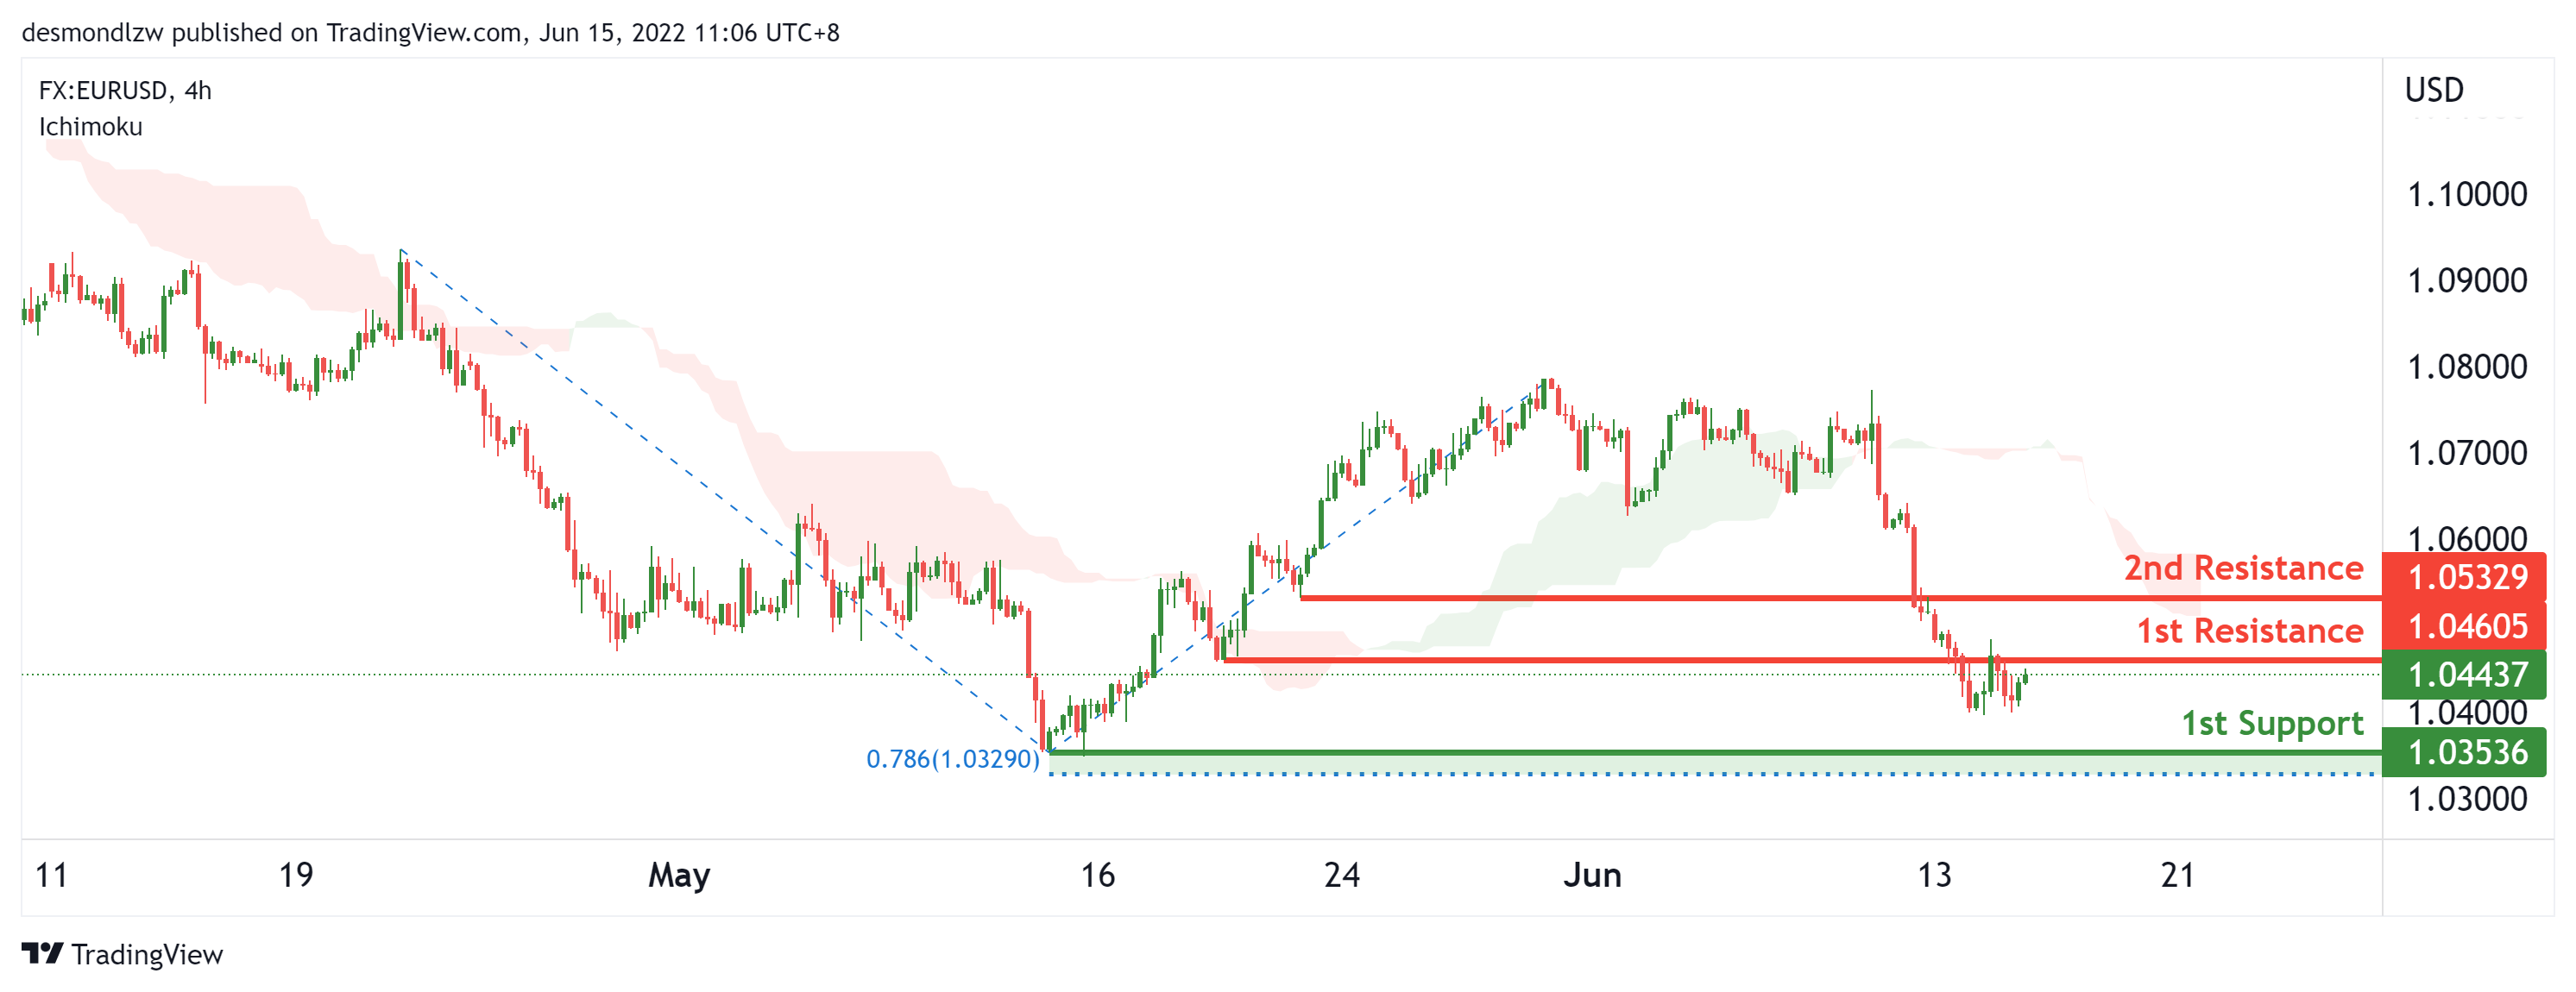
On the H4. with price moving below the ichimoku cloud, we have a bearish bias that price will continue to drop from our 1st resistance at 1.04605 in line with the pullback resistance to the 1st support at 1.03536 in line with the 78.6% fibonacci projection and horizontal swing low support. Alternatively, price may break the 1st resistance structure and rise to the 2nd resistance at 1.05329 in line with the pullback resistance.
Areas of consideration :
- H4 1st resistance at 1.04605
- H4 1st support at 1.03536
USD/JPY:
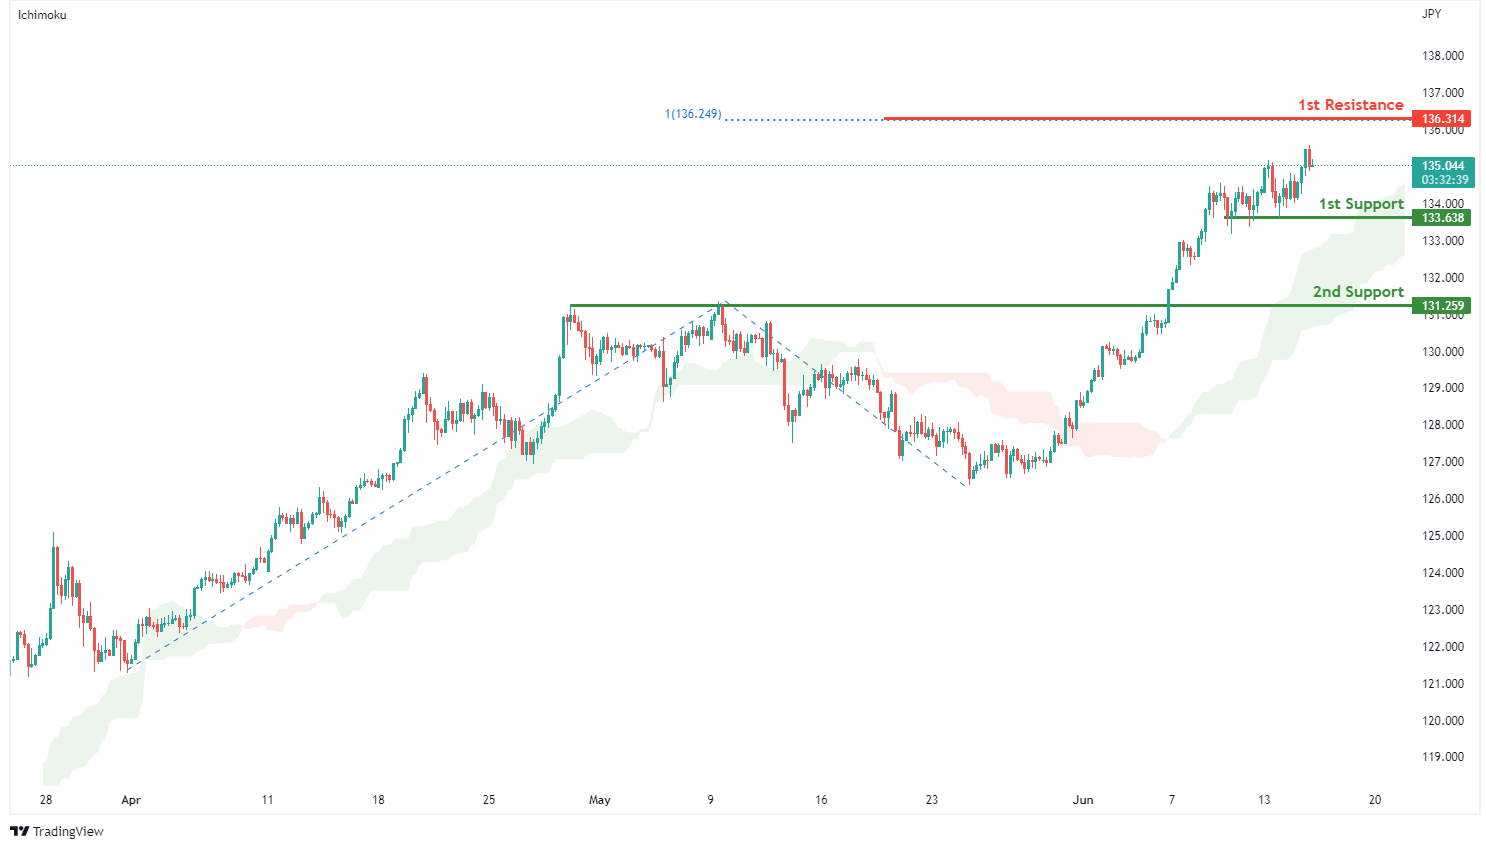
On the H4, with prices moving above the ichimoku indicator, we have a bullish bias that price will rise from our 1st support at 133.638 where the horizontal swing low support is to our 1st resistance at 136.314 in line with the 100% fibonacci projection. Alternatively, price may break 1st support structure and head for 2nd support at 131.259 where the horizontal overlap support is.
Areas of consideration:
- H4 time frame, 1st resistance at 136.314
- H4 time frame, 1st support at 133.638
AUD/USD:
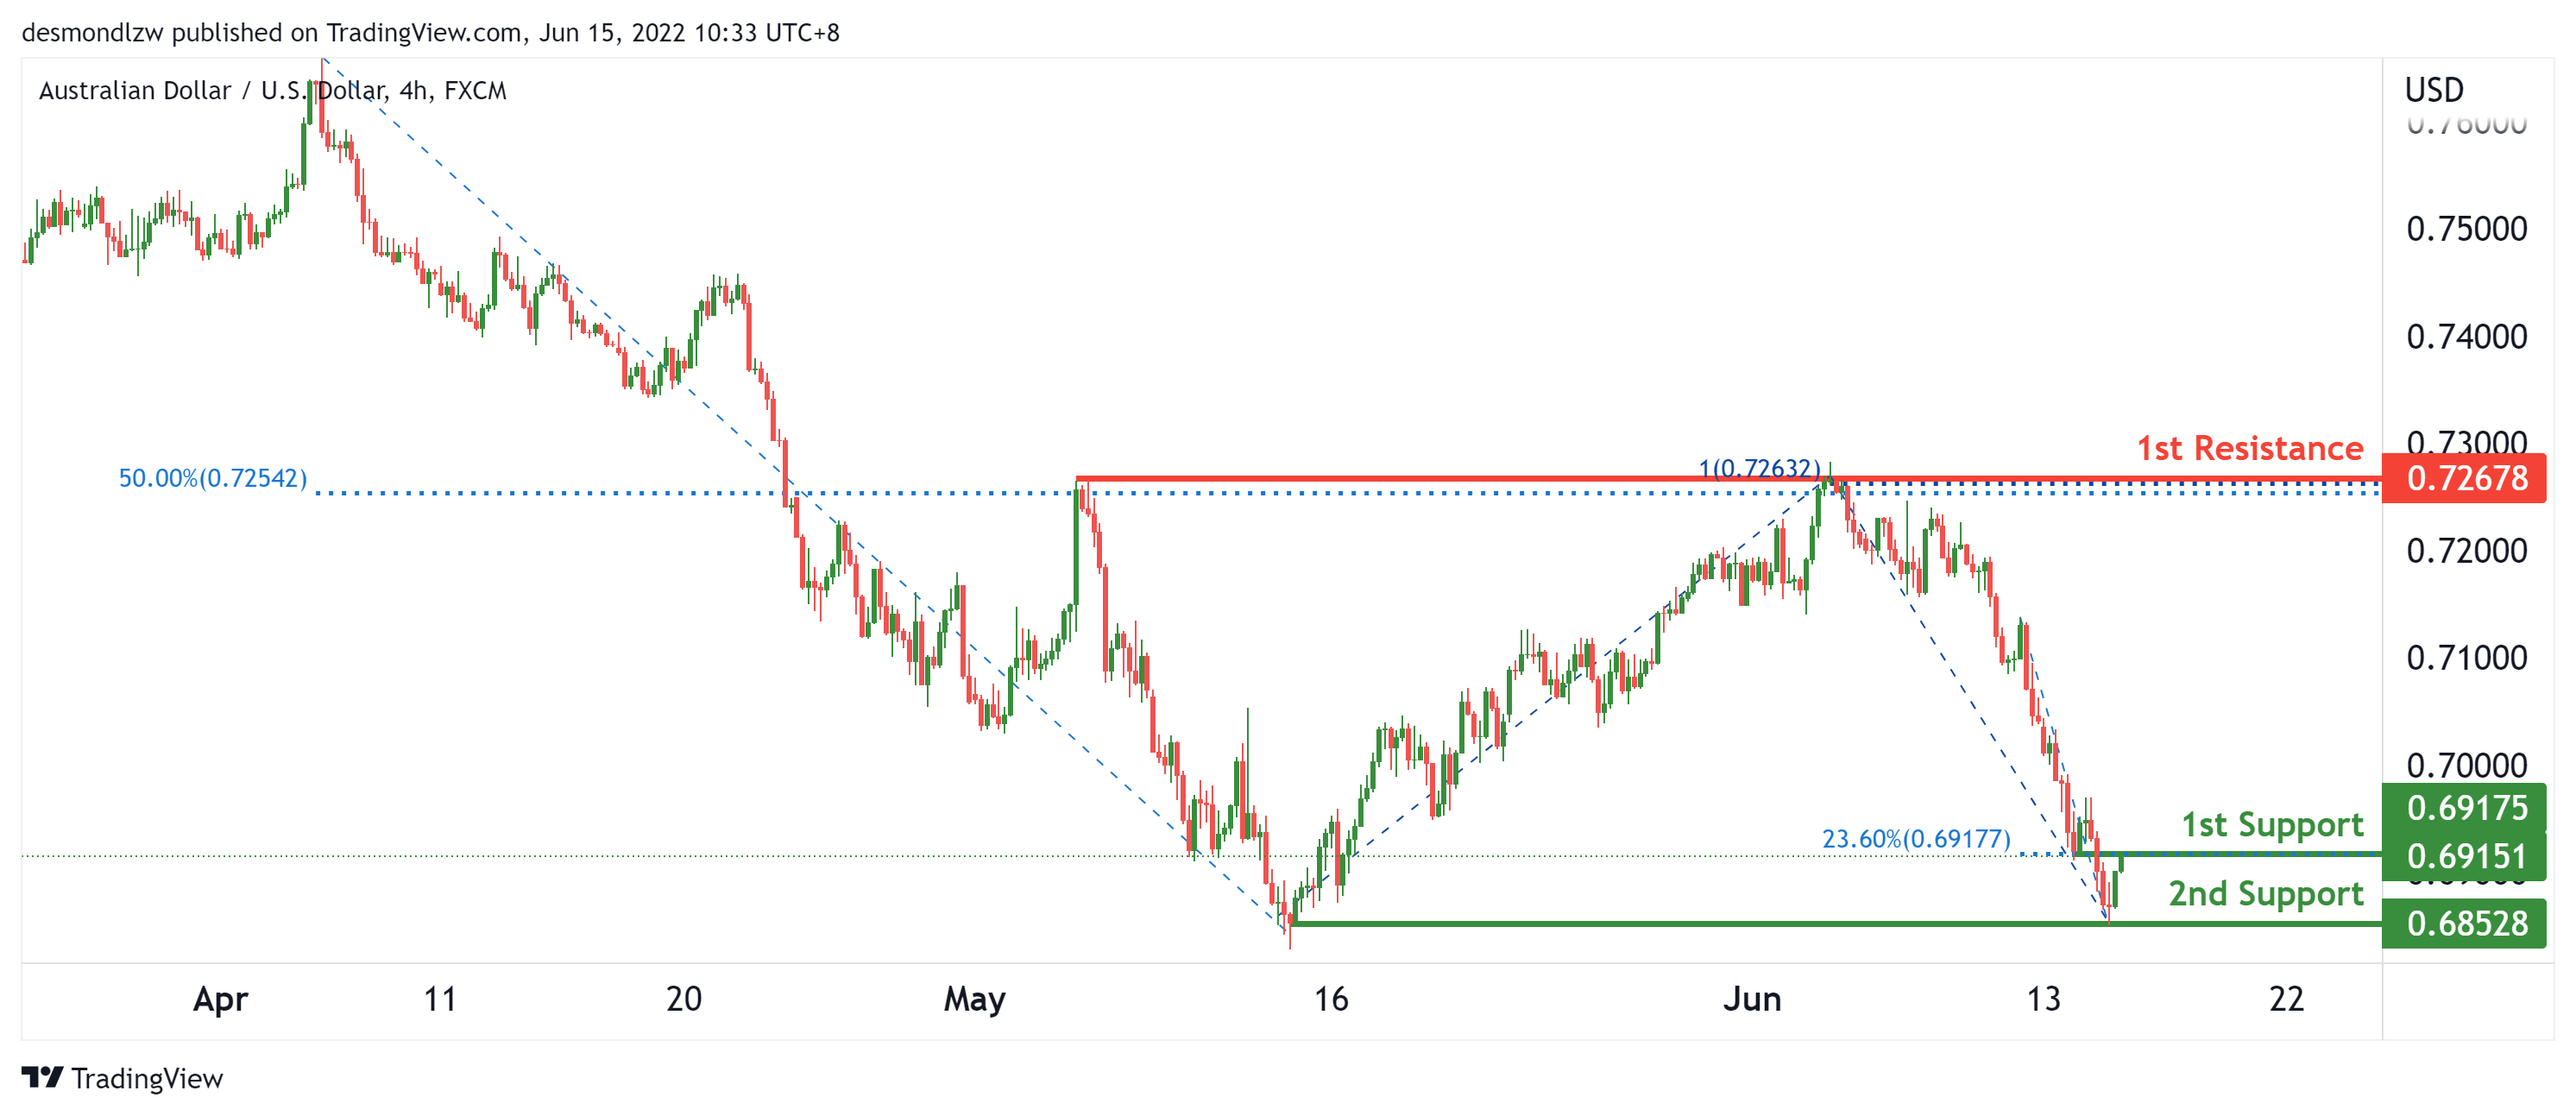
On the H4, price has recently reversed off the 2nd support at 0.68528 and we have a bullish bias that price will rise from the 1st support at 0.69175 in line with the 23.6% fibonacci retracement to the 1st resistance at 0.72678 in line with the 100% fibonacci projection and 50% fibonacci retracement. Alternatively, price may reverse off the 1st support and drop back down to the 2nd support in line with the multiple horizontal swing lows.
Areas of consideration
- H4 1st resistance at 0.72678
- H4 1st support at 0.69175
NZD/USD:
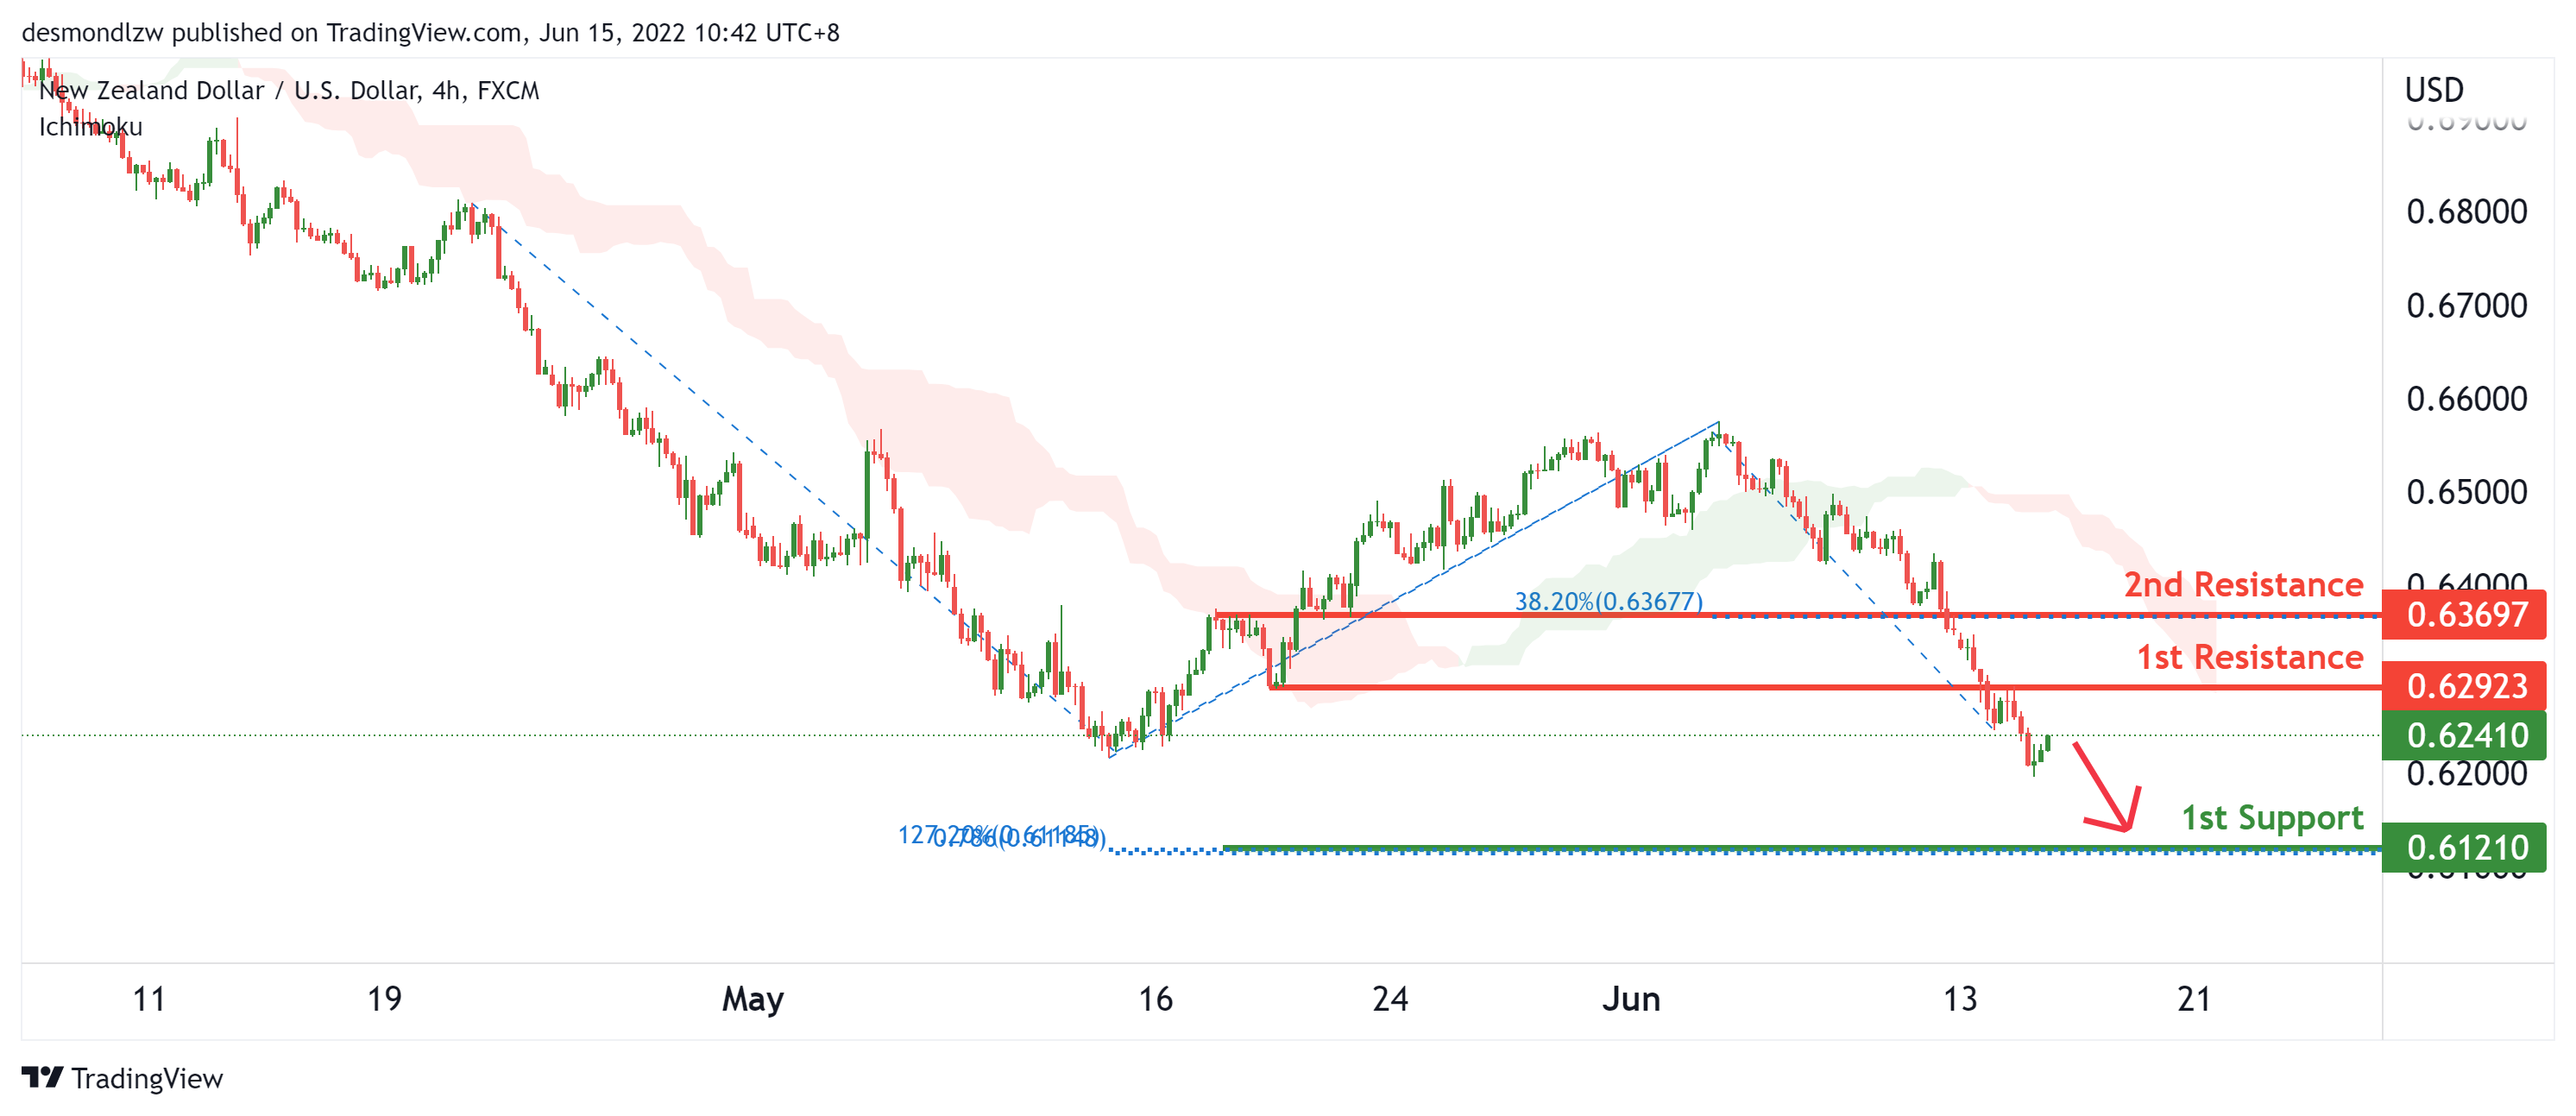
On the H4, with price moving below the ichimoku cloud, we have a bearish bias that price will drop from the 1st resistance at 0.62923 in line with the pullback resistance to the 1st support at 0.61210 in line with the 78.6% fibonacci projection and 127.2% fibonacci extension. Alternatively, price may break the 1st resistance structure and rise to the 2nd resistance at 0.63697 in line with the 38.2% fibonacci retracement and overlap resistance.
Areas of consideration:
- H4 time frame, 1st support at 0.61210
- H4 time frame, 1st resistance at 0.62923
USD/CAD:
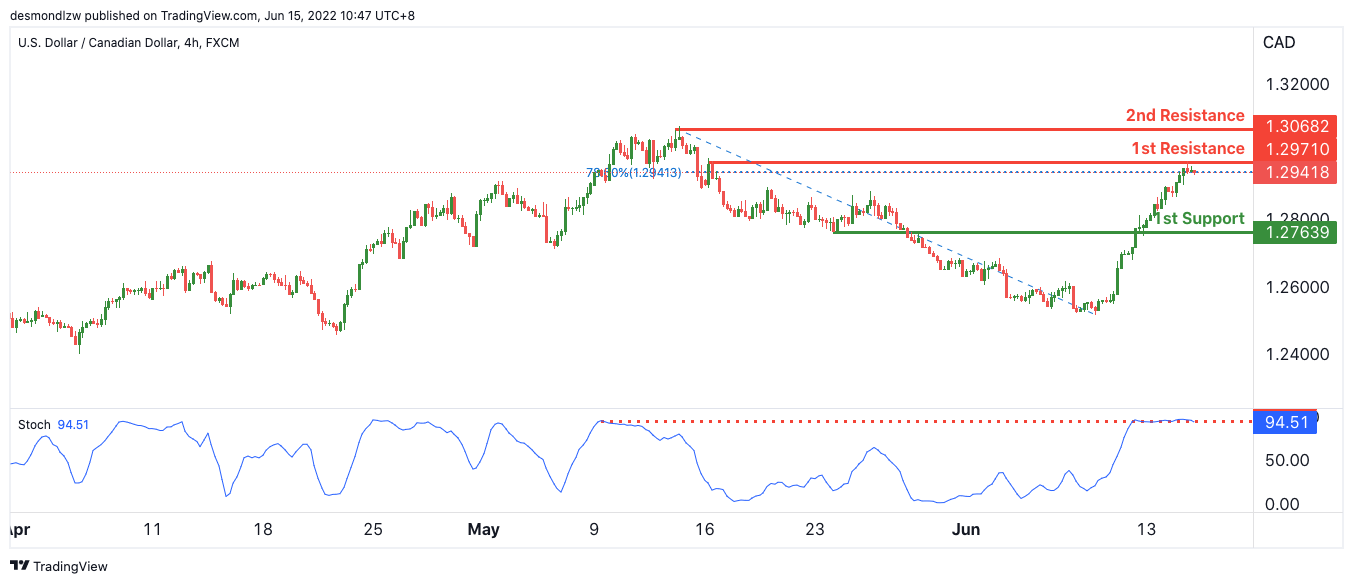
On the H4, with expected to reverse off the stochastics indicator, we have a bearish bias that price will drop to our 1st support at 1.27639 in line with the horizontal pullback support from our 1st resistance at 1.29710 where the pullback resistance and 78.6% Fibonacci retracement is. Alternatively, price may break structure and head for our 2nd resistance in line with the horizontal swing high resistance.
Areas of consideration:
- H4 time frame, 1st resistance at 1.29019
- H4 time frame, 1st support at 1.27639
OIL:
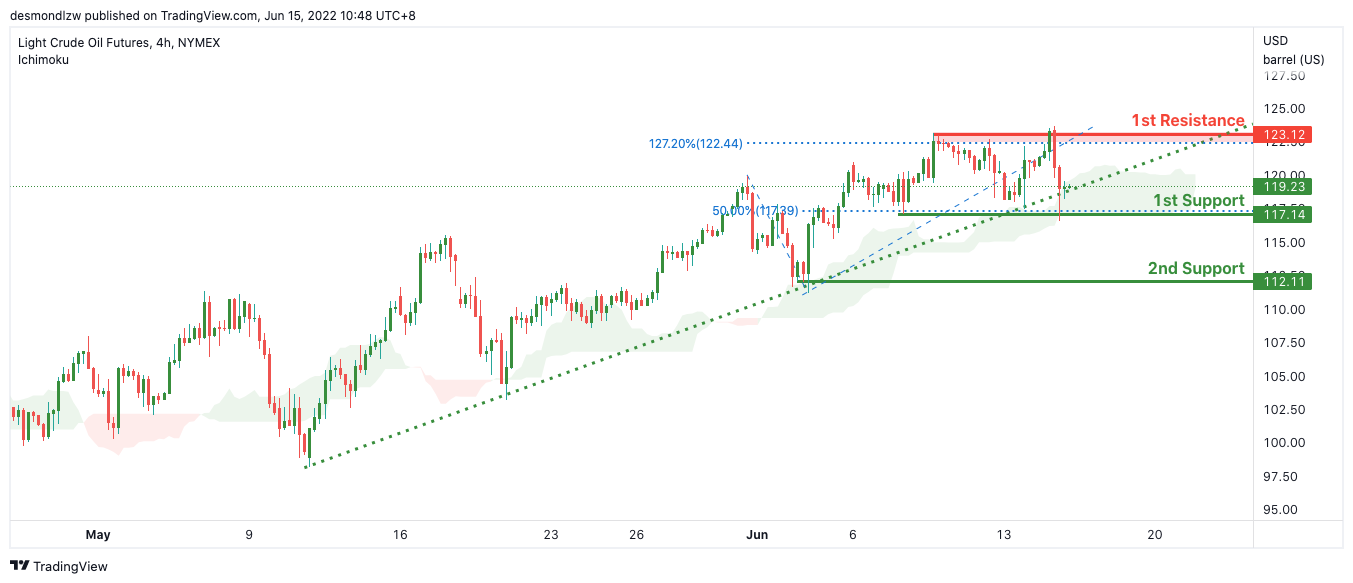
On the H4, with price moving above the ichimoku cloud, we have a bullish bias that price will rise from our 1st support at 117.14 where the horizontal swing low support and 50% Fibonacci retracement is to our 1st resistance at 123.12 in line with the horizontal swing high support. Alternatively, price may break structure and head for 2nd support where the horizontal swing low support is.
Areas of consideration:
- H4 time frame, 1st resistance of 123.12
- H4 time frame, 1st support of 117.14
Dow Jones Industrial Average:
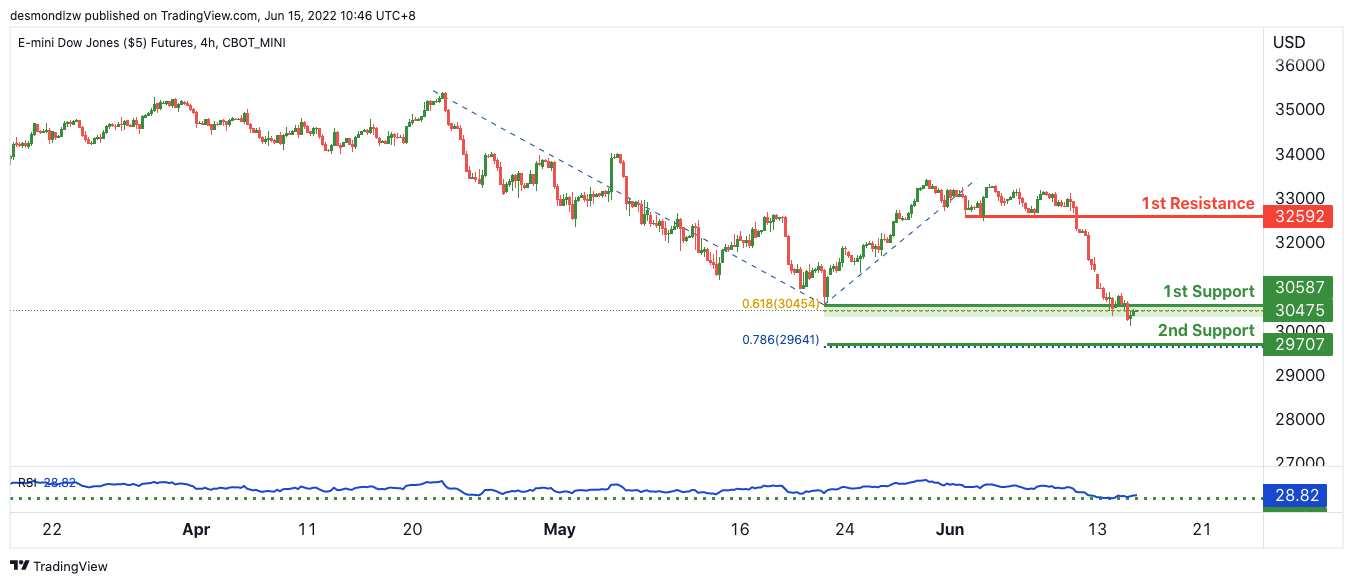
On the H4, with price expected to bounce off the stochastics indicator, we have a bullish bias that price will rise from our 1st support at 30568 where the horizontal swing low support and 61.8% Fibonacci projection is to our 1st resistance at 32592 in line with the horizontal pullback support. Alternatively, price may break structure and head for 2nd support where the 78.6% Fibonacci projection is.
Areas of consideration :
- H4 time frame, 1st resistance at 32587
- H4 time frame, 1st support at 30568
China industrial production rose 0.7% yoy in May, retail sales down -6.7% yoy
China industrial production rose 0.7% yoy in May, much better than expectation of -1.0% yoy decline. Retail sales dropped -6.7% yoy, above expectation of -7.3% yoy. Fixed asset investment rose 6.2% ytd yoy, above expectation of 6.0%.
The National Bureau of Statistics said the economy "showed a good momentum of recovery" in the month, "with negative effects from Covid-19 pandemic gradually overcome and major indicators improved marginally."
Still, it warned, "we must be aware that the international environment is to be even more complicated and grim, and the domestic economy is still facing difficulties and challenges for recovery."
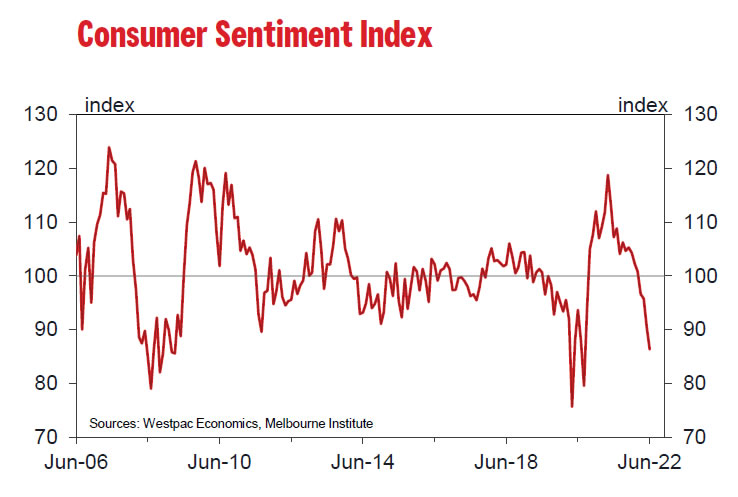
Australia Westpac consumer sentiment dropped to 86.5, on inflation and interest rate
Australia Westpac Consumer Sentiment dropped from 90.4 to 86.5 in June. Over the 46-year history of the survey, the reading was only at or below this level during "major economic dislocations", including during COVID-19, the Global Financial Crisis, early 90s recession, mid-80s slowdown and early 80s recession.
Westpac said: "The survey detail shows a clear picture of a slump in sentiment being driven by rising inflation; an associated lift in interest rates; and a loss of confidence around the economic outlook, both here and abroad."
Regarding RBA policy, Westpac expects another 50bps rate hike in July, as the central bank needs to move quickly in the early stages in a tightening cycle when interest rates are clearly below neutral and risk of over-tightening is moderate.
Fed Policy Meeting: Switching to Sharper Rate Hikes?
The Federal Reserve is undoubtedly expected to approve another jumbo-sized rate hike at the conclusion of its policy meeting on Wednesday at 18:00 GMT. Following the latest surprise pickup in inflation, investors have immediately become certain that the central bank may proceed with a triple rate increase in the following two meetings, though whether the Fed will violate its guidance to meet market expectations remains to be seen. If it moves forward, traders will probably need good assurances that the economy will stay afloat to push the dollar higher.
Investors wait for a triple rate hike
Recession fears have been stubbornly creeping into global markets since the previous FOMC policy meeting, undermining the Fed’s aggressive rate hike campaign, especially after GDP data revealed a shallow annualized economic contraction in the first quarter for the first time since mid-2020 because of trade imbalances and weaker inventory growth.
Despite the negative GDP prints, the data indicated a resilient domestic demand. Personal consumption and private investment picked up steam, allowing the Fed to stick to its plan and ramp up its fight against inflation by delivering a sharper 50bps rate hike in May as widely expected. It was the biggest rate increase since the dotcom bubble two decades ago, but the Fed said that it will not stop there, showing stronger commitment to similar rate increases in June and July.
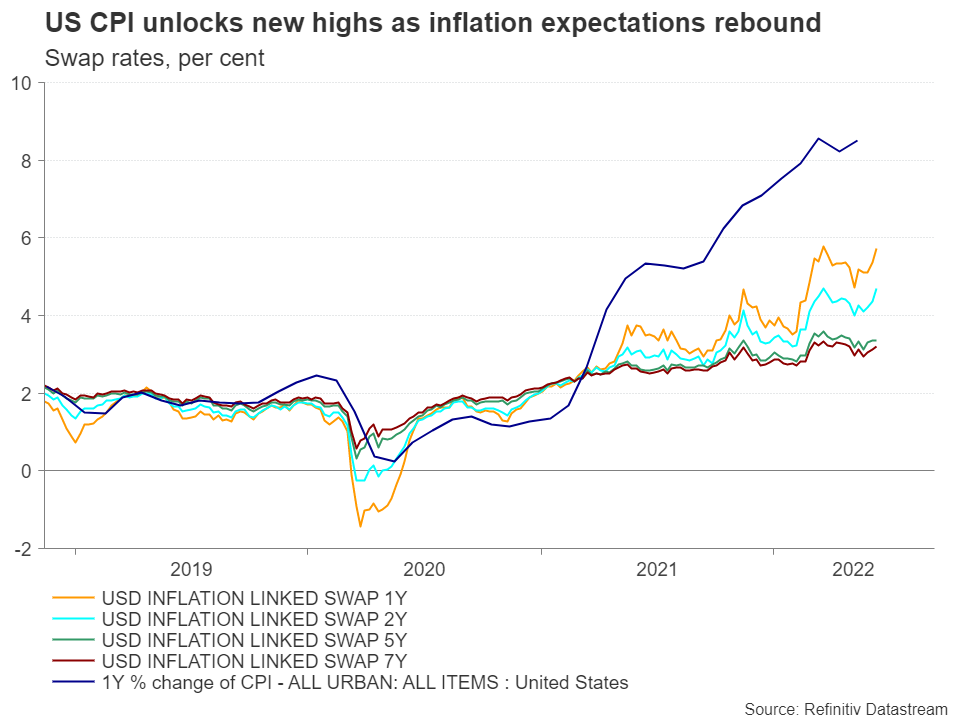
The latest CPI report, however, and the rebound in inflation expectations signaled that rate increases have been ineffective so far this year and the Fed will need to gear up its rate hike plan to ramp up its fight against inflation. Although hopes for an inflation peak gained significant popularity recently because of potential fading base effects, May’s headline inflation figure surprisingly marked the highest annual growth of 8.6% since 1981 on the back of energy and services costs, suggesting instead that there is no immediate relief from inflation in sight. Consequently, investors became immediately certain that the Fed will sharpen its rate increases to 75 bps this month and in July and return to 50 bps rate hikes in the last two meetings of the year.
Economic weakness starts to shape up, but will the Fed proceed?
Well, there is speculation that the Fed is behind the curve, and more needs to be done as long as the labor market remains tight, and demand keeps supporting the economy. That said, the Fed has been persistently favouring a smooth transition, clearly telegraphing its policy intentions to the public since the start of the year. If it surprisingly violates its guidance this time to meet market expectations for a 75 bps rate increase, there is a danger it will lose credibility - which is hard to regain.
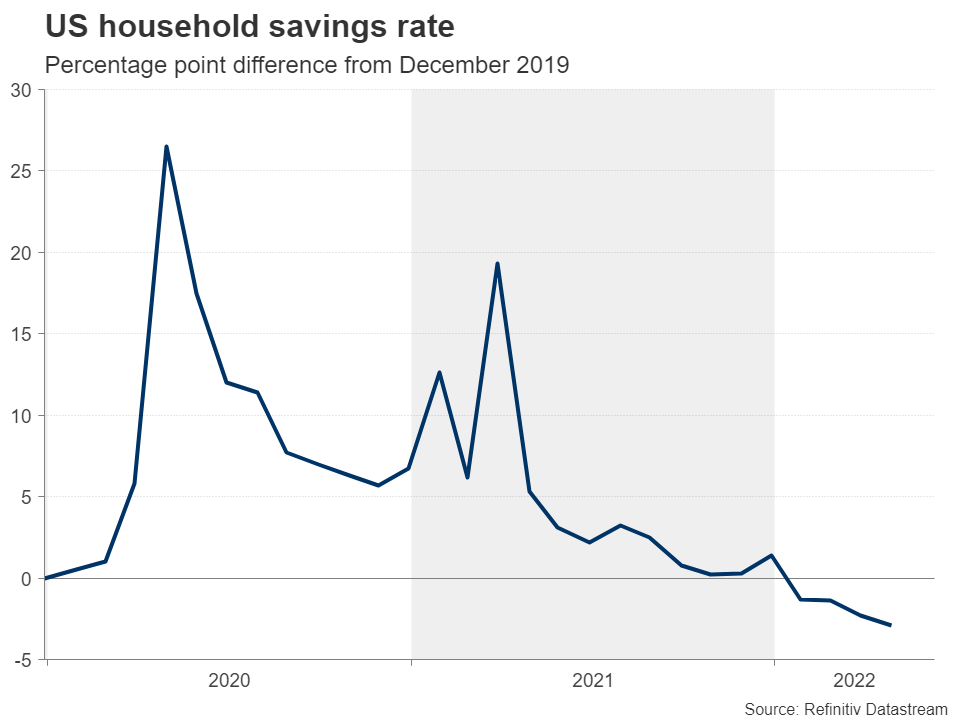
Of course, there is some growing evidence that the US economy continued to lose steam in the second quarter. The savings rate, which skyrocketed during the lockdown periods, has slumped to the lowest since 2008, somewhat justifying the resilience in consumption. Home sales declined for the third straight month in April as higher mortgage rates and rising prices weighed, while jobless claims rose to the highest since the start of the year, portraying some cooling in the tight labor market too. In addition, the Fed’s latest Beige book for May detected moderation in retail and real estate markets and more importantly, diminishing growth expectations.
USD/JPY
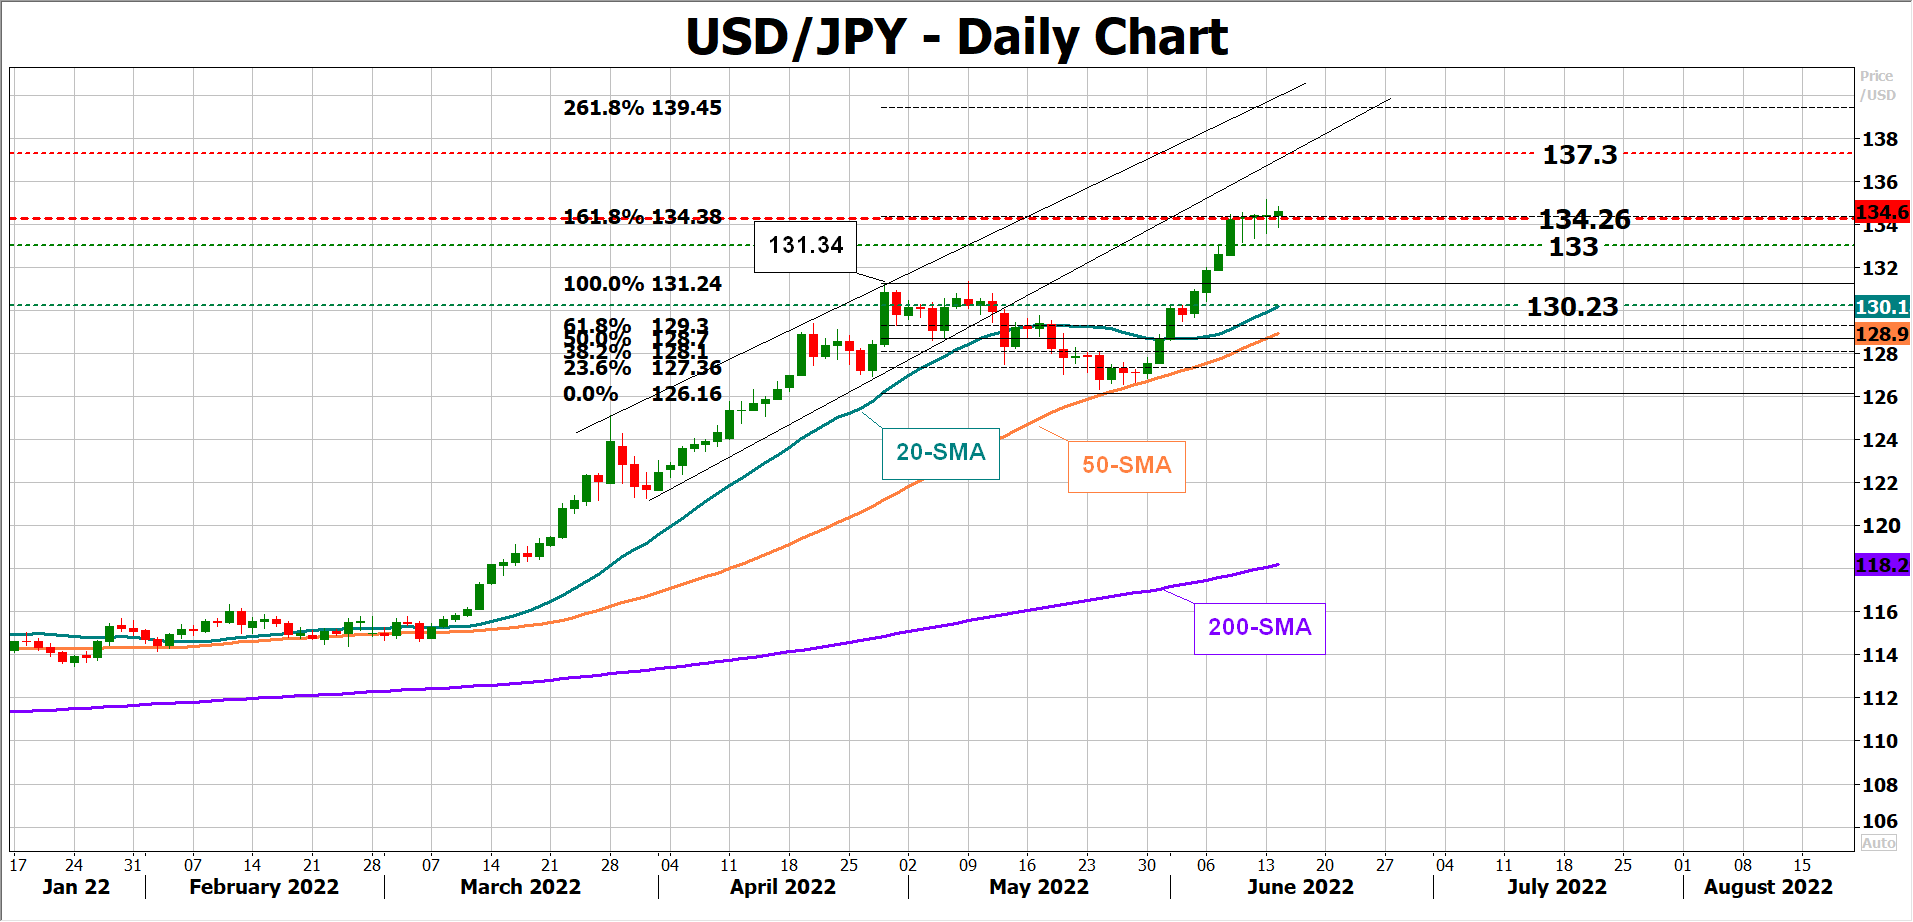
The Fed, however, will likely play a safe game and stay on course, avoiding any reference to the R word for now, which could add more fuel to the stock sell-off. That could consequently disappoint a large group of investors, who anticipate a triple rate hike this week, and hence pressure dollar/yen below the nearby resistance of 134.26, especially if Powell entirely excludes the case of super-sized 75 bps rate hikes in the future.
In the hawkish scenario, where the Fed listens to market expectations and more policymakers place their rate projections for super-sized rate increases in the year ahead, Powell will need to provide a good justification that the economy is resilient enough to absorb sharper rate increases without falling into severe recession. In this case, dollar/yen could initially spike up to the 136.00 – 137.50 area and then towards the 139.15 region, which is the 261.8% Fibonacci extension of the previous downleg.
GBPUSD Wave Analysis
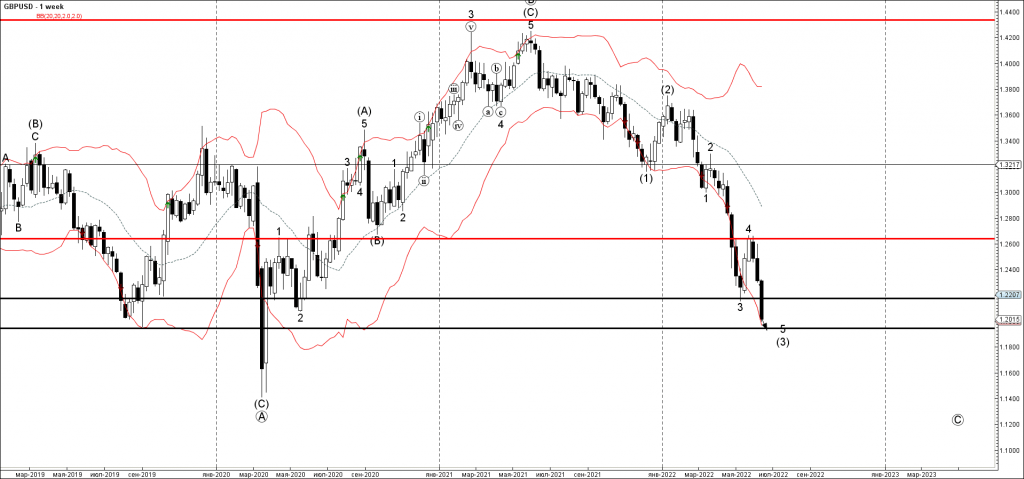
- GBPUSD broke support level 1.2175
- Likely to fall to support level 1.1945
GBPUSD currency was under bearish pressure after the pair broke the support level 1.2175 (which stopped wave 3 in the middle of 2022).
The breakout of the support level 1.2175 accelerates the active impulse wave 5 of the intermediate impulse wave (3) from the start of January.
Given the clear daily downtrend, GBPUSD can be expected to fall further toward the next support level 1.1945 (target for the completion of the active impulse wave 5).
EURGBP Wave Analysis
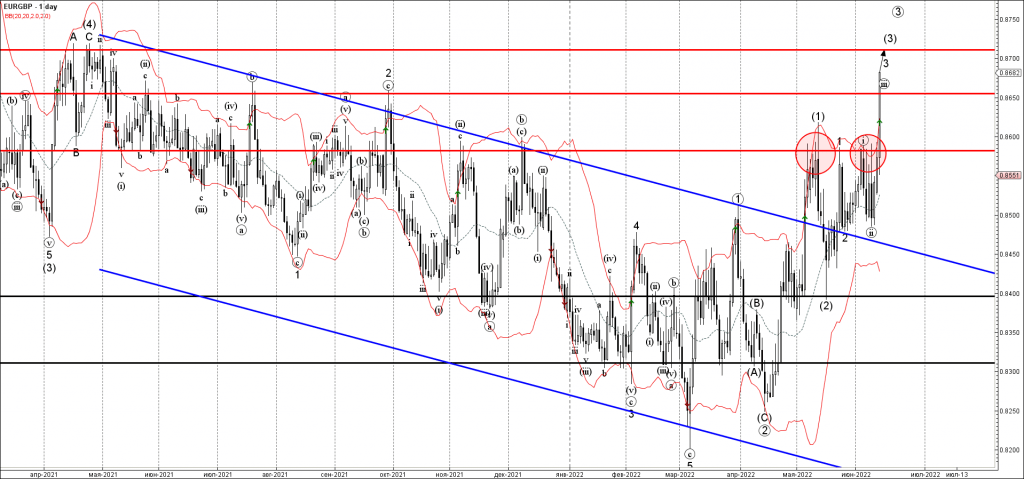
- EURGBP broke resistance level 0.8585
- Likely to rise to resistance level 0.8700
EURGBP currency continued to rise strongly after this currency pair broke above the key resistance level 0.8585 (which has been repeatedly reversing the pair from November).
The breakout of the resistance level 0.8585 accelerated the active impulse waves 3 and (3) – which then broke above the next major resistance level 0.8650.
EURGBP can be expected to rise further toward the next resistance level 0.8700 (former strong resistance from April of 2021).
Eco Data 6/15/22
[php_everywhere instance="1"]
Kiwi Caught in Fed and Inflation Crossfire, New Zealand GDP Might Not Help
New Zealand’s economy has had a bumpy but strong recovery from the pandemic lockdowns and data due on Thursday (Wednesday, 22:45 GMT) is expected to show GDP kept expanding in the first quarter. The healthy economic backdrop has allowed the Reserve Bank of New Zealand to ramp up rate increases as inflation has skyrocketed. But the local dollar has not been able to enjoy much of a boost from tighter monetary policy as the market turmoil from inflation and recession worries has only favoured the mighty US dollar.
From virus crisis to inflation crisis
Despite having one of the most stringent virus curbs in the world, New Zealand’s gross domestic product (GDP) was the first to rise above pre-pandemic level. But GDP peaked in the second quarter of 2021 and growth in Q1 is unlikely to be strong enough to surpass it. New Zealand tightened its virus rules in the first few months of the year as the country battled the Omicron wave.
Nevertheless, consumption fell only marginally, while higher commodity prices boosted the income earned from exports. Overall, the economy is expected to have expanded by 0.6% over the quarter and by 5.3% in the 12 months to March.
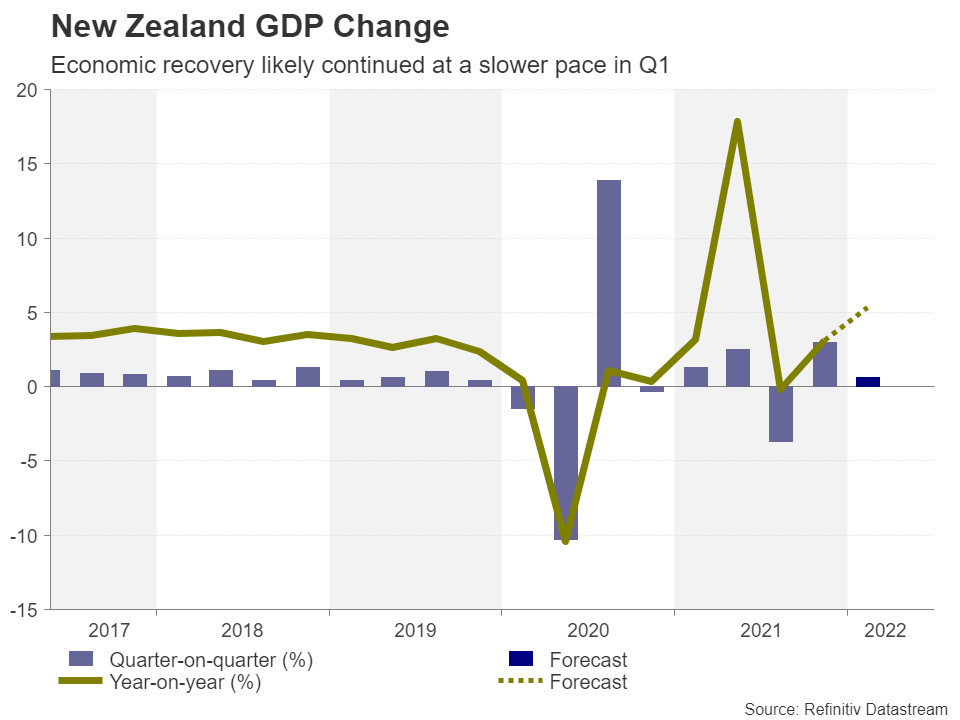
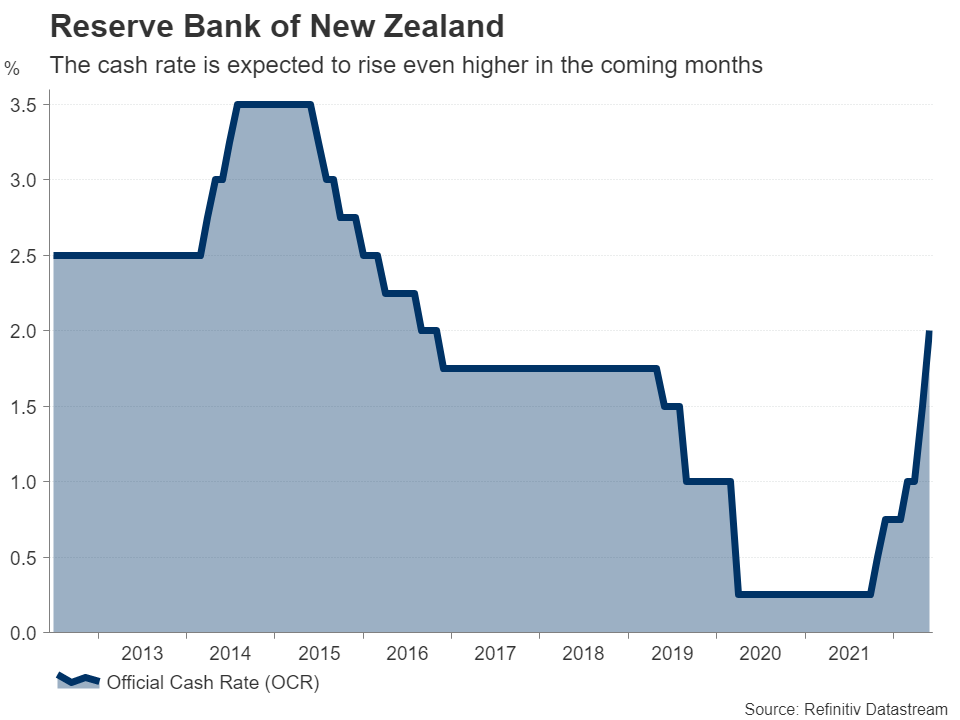
Growth in the second quarter likely accelerated as most restrictions have now been lifted. However, the economy is facing a different threat and this time it’s not a new Covid variant. As in most other countries, inflation is surging. New Zealand’s consumer price index jumped the most in more than 30 years in the first quarter, hitting 6.9% y/y. The RBNZ has already raised the cash rate to 2.0% but more hikes are on the way.
RBNZ leads in terms of stimulus withdrawal
The central bank has even gone a step further than its global peers by deciding to actively sell its government bond holdings. Over a five-year plan, the RBNZ will reduce its pandemic-era bond purchases by NZ$5 billion a year down to zero. The decision last week fuelled the selloff in New Zealand government debt as it came at a time when bonds are already under pressure from intensifying expectations that central banks will have to get a lot tougher to bring inflation under control.
The immediate risk in New Zealand from higher rates is the impact on the housing market from rising mortgage costs. A slowdown is already underway in the property sector and house prices have started to decline in many regions. A sharp drop in prices could eventually hit consumer confidence and that would be even more bad news for the economy.
However, New Zealand isn’t quite in the recession danger zone like many European economies are for example, and there are several positives for the outlook. For one, the government recently unveiled plans to spend up to NZ$1 billion to help low income families with the cost of living crisis, and this could only be the start of a new round of fiscal stimulus. China’s easing of its virus restrictions is another positive as it bodes well for exporters, not to mention the tight labour market.
Kiwi has been a surprise laggard
This then begs the question as to why the New Zealand dollar has been performing so poorly against the greenback this year. The kiwi’s year-to-date losses stand at about 8.5%, worse only than the yen and pound. New Zealand’s large current account deficit might explain why the kiwi is seen as a riskier bet than it’s aussie cousin.
But generally, risky currencies like the pound, aussie and kiwi take their cues as much from the US dollar and the mood on Wall Street as from domestic policies. With expectations of Fed rate hikes being continuously scaled up, the greenback has been on a winning streak this year, overpowering currencies with similarly if not more hawkish central banks as it has the added attraction of being the world’s reserve currency.
$0.62 level is looking shaky
Unless broader market sentiment improves – something that can only happen if inflationary pressures begin to ease – solid economic indicators out of New Zealand are unlikely to substantially shore up the kiwi, which is in danger of brushing a fresh two-year low soon.
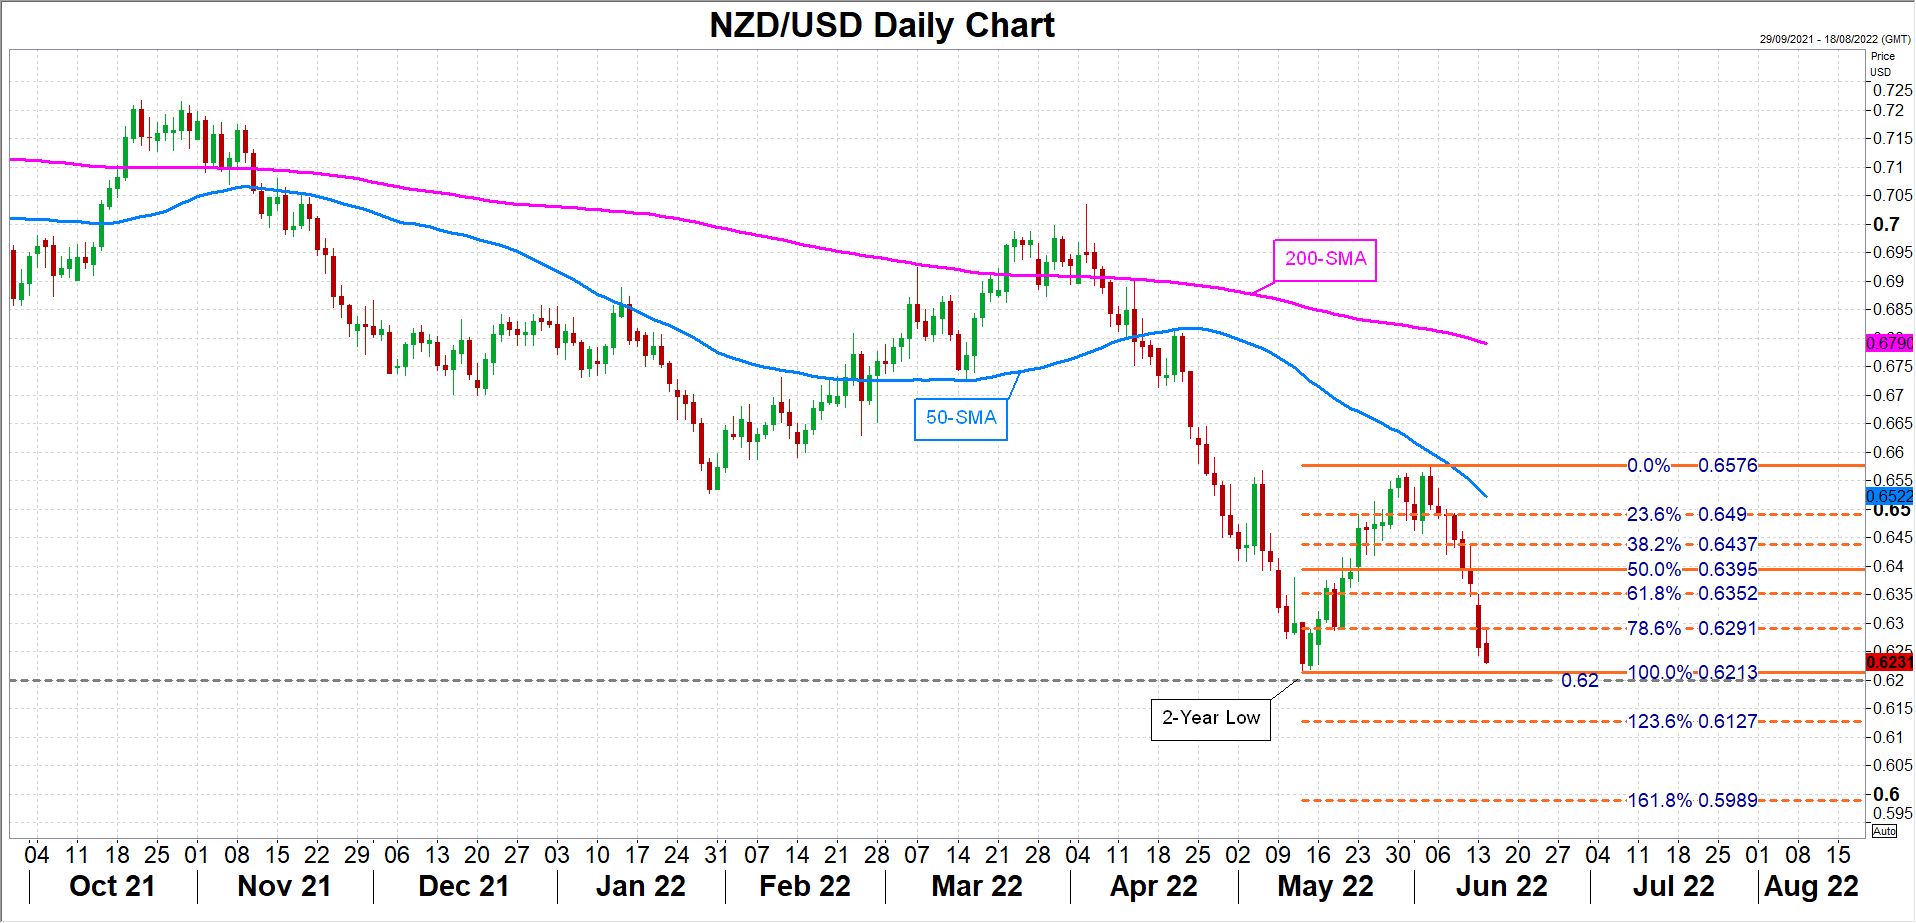
If the May trough of $0.6213, or more importantly, the $0.62 level is breached, the next stop could be the 123.6% Fibonacci extension of the May-June rebound at $0.6127, followed by the 161.8% Fibonacci of $0.5989.
However, should the selling pressure subside, the kiwi could initially recover towards the 50% Fibonacci of $0.6395 before having another go at the June peak of $0.6576.
Bitcoin Falls to 18-mth Low; Consolidation Likely to Precede Push Towards Key Supports
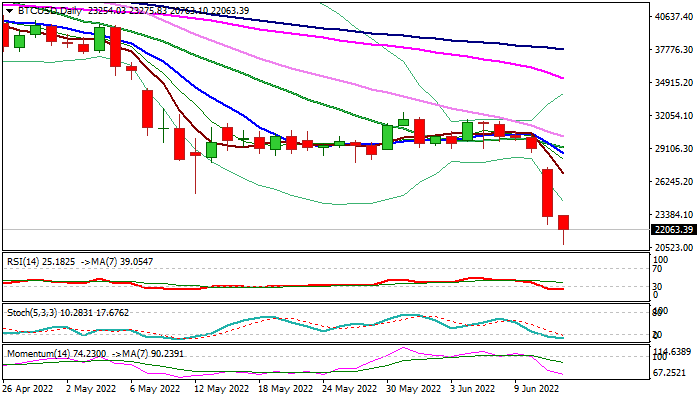
The Bitcoin hit the lowest in 18 months on Tuesday, in extension of Monday’s 15% drop, following weekly gap-lower opening and subsequent acceleration lower.
Crypto’s remain under pressure from Fed rate hikes, while the latest US inflation report showed that prices continue to rise that fuels expectations on more aggressive action from the US central bank on Thursday’s policy meeting (economists rise bets for 0.75% hike vs initially expected 50 basis points raise) that would add to the pressure.
Psychological 20k support and Fibo level at 19143 (76.4% of 3770/68911 rise) are in focus, but bears are likely to face strong headwinds at this zone, as daily studies are oversold and cracked 200WMA (22267) also obstructs bears , with failure to close below the indicator to signal that bears are running out of steam.
Overall structure remains firmly bearish, with profit-taking ahead of key supports, to give larger bears time to consolidate.
Fibo levels of the latest downleg from 31702 at 23345(23.6%) and 24942 (38.2%) offer solid resistances, while lift above 50% retracement (26233) would sideline immediate bears for possible stronger correction.
Res: 23345; 24942; 25223; 26233
Sup: 20763; 20000; 19143; 17540