Sample Category Title
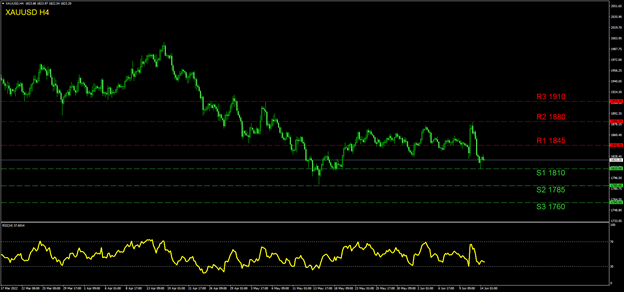
Eurozone industrial production rose 0.4% mom in Apr, EU up 0.3% mom
Eurozone industrial production rose 0.4% mom in April, below expectation of 0.5% mom. Production of energy rose by 5.4%, intermediate goods by 0.7%, non-durable consumer goods by 0.4% and durable consumer goods by 0.2%, while production of capital goods fell by -0.2%.
EU industrial production rose 0.3% mom. Among Member States for which data are available, the highest monthly increases were registered in the Netherlands (+5.6%), Finland (+3.5%) and Luxembourg (+3.2%). The largest decreases were observed in Ireland (-9.6%), Greece (-7.4%) and Lithuania (-7.1%).
GBP/JPY Daily Outlook
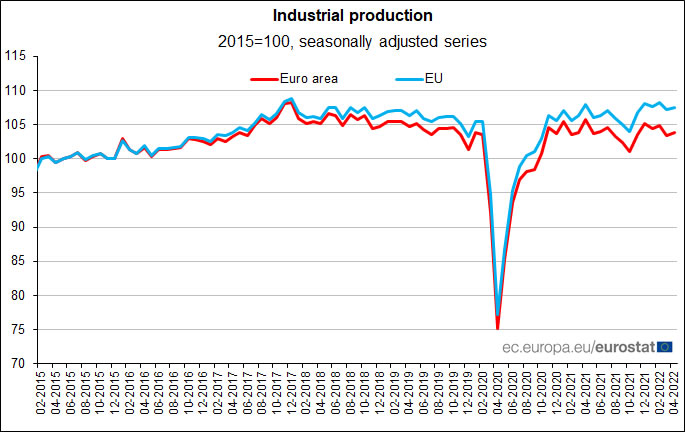
Daily Pivots: (S1) 161.10; (P) 162.71; (R1) 164.09; More...
GBP/JPY's fall from 168.67 is still in progress and intraday bias stays on the downside. Sustained break of 55 day EMA (now at 161.63) will bring deeper decline to 155.57 support. On the upside, above 165.14 minor resistance will turn bias back to the upside for 168.67 again.
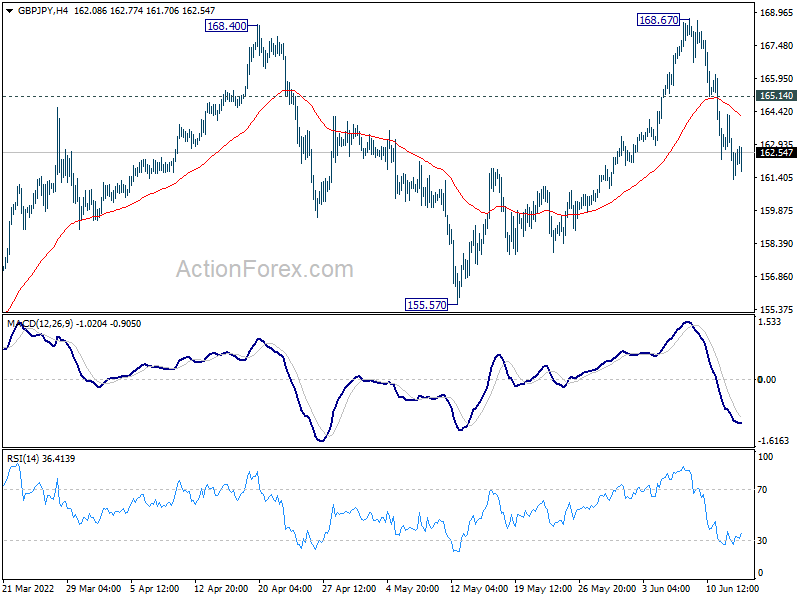
In the bigger picture, up trend from 123.94 (2020 low) is still in progress. Sustained break of 61.8% retracement of 195.86 (2015 high) to 122.75 (2016 low) at 167.93 will be a long term bullish signal, and could pave the way back to 195.86 high. This will now remain the favored case as long as 155.57 support holds, even in case of deep pull back.
EUR/JPY Daily Outlook
Daily Pivots: (S1) 140.02; (P) 140.56; (R1) 141.63; More....
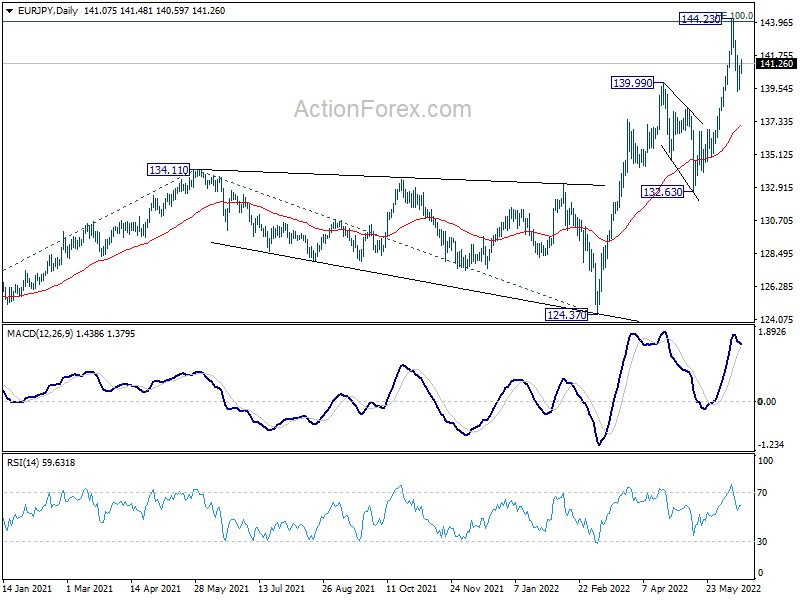
Intraday in EUR/JPY neutral with current recovery. On the upside, above 141.77 minor resistance will turn bias back to the upside for retesting 144.23. On the downside, below 139.37 will resume the fall from 144.23 to 55 day EMA (now at 137.16).
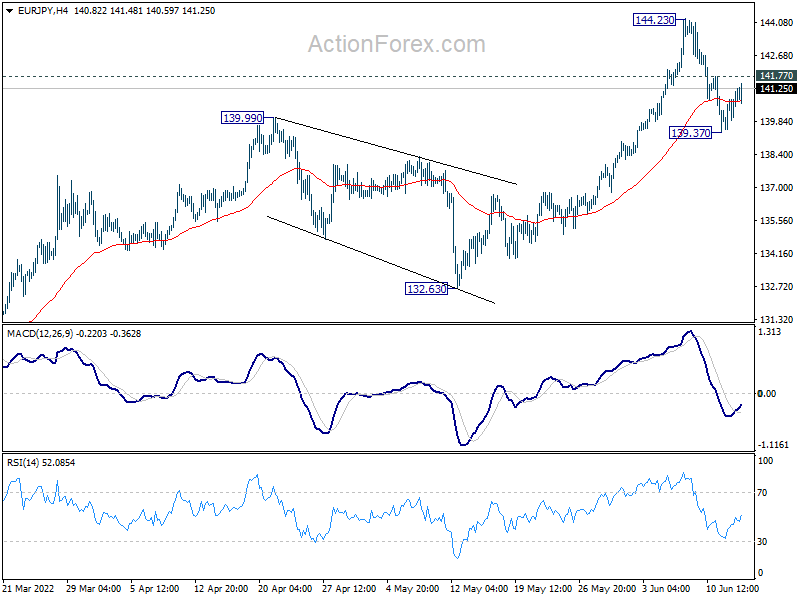
In the bigger picture, up trend from 114.42 (2020 low) is in progress. Such rise is seen as the third leg of the pattern from 109.30 (2016 low). Sustained trading above 100% projection of 114.42 to 134.11 from 124.37 at 144.06 will indicate upside acceleration and target 149.76 long term resistance (2014 high). In any case, outlook will now remain bullish as long as 132.63 support holds, in case of deep pull back.
EUR/GBP Daily Outlook
Daily Pivots: (S1) 0.8587; (P) 0.8651; (R1) 0.8749; More...
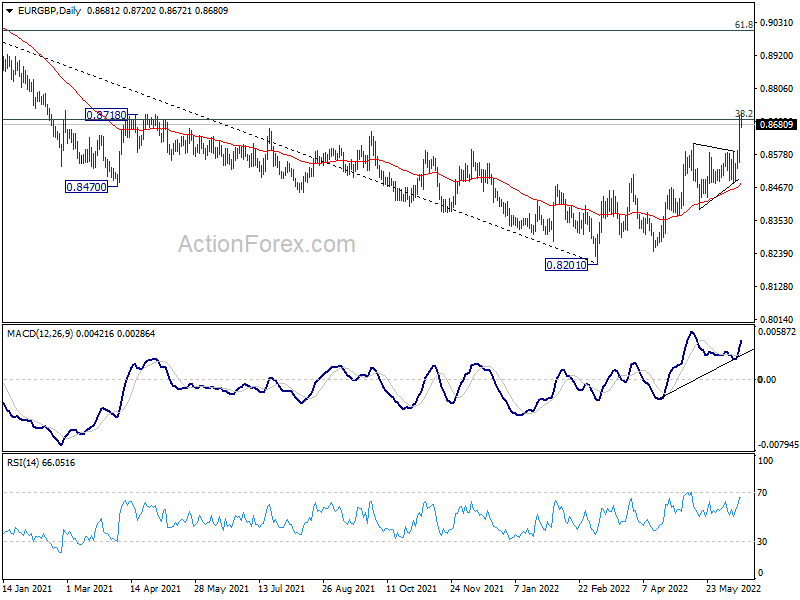
EUR/GBP's rally continues today and hit 0.8697 medium term fibonacci level. Intraday bias stays on the upside at this point. Sustained break above 0.8697 will carry larger bullish implication and target next fibonacci level at 0.9003. On the downside, below 0.8593 minor support will turn intraday bias neutral first. But outlook will stay bullish as long as 0.8484 support holds.
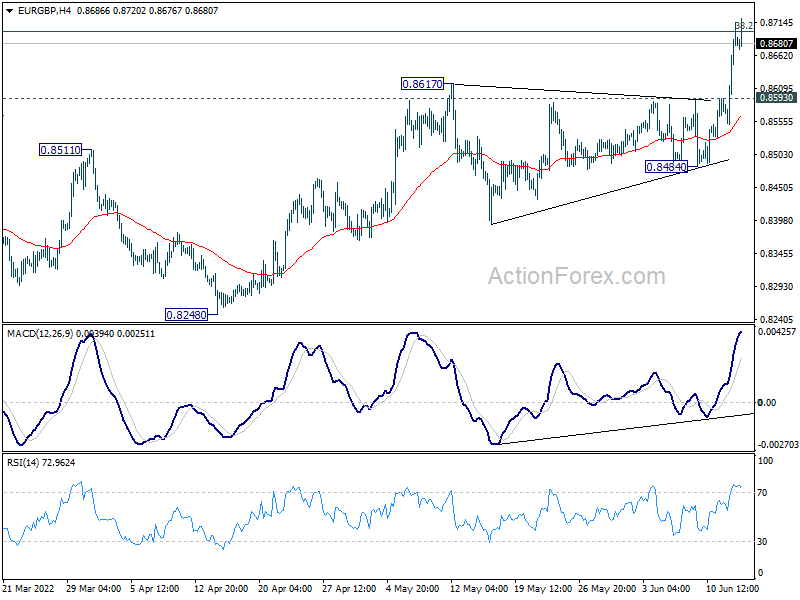
In the bigger picture, rise from 0.8201 medium term bottom could could either be a correction to the down trend from 0.9499 (2020 high), or a medium term up trend itself. Sustained break of 38.2% retracement of 0.9499 to 0.8201 at 0.8697 will affirm the latter case, and pave the way to 61.8% retracement at 0.9003.
EUR/AUD Daily Outlook
Daily Pivots: (S1) 1.5024; (P) 1.5105; (R1) 1.5239; More...
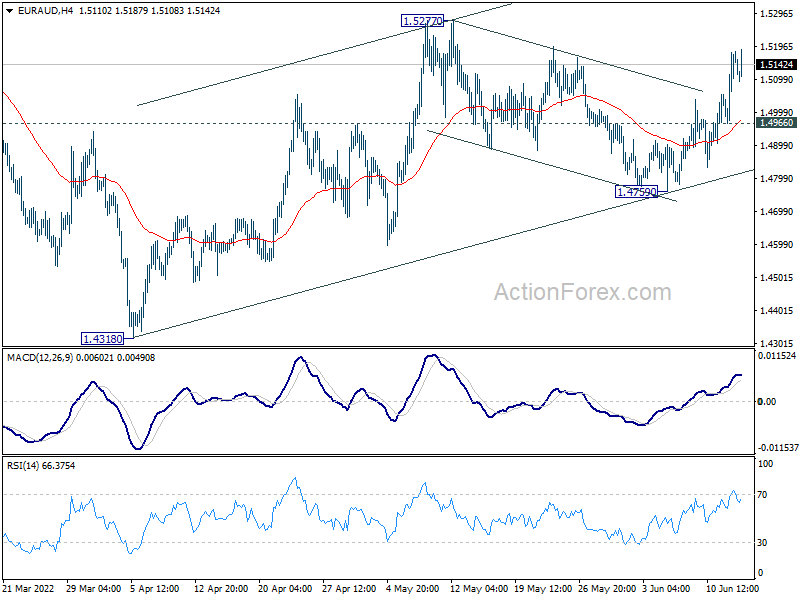
EUR/AUD's rise from 1.4759 is still in progress and intraday bias stays on the upside for 1.5277 resistance first. Break there will target 1.5354 support turned resistance next. On the downside, below 1.4966 minor support will turn intraday bias neutral again.
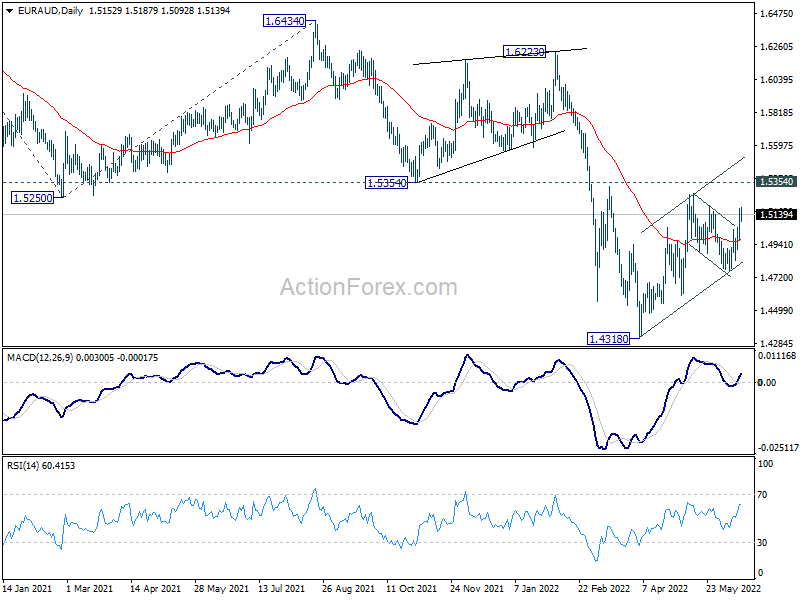
In the bigger picture, as long as 1.5354 support turned resistance holds, larger down trend from 1.9799 (2020 high) is still expected to continue. On resumption, next target is 61.8% projection of 1.9799 to 1.5250 from 1.6434 at 1.3623, which is close to 1.3624 long term support (2017 low). However, firm break of 1.5354 will indicate medium term bottoming and bring stronger rally back to 1.6434 key resistance.
Nervous Markets Await Fed Decision
Fed Funds futures have fully priced in a 75-basis point hike for today’s FOMC meeting, with policymakers expected to frontload more of its intended rate hikes in response to unrelenting inflationary pressures.
Investors are dreading the prospects of the Fed thinking it’s worth breaking the economy to quell red-hot inflation. Such hefty fears have driven the selloff that’s permeated various asset classes in the leadup to this week’s pivotal FOMC decision.
Markets have already had their say about the Fed’s more aggressive path forward for interest rates, evidenced by the carnage left in the wake of last week’s hotter-than-expected US inflation print. It’s now up to the Fed whether to confirm or shatter such expectations via incoming policy clues contained within the dot plot, economic projections, or likelier at Chair Powell’s press conference.
Another wave of selling across global financial markets could be unleashed, depending on how forcefully the Fed abandons its gradual approach to subduing US inflation. However, should the Fed defy the ultra-hawkish forecasts and insist that smaller, half-point rate hikes remain the way to go, that may help soothe nerves within the riskier corners of global markets, at least temporarily.
EUR/CHF Daily Outlook
Daily Pivots: (S1) 1.0365; (P) 1.0409; (R1) 1.0476; More....
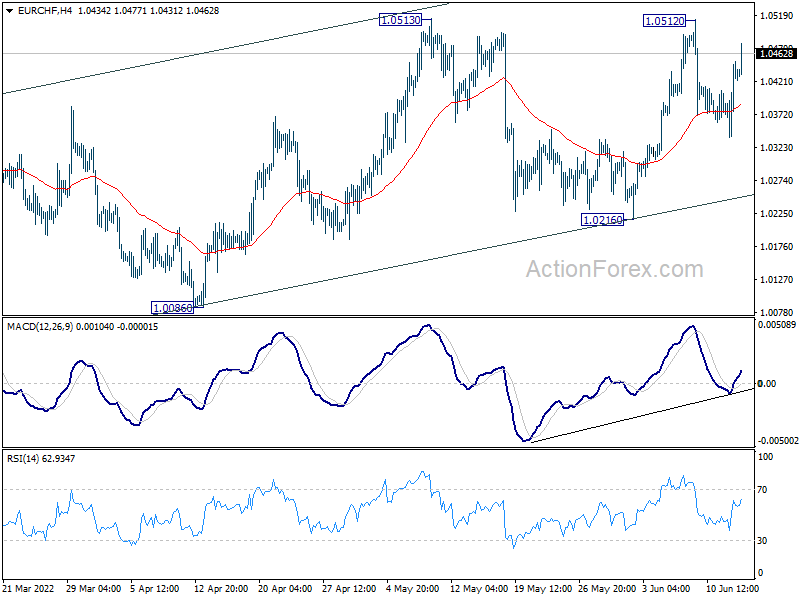
Range trading continues in EUR/CHF and intraday bias remains neutral. On the upside, decisive break of 1.0513 will resume the whole rebound from 0.9970, for 1.0610 structural resistance. On the downside, break of 1.0216 will turn near term outlook bearish for 1.0086 support next.
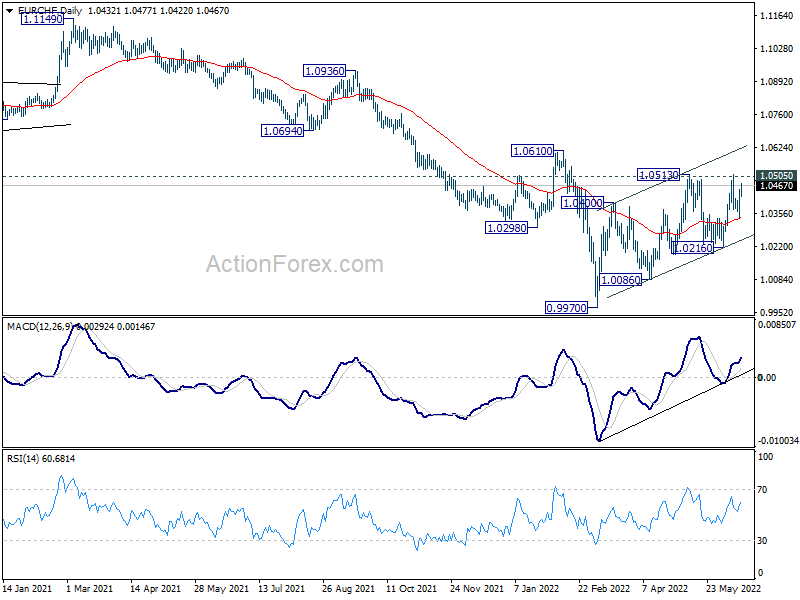
In the bigger picture, as long as 1.0505 support turned resistance (2020 low) holds, long term down trend from 1.2004 (2018 high) is expected to continue. Next target is 100% projection of 1.2004 to 1.0505 to 1.1149 at 0.9650. However, firm break of 1.0505 will suggest medium term bottoming, and bring stronger rebound towards 1.1149 structural resistance.
Bitcoin’s Continued Collapse and Furnace of Fire for the Crypto Periphery
Bitcoin was down 5.7% on Tuesday, ending the day at around $22K. The decline picked up on Wednesday morning, taking another 3.3% off the price to $21K, declining for the eighth consecutive day and losing 30% in seven days.
Ethereum lost 8.1% in 24 hours and 38% in a week. Leading altcoins in the top ten are losing between 2% (Polkadot) and 9.6% (Dogecoin).
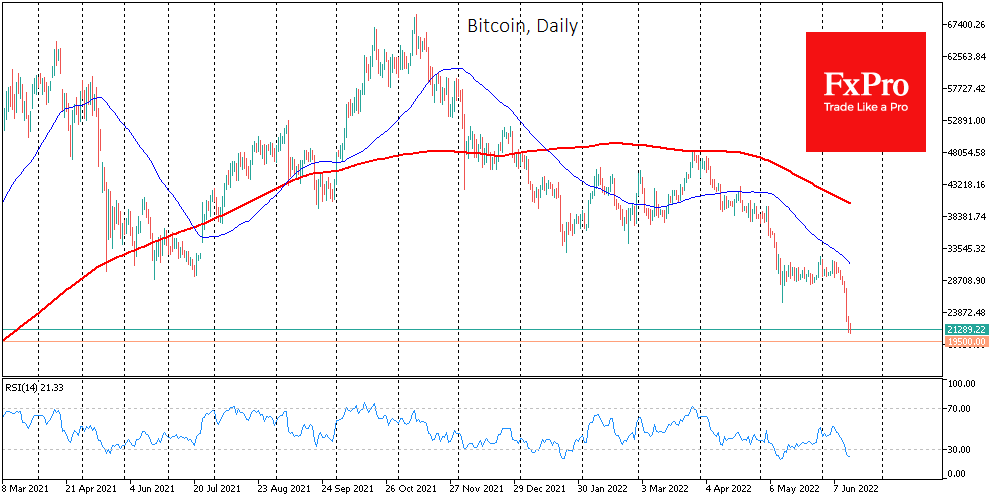
Total cryptocurrency market capitalisation, according to CoinMarketCap, sank 6.4% overnight to $898bn. The Cryptocurrency Fear and Greed Index was down 1 point by Wednesday, to 7, which last was in March 2020.
Concerns around a sharp tightening of monetary policy are weighing on financial markets and are trickling down into cryptocurrencies through their influence on large institutional investors. It is not surprising that Bitcoin and Ether are dragging the entire cryptocurrency market down in such an environment.
According to CoinShares, institutional investors withdrew $102 million from cryptocurrencies last week amid expectations of a tightening of monetary policy by the US Federal Reserve. The US regulator’s two-day meeting results will be announced today.
BitMEX founder Arthur Hayes fears that the market has not yet hit rock bottom, and we could see a massive sell-off in cryptocurrencies if bitcoin falls below $20,000. Galaxy Digital head Mike Novogratz is convinced that bitcoin is close to the “bottom” and will hold above $20,000.
We believe Bitcoin may be close to its bottom, but it could take months until the next rally. During those months, the entire crypto industry will probably go through a furnace of fire, as we saw with Terra (Luna), and is now happening with Celsius. Stablecoins continue to be tested, and USDD being below parity with USD for the third day tells us that history with USDT (stable tied to Luna) could repeat itself several times.
EURGBP Unlocks New 16-month High; Bullish Outlook
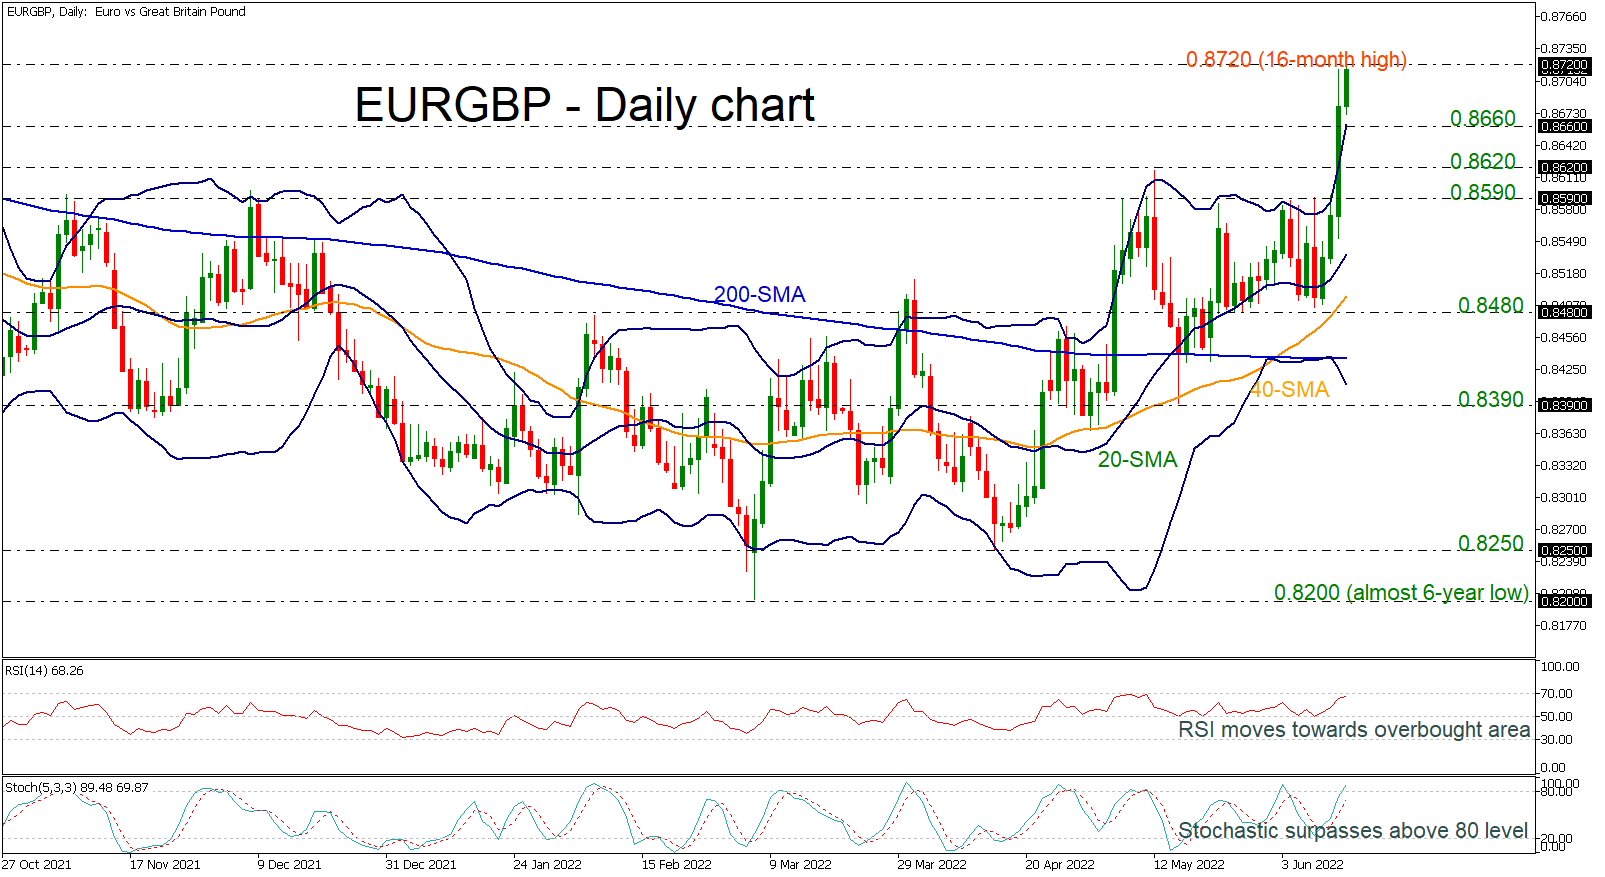
EURGBP is surging towards a fresh 16-month high of 0.8720, helping the market to switch to a more bullish one. The price jumped above the upper Bollinger band, which is a strong sign for more increases. The RSI indicator is approaching the overbought region with strong momentum, while the stochastic oscillator surpassed above the 80 level.
Should the price close comfortably at or above today’s intra-day high, traders could add more value to the pair, pushing the market up to the 0.8860 resistance achieved in November 2020.
In the negative scenario, the price could retest the upper Bollinger band, which overlaps with the 0.8660 support and which also halted the upside movements in the past. If this proves easy to break this time, the decline may next pause somewhere between 0.8590-0.8620, while even lower, investors could shift attention to the mid-level of the Bollinger band at 0.8536.
In brief, EURGBP is in a bullish mode in the short-term timeframe and is also turning positive in the bigger picture. A successful drop below the 200-day simple moving average (SMA) may switch the outlook back to neutral.
Gold Outlook: Betting on the FOMC Meeting
The Gold market finally displayed some strong price movement in the past days and broke out of the sideways range it was moving within for the past several weeks. As always, a remarkable price movement in the Gold market is accompanied by some new unexpected economic data that tend to point to further uncertainty in the short term. In this report we will provide a brief and informative outlook of the current fundamentals surrounding the Gold market along with a short technical analysis indicating important levels for traders to work with.
We start by pointing out that Gold made its biggest daily movements on the 10th and the 13th of June. These daily moves consisted of large swings that surpassed $50 throughout the session carrying out extensive volatility. On the 10th of June we received the US CPI and core CPI rates for May, an event we had cautioned about in our previous week’s report. Unanimously all the inflation rates for May came out higher than expected possibly creating chaos among market analysts and traders. It is noteworthy that the headline CPI rates came out higher than the previous month’s, yet the core rate came in lower. As the core rate excludes food and energy prices, we could say that the drastic increase in headline rates can be attributed to higher fuel prices with energy prices moving higher in consecutive months. Nonetheless, traders first reaction to the news was positive pushing Gold prices higher. Additionally, after the Inflation data was released, the Preliminary UoM consumer sentiment for June unexpectedly indicated a large drop, possibly magnifying the market’s reaction. In our opinion, the combination of the two readings tended to invite a significant bullish interest for Gold, as higher inflation rates can bring out Gold’s ability to be used as a hedge for higher prices while the consumer sentiment reading somewhat increased the economic worries with its notable drop. The outcome goes to say that when a number of important economic releases are expected on a single day, Gold traders may have to be patient to wait and see the overall outcome of the indicators and then form a decision as to the direction of the trade.
Moreover, characteristic was also the strengthening of the USD in the past days. According to the Dollar Index the greenback surged for the past 4 consecutive days and was lifted to a new multi-year high price on the 13th of June. As you may have noticed in the past, a bullish US dollar tends to be a weakness for the Gold market, most of the time. With the USD’s power surging, the Gold market performed its biggest single day selloff in months, highlighting its vulnerability to the correlation of the two instruments. As to the question, why is the greenback on the rise? We must note that the higher inflationary pressures observed just days ago are a very positive sign for the currency also. Higher inflation can point to higher wages and a tight job market which overall favors the USD and is currently very present in the US economy.
In the following days, traders will turn their attention to the FOMC meeting on the 15th of June, which is also the most important economic event of the current week. The FED is expected to increase its interest rate, but the question is how much? The market is now considering a 75-basis-point hike at the Fed’s June meeting, which can leave the markets in an uncertain position until the very last moment. Traders should keep in mind that the FOMC meeting consisting of the interest rate announcement and the accompanying press conference can create immense volatility not only for the Gold market, but also across the board. In this case caution is advised. In addition, we would like to note the weekly initial jobless claims figure coming up on the 16th along with the Philly Fed Business Index for June. Please note on the same day we expect Central bank interest rate decisions from the BoE and the SNB which could intensify the markets anticipation. On the 17th of June we also have a speech from Federal Reserve Chair Jerome Powell and BoJ’s interest rate decision.
Technical Analysis
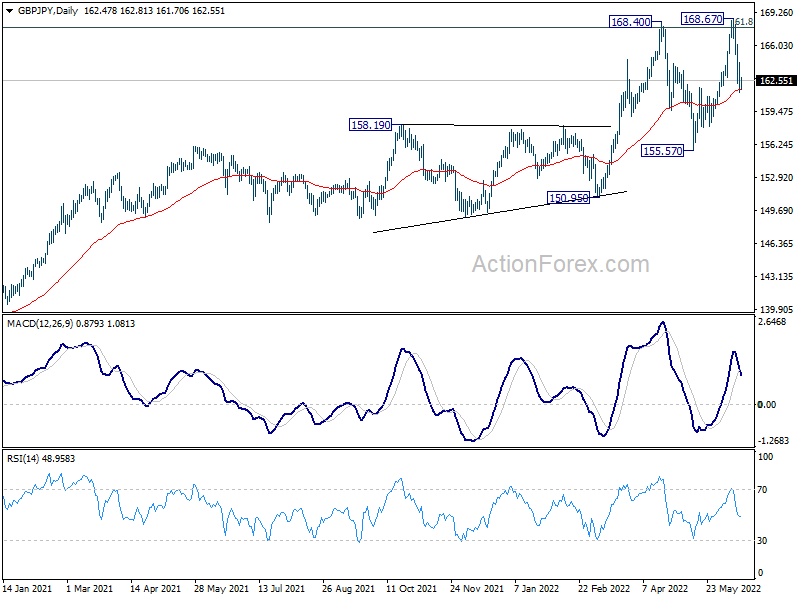
XAUUSD Daily
After the recent selloff on Monday, Gold managed to drop outside the area it had been trading within for the past weeks and momentarily tested the (S1) 1810 support level. However, the price action bounced off the level and moved higher possibly locking in the area between the (R1) 1845 resistance and the (S1) 1810 support as the most probable for the price action to move in for the short term. If the (S1) is breached, then we could be in for a move to the (S2) 1785 support which was approached once for the past several months. If the price action moves upwards, we could see the (R1) 1845 resistance coming under pressure while the level we have in mind for a move even higher is the (R2) 1880 line which was approached on the 13th of June but not clearly tested. For extreme bullish scenarios we note the (R3) 1910 resistance while in an extensive bearish scenario we note the (S3) 1760 support. The RSI indicator has dropped towards the 30 level but regained some ground, indicating the market is still under the selling spell from the previous day. In the scenario of a move above the (R2) 1880 resistance, we would change our current sideways bias for a buying one.