

Sample Category Title
Technical Outlook and Review
DXY:
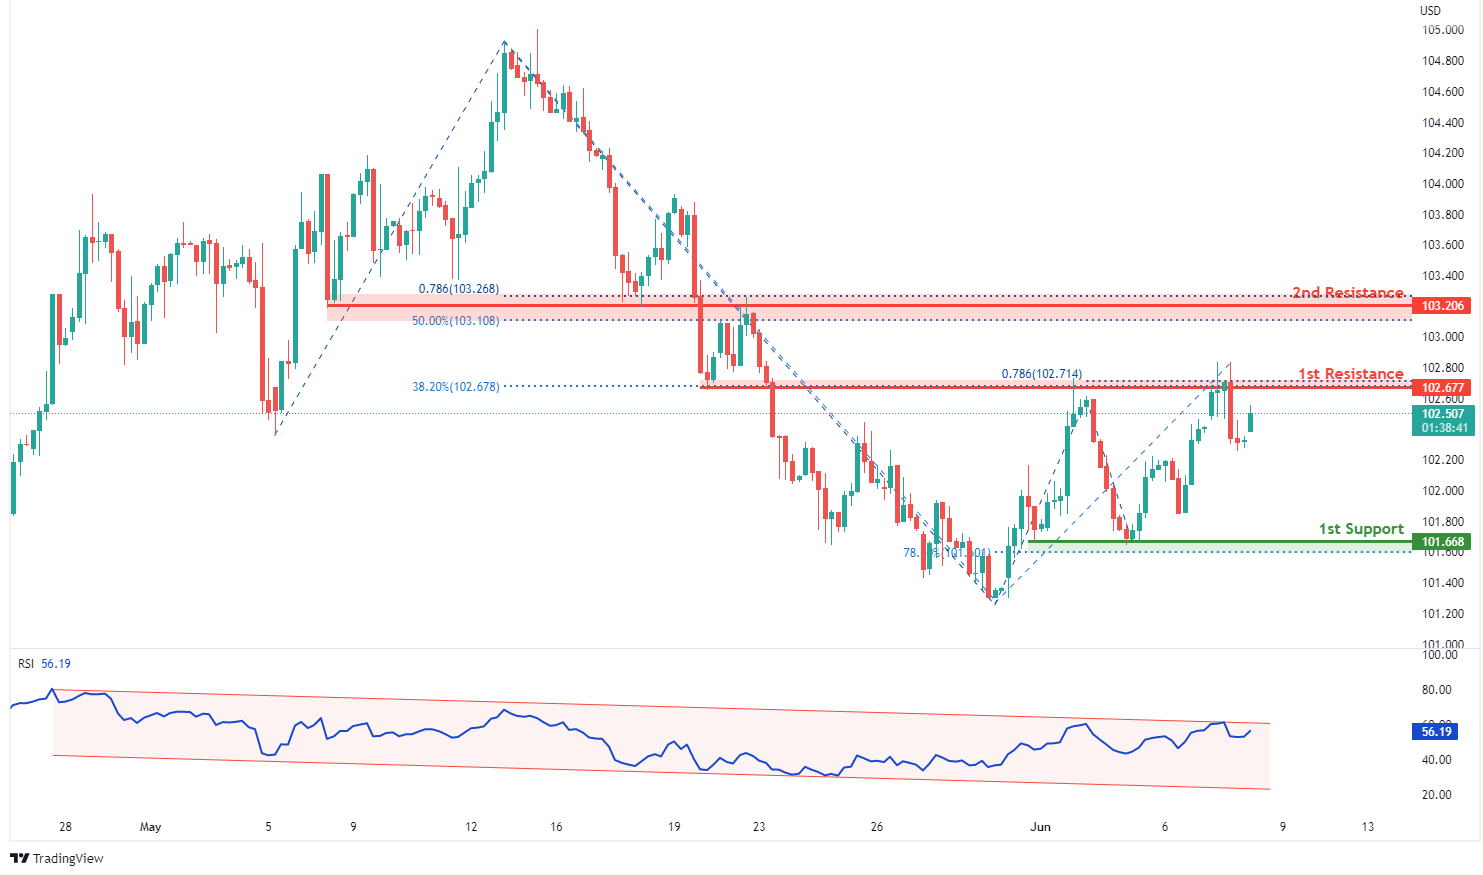
On the H4, with RSI moving in a descending channel, we have a bearish bias that price will drop to our 1st support at 101.668 where the horizontal swing low support and 78.6% fibonacci retracement are from our 1st resistance at 102.677 in line with the horizontal overlap resistance, 38.2% fibonacci retracement and 78.6% fibonacci projection. Alternatively, price may break 1st resistance structure and head for 2nd resistance at 103.206 where the horizontal overlap resistance, 78.6% fibonacci projection and 50% fibonacci retracement are.
Areas of consideration:
- H4 time frame, 1st resistance at 102.677
- H4 time frame, 1st support at 101.668
XAU/USD (GOLD):
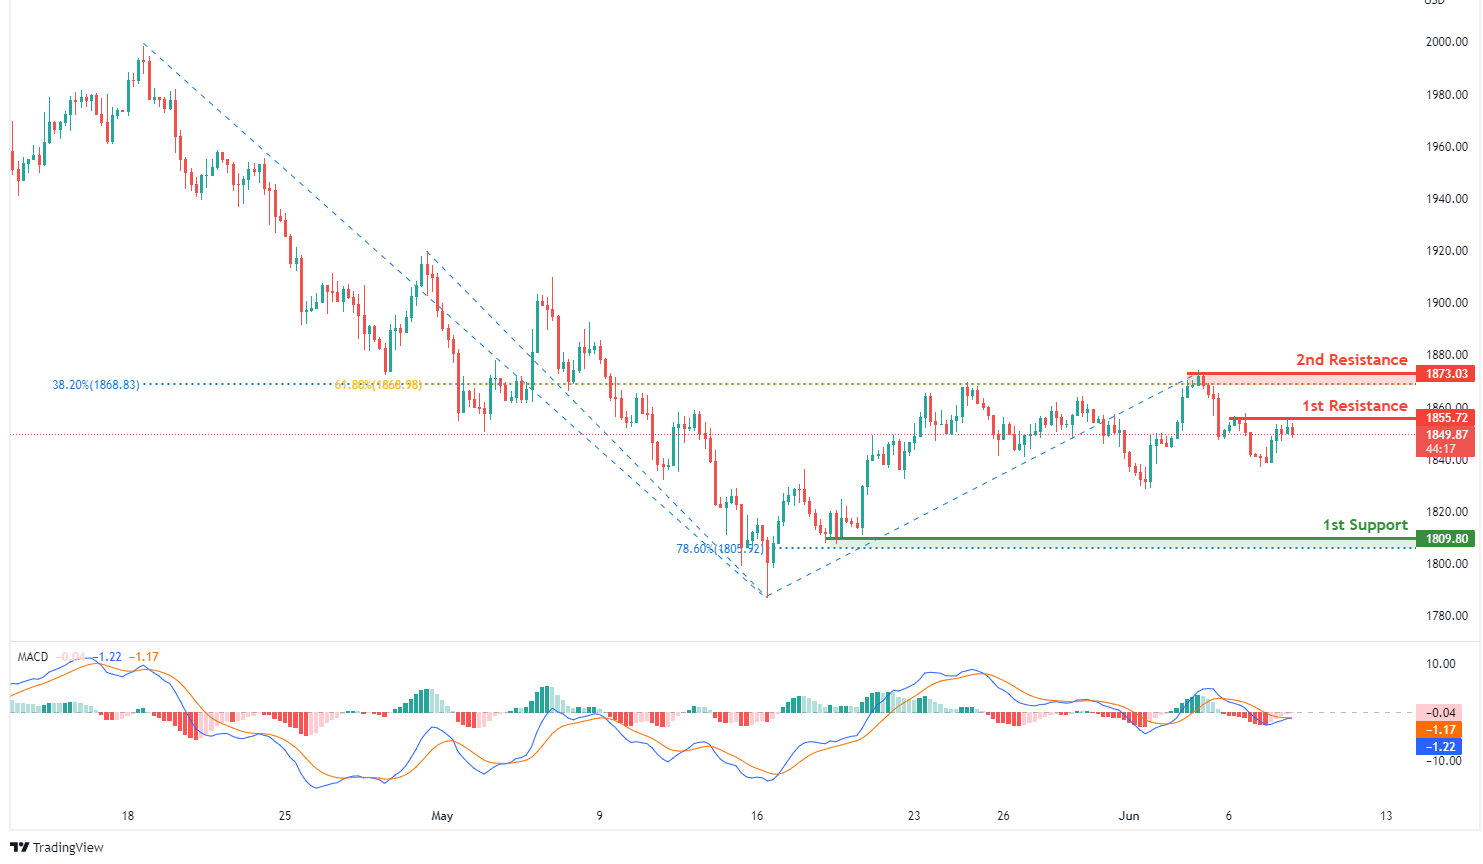
On the H4, with MACD moving in a bearish momentum, we have a bearish bias that price will drop from our 1st resistance at 1855.72 where the horizontal swing high resistance is to our 1st support at 1809.80 where the horizontal swing low support and 78.6% fibonacci retracement are. Alternatively, price may break 1st resistance structure and head for 2nd resistance at 1873.03 in line with swing high resistance, 61.8% fibonacci retracement and 38.2% fibonacci retracement.
Areas of consideration:
- H4 time frame, 1st Resistance at 1855.72
- H4 time frame, 1st Support at 1809.80
GBP/USD:
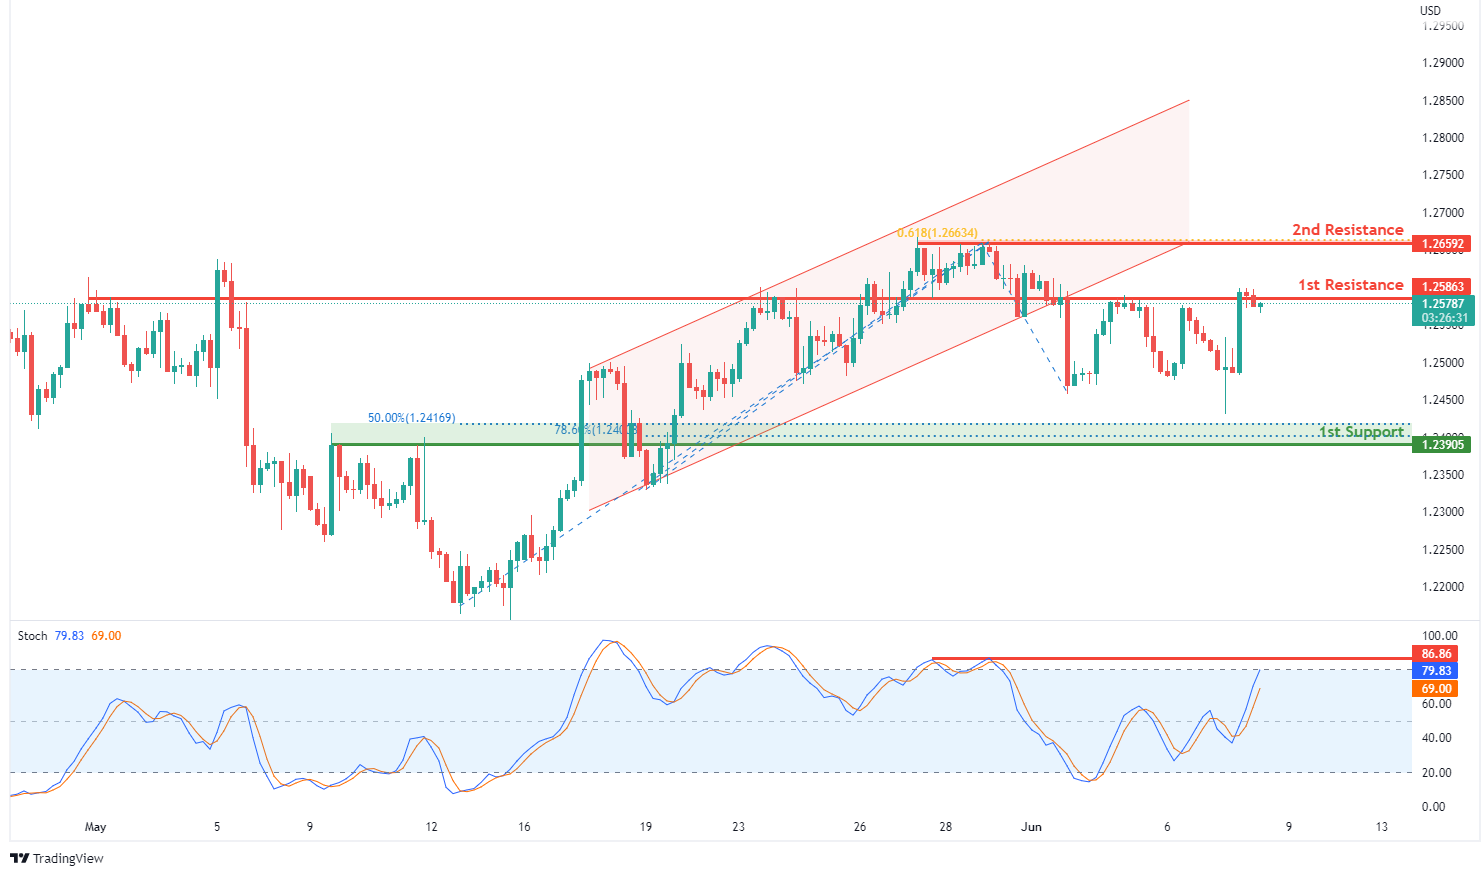
On the H4, with stochastic indicator approaching the resistance level, we have a bearish bias that price will drop from our 1st resistance at 1.25863 where the horizontal overlap resistance is to our 1st support at 1.23905 in line with the 50% Fibonacci retracement, 78.6% fibonacci retracement and overlap support. Alternatively, price may break 1st resistance structure and head for 2nd resistance at 1.26592 where the horizontal swing high resistance and 61.8% fibonacci projection are.
Areas of consideration:
- H4 1st resistance at 1.25863
- H4 1st support at 1.23905
USD/CHF:
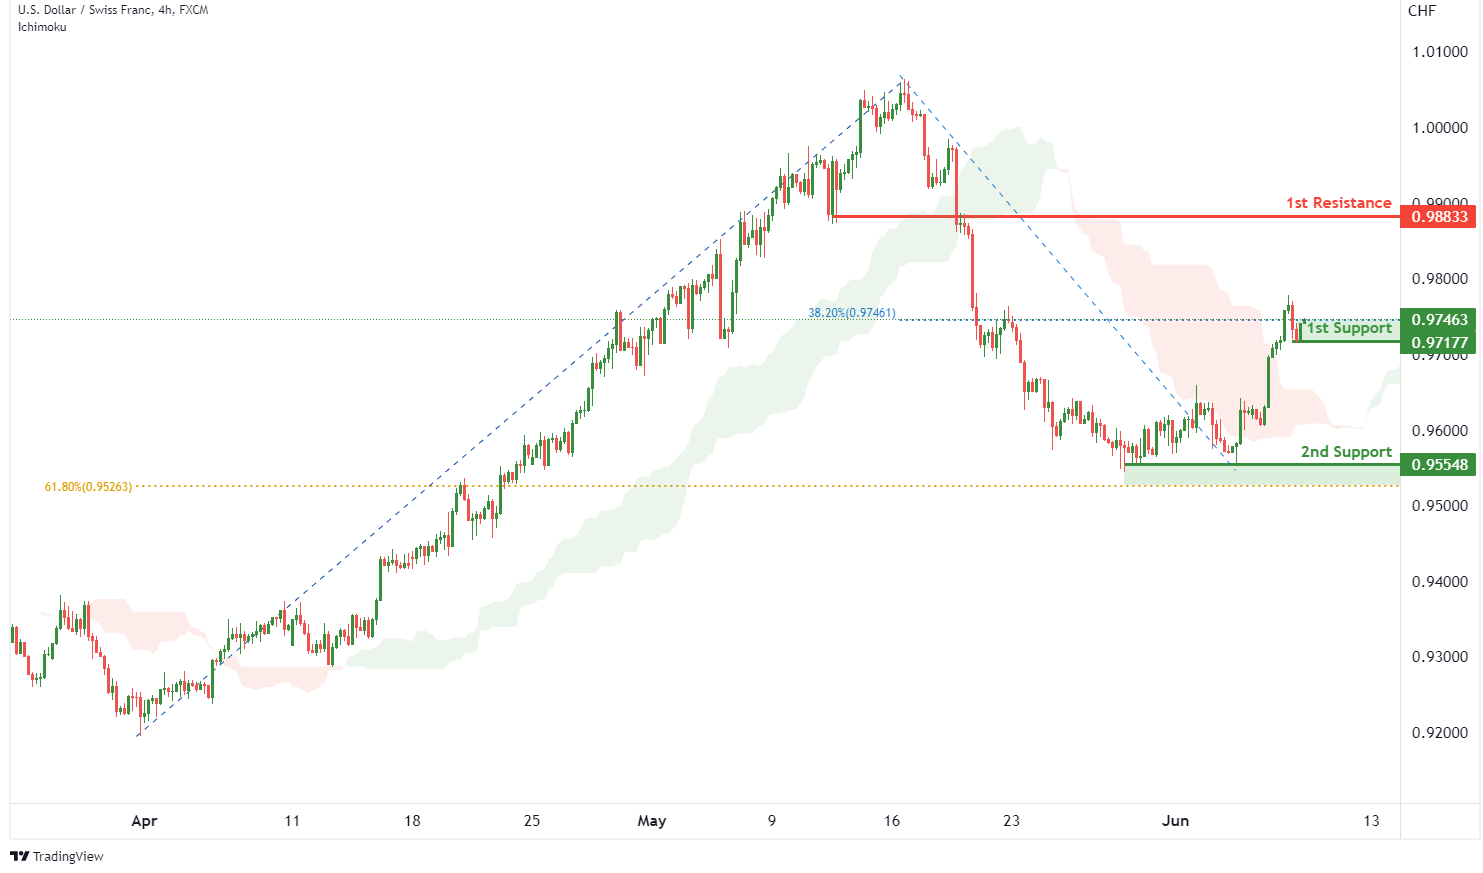
On the H4, with price moving above the ichimoku cloud, we have a bullish bias that price will rise to our 1st resistance at 0.98833 where the pullback resistance is from our 1st support at 0.97177 in line with the swing low support and 38.2% Fibonacci retracement. Alternatively, price may break 1st support structure and head for 2nd support at 0.95548 where the swing low support and 61.8% fibonacci retracement are..
Areas of consideration
- 1st support level at 0.97177
- 1st resistance level at 0.98833
EUR/USD :
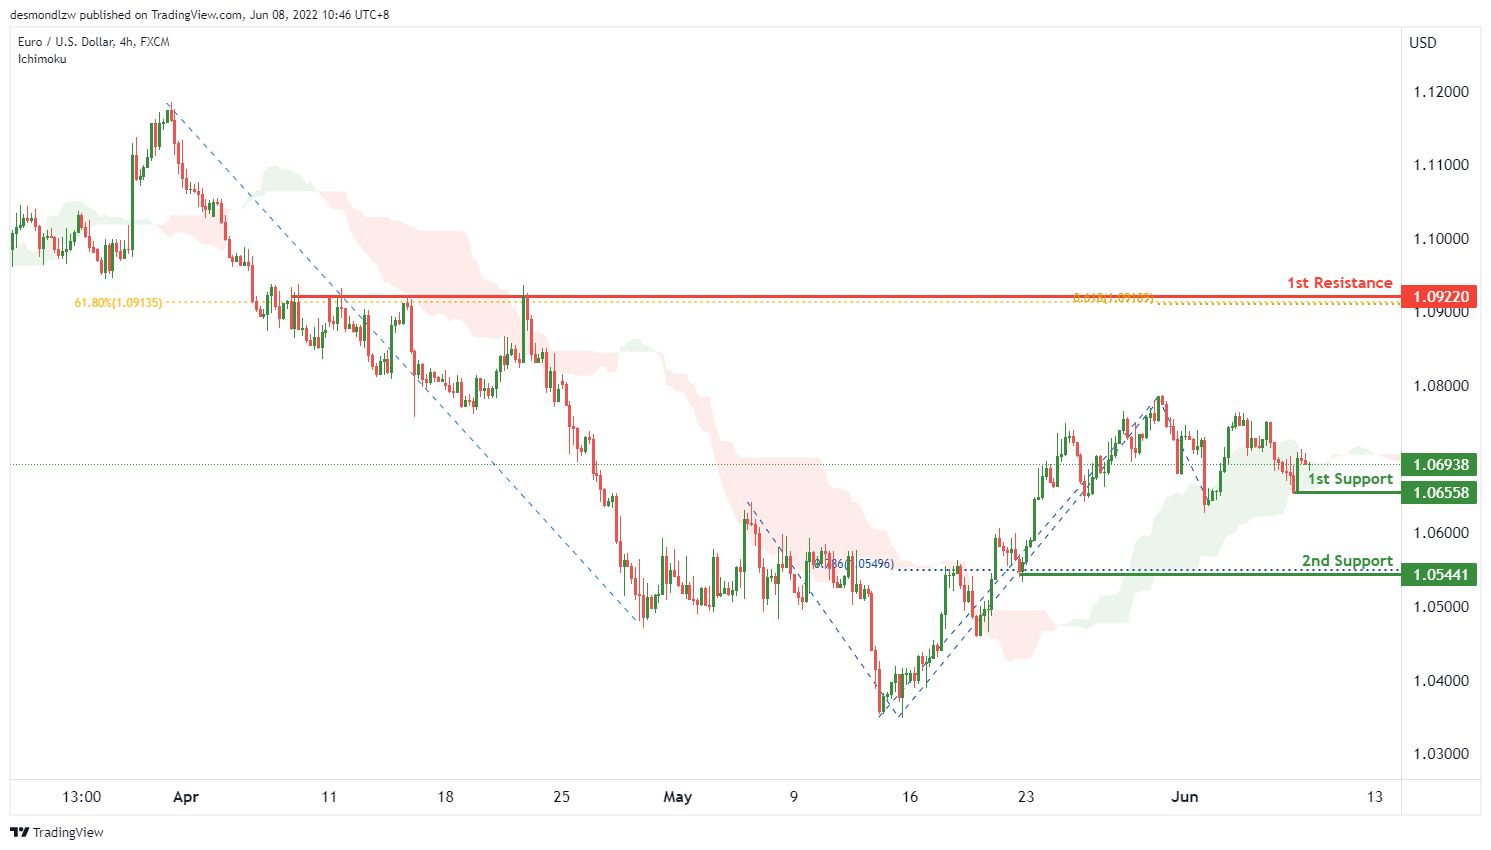
On the H4, with price bouncing off the ichimoku cloud, we have a bullish bias that price will rise from the 1st support at 1.06558 in line with the to the pullback support to the 1st resistance at 1.09220 in line with the 61.8% fibonacci retracement and 61.8% fibonacci projection. Alternatively, price may break support structure at the 1st support and drop to the 2nd support at 1.05441 at the swing low in line with the 78.6% fibonacci retracement.
Areas of consideration :
- H4 1st resistance at 1.09220
- H4 1st support at 1.06558
USD/JPY:
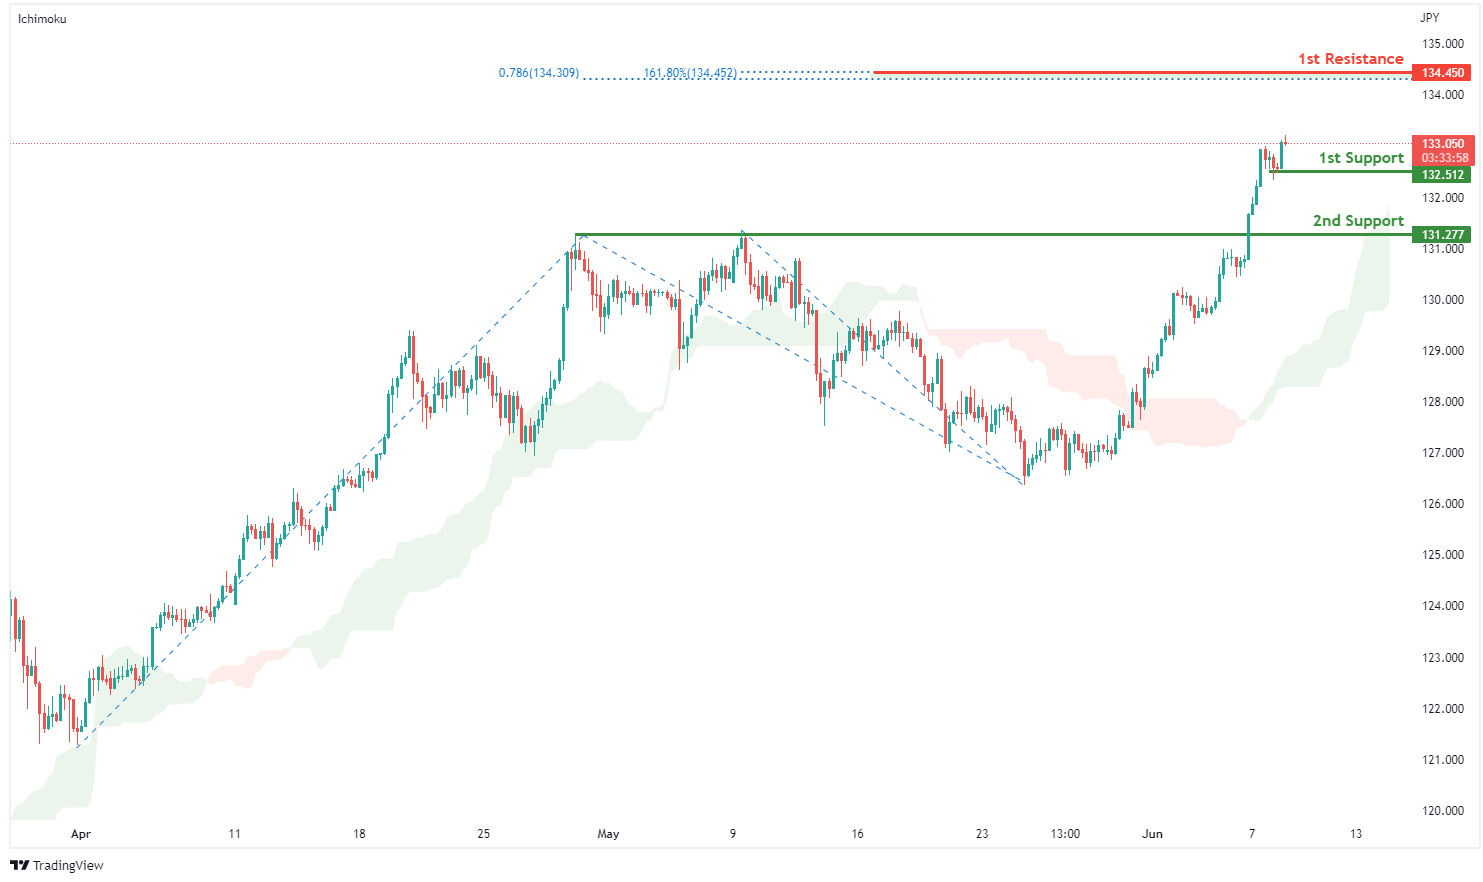
On the H4, with prices moving above the ichimoku indicator, we have a bullish bias that price will rise from our 1st support at 132.512 where the horizontal swing low support is to our 1st resistance at 134.450 in line with the 161.8% fibonacci extension and 78.6% fibonacci projection. Alternatively, price may break 1st support structure and head for 2nd support at 131.277 where the horizontal overlap support is.
Areas of consideration:
- H4 time frame, 1st resistance at 134.450
- H4 time frame, 1st support at 132.512
AUD/USD:
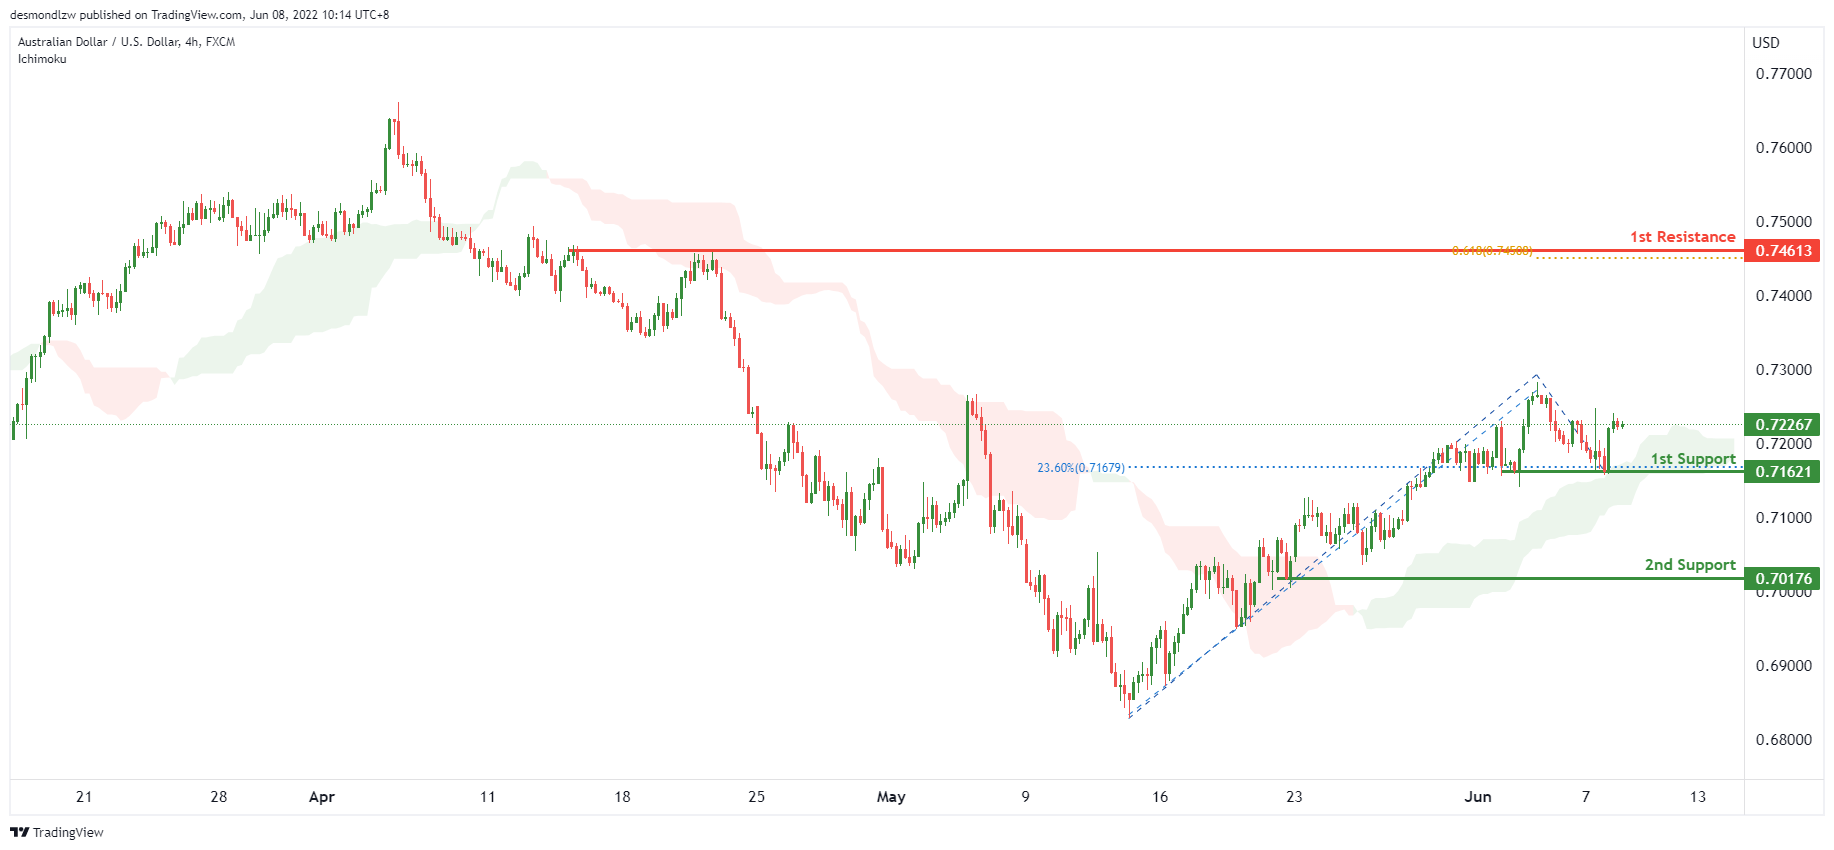
On the H4, with price moving above the ichimoku cloud, we have a bullish bias that price will rise from the 1st support at 0.71621 in line with the 23.6% fibonacci retracement and overlap support to the 1st resistance at 0.74613 in line with the swing high and 61.8% fibonacci projection. Alternatively, price may break the support structure at 1st support and drop to the 2nd support at 0.70176 at the swing low.
Areas of consideration
- H4 1st resistance at 0.74613
- H4 1st support at 0.71621
NZD/USD:
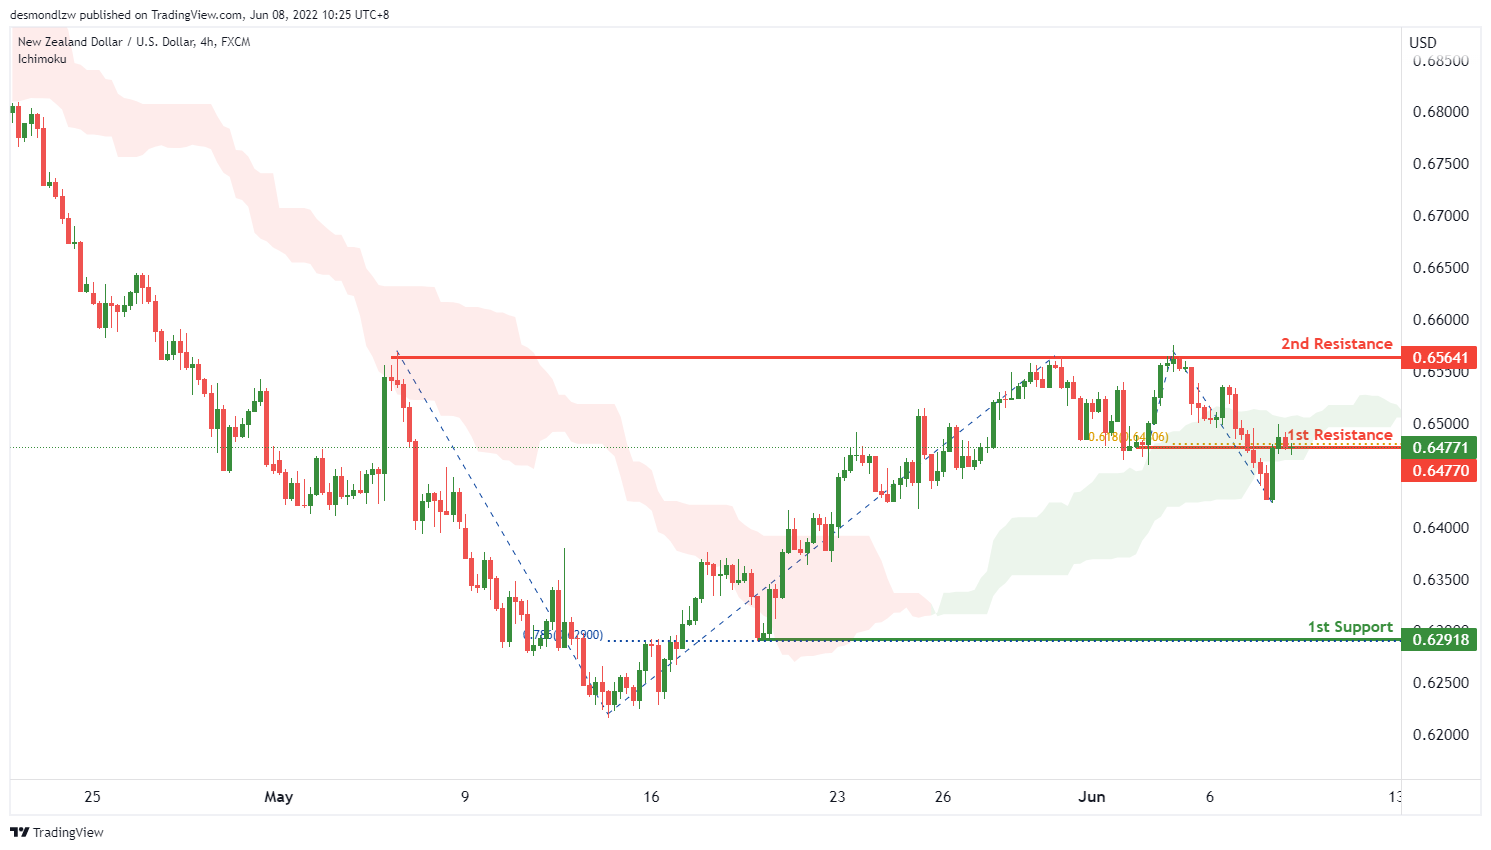
On the H4, with price moving below the ichimoku cloud, we have a bearish bias that price will drop from the 1st resistance at 0.64770 in line with the 61.8% fibonacci projection to the 1st support at 0.62918 in line with the 78.6% fibonacci retracement. Alternatively, price may bounce off the 1st resistance and rise to the 2nd resistance at 0.65641 in line with the overlap swing high.
Areas of consideration:
- H4 time frame, 1st support at 0.62918
- H4 time frame, 1st resistance at 0.64770
USD/CAD:
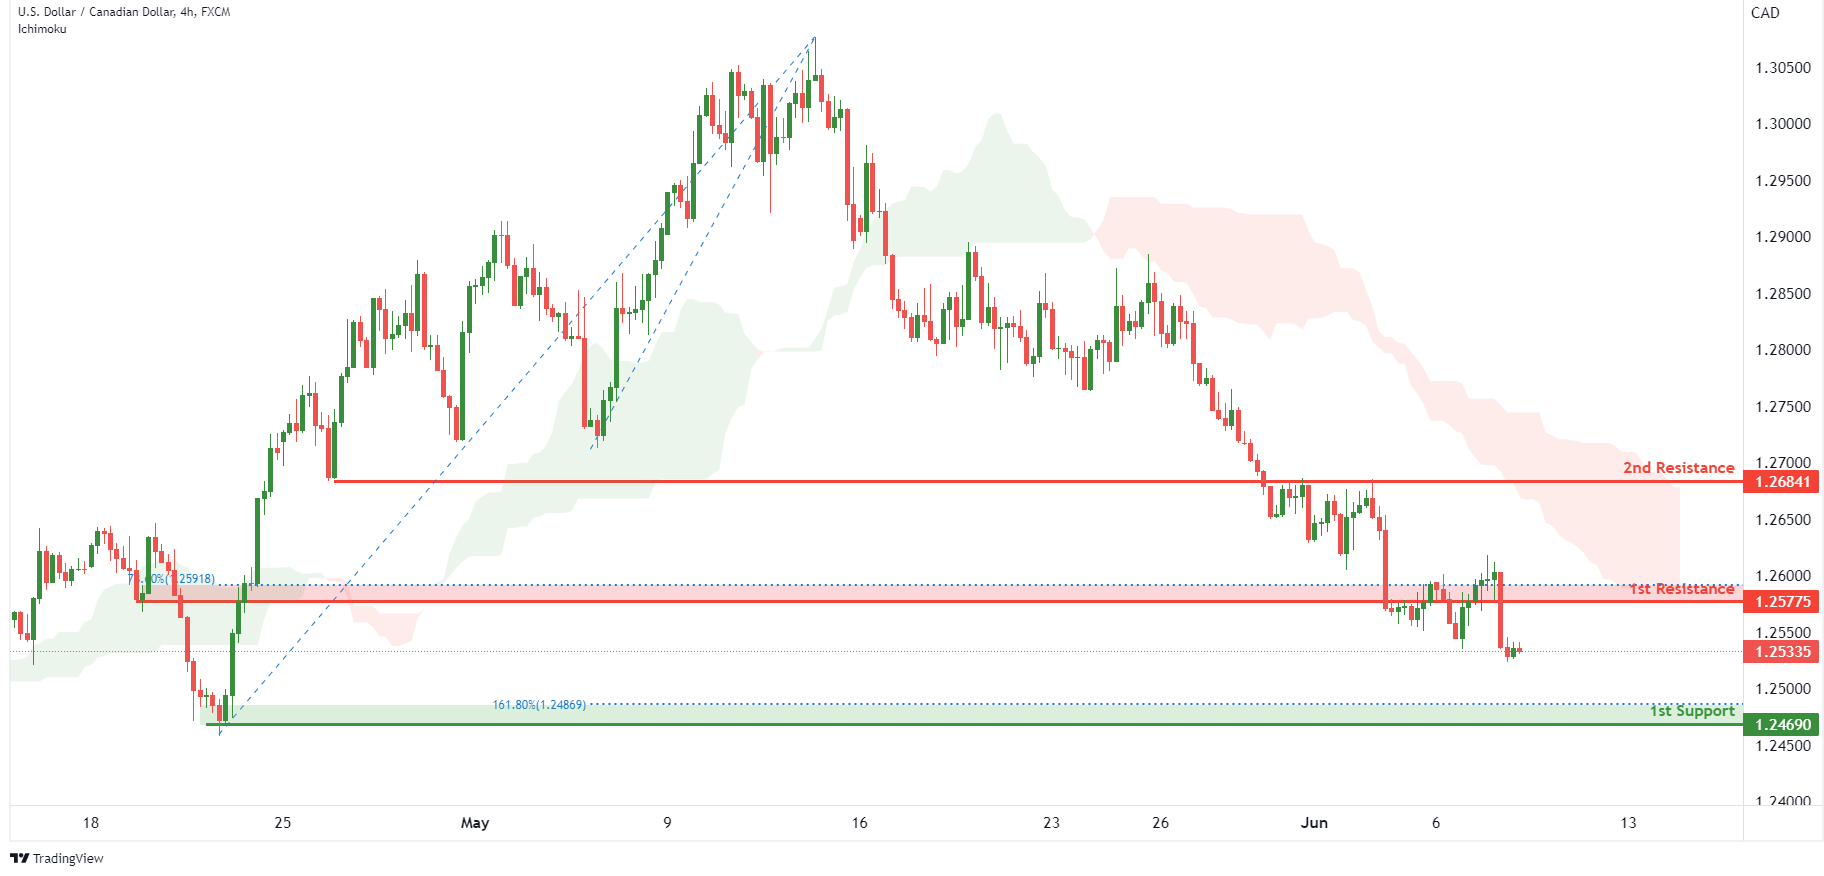
On the H4, with price moving below our ichimoku cloud and the recent break of our horizontal support level which is in line with the 28.6% fibonacci retracement level, we have a bearish bias that price will drop to our 1st support at 1.24690 in line with the horizontal swing low support and the 161.8% Fibonacci extension from our 1st resistance at 1.25775. Alternatively, price may break structure and head for our 2nd resistance at 1.26841.
Areas of consideration:
- H4 time frame, 1st resistance at 1.25775
- H4 time frame, 1st support at 1.24690
OIL:
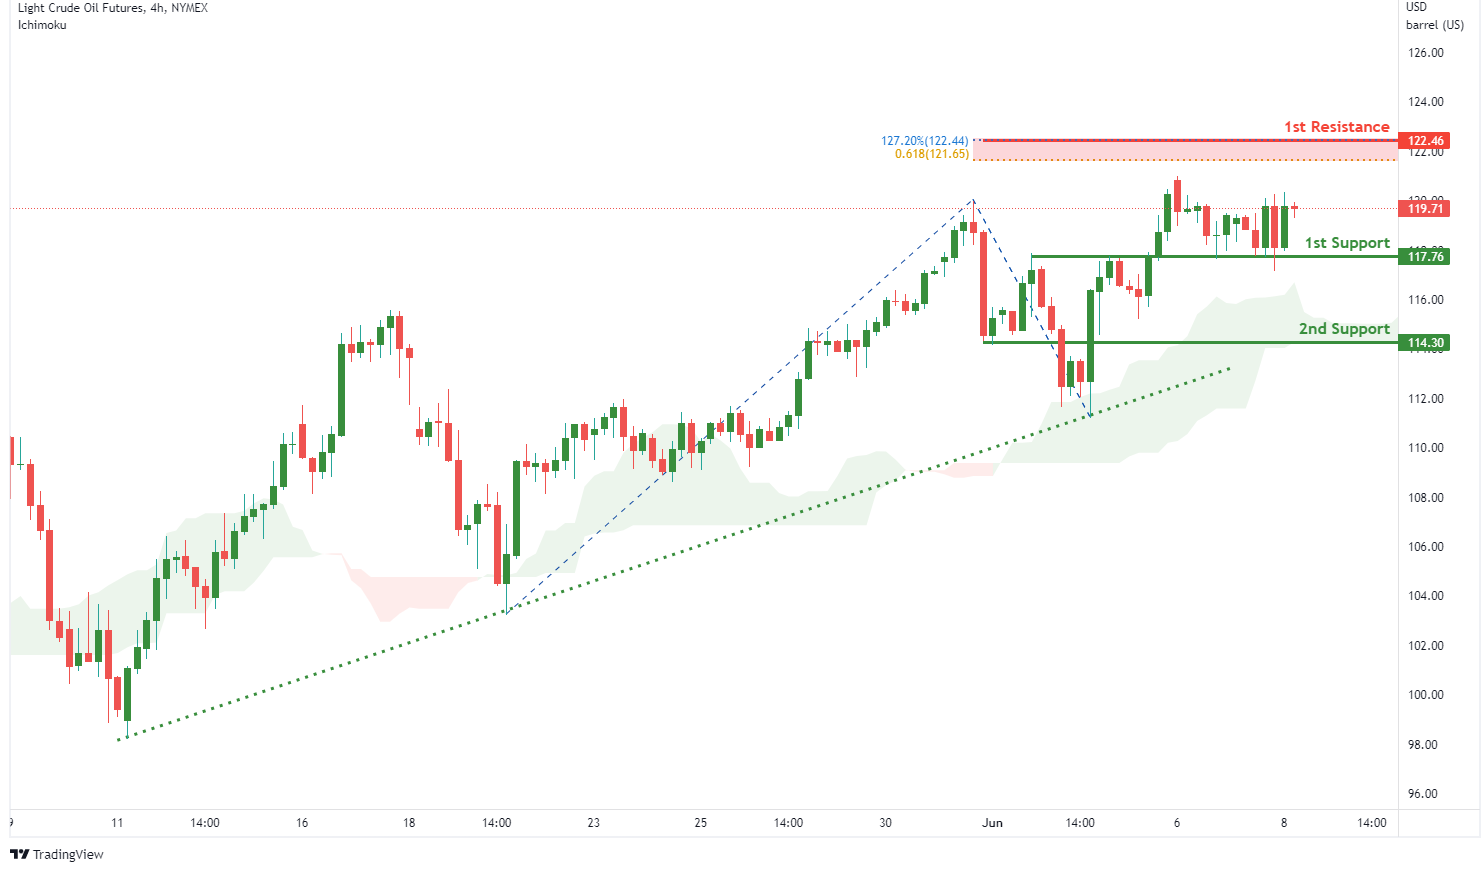
On the H4, with price moving above the ichimoku cloud, we have a bullish bias that price will rise from our 1st support at 117.76 where the horizontal pullback support is to our 1st resistance at 122.46 in line with the 61.8% fibonacci projection and 127.2% Fibonacci extension. Alternatively, price may break structure and head for 2nd support at 114.30.
Areas of consideration:
- H4 time frame, 1st resistance of 122.46
- H4 time frame, 1st support of 117.76
Dow Jones Industrial Average:
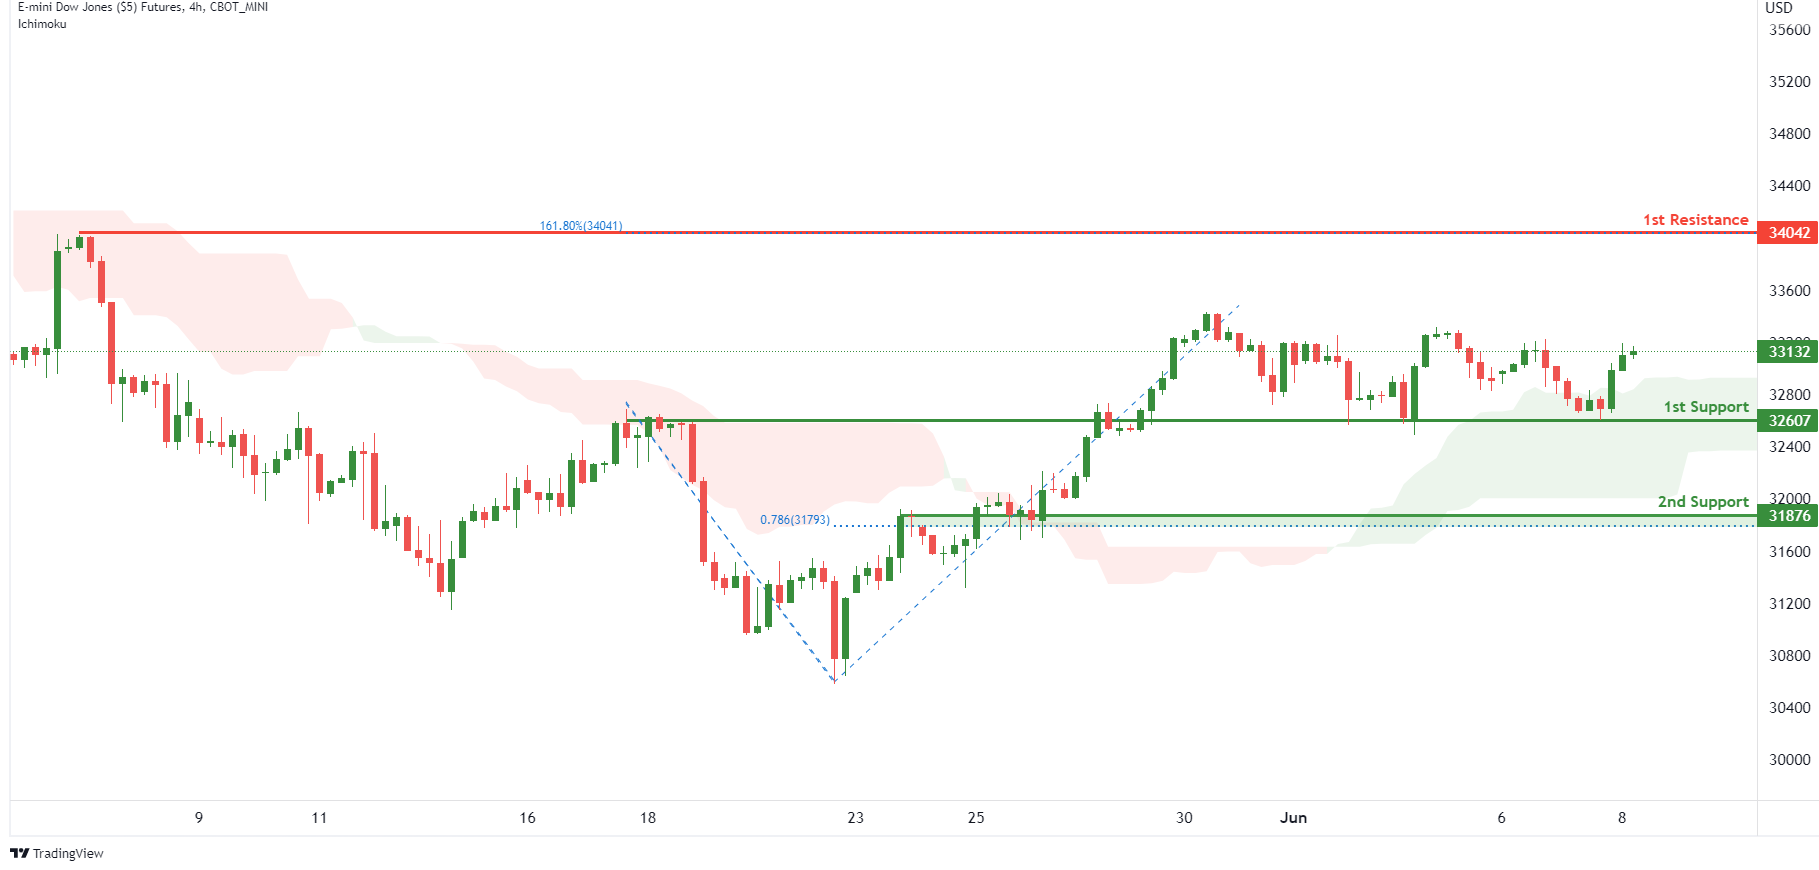
On the H4, with price moving above the ichimoku cloud, we have a bullish bias that price will rise from our 1st support at 32607 where the horizontal pullback support is to our 1st resistance at 34042 in line with the swing high resistance and 161.8% Fibonacci extension. Alternatively, price may break structure and head for 2nd support at 31876 where the pullback support and 78.6% fibonacci retracement are.
Areas of consideration :
- H4 time frame, 1st resistance at 34042
- H4 time frame, 1st support at 32607
Gold Outlook: Traders Await US Inflation Data
The Gold market’s controlled and limited price action was continued for another week, leaving traders in a rather puzzled state. It is possible that Gold maybe shying away from major price action due to contradicting forces in the economy, that are holding traders back. In this report we will cover important subjects that traders could be drawn towards when trading Gold. We will also provide a technical analysis providing our personal view on key levels and possible trends.
Gold continues to oppose the USD and their contrarian nature seems to endure for the past several weeks. Monitoring the Dollar Index which measures the strength of the USD against a few other major currencies, we notice the price action headed lower but then regained some ground in the past two weeks. Accordingly, but on the opposite side, Gold prices advanced and then ended in red territory for the past two weeks providing evidence that the two instruments may be moving in a different direction in the short term. Thus, in this case, finding what exactly is moving the USD could provide more chances of predicting Gold’s movement. For example, last week’s economic data from the US including the Consumer Confidence, the ISM Manufacturing PMI, and the employment report came out better than expected giving reasons for traders to create support for the USD and short sell the yellow metal upon release. These economic readings could create opportunities for Gold traders and are in our opinion worth monitoring.
On another front, an interesting report by Bloomberg claimed Bullion has good chances of advancing in the current year. The report referenced the extremely high inflationary pressures, the worries over a possible economic slowdown and geopolitical tensions as some of the reasons backing a potential move of Gold prices to higher grounds. Yet according to Federal Reserve Governor Christopher J. Waller the economic circumstances may not be so gloomy looking forward. Governor Waller stated in his speech in the past week that despite a slowing of the GDP rates at the start of 2022, the U.S. economy continues to operate at a healthy pace. He named both “consumer spending and business investment as solid, and viewed the latest data leaning towards solid demand and continuing momentum in the economy that will sustain output growth in the months ahead”. For the past two consecutive months, Gold prices have dropped to new lows indirectly telling us that the market may not be focusing on what is making headlines in the media and the uncertainty. The US economy continues to enjoy a tight employment market with reference to the most recent report while the impact of the Fed’s recent interest rate hikes may have not been fully digested until this moment.
Yet the financial releases coming up in the following days are key in determining volatility for the Gold market. On the 9th of June we get the weekly initial jobless claims figure that seems to remain very near the 200k barrier. On the 10th of June, we get the US inflation data for May which is expected to be closely monitored by market participants. The release of the CPI and Core CPI rates have the potential of creating large price swings for Gold, thus we would suggest that traders be mindful of the risks when engaging the market. Finally, also on Friday we get the high ranking Preliminary UoM Consumer sentiment for June.
Technical Analysis
XAUUSD Daily
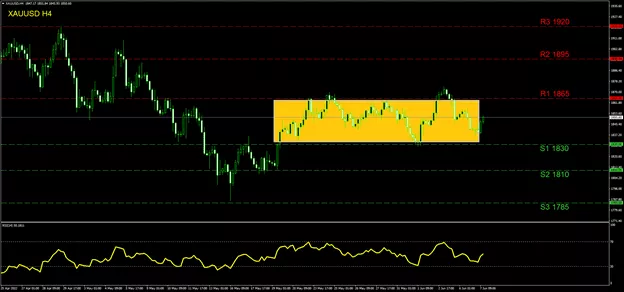
Gold continues to trade in a sideways motion between the (R1) 1865 resistance and the (S1) 1830 support level. This range is currently highlighted with yellow on our chart and has been used since the 19th of May. If the price action breaks above this range, we could see the trend surging to the (R2) 1895 level and even higher we note the (R3) 1920 barrier. If the trend turns downwards, we may see a drop towards the (S2) 1810 support while the (S3) 1785 line can also be engaged if the selling persists further. For now, the RSI seems to be stabilizing nearby the 50-level providing us with some evidence for an indecisive market. Our personal view is for a sideways bias while a clear breach above the (R1) could act as a signal for further bullish interest. Please note Gold has been trading in a wider sideways motion between the (R3) 1920 barrier and the (S3) 1785 line since late April, testing all the above mentioned levels during this timeframe.
Elliott Wave View: EURJPY Should Continue to Find Support
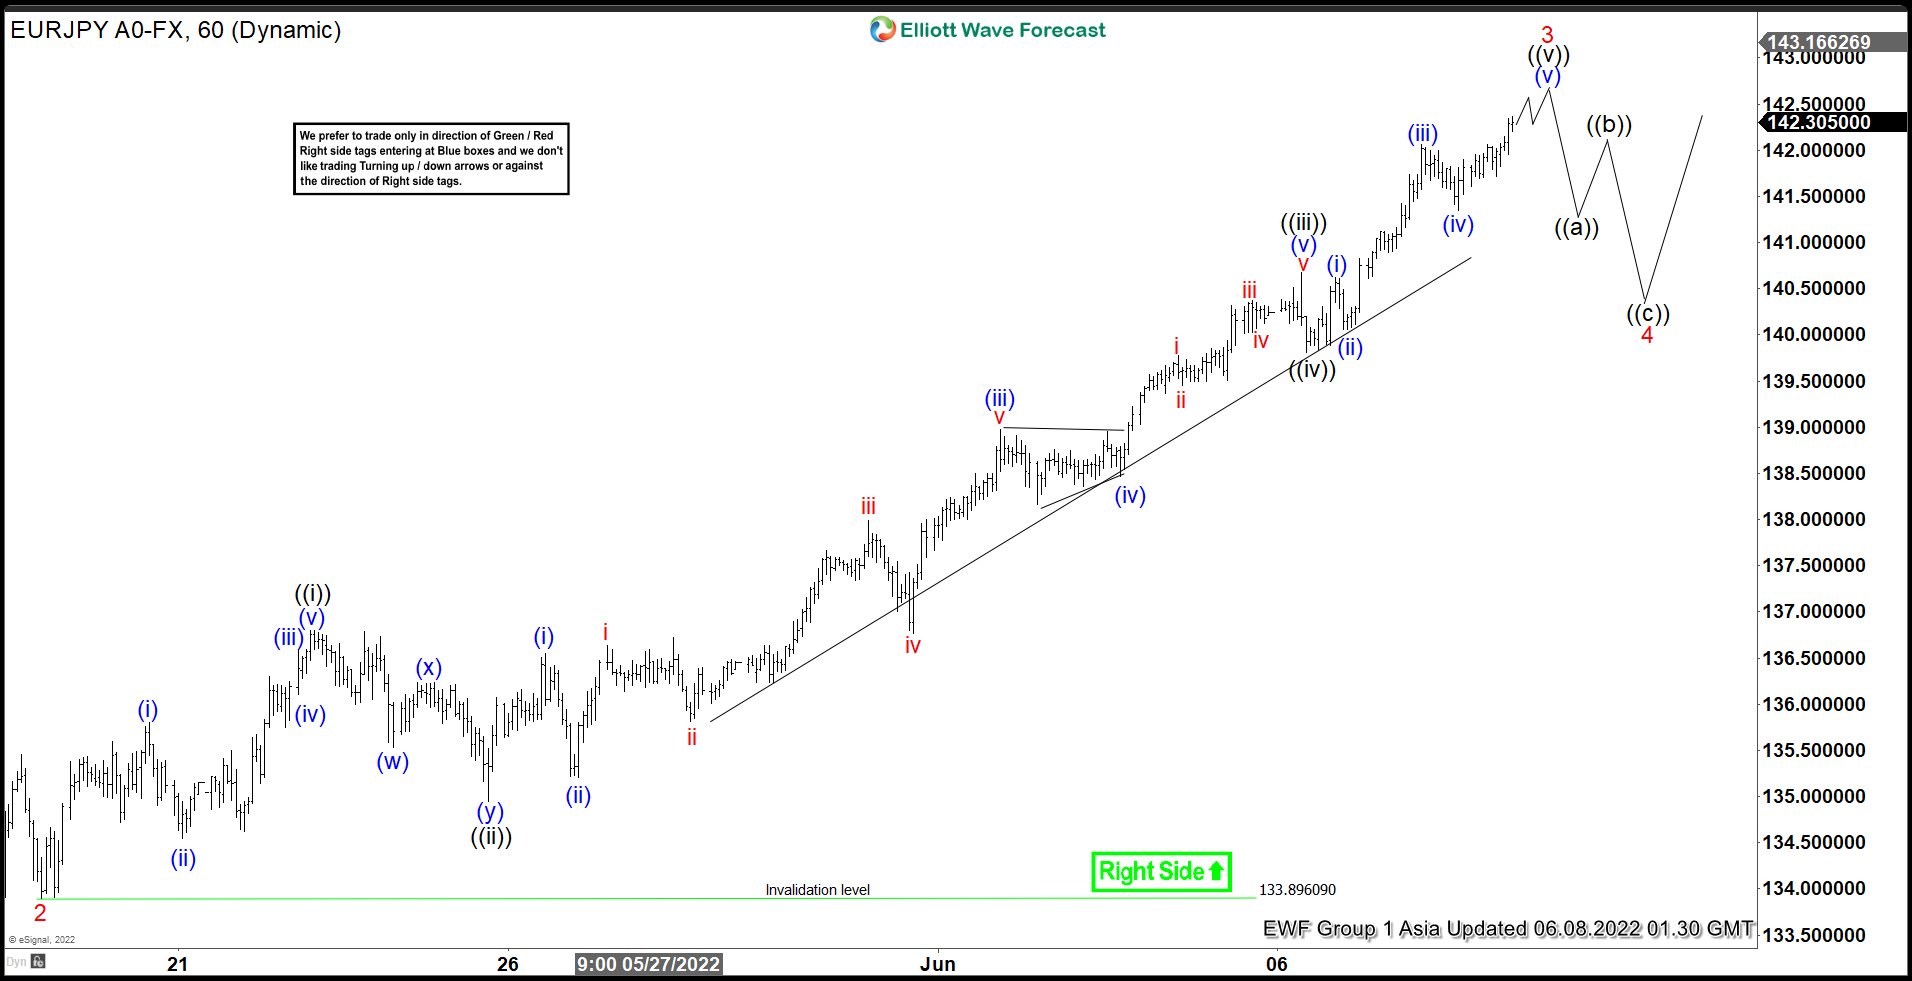
EURJPY shows an incomplete bullish sequence from March 2022 low favoring further upside. The 100% – 161.8% Fibonacci extension from March 2022 low can see pair reaching 148.3 – 158 level in the medium term. Short term Elliott Wave view in the pair suggests rally from May 12, 2022 low is unfolding as a 5 waves impulse Elliott Wave structure. Up from 5/12, wave 1 ended at 136.69 and pullback in wave 2 ended at 133.89. Wave 3 is expected to end soon with internal subdivision as another impulse in lesser degree.
Up from wave 2, wave ((i)) ended at 136.8 and pullback in wave ((ii)) ended at 134.95. Pair then resumes higher in wave ((iii)) towards 140.31, and pullback in wave ((iv)) ended at 139.81. Expect wave ((v)) to end soon which should also complete wave 3 in higher degree. Afterwards, pair should pullback in wave 4 before 1 more push higher in wave 5. Wave 4 usually is around 23.6 – 38.2% Fibonacci retracement of wave 3 once wave 3 level has been confirmed. As far as pivot at 133.89 low stays intact, expect any short term dips to find support in 3, 7, or 11 swing for further upside.
EURJPY 60 Minutes Elliott Wave Chart
GBPJPY Wave Analysis
- GBPJPY broke resistance level 115.00
- Likely to test resistance level 168.00
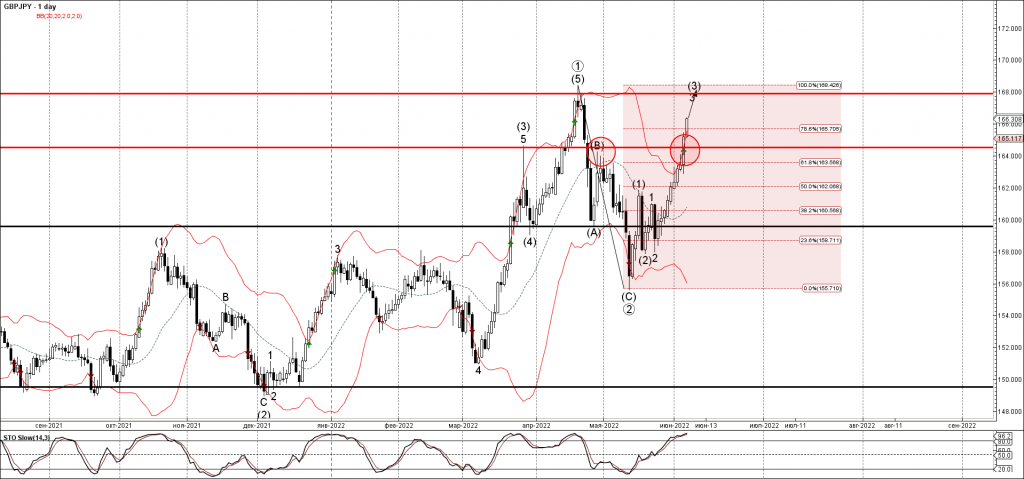
GBPJPY continues to rise after the earlier breakout of the key resistance level 115.00 (top of wave (B) from the end of April) .
The breakout of the resistance level 115.00 coincided with the breakout of the 61.8% Fibonacci correction of the earlier downward correction from the middle of April.
GBPJPY currency pair can be expected to rise further toward the next resistance level 168.00 (strong resistance from April and the target price for the completion of the active impulse wave (3)).
Eco Data 6/8/22
[php_everywhere instance="1"]
US CPI Awaited for Final Clues on Inflation Peak before Next Fed Meeting
The May consumer price index will bring some much-needed excitement for traders on Friday (13:30 GMT) in an otherwise light week for US economic releases. With investors desperately seeking clues that inflation has peaked in America, the data could prove pivotal for Fed policymakers, who meet on June 14-15 for their next rate setting decision. The US dollar has been consolidating lately, unable to establish a clear direction amid some uncertainty about the Fed’s rate path beyond the July meeting.
Is peak inflation becoming elusive?
There can be no denying that early signs of inflation peaking are emerging. CPI inflation moderated to 8.3% year-on-year in April and is expected to have held onto that clip in May. Core CPI is forecast to dip from 6.2% to 5.9% y/y, which would further bolster hopes that the worst of the price jumps is over. The PCE measure of inflation has also been on the soft side in the last couple of months. The core PCE price index – the Fed’s preferred metric – eased to 4.9% y/y in April after reaching 5.4% in February.
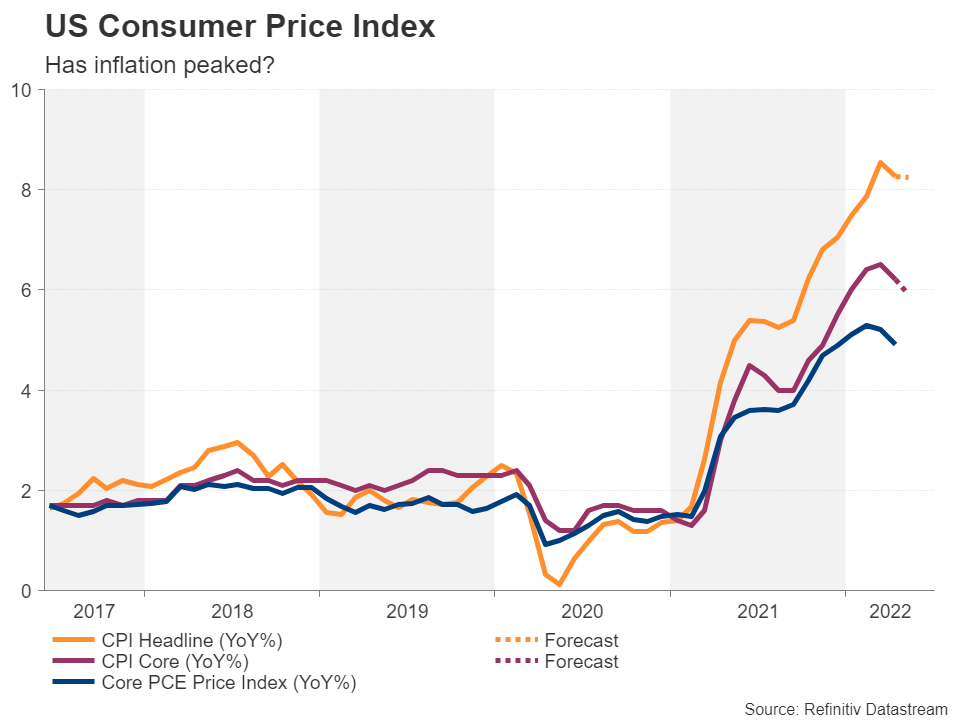
However, the month-on-month increase in headline CPI might raise some worries as it’s projected to have accelerated in May to 0.7%, which would dash expectations of a quick return to 2% inflation.
The Fed may be hesitant to pause
Several Fed officials, including Vice Chair Brainard, have hinted that there would have to be a substantial deceleration in inflation before being convinced that it’s no longer necessary to tighten policy with 50-basis-point increments. But not all FOMC members are as hawkish. Atlanta Fed President Raphael Bostic supports taking a pause in September to assess the impact of the latest rate hikes on the economy and on dampening inflationary pressures, although it’s worth pointing out that he’s not a voting member this year.
Still, if the annual CPI print misses the forecasts, this would probably be enough to buoy the markets as it would likely be interpreted as another sign that inflation is plateauing or has already done so. For policymakers, a more important question mark is how soon inflation will drop to within range of the Fed’s 2% target. That is something that will take a lot longer to transpire in the data, so until then, investors will seize on any indication that inflation is at a turning point.
Yen weakness may be overstating dollar momentum
In money markets, rate hike bets for the remainder of 2022 appear to be climaxing as they’ve been stuck around 200 basis points for the past month. Whilst it’s too soon to rule out further big rises in inflation, the focus for investors seems to be shifting towards negative surprises in the price readings after more than a year of constant positive shocks.
That could spell bad news for the dollar, which except against the anaemic Japanese yen, has not been able to surpass its early May highs. However, the greenback maintains a very bullish posture versus the yen and if the CPI numbers are stronger-than-expected, there could be further gains in store for the pair.
Is 135 yen the dollar’s next target?
Dollar/yen is currently edging up towards the 138.2% Fibonacci extension of the May downtrend at 133.25. Overcoming this resistance would open the way for the 161.8% Fibonacci of 134.42. Slightly higher, the 135 level could obstruct further advances before the bulls set their sights on the 200% Fibonacci of 136.33.
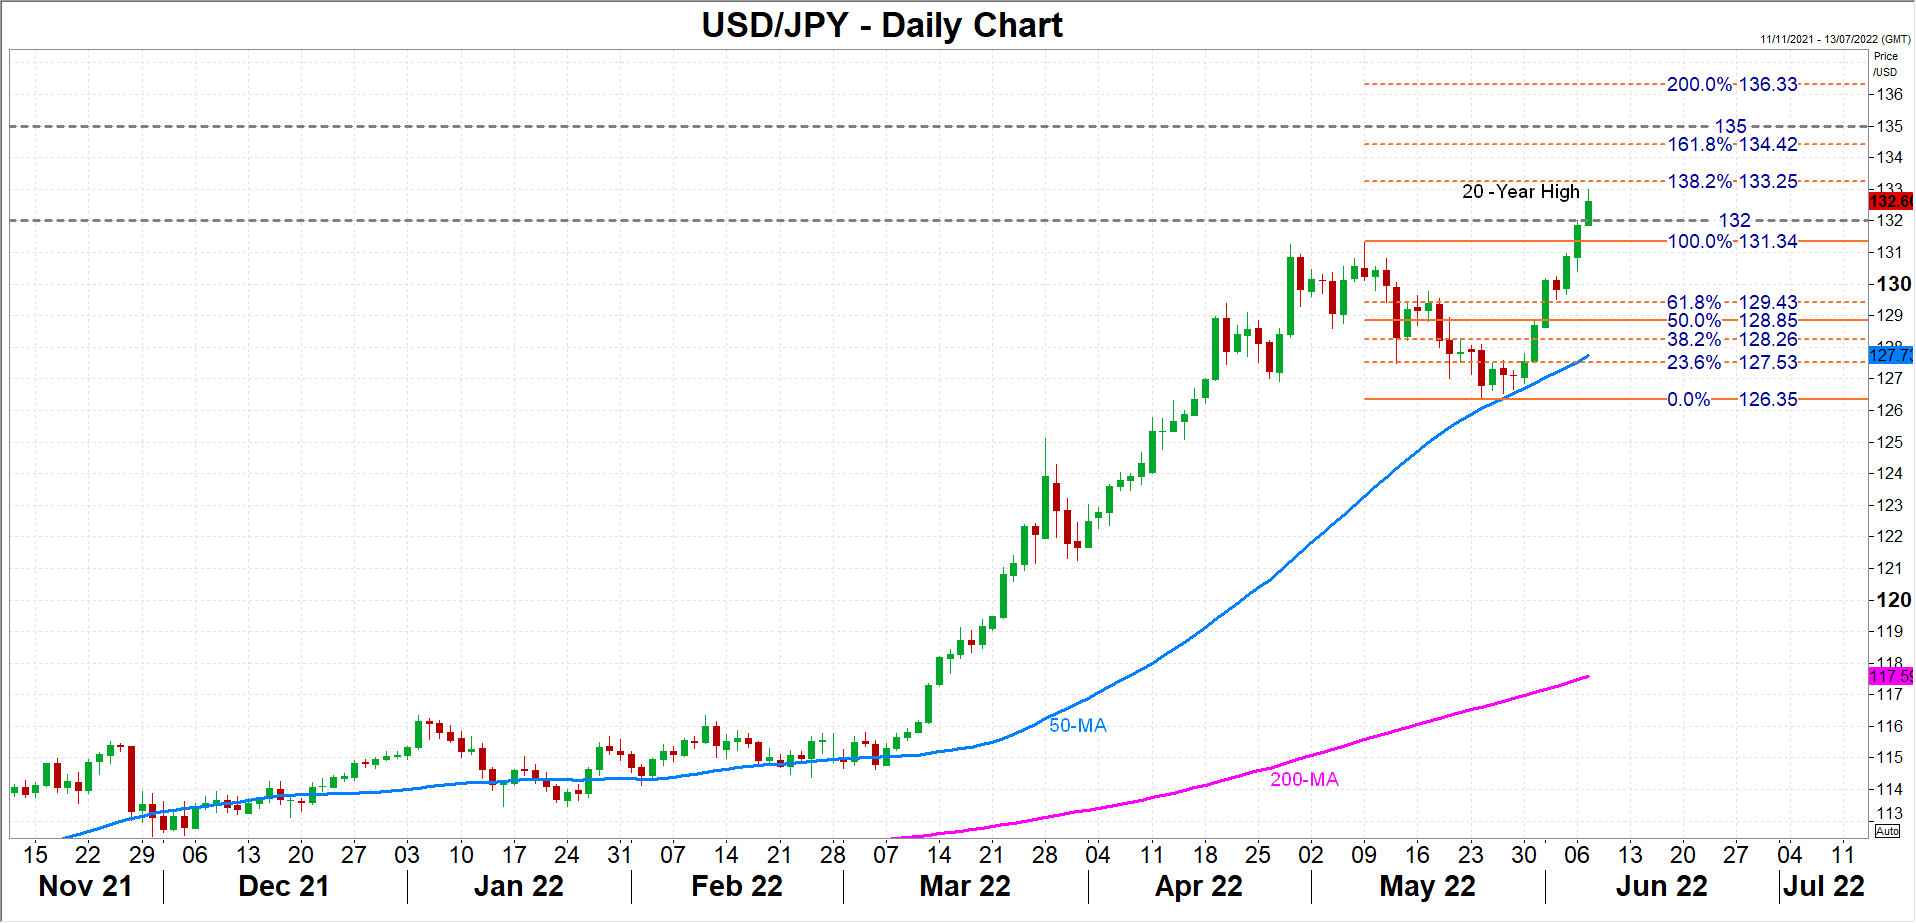
However, should Friday’s report provide more convincing evidence that inflation is cooling off, dollar/yen is at risk of a downside reversal as it’s looking a little overbought right now. Initial support is likely to come in the 132 area if the pair heads down, with the 61.8% Fibonacci retracement level of 129.43 potentially halting further declines ahead of the 50-day moving average at 127.73.
The Fed is highly anticipated to hike rates by 50 bps at its June meeting. But any unexpected weakness in the CPI data might sway some FOMC members to chart a shallower dot plot over the course of the forecast period.
Japanese Yen Falls to 20-Year Low
Dollar continues to pummel yen
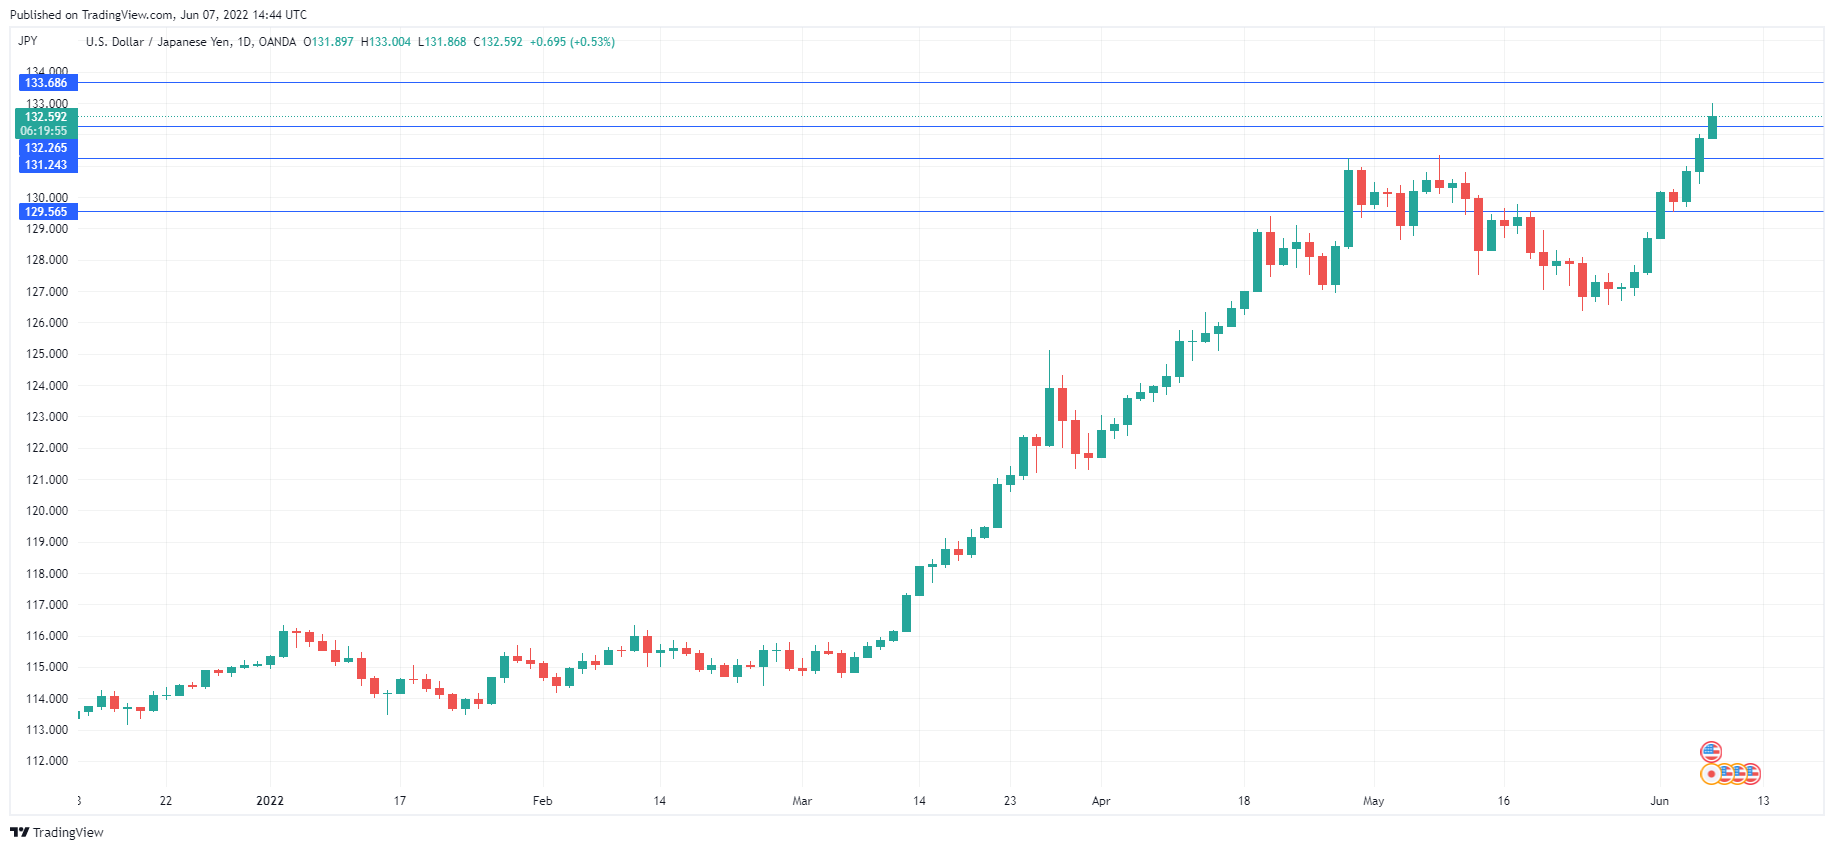
The Japanese yen continues to lose ground. USD/JPY touched the 133 line earlier in the day, as the yen hit a 20-year low. In the North American session, USD/JPY is trading at 132.55, up 0.50% on the day. The dollar index rose as much as 0.39% today and hit its highest level since May 23rd, before giving up these gains.
The sharp descent of the yen can be attributed to two factors. First, US Treasury yields are moving higher, and on Tuesday, the 5, 10 and 30-year yields are now above the 3 per cent level. The upward move in US yields could be related to this week’s USD 96 billion in government bond sales in the 3, 10 and 30-year tenors. The dollar has momentum and if Treasury yields remain above 3% and Friday’s US CPI print is high, USD/JPY should respond with further gains.
The second factor weighing on the yen is the Bank of Japan’s ultra-accommodative policy. BoJ Governor Kuroda said on Monday that monetary tightening was “not suitable and that the central bank would maintain its ultra-loose policy until the Bank achieved its inflation target of 2.0%. The BoJ has been quick to intervene to defend its yield curve, purchasing JGBs in order to cap yields on 10-year bonds at 0.25%. There has been speculation that the BoJ has a ‘line in the sand’ at which it would intervene to prop up the yen, but the yen continues to fall and touched 133 today with no signs that the BoJ is planning to step in. It should be remembered that Kuroda has stated on more than one occasion that a weak yen is mostly positive for the economy. In addition, surging oil prices are pressuring the yen, as crude oil is priced in US dollars.
With US rates moving higher and the BoJ keeping a cap on JGB yields, the US/Japan rate differential continues to widen, and the risk to the yen remains tilted to the downside.
USD/JPY Technical
- USD/JPY is testing resistance at 1.3226. Above, there is resistance at 1.3368
- There is support at 131.24 and 129.56
US 100 Index Halts Decline But Retains Bearish Bias
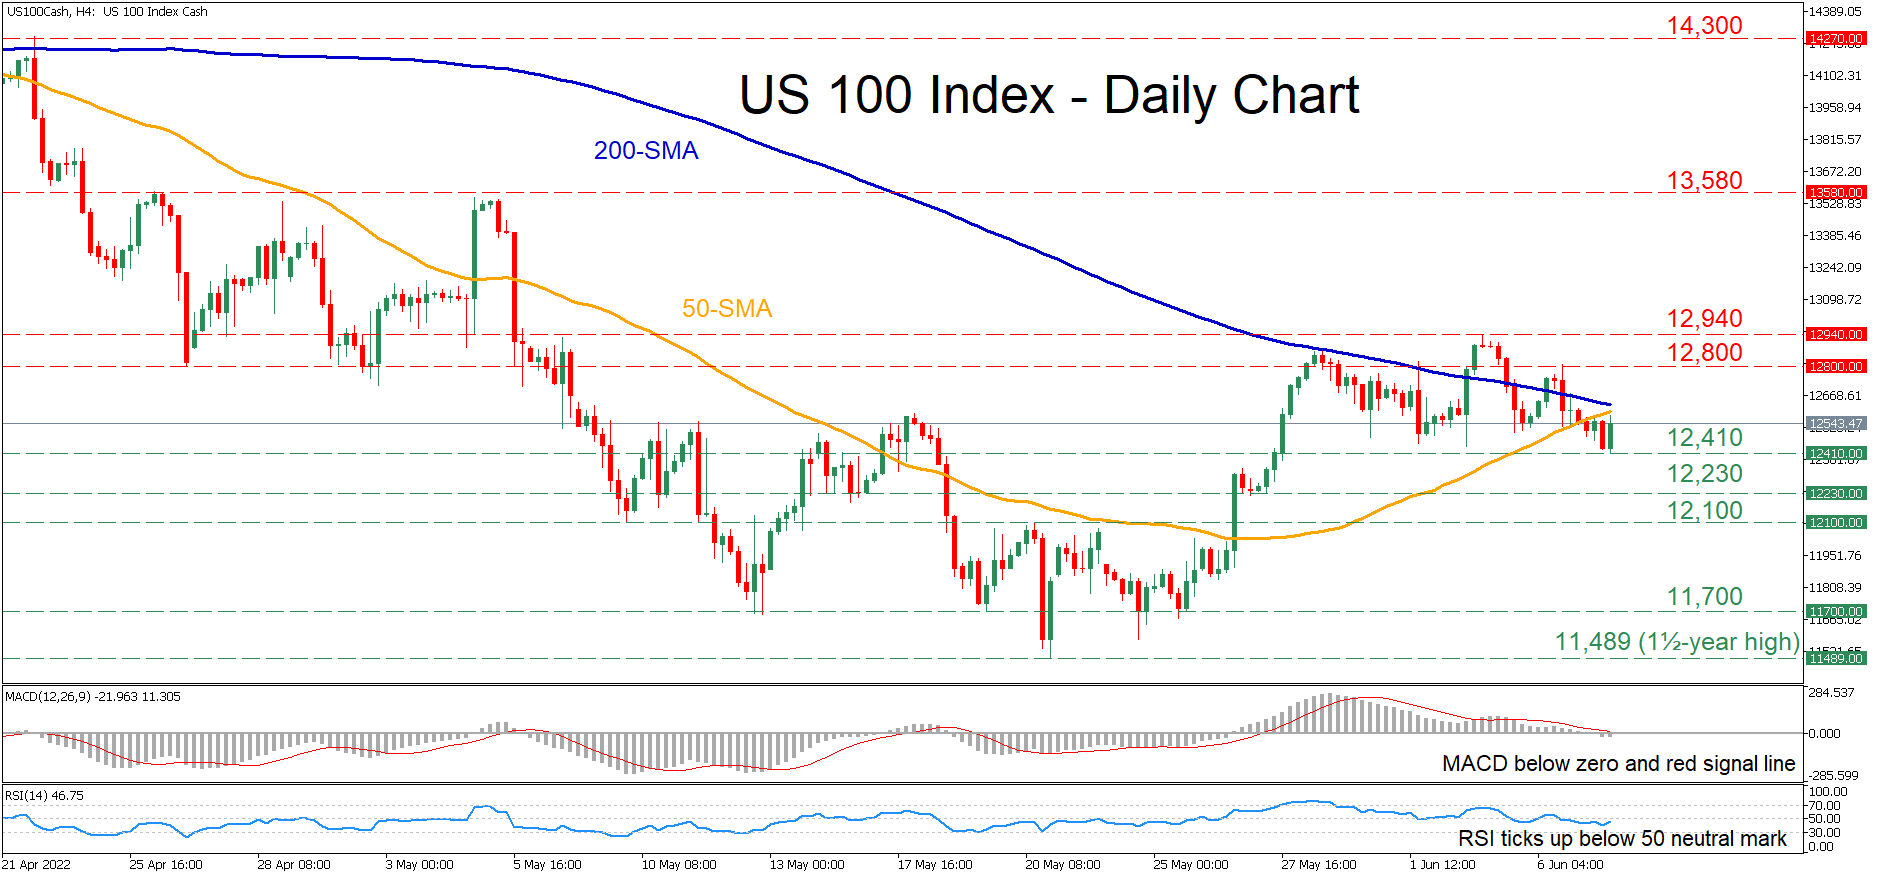
The US 100 stock index (cash) has been experiencing a minor pullback after its advance failed to cross above the 12,940 region. Nevertheless, the ascending 50-period simple moving average (SMA) is closing the gap with the 200-period SMA, where a potential upside violation could reinforce the case of a sustained recovery.
The momentum indicators suggest that bearish forces remain in control. The MACD histogram is currently beneath both zero and its red signal line, while the RSI is ticking up but remains below its 50-neutral threshold.
Should selling interest intensify further, the recent low of 12,410 could act as the first line of defence. Breaching this region, the bears might aim at 12,230 before the spotlight turns to the 12,100 level, which has acted both as support and resistance in recent months. Failing to halt there, the price could descend to challenge the 11,700 hurdle.
On the flipside, bullish actions could propel the index above both its 50- and 200-period SMAs, where the recent peak of 12,800 might act as initial resistance. Conquering this barricade, the spotlight could turn to the June high of 12,940 before 13,580 appears on the radar. Further advances may then cease at the 14,300 barrier.
In brief, the US 100 index has been experiencing a mild drop after the lower boundary of its recent sideways pattern was violated. For that bearish tone to reverse, the price needs to jump above the 12,940 ceiling.
Nasdaq100 is Likely Set to Fall to Long-Term Support
Late last week, the Nasdaq100 failed to break above the 61.8% mark of the decline from March to May amplitude. The sharp deterioration of last Friday, the failed attempt to get back up on Monday and the renewal of the local lows by the index futures at the beginning of the day on Tuesday is a possible prologue to a further downward spiral.
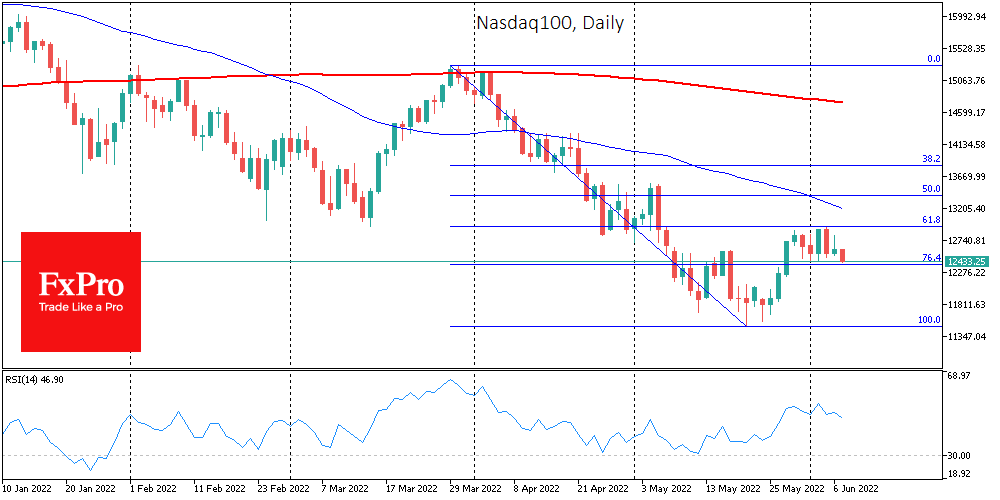
As with the first wave of declines from December to March, the fall was over 20% before we saw a corrective bounce. At the end of March, the stock’s recovery depleted on the approach to the 200-day moving average.
Last week the bears took over the initiative as the Nasdaq100 was approaching 13000, close to which was the significant support area of early 2021 and the 61.8% level of the global advance from the lows of March 2020 to levels of late 2021. Thus, the market has not reached a new level of recovery.
The market sentiment right now is more inclined to think that the rise in the last week of May was just a rebound in a falling market. If so, then the next logical target for the bears will be the 11500 area – the previous local lows.
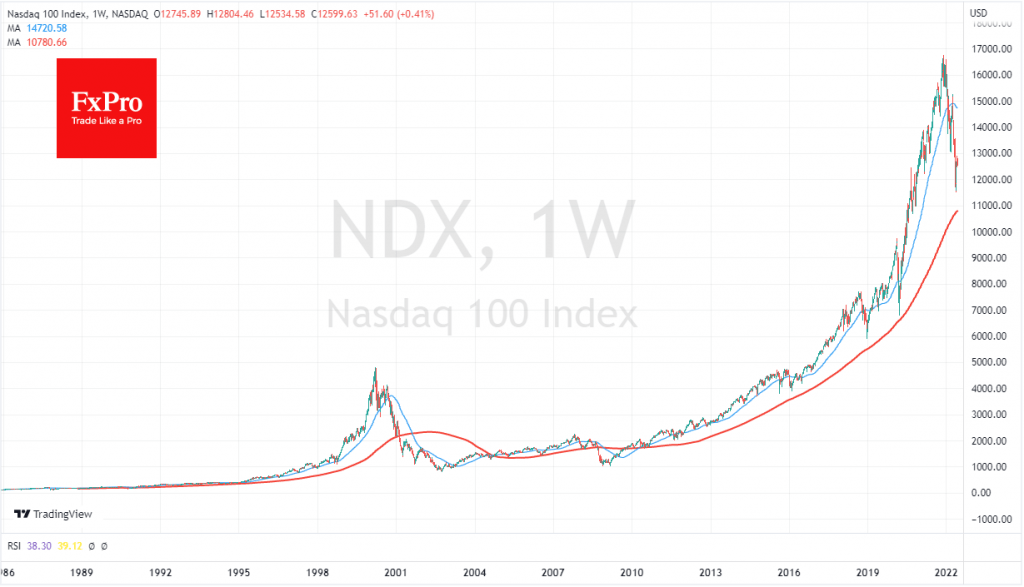
If that too falls under the pressure of worsening macroeconomic data, it is worth preparing for a pullback to 11000, a significant round level near the 200-week moving average. The latter line has been solid support in the declines of the Nasdaq100 since 2010 though now and from 1989 to 1995 when the dot-com rally ripped the index off its long-term trend.
While the Nasdaq100 at one time looked almost as detached from its long-term trend as it did at the turn of the century, it would still be too premature to adjust for a commensurate loss to 85% of the peak as it did 20 years ago.
Sunset Market Commentary
Markets
Yesterday, markets continued last week’s repositioning, preparing for central banks to take bigger steps to counter to runaway inflation. Last week’s US data in particular illustrated activity and the labour markets stay resilient. For now there is no reason to already anticipate any slowdown in the pace of Fed tightening beyond the baked in 50 bps hikes for the June and July meetings. US yields for maturities longer than 5-year all returned (temporary?) north of 3.0%. European yields set new multi-year peak levels across the curve as investors are looking forward to Thursday’s ECB meeting. This morning, the Reserve Bank of Australia confirmed the trend in vogue, raising rates by a bigger than expected 0.50 bps to an 0.85%. Still with no key eco and sentiment turning risk-off, the rally in yields finally takes a breather. US yields are easing between 1.25 bps (2-y) and 4bps (10/30-y). EMU yields mostly how a more modest setback (German yields about minus 2bps across the curve) ). Even in a risk-off context, investors apparently don’t want to be wrong-foot as the new ECB inflation projections to be published alongside Friday’s policy statement might reinforce the case for more bold action. Recently, US and European equities held up fairly well despite the new up-leg in yields. However, today, amongst others, a big US retailer warning on profit margins as it tries reduce inventories amid weakening demand weighed on sentiment. US indices after the open are ceding between 0.6% (Dow/S&P) and 0.8% (Nasdaq). The EuroStoxx 50 drops about 1.1%. At $ 119 pb, brent oil is trading slightly off last week’s peak levels well north of 120 p/b. However, for now, there is no sign of a genuine trend reversal yet.
On FX markets, the dollar continues last weeks, admittedly gradual, comeback. The trade-weighted index (102.8) tries to regain the 102.74 short-term neckline. USD/JPY this morning touched the 133 barrier. However, softer US yields during the day slow the USD/JPY ascent (currently 132.75). A brief attempt of EUR/USD to regain the 1.07 barrier failed. The pair currently again trades in the 1.0655 area, nearing next support at 1.0627. The jury is still out, but a break below this level would suggest a loss of short-term momentum, which would be a bit surprising going into Thursday’s ECB meeting. Sterling is showing a mixed picture. After UK PM Johnson surviving a confidence vote within its own Conservative part, sterling this morning temporary declined to the GBP/USD 1.2431 area and EUR/GBP 0.8585 area. However, markets apparently concluded that politics probably won’t change the expected path for BOE policy in the short term. EUR/GBP and cable currently returned to 0.853 and 1.25area respectively.
News Headlines
First Deputy Governor of the Riksbank Skingsley is leaving the Swedish central bank in August. Skingsley was widely seen as the frontrunner to replace Governor Ingves, who’s term ends at the end of this year. Her leaving opens the race to succeed Ingves at a time the central bank just made a huge U-turn on its very easy monetary policy and pressure is building to move faster with rate hikes than signaled back in April. The Swedish krone is trading a tad lower vs the euro today. EUR/SEK briefly ventured north of 10.50 before paring gains (SEK losses) to 10.48.
The US trade deficit narrowed sharply in April, from -$107.7bn to -$87.1bn vs. -$89.5bn expected. A less negative balance came both on the back of rising exports (+3.5% m/m) as well as falling imports (-3.4% m/m). A record deficit in the first quarter this year chopped 3.23 ppts of GDP back then. The first reading of the second quarter suggests trade this time could in fact contribute to growth for the first time in two years.
Hungary’s Government Debt Management Agency (AKK) raised the gross foreign currency bond issuance target by an equivalent of 2.5bn euro, bringing the total FX target for this year to 5.1bn euro. Of that amount, 4.5bn euro is remaining after February’s Samurai bond transaction. The AKK’s goal is to further extend average term-to-maturity and to diversify the investor base, it explained in a statement. The additional FX bond issuance won’t compromise the objective of having the FX debt ratio within the 10-25% benchmark range, AKK added, and the agency still plans to buy back some $2bn in FX debt that expires in 2023-2024. It has repurchased $50mln so far.