

Sample Category Title
AUD/USD Elliott Wave Analysis: RBA and China Reopening are Good for Aussie Bulls
RBA surprised and hiked more than expected this week; they lift the interest rate to 0.85% from 0.35% during the latest meeting, but Aussie did not rally much. We have seen 60 point move before the pair slowed down, despite the fact that the board expects to take further steps in the process of normalizing monetary conditions in Australia over the months ahead. Decisions will depend on upcoming data.
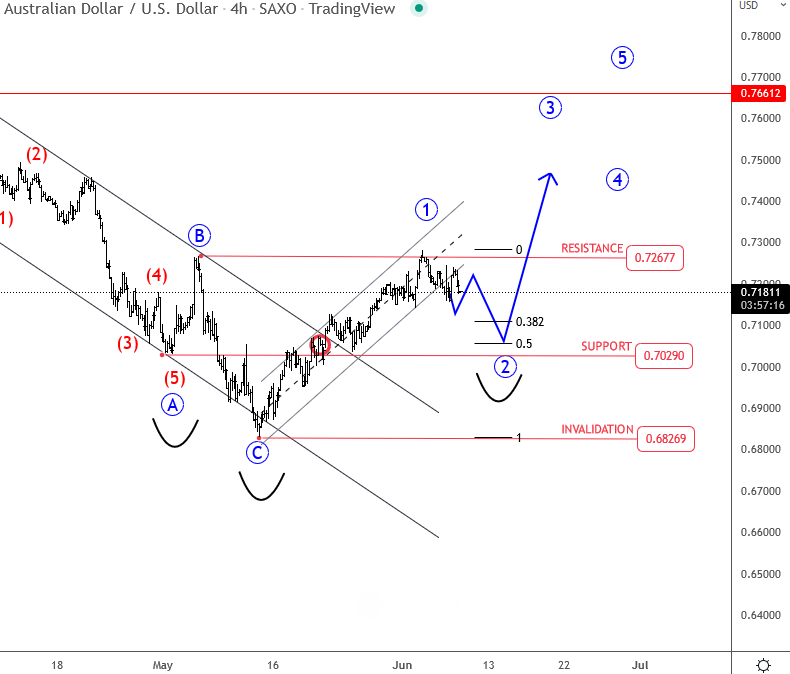
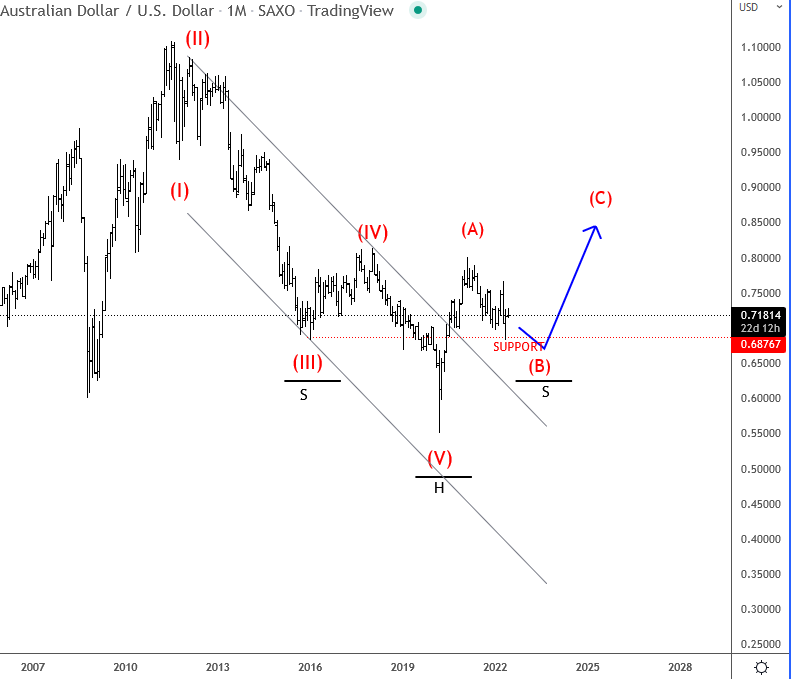
Technically speaking Aussie is trying to wake up along with stocks, so seems like wave C is already in place, unless this is still a higher degree leg A from the 0.7661 highs. Well, at this stage it's too early to confirm any new long-term bottom, but at least in the short-term, we should be aware of more upside after recently broken trendline resistance in the first leg, so more upside can be coming after pullback. Support is at 0.70/30 which can be also a base for a right shoulder. Some resistance is now at 0.7267 for end of the first leg.
Big picture
Ideally, the weakness from the start of April belongs to a higher degree of corrective set-back from 2021 highs which can stop this year around 0.6800 area especially as RBA sees a lot more rate increases in the months ahead. So at some point policy gap between RBA and FED will narrow which can be a catalyst for a bounce on Aussie in the second part of 2022. Bounce on stocks would also be very positive for the Aussie.
Eurozone GDP finalized at 0.6% qoq in Q1, EU at 0.7% qoq
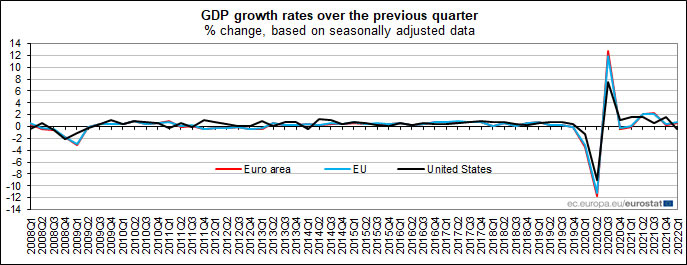
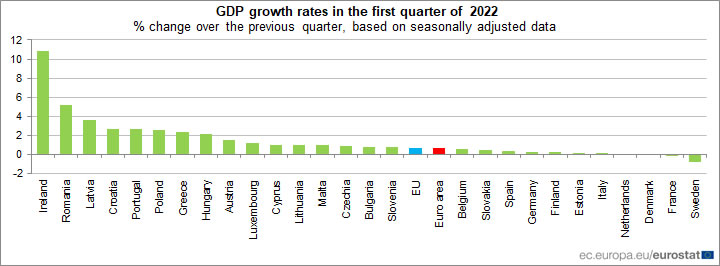
Eurozone GDP grew 0.6% qoq in Q1, revised up from prior estimate of 0.3% qoq. EU GDP grew 0.7% qoq. Ireland (+10.8%) recorded the highest increase of GDP compared to the previous quarter, followed by Romania (+5.2%) and Latvia (+3.6%). Decreases were observed in Sweden (-0.8%), France (-0.2%) and Denmark (-0.1%).
Eurozone employment grew 0.6% qoq while EU employment grew 0.5% qoq. In the first quarter of 2022, Estonia (+3.5%), Latvia (+2.1%) and Portugal (+1.7%) recorded the highest growth of employment in persons compared with the previous quarter. Employment declined in Poland (-0.6%) and Croatia (-0.1%).
UK PMI construction dropped to 56.4, optimism deteriorates
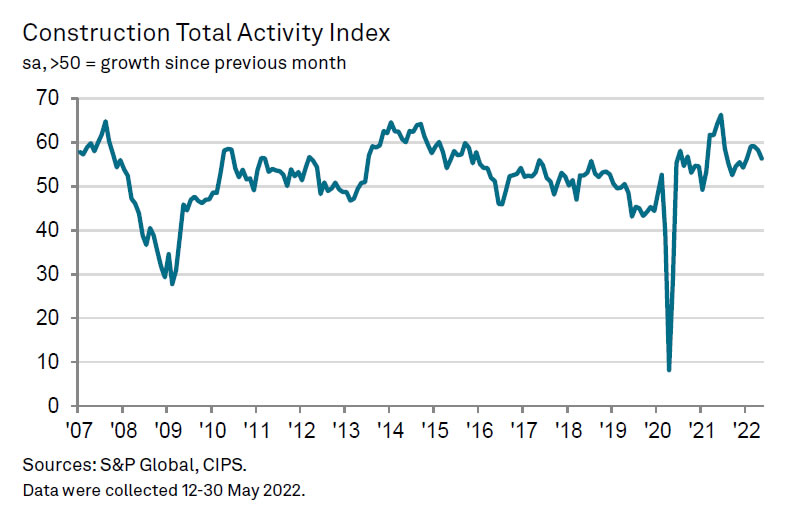
UK PMI Construction dropped from 58.2 to 56.4 in May, below expectation of 56.9. S&P Global said total activity expanded at the slowest pace since January. Housing remained worst-performing category. Optimism was lowest since August 2020.
Tim Moore, Economics Director at S&P Global Market Intelligence: "May data signalled a solid overall rise in UK construction output as resilience across the commercial and civil engineering segments helped to offset weakness in house building. Residential construction activity was close to stagnation... New order volumes expanded at the slowest pace since the end of 2021...
"Concerns about the business outlook were signalled by a fall in construction sector growth projections to the lowest for more than one-and-a-half years in May. Around 19% of construction firms predict an outright decline in business activity during the year ahead, up from just 5% at the start of 2022."
BoJ Kuroda: Various models show weak yen is positive
BoJ Governor Haruhiko Kuroda said today that Yen's depreciation is "positive to the economy as long as the moves are stable". He added, "various macroeconomic models show weak yen is positive.. But he also reiterated that it's important for exchange rate to move "reflecting fundamentals".
Kuroda also retracted the remain made earlier on inflation which triggered massive social media backlashes. He told reporters at the Prime Minister's Office, "I did not mean that consumers are voluntarily accepting the price increases. I apologize if my words led to a misunderstanding."
Bitcoin Swings in a Tight Cage
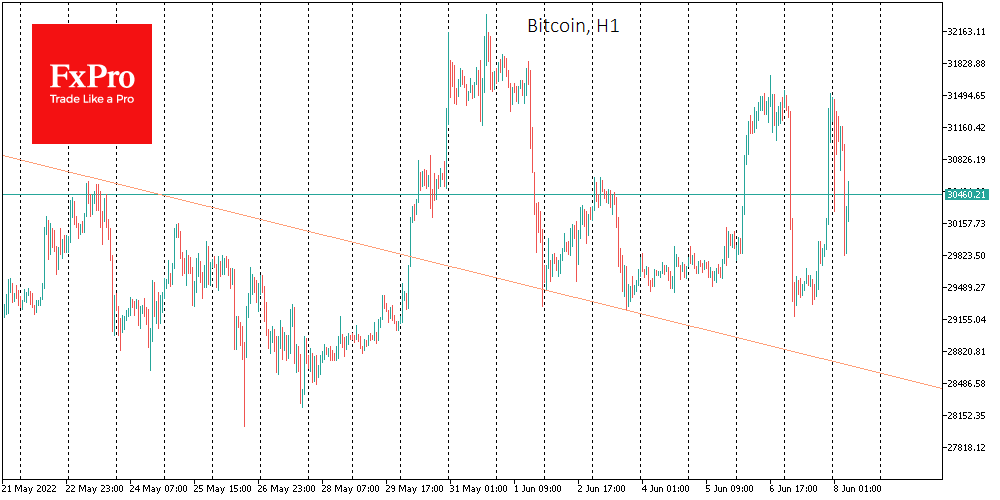
Bitcoin continues its wild swings between $29-31.5K. By the end of the day on Tuesday, it had moved sharply back to the upper end of the range, but Wednesday began with a new dip, temporarily falling below 30K. Overall, bitcoin adds 2.7% over the day and has lost 4% in seven days, all well below the intraday fluctuation amplitude.
Ethereum has added 2.2% in the last 24 hours, while other leading altcoins have shown mostly positive dynamics, where a 9.8% spike in Cardano contrasts with a 0.3% decline in Solana’s price.
Total crypto market capitalisation, according to CoinMarketCap, strengthened by 2.2% overnight to $1.24 trillion, with the Bitcoin Dominance Index down 0.2 points to 46.6%. The Cryptocurrency Fear and Greed Index was up 2 points to 17 by Wednesday and remains in “extreme fear”.
According to Glassnode, investors continue to buy the dip in bitcoin. The number of addresses with a balance of at least 0.01 BTC reached 10.088 million earlier this week, setting a new record.
The market dynamics of the last few days indicate that the whales are making some big transfers of bitcoin from one pocket to another. Either this is an attitude of speculation in the range or whipping up froth to attract capital from retail investors who may feel that the low point has been passed.
The US Securities and Exchange Commission (SEC) launched an investigation into the sale of BNB tokens by cryptocurrency exchange Binance in 2017. The regulator will assess whether it was an unregistered offering of securities.
American economist and Nobel Prize winner Paul Krugman called cryptocurrencies a fraud, comparing them to the mortgage crisis in 2008.
NZDUSD Exposed to More Selling
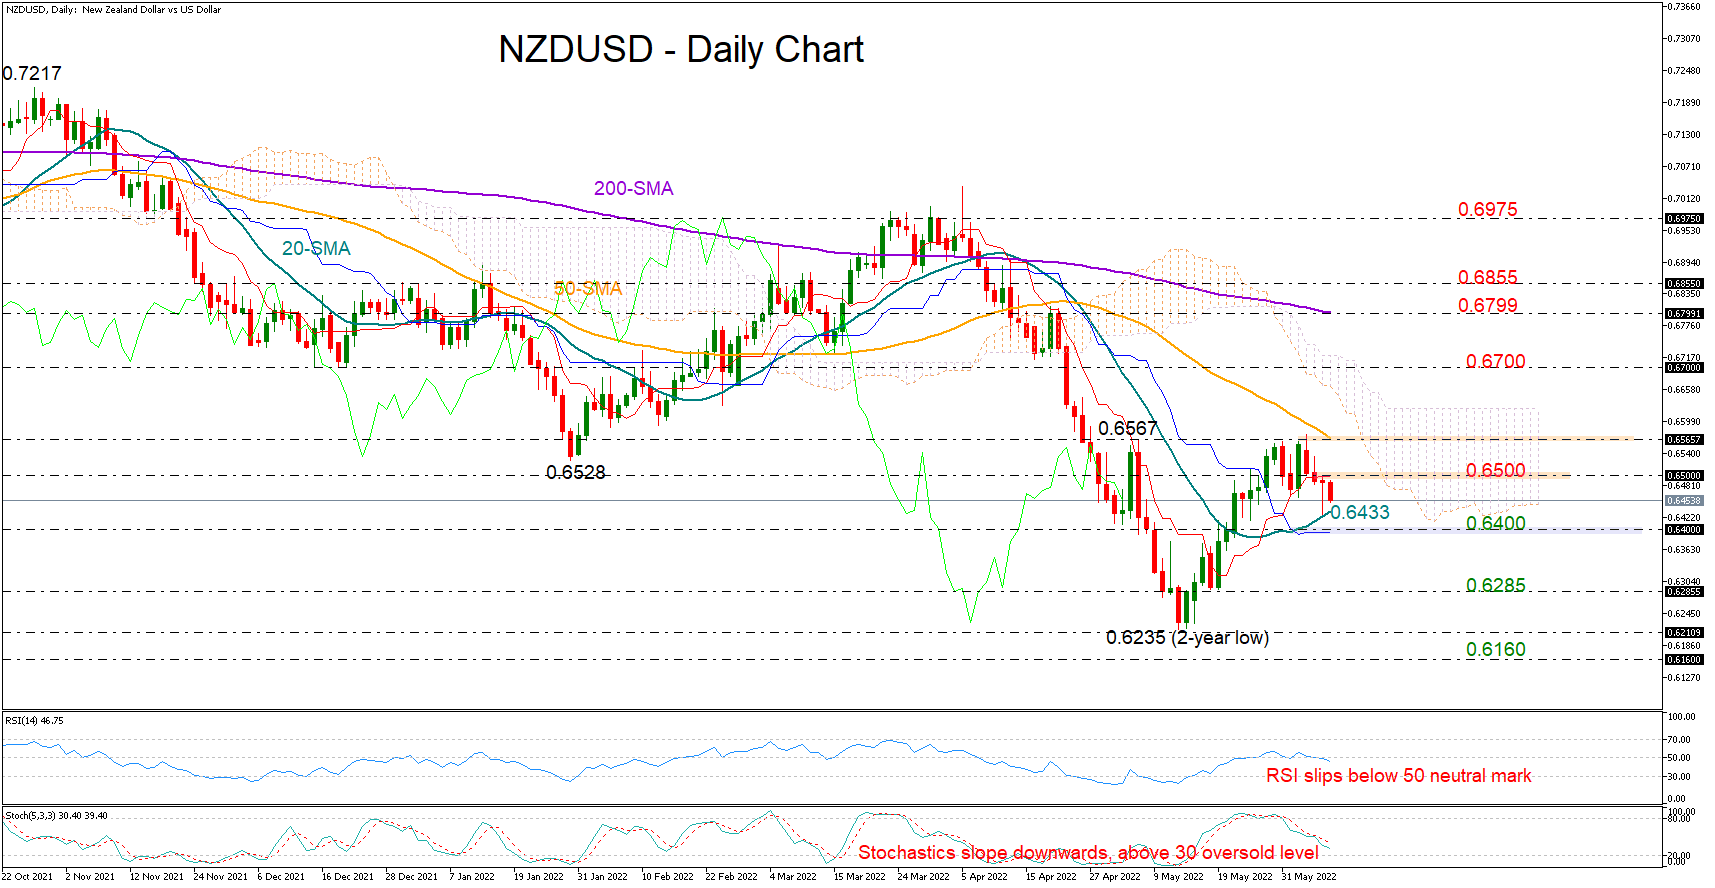
NZDUSD entered a new bearish phase last Friday after failing to chart a new higher high above May’s peak of 0.6567, with the price falling as low as 0.6421 on Tuesday.
The 20-day simple moving average (SMA) managed to add some footing under the price yesterday, though buyers did not have enough fuel to successfully drive above the red Tenkan-sen line and the 0.6500 level, keeping negative risks intact in the market.
In momentum indicators, the RSI has already entered the bearish territory below 50, while the falling Stochastics have not reached the oversold territory yet, both painting a blurry picture for short-term trading too.
Should selling tendencies intensify below the 0.6433 – 0.6400 zone, the spotlight will turn to the 0.6285 support area. The two-year low of 0.6235 could next come into view, while within breathing distance, the 0.6160 number has been a key constraining zone during the first half of 2020; therefore, it may attract special attention before the way clears towards the 0.6000 round level.
On the upside, the 0.6500 region will be closely watched in the coming sessions, though the 0.6567 barricade, where the 50-day SMA is currently located, will probably be the key for an acceleration towards the 0.6700 former boundary. If buying appetite grows further from here, traders will look for a close above the 200-day SMA currently at 0.6799, and more importantly, beyond 0.6855, before they target the March – April ceiling around 0.6975.
In brief, NZDUSD is in a discouraging situation in the short-term picture, with sellers waiting for a break below 0.6433 -0.6400 to go into full speed.
USDJPY Skyrockets to New 20-Year High above 133.00
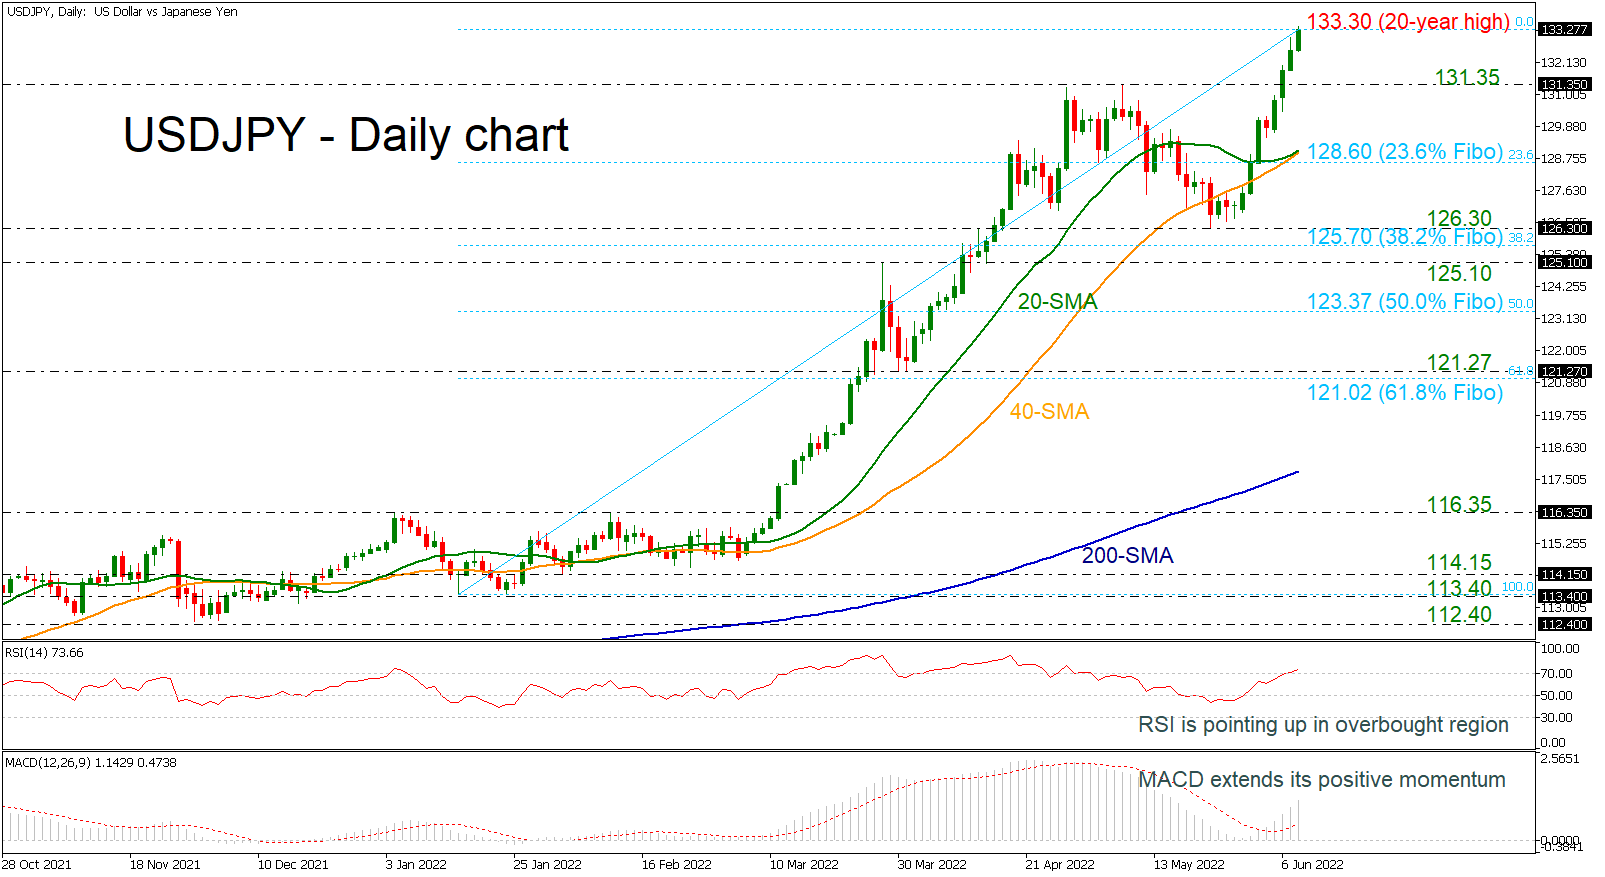
USDJPY is flying towards a fresh 20-year high around 133.30, continuing the strong buying interest that started after the bounce off the 126.30 barrier. The 20- and 40-day simple moving averages (SMAs) failed to post a bearish crossover, changing their direction to the upside. The RSI indicator entered the overbought region, while the MACD is extending its bullish movement above its trigger and zero lines.
Traders would be more willing to continue the bullish rally and if there is a closing day above the 133.00 round number then the next stop might be somewhere between the 135.15 barrier, which was registered in February 2002, and the 146.80 resistance.
On the other hand, the selling pressure could increase if the market declines below the short-term SMAs at 128.80. This would bring the 23.6% Fibonacci retracement level of the up leg from 113.40 to 133.30 into the spotlight, which, if violated, could trigger sharper losses probably toward the 126.30 barrier.
To summarize, if the price breaks over today’s peak, there is a good chance that USDJPY will show additional signs of improvement. On the other hand, a drop below the short-term SMAs may switch the outlook to neutral.
EURUSD Still Ranging ahead of ECB Decision and EU GDP Data
American stocks pared earlier losses on Tuesday as investors continued worrying about inflation and margins among companies. The rising cost of doing business and the logistics challenges have left many companies in a challenging situation. For example, Target, one of the biggest American retailers warned that it will make less money because it will either discount or cancel products like furniture and clothing. Another worry is the strong US dollar and its impact on American companies. Last week, Microsoft lowered its guidance because of falling currencies like euro and the Japanese yen.
The Japanese yen continued falling against the US dollar after the latest Japanese GDP numbers. The data revealed that the country’s economy contracted in the first quarter as external demand weakened. The country is expected to be the worst performer among G7 countries. The BOJ has committed to maintaining an easy-money policy in the foreseeable future. At the same time, the current government is committed to continuing with is debt-fueled spending. Still, the impacts of the plummeting yen on the economy are dire since it has contributed to the rising inflation.
The economic calendar will have several important events. In Switzerland, the statistics office will publish the latest unemployment numbers. As always, the numbers are expected to show that the country’s unemployment rate remained at 2.2% in May. The other important data to watch will be the upcoming UK house price data by Halifax. Analysts, based on the previous reading by Nationwide, expect the data to show that prices moderated in May. Meanwhile, Eurostat will publish the latest GDP data while the EIA will release the latest oil inventory data.
USDJPY
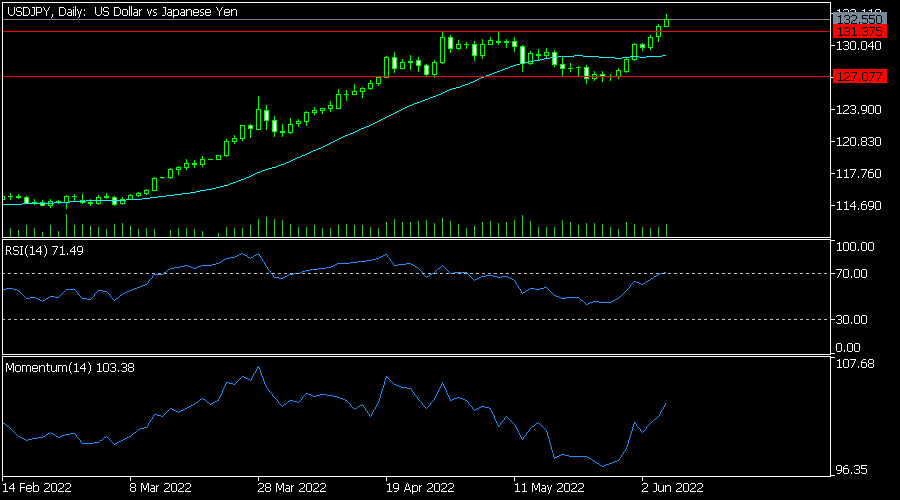
The USDJPY pair has been in a strong bullish trend in the past few months. In June, it has managed to move above the resistance level at 131.37, which was the highest level on May 11. The pair’s bullish trend is still being supported by the 25-day moving average while the Relative Strength Index is approaching the overbought level. By moving above the resistance at 131.37, the pair has invalidated the double-top pattern. Therefore, the bullish trend will likely continue unless the BOJ intervenes.
EURUSD
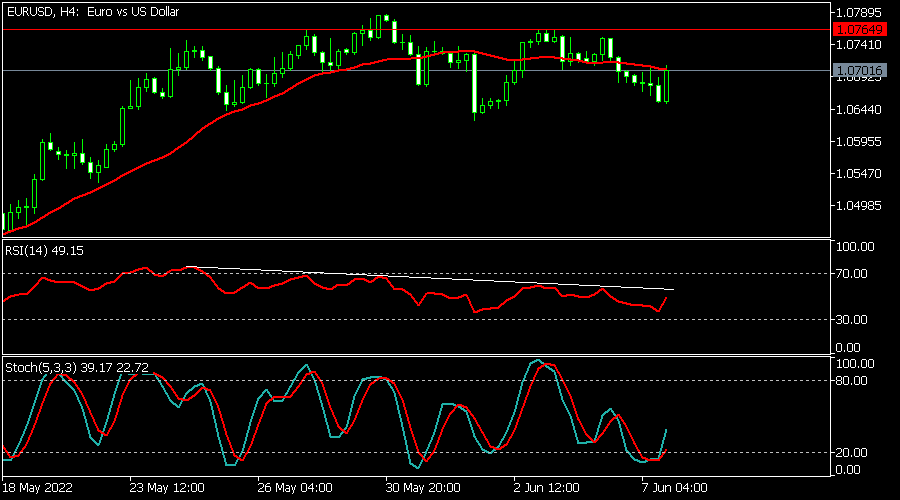
The EURUSD pair moved sideways ahead of the upcoming EU GDP numbers. It is trading at 1.0700, which is slightly above this week’s low at 1.0620. The pair is also along the 25-day moving average and slightly below the important resistance at 1.0765. The Relative Strength Index (RSI) has moved downwards while the Stochastic Oscillator has risen above the oversold level. Therefore, the pair will likely keep falling ahead of the ECB decision.
XNGUSD
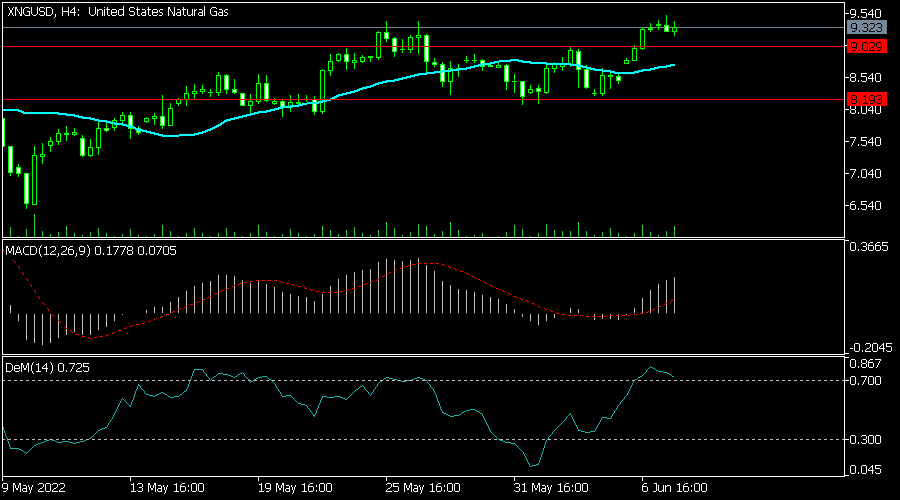
The XNGUSD pair continued its bullish trend as demand for natural gas continued. It is trading at 9.32, which is slightly below the highest point this year. The MACD has moved slightly above the neutral point while the DeMarker indicator has moved to the overbought level. Therefore, the pair will likely keep rising as bulls target the key resistance at 9.60.
EUR/USD: Weakened Near-Term Structure Favors Further Downside
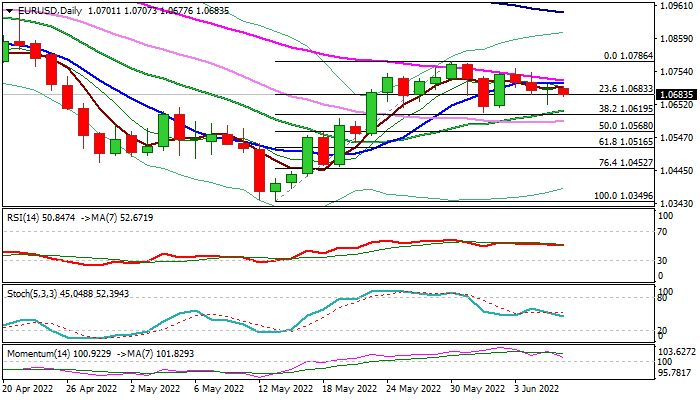
The Euro is holding in red in early Wednesday and probing again through Fibo support at 1.0683 (23.6% of 1.0349/1.0786 upleg).
Fresh bears emerged after recovery was rejected at pivotal Fibo resistance at 1.0787 (38.2% of 1.1494/1.0349) while falling daily cloud and weakening daily studies reinforce negative near-term stance.
Clear break of 1.0683 would open way for attack at key levels at 1.0630/20 zone (June 1 low/Fibo 38.2% of 1.0349/1.0786), break of which would generate stronger bearish signal on violation of pivotal Fibo support and completion of failure swing pattern on daily chart.
Weaker than expected German industrial production data added to bearish outlook, while traders await Eurozone Q1 GDP and the event of the week – ECB policy meeting on Thursday, which are expected to provide clearer direction signals for the single currency.
Res: 1.0714; 1.0728; 1.0751; 1.0786.
Sup: 1.0652; 1.0620; 1.0600; 1.0568.
EURUSD Sensitive to ECB’s July Hike Clues
Markets will be keenly watching ECB President Christine Lagarde’s press conference on Thursday, for the latest signals pertaining to the size of its intended July rate hike, in addition to the widely expected announcement about the end of the central bank’s net asset purchases.
Noting that the RBA and the RBI have now also hopped on the 50-basis point hike bandwagon, it remains to be seen whether such peer pressure could ratchet up the hawkish inclinations within the ECB’s Governing Council. After all, the impetus for a larger-than-usual hike is already there, with Eurozone inflation hitting a fresh record high of 8.1% in May.
EURUSD could resurface above 1.08 should Lagarde’s remarks be seen to acquiesce with her more hawkish colleagues. This also assumes that the ECB lays the groundwork this week for exiting its negative interest rates regime in one fell swoop come July. The deposit rate currently sits at negative one half of a percentage point. An ECB hike this week would be a major shock and instead propel EURUSD way beyond the clutches of its 50-day moving average and towards the 1.09 mark.
However, should Lagarde stay relatively dovish and insist on a run-of-the-mill 25bp hike next month, then EURUSD is expected to continue languishing in the downtrend that has persisted over the past 12 months. There are now 75bps of rate hikes priced in by money markets by September.
Risk sentiment to be influenced by US inflation print
Global markets are also keenly awaiting Friday’s US CPI release for signs that price pressures have peaked. If the 8.2% median estimate for May’s inflation year-on-year growth proves true, that would mark two consecutive months of moderating headline figures since the 8.5% print in March.
Markets’ propensity for risk-taking could be rejuvenated if the latest inflation data emboldens the thought that consumer price growth has already hit its summit, potentially taking the edge off the Fed’s ultra-hawkish stance.
On the other hand, if this Friday’s CPI data exceeds market expectations, underscoring the unrelenting nature of inflationary pressures, that should force the Fed into an even more aggressive stance. Such an outlook should restore the benchmark dollar index DXY back to recent heights while keeping 10-year Treasury yields above the psychologically important 3% mark, to the chagrin of other assets such as growth stocks, gold, and EM assets.