Sample Category Title
USD/CAD Daily Outlook
Daily Pivots: (S1) 1.2498; (P) 1.2558; (R1) 1.2593; More...
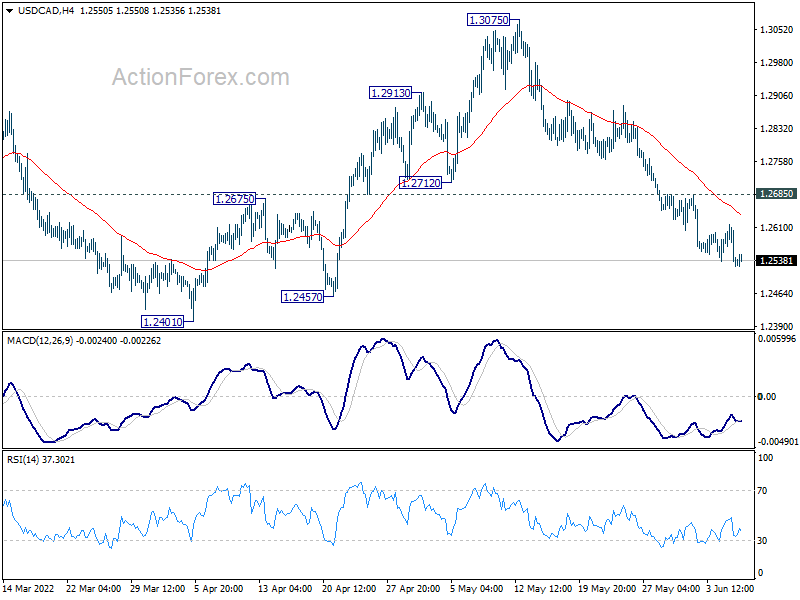
Intraday bias in USD/CAD stays on the downside a this point. Fall from 1.3075 should target 1.2401 support first. Decisive break of 1.2401 support will argue that whole rebound from 1.2005 has completed, after rejection by 1.3022 fibonacci resistance. Deeper fall would then be seen to retest this low. On the upside, above 1.2685 minor resistance will turn bias back to the upside for stronger recovery.
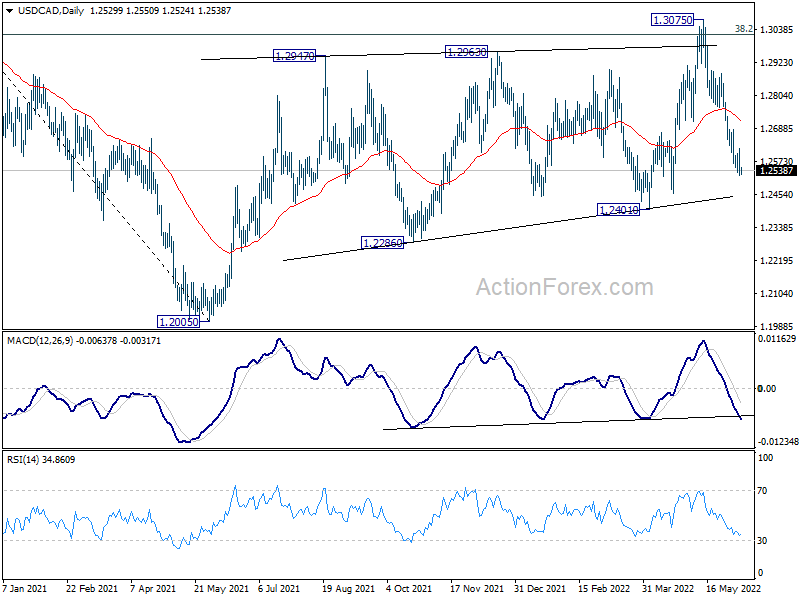
In the bigger picture, focus stays on 38.2% retracement of 1.4667 (2020 high) to 1.2005 (2021 low) at 1.3022. Sustained break there should confirm that the down trend from 1.4667 has completed after defending 1.2061 long term cluster support. Further rise would then be seen towards 61.8% retracement at 1.3650. However, rejection by 1.3022 will maintain medium term bearishness. Break of 1.2005 will resume the down trend from 1.4667 and that carries larger bearish implications too.
AUD/USD Daily Report
Daily Pivots: (S1) 0.7177; (P) 0.7211; (R1) 0.7266; More...
Intraday bias in AUD/USD remains neutral as consolidation form 0.7282 is extending. Further rise will remain in favor as long as 0.7034 support holds. Current development raised the chance that whole fall corrective fall from 0.8005 has completed at 0.6828. Above 0.7282 will extend the rebound to 0.7660 resistance for confirmation. However, break of 0.7034 will dampen this bullish view and bring retest of 0.6828 low instead.

In the bigger picture, price actions from 0.8006 are seen as a corrective pattern to rise from 0.5506 (2020 low). Deeper fall could be seen to 50% retracement of 0.5506 to 0.8006 at 0.6756. This coincides with 100% projection of 0.8006 to 0.7105 from 0.7660 at 0.6760. Strong support is expected from 0.6756/60 cluster to contain downside to complete the correction. Meanwhile, firm break of 0.7660 resistance will confirm that such corrective pattern has completed, and larger up trend is ready to resume.

USD/JPY Daily Outlook
Daily Pivots: (S1) 132.00; (P) 132.50; (R1) 133.13; More...
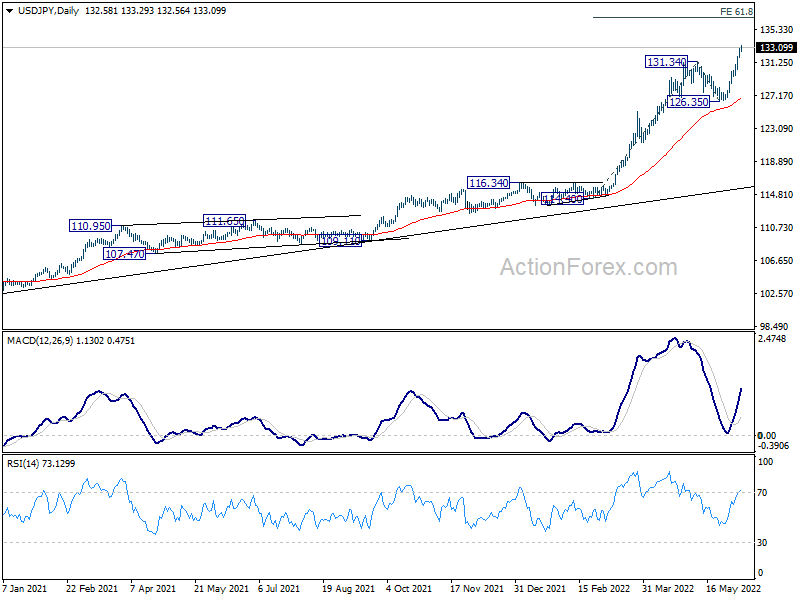
Intraday bias in USD/JPY remains on the upside and current up trend is in progress for 61.8% projection of 114.40 to 131.34 from 126.35 at 136.81 next. On the downside, below 130.97 minor support will turn intraday bias neutral to bring consolidations first, before staging another rally.
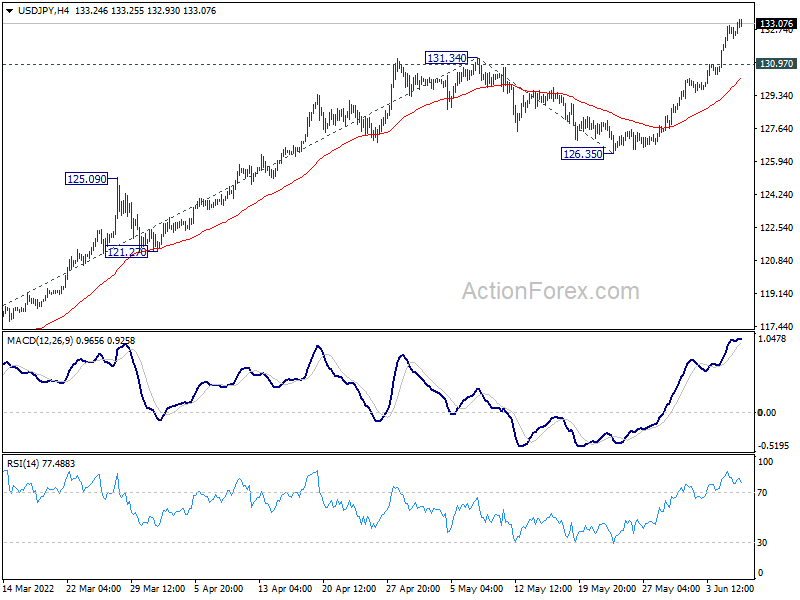
In the bigger picture, current rally is seen as part of the long term up trend form 75.56 (2011 low). Next target is 100% projection of 75.56 (2011 low) to 125.85 (2015 high) from 98.97 at 149.26, which is close to 147.68 (1998 high). This will remain the favored case as long as 126.35 support holds.
USD/CHF Daily Outlook
Daily Pivots: (S1) 0.9637; (P) 0.9675; (R1) 0.9745; More...
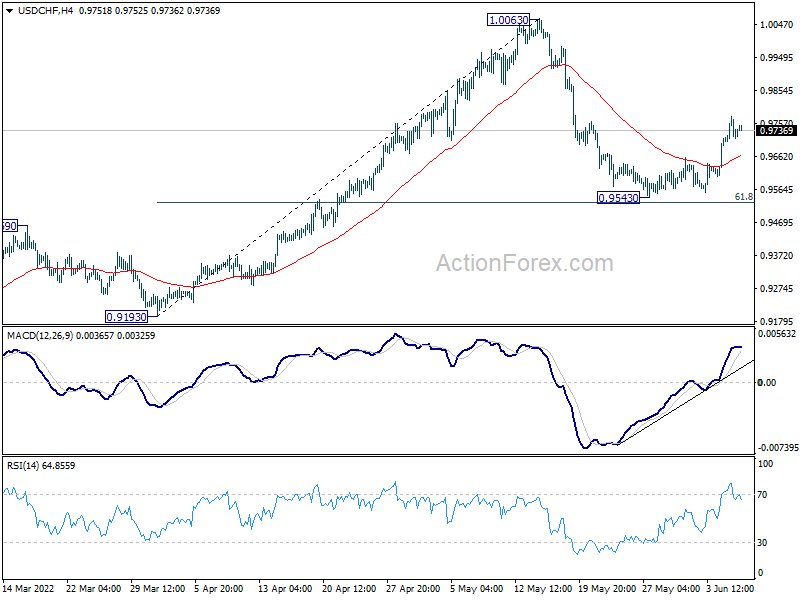
USD/CHF's pull back from 1.0063 should have completed at 0.9543. Intraday bias stays mildly on the upside for further rally to retest 1.0064 high. Firm break there will resume larger up trend. In case of another fall, strong support is still expected from 61.8% retracement of 0.9193 to 1.0063 at 0.9525 to bring rebound.
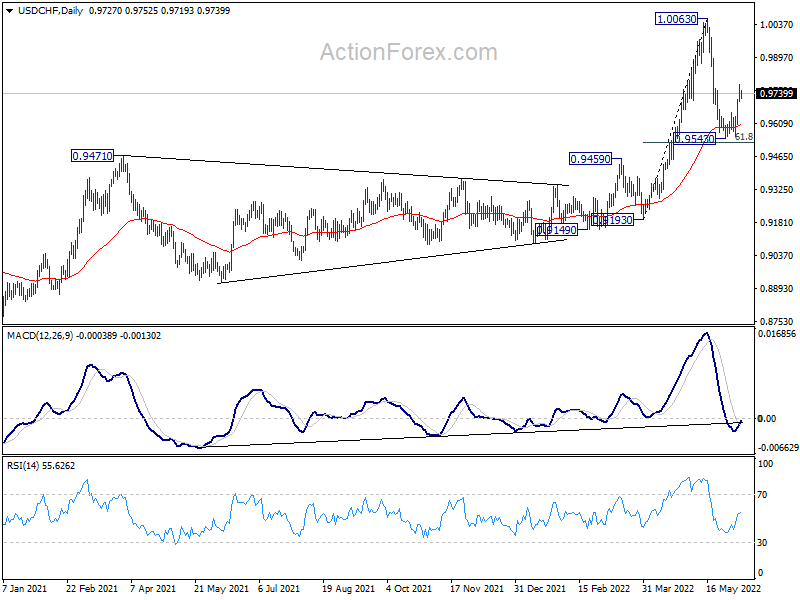
In the bigger picture, down trend from 1.0342 (2016 high) should have completed with three waves down to 0.8756 (2021 low) already. Rise from 0.8756 is likely a medium term up trend of its own. Next target is 1.0237/0342 resistance zone. This will remain the favored case as long as 0.9471 resistance turned support holds. However, sustained break of 0.9471 will extend long term range trading with another falling leg.
GBP/USD Daily Outlook
Daily Pivots: (S1) 1.2483; (P) 1.2541; (R1) 1.2652; More...
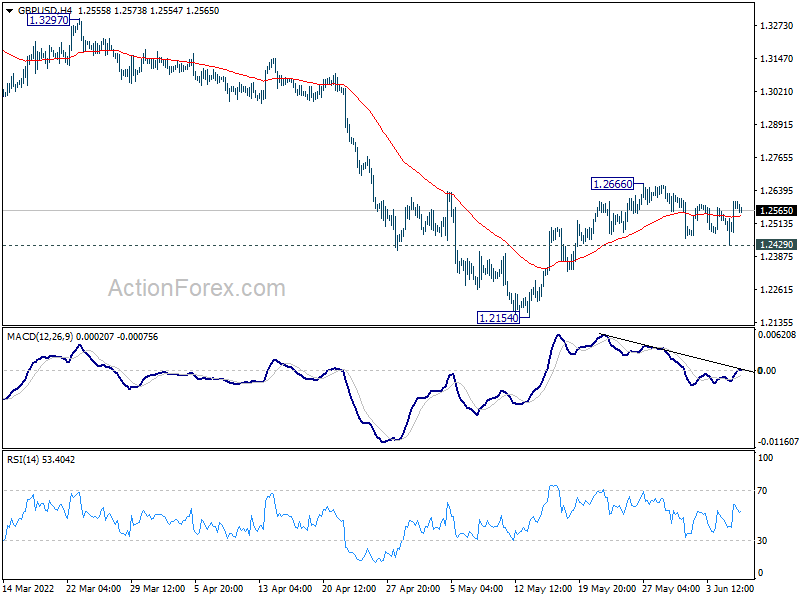
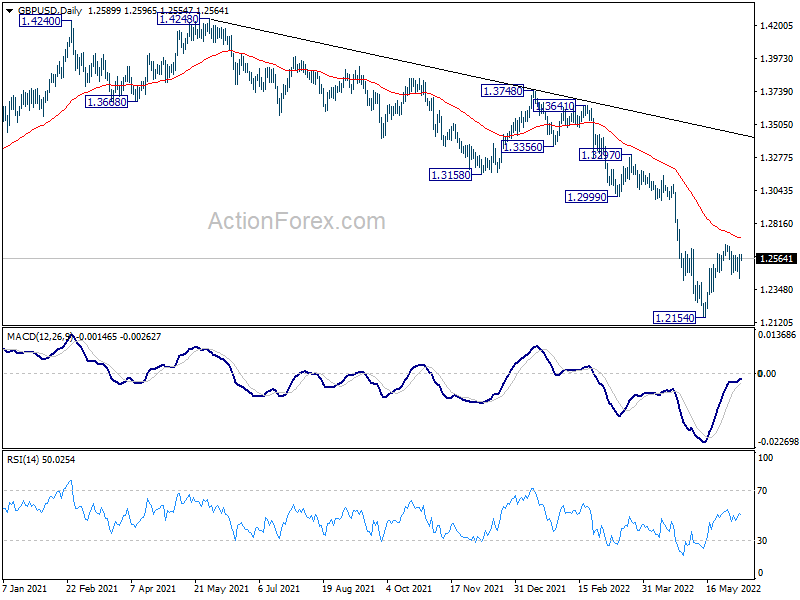
GBP/USD is staying in range trading and intraday bias remains neutral first. On the downside, break of 1.2429 support suggest that rebound from 1.2154 has completed. Intraday bias will be back on the downside for resting this low. On the upside, above 1.2666 will target 55 day EMA (now at 1.2706) and above.
In the bigger picture, fall from 1.4248 (2018 high) could be a leg inside the pattern from 1.1409 (2020 low), or resuming the longer term down trend. Deeper decline is expected as long as 1.2999 support turned resistance holds. On resumption, next target is 1.1409 low.
EUR/USD Daily Outlook
Daily Pivots: (S1) 1.0665; (P) 1.0689 (R1) 1.0727; More...
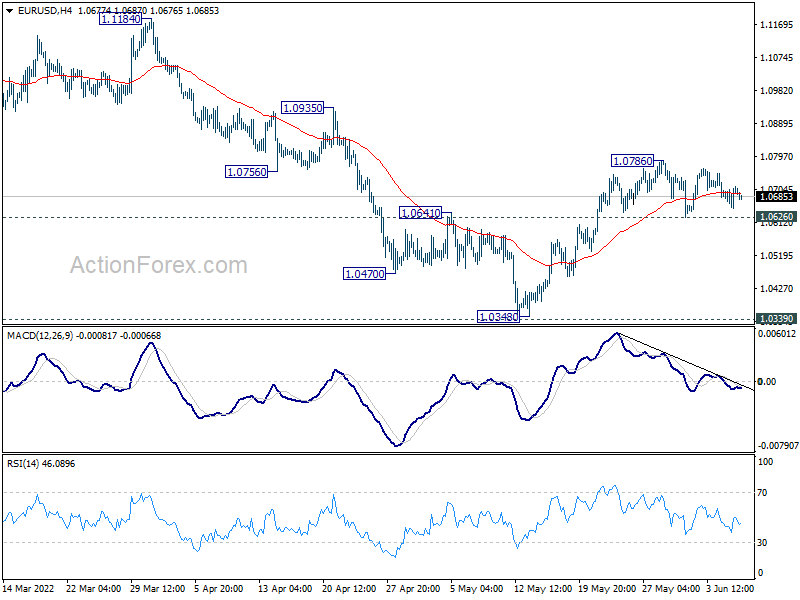
Range trading continues in EUR/USD and intraday bias remains neutral. On the downside, break of 1.0626 minor support will indicate rejection by 55 day EMA, and turn bias back to the downside for retesting 1.0348. On the upside, break of 1.0786, and sustained trading above 55 day EMA (now at 1.0757) will target 1.0935 resistance next.
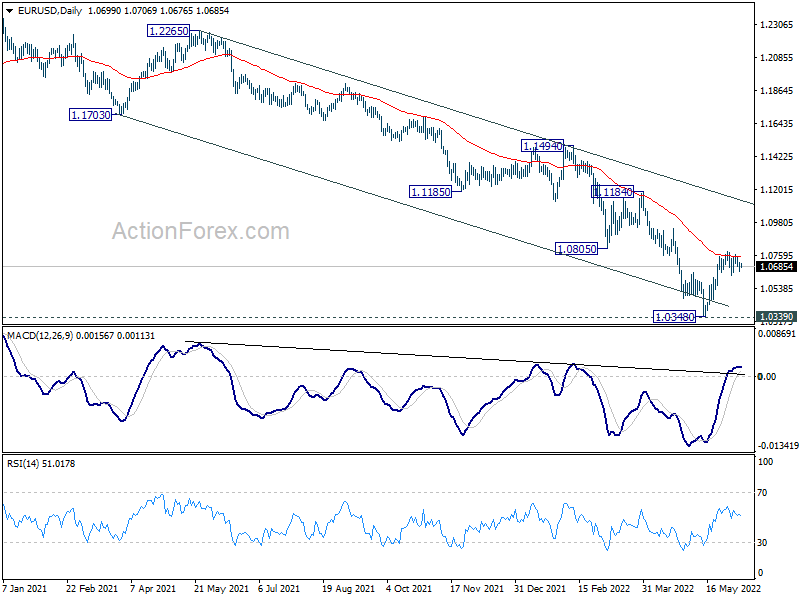
In the bigger picture, focus stays on 1.0339 long term support (2017 low). Decisive break there will resume whole down trend from 1.6039 (2008 high). Next target is 61.8% projection of 1.3993 to 1.0339 from 1.2348 at 1.0090. However, firm break of 1.0805 support turned resistance will delay this bearish case and bring medium term corrective rebound first.
Dollar and Euro Mixed, Yen and Swiss Franc Staying Pressured
Weakness in Yen and Swiss Franc are both staying under selling pressure today, and there is not clear sign of bottoming yet. Sterling is currently the stronger one for the week but there is no clear breakthrough. Aussie and Loonie are digesting some gains but remain firm. Meanwhile, Dollar is mixed for now, together with Euro. Both Dollar and Euro might need to wait until ECB rate decision and US CPI to find a clear direction.
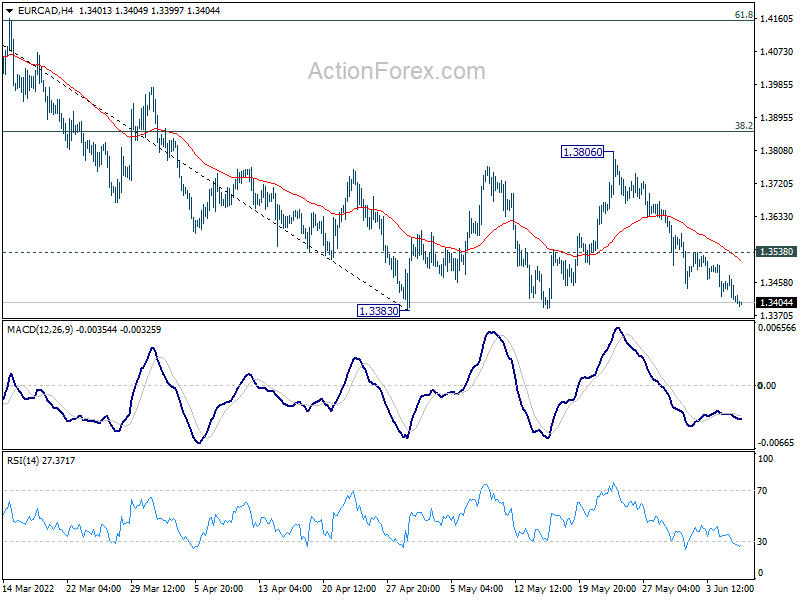
Technically, some attention will be paid to EUR/CAD for the rest of the week. It's fall close to 1.3383 support as fall from 1.3806 extends. Firm break there will resume medium term down trend to 1.3019 support (2015 low), which is close to 1.3 handle. However, break of 1.3538 minor resistance will ease immediate selling pressing and extend the sideway pattern from 1.3383 with another rising leg. The next move in EUR/CAD could provide a hint on that of EUR/USD.
In Asia, at the time of writing, Nikkei is up 0.91%. Hong Kong HSI is up 1.70%. China Shanghai SSE is down -0.70%. Singapore Strait Times is down -0.18%. Japan 10-year JGB yield is down -0.0041 at 0.246. Overnight, DOW rose 0.80%. S&P 500 rose 0.95%. NASDAQ rose 0.94%. 10-year yield dropped -0.066 to 2.972, back below 3%.
Japan Q1 GDP finalized at -0.1% qoq, -0.5% annualized
Japan's GDP was finalized at -0.1% qoq in Q1, better than earlier estimate of -0.3% qoq. In annualized term. GDP contracted -0.5%.
Private consumption, which accounts for more than half of the GDP, was revised up to 0.06% qoq rise, from -0.03% decline. Capital expenditure dropped -0.7%, down graded from -0.5%. Exports grow was unchanged at 1.1% while imports rose 3.3%, downgraded from 3.4%.
GDP deflator was finalized at -0.5% yoy, revised form -0.4% yoy.
CHF/JPY resumes up trend, targeting 140 next
While Swiss Franc and Yen are both the biggest losers for the month so far, Yen is worse by a mile. BoJ is clear that it's going to maintain the current ultra-loose monetary easing. On the other hand, SNB is sounding more and more open to adjustments on its monetary policy to counter inflation. In particular, if ECB is going to exit negative interest rates later in the year, there is prospect of SNB following, at least with a rate hike.
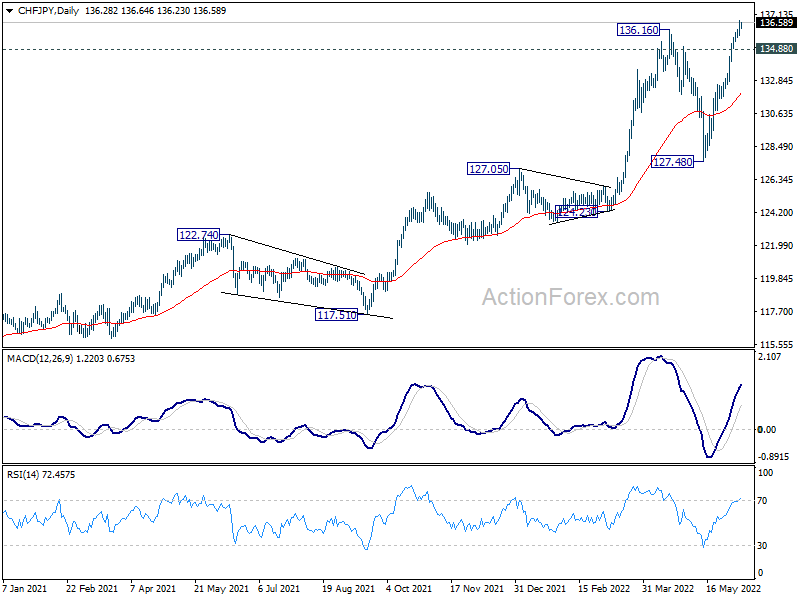
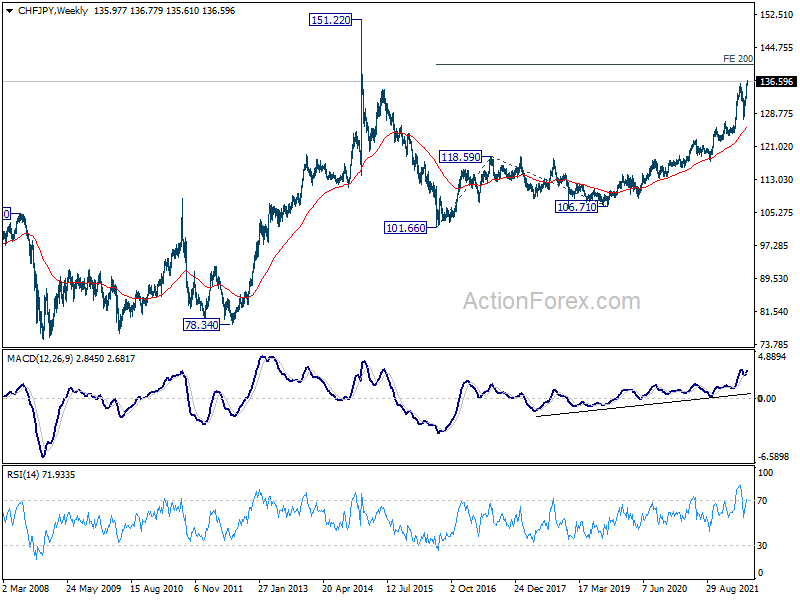
Technically, the break of 136.16 high confirms resumption of larger up trend from 101.66 (2016 low). That came after the deep pull back was support slightly above 127.05 resistance turned support. For now, near term outlook will stay bullish as long as 134.88 support holds. Next medium term target will be 200% projection of 101.66 to 118.59 from 106.71 at 140.57.
Looking ahead
Swiss unemployment rate, Germany industrial production, France trade balance, UK PMI construction and Eurozone GDP revision will be release in European session. US will release wholesale inventories final later in the day.
EUR/USD Daily Outlook
Daily Pivots: (S1) 1.0665; (P) 1.0689 (R1) 1.0727; More...
Range trading continues in EUR/USD and intraday bias remains neutral. On the downside, break of 1.0626 minor support will indicate rejection by 55 day EMA, and turn bias back to the downside for retesting 1.0348. On the upside, break of 1.0786, and sustained trading above 55 day EMA (now at 1.0757) will target 1.0935 resistance next.
In the bigger picture, focus stays on 1.0339 long term support (2017 low). Decisive break there will resume whole down trend from 1.6039 (2008 high). Next target is 61.8% projection of 1.3993 to 1.0339 from 1.2348 at 1.0090. However, firm break of 1.0805 support turned resistance will delay this bearish case and bring medium term corrective rebound first.
Economic Indicators Update
| GMT | Ccy | Events | Actual | Forecast | Previous | Revised |
|---|---|---|---|---|---|---|
| 23:50 | JPY | Bank Lending Y/Y May | 0.70% | 0.80% | 0.90% | |
| 23:50 | JPY | GDP Q/Q Q1 F | -0.10% | -0.30% | -0.20% | |
| 23:50 | JPY | GDP Deflator Y/Y Q1 F | -0.50% | -0.40% | -0.40% | |
| 05:45 | CHF | Unemployment Rate May | 2.20% | 2.20% | ||
| 06:00 | EUR | Germany Industrial Production M/M Apr | 1.00% | -3.90% | ||
| 06:45 | EUR | France Trade Balance (EUR) Apr | -11.1B | -12.4B | ||
| 08:00 | EUR | Italy Retail Sales M/M Apr | 0.30% | -0.50% | ||
| 08:30 | GBP | Construction PMI May | 56.9 | 58.2 | ||
| 09:00 | EUR | Eurozone GDP Q/Q Q1 | 0.30% | 0.30% | ||
| 09:00 | EUR | Eurozone Employment Change Q/Q Q1 F | 0.50% | 0.50% | ||
| 14:00 | USD | Wholesale Inventories Apr F | 2.10% | 2.10% | ||
| 14:30 | USD | Crude Oil Inventories | -2.6M | -5.1M |
CHF/JPY resumes up trend, targeting 140 next
While Swiss Franc and Yen are both the biggest losers for the month so far, Yen is worse by a mile. BoJ is clear that it's going to maintain the current ultra-loose monetary easing. On the other hand, SNB is sounding more and more open to adjustments on its monetary policy to counter inflation. In particular, if ECB is going to exit negative interest rates later in the year, there is prospect of SNB following, at least with a rate hike.
Technically, the break of 136.16 high confirms resumption of larger up trend from 101.66 (2016 low). That came after the deep pull back was support slightly above 127.05 resistance turned support. For now, near term outlook will stay bullish as long as 134.88 support holds. Next medium term target will be 200% projection of 101.66 to 118.59 from 106.71 at 140.57.
Japan Q1 GDP finalized at -0.1% qoq, -0.5% annualized
Japan's GDP was finalized at -0.1% qoq in Q1, better than earlier estimate of -0.3% qoq. In annualized term. GDP contracted -0.5%.
Private consumption, which accounts for more than half of the GDP, was revised up to 0.06% qoq rise, from -0.03% decline. Capital expenditure dropped -0.7%, down graded from -0.5%. Exports grow was unchanged at 1.1% while imports rose 3.3%, downgraded from 3.4%.
GDP deflator was finalized at -0.5% yoy, revised form -0.4% yoy.
Technical Outlook and Review
DXY:
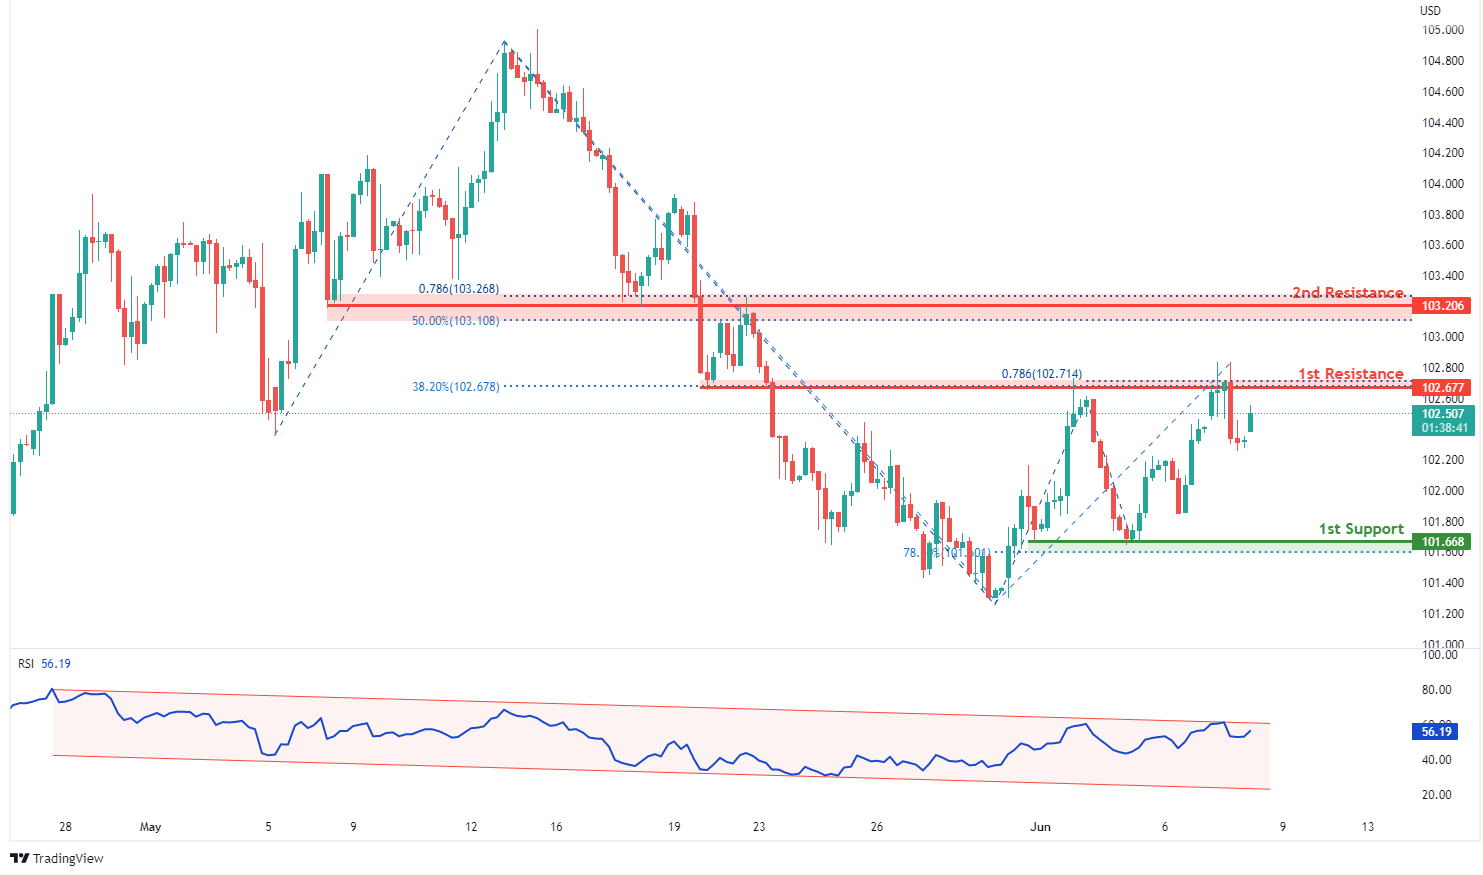
On the H4, with RSI moving in a descending channel, we have a bearish bias that price will drop to our 1st support at 101.668 where the horizontal swing low support and 78.6% fibonacci retracement are from our 1st resistance at 102.677 in line with the horizontal overlap resistance, 38.2% fibonacci retracement and 78.6% fibonacci projection. Alternatively, price may break 1st resistance structure and head for 2nd resistance at 103.206 where the horizontal overlap resistance, 78.6% fibonacci projection and 50% fibonacci retracement are.
Areas of consideration:
- H4 time frame, 1st resistance at 102.677
- H4 time frame, 1st support at 101.668
XAU/USD (GOLD):
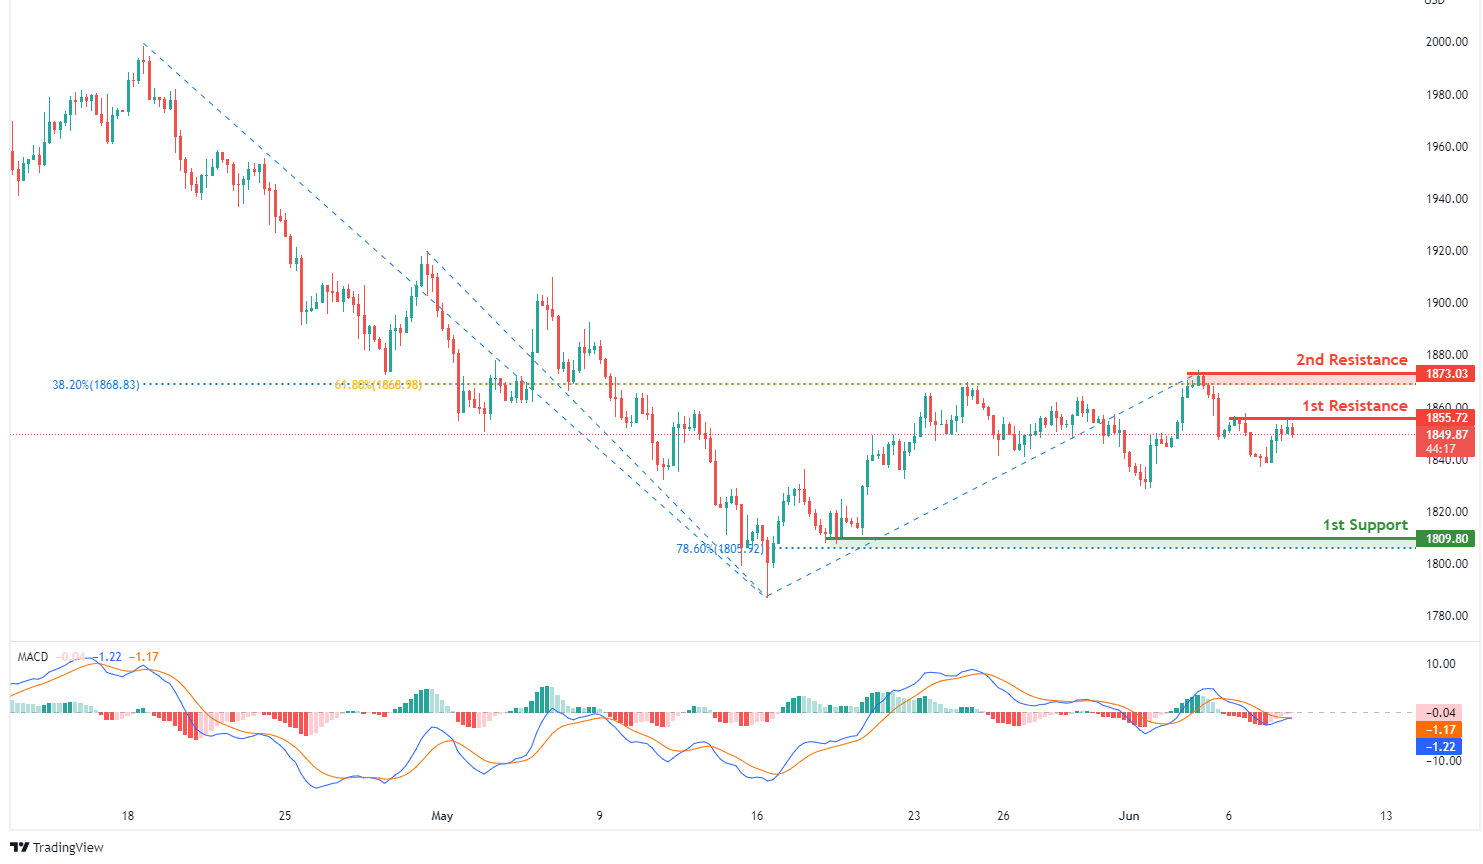
On the H4, with MACD moving in a bearish momentum, we have a bearish bias that price will drop from our 1st resistance at 1855.72 where the horizontal swing high resistance is to our 1st support at 1809.80 where the horizontal swing low support and 78.6% fibonacci retracement are. Alternatively, price may break 1st resistance structure and head for 2nd resistance at 1873.03 in line with swing high resistance, 61.8% fibonacci retracement and 38.2% fibonacci retracement.
Areas of consideration:
- H4 time frame, 1st Resistance at 1855.72
- H4 time frame, 1st Support at 1809.80
GBP/USD:
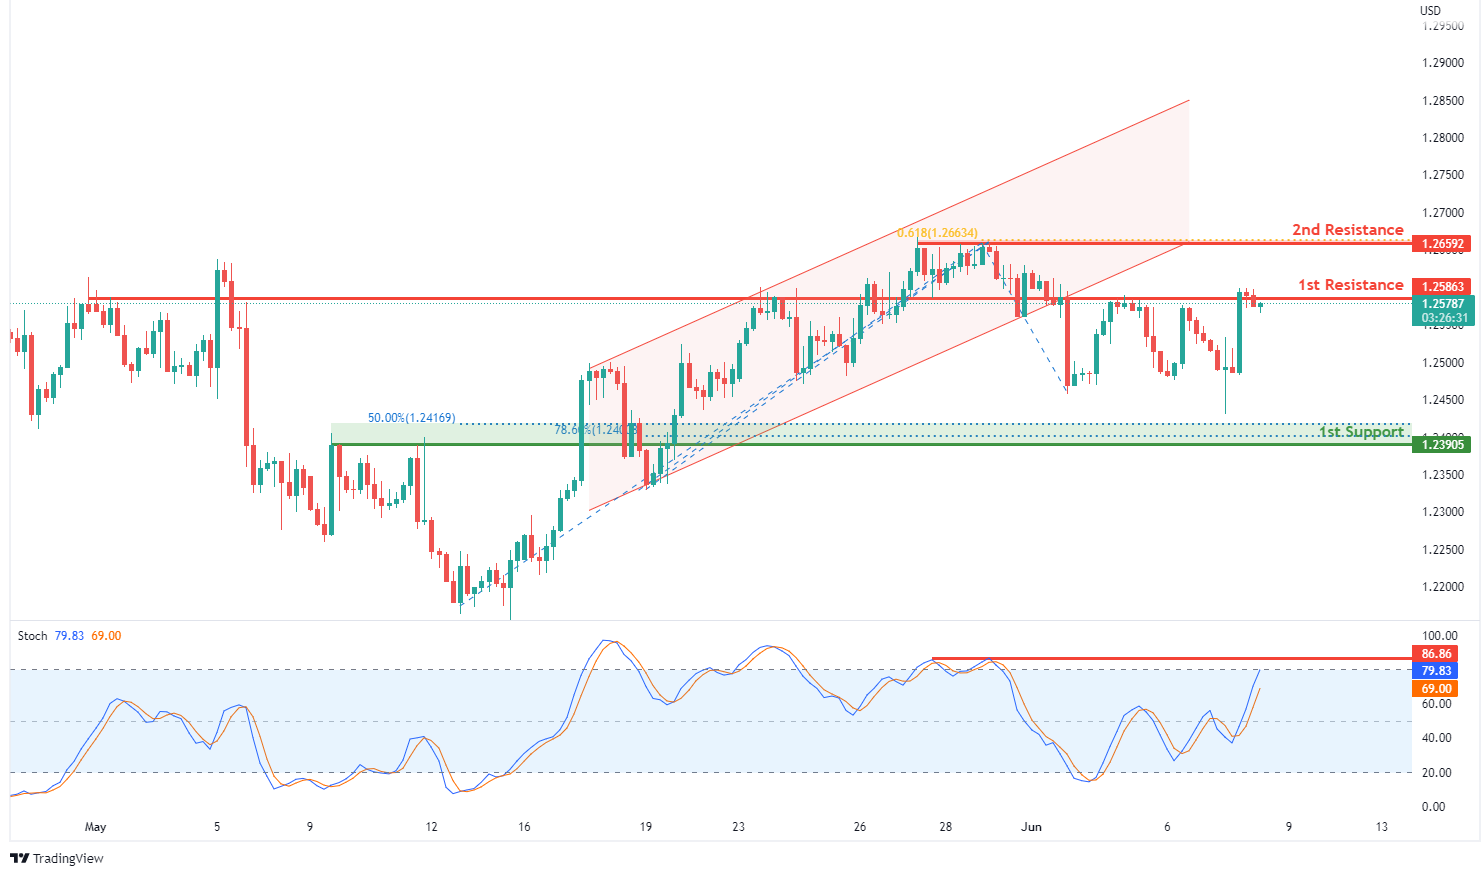
On the H4, with stochastic indicator approaching the resistance level, we have a bearish bias that price will drop from our 1st resistance at 1.25863 where the horizontal overlap resistance is to our 1st support at 1.23905 in line with the 50% Fibonacci retracement, 78.6% fibonacci retracement and overlap support. Alternatively, price may break 1st resistance structure and head for 2nd resistance at 1.26592 where the horizontal swing high resistance and 61.8% fibonacci projection are.
Areas of consideration:
- H4 1st resistance at 1.25863
- H4 1st support at 1.23905
USD/CHF:
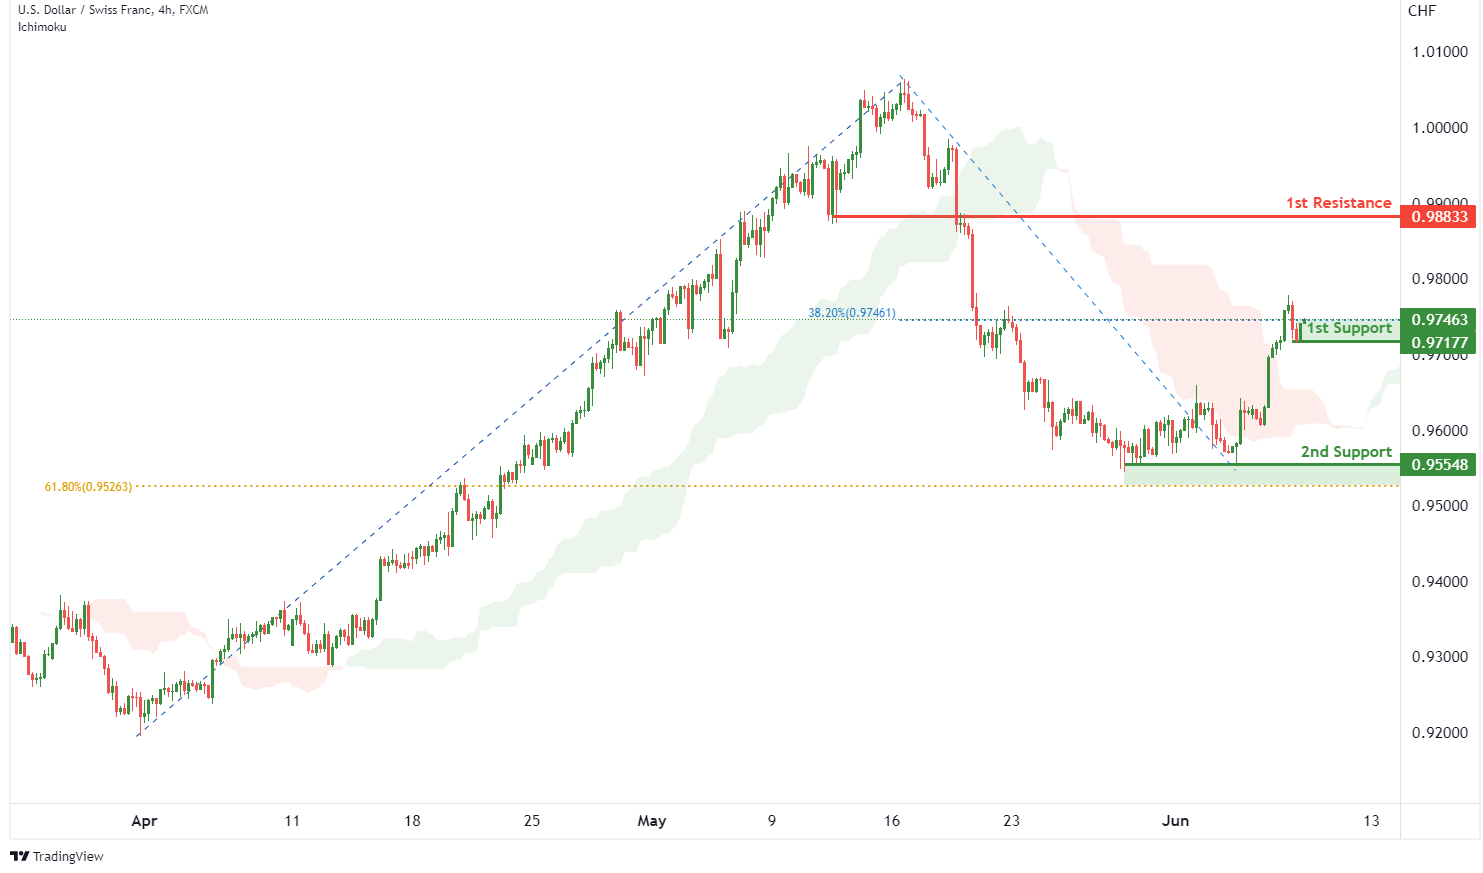
On the H4, with price moving above the ichimoku cloud, we have a bullish bias that price will rise to our 1st resistance at 0.98833 where the pullback resistance is from our 1st support at 0.97177 in line with the swing low support and 38.2% Fibonacci retracement. Alternatively, price may break 1st support structure and head for 2nd support at 0.95548 where the swing low support and 61.8% fibonacci retracement are..
Areas of consideration
- 1st support level at 0.97177
- 1st resistance level at 0.98833
EUR/USD :
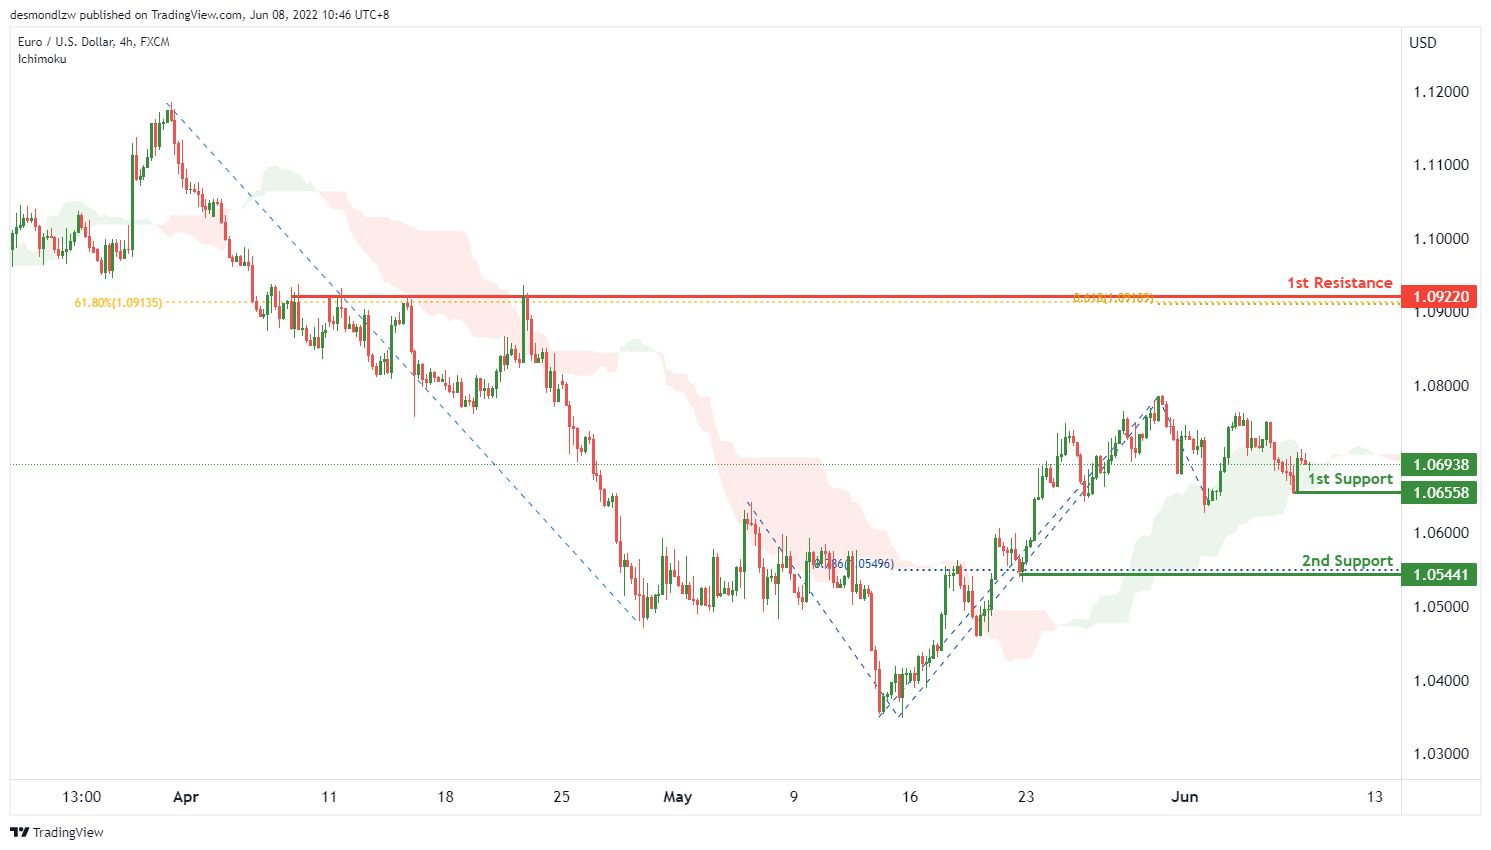
On the H4, with price bouncing off the ichimoku cloud, we have a bullish bias that price will rise from the 1st support at 1.06558 in line with the to the pullback support to the 1st resistance at 1.09220 in line with the 61.8% fibonacci retracement and 61.8% fibonacci projection. Alternatively, price may break support structure at the 1st support and drop to the 2nd support at 1.05441 at the swing low in line with the 78.6% fibonacci retracement.
Areas of consideration :
- H4 1st resistance at 1.09220
- H4 1st support at 1.06558
USD/JPY:
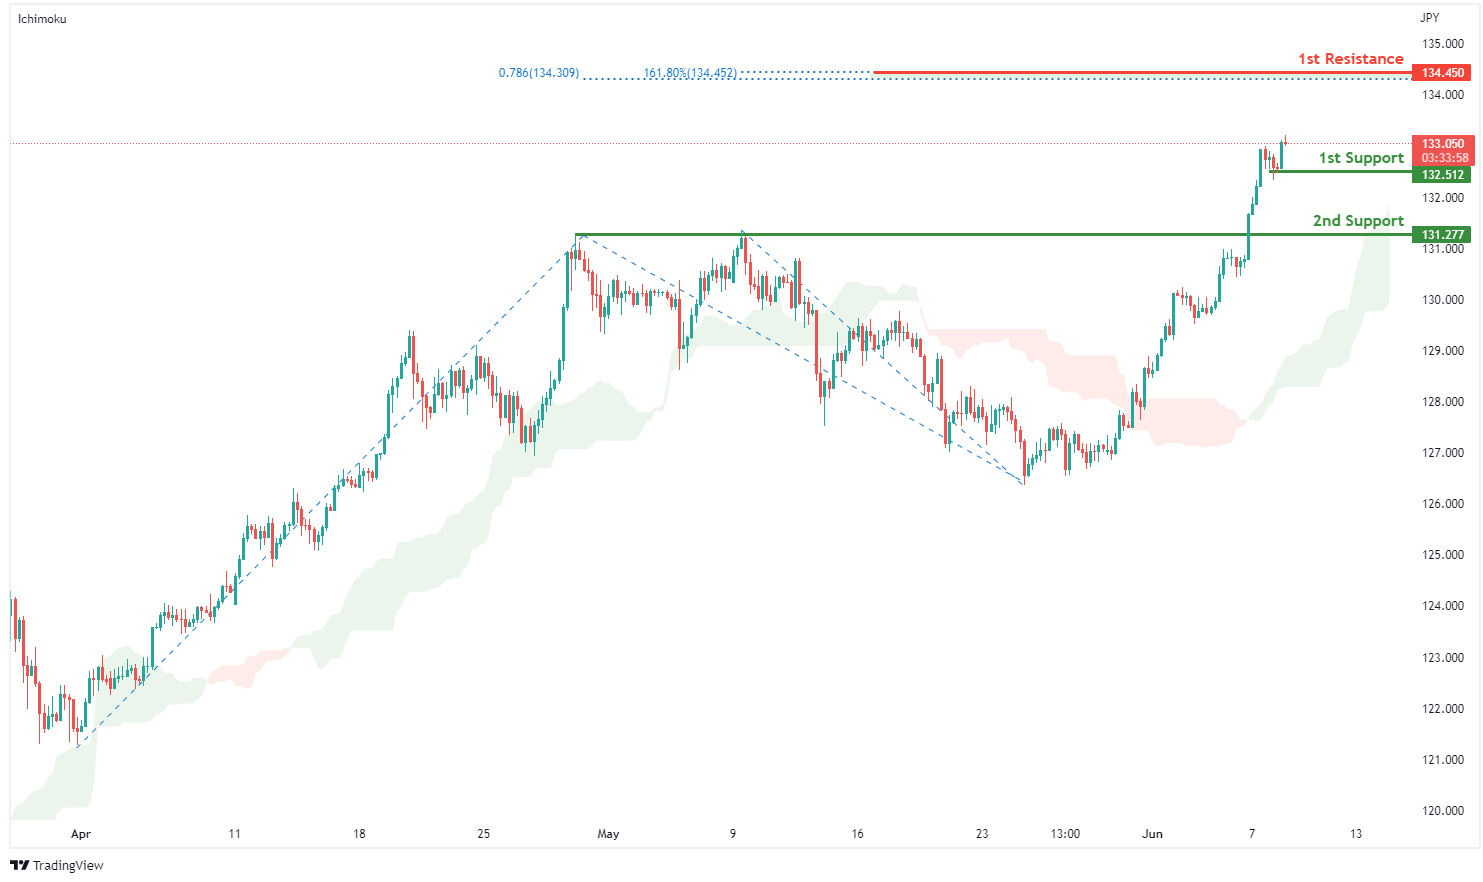
On the H4, with prices moving above the ichimoku indicator, we have a bullish bias that price will rise from our 1st support at 132.512 where the horizontal swing low support is to our 1st resistance at 134.450 in line with the 161.8% fibonacci extension and 78.6% fibonacci projection. Alternatively, price may break 1st support structure and head for 2nd support at 131.277 where the horizontal overlap support is.
Areas of consideration:
- H4 time frame, 1st resistance at 134.450
- H4 time frame, 1st support at 132.512
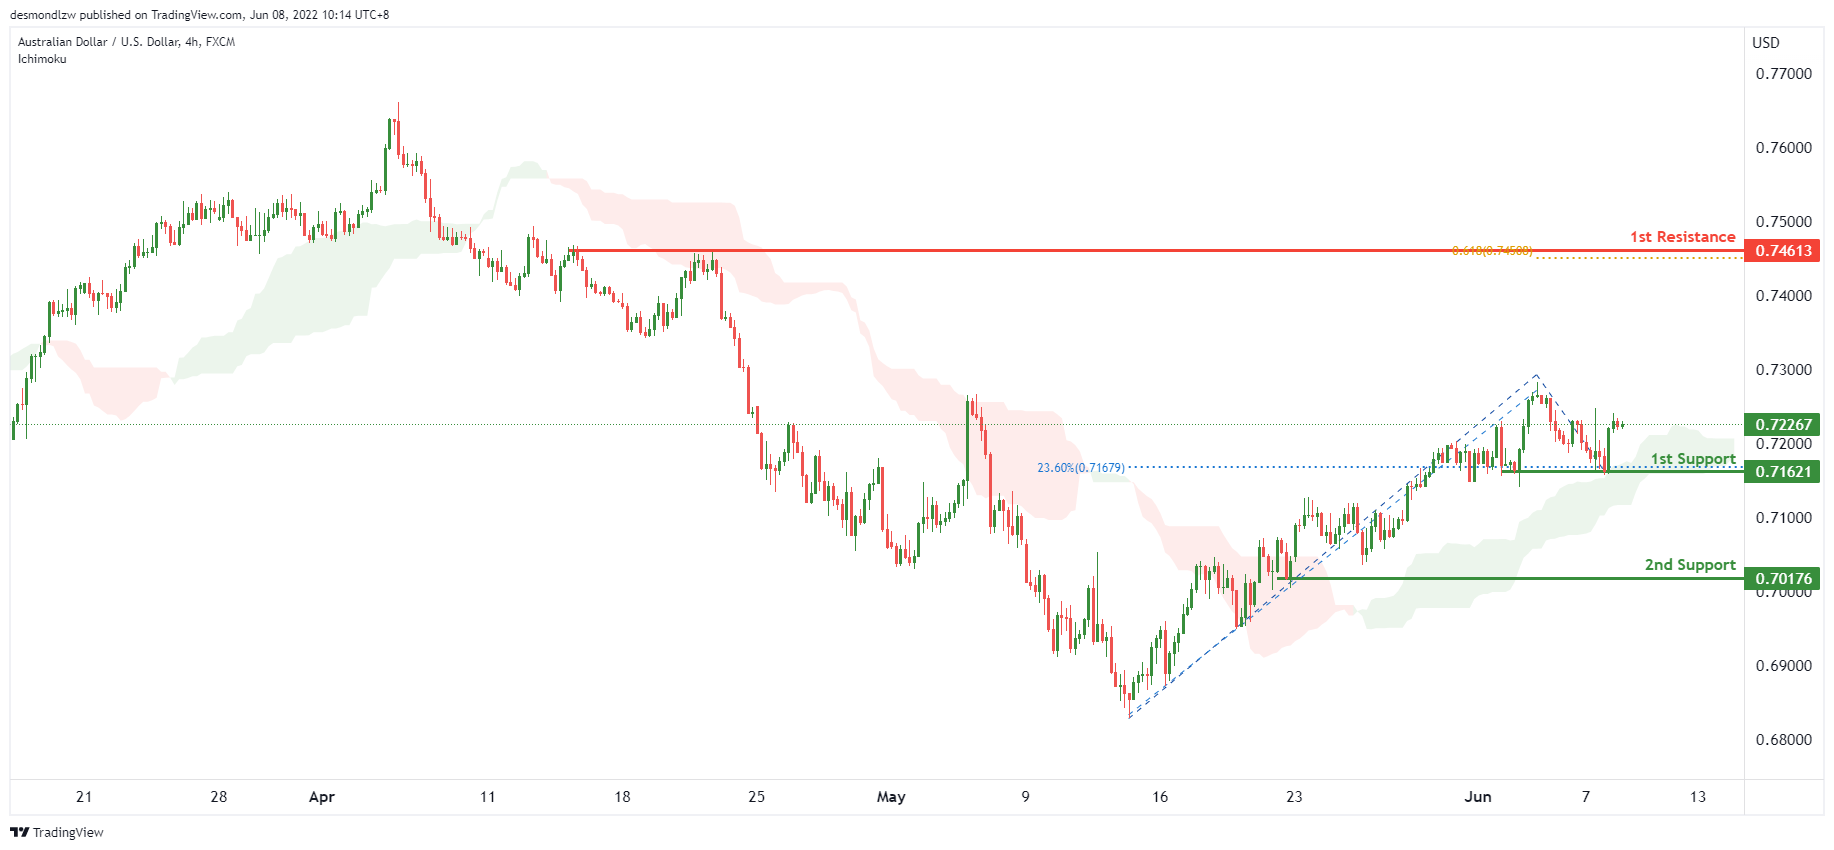
AUD/USD:
On the H4, with price moving above the ichimoku cloud, we have a bullish bias that price will rise from the 1st support at 0.71621 in line with the 23.6% fibonacci retracement and overlap support to the 1st resistance at 0.74613 in line with the swing high and 61.8% fibonacci projection. Alternatively, price may break the support structure at 1st support and drop to the 2nd support at 0.70176 at the swing low.
Areas of consideration
- H4 1st resistance at 0.74613
- H4 1st support at 0.71621
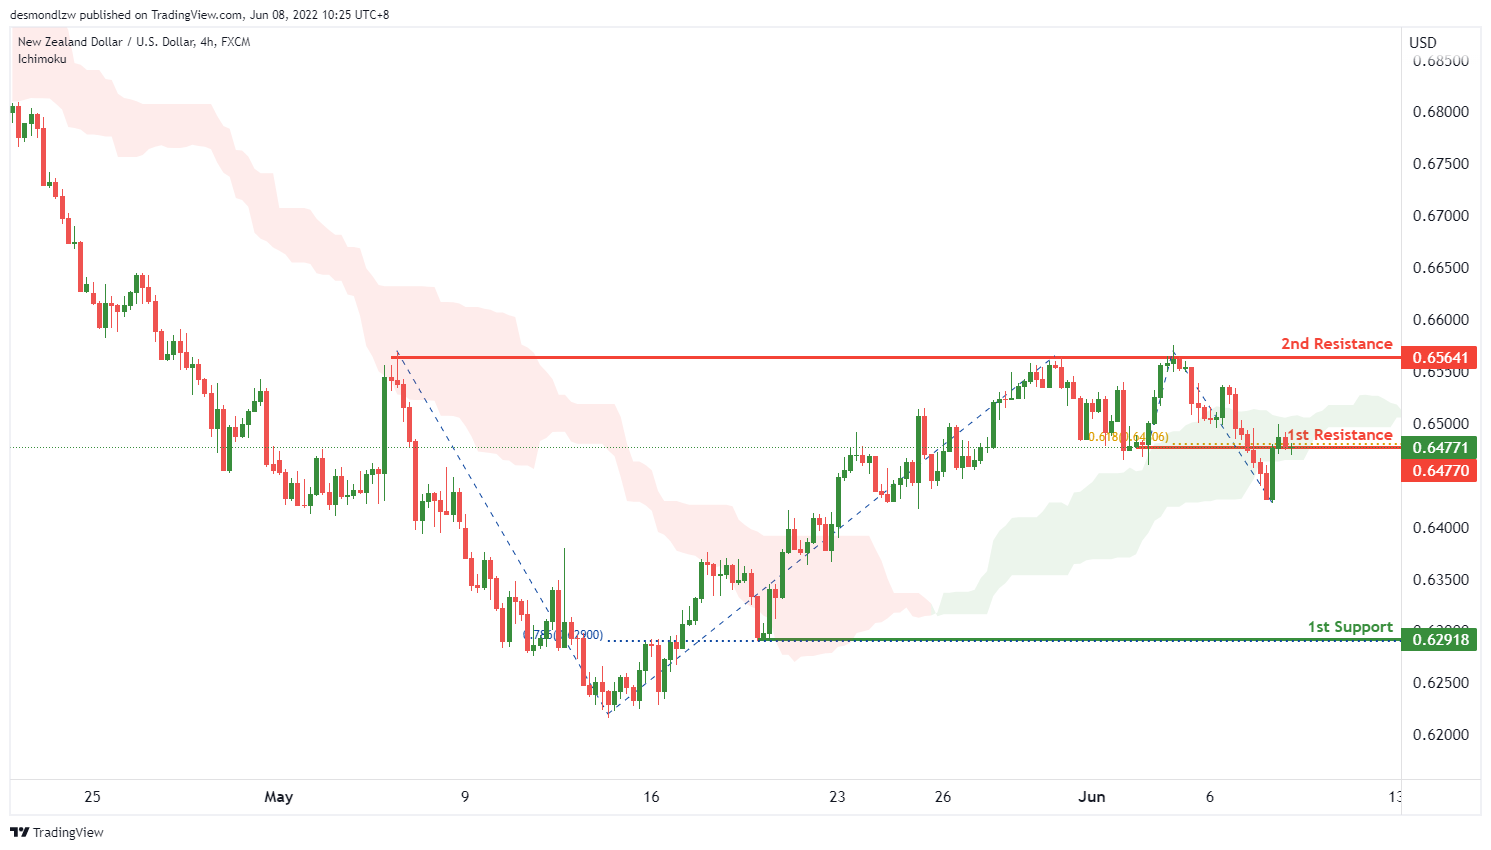
NZD/USD:
On the H4, with price moving below the ichimoku cloud, we have a bearish bias that price will drop from the 1st resistance at 0.64770 in line with the 61.8% fibonacci projection to the 1st support at 0.62918 in line with the 78.6% fibonacci retracement. Alternatively, price may bounce off the 1st resistance and rise to the 2nd resistance at 0.65641 in line with the overlap swing high.
Areas of consideration:
- H4 time frame, 1st support at 0.62918
- H4 time frame, 1st resistance at 0.64770
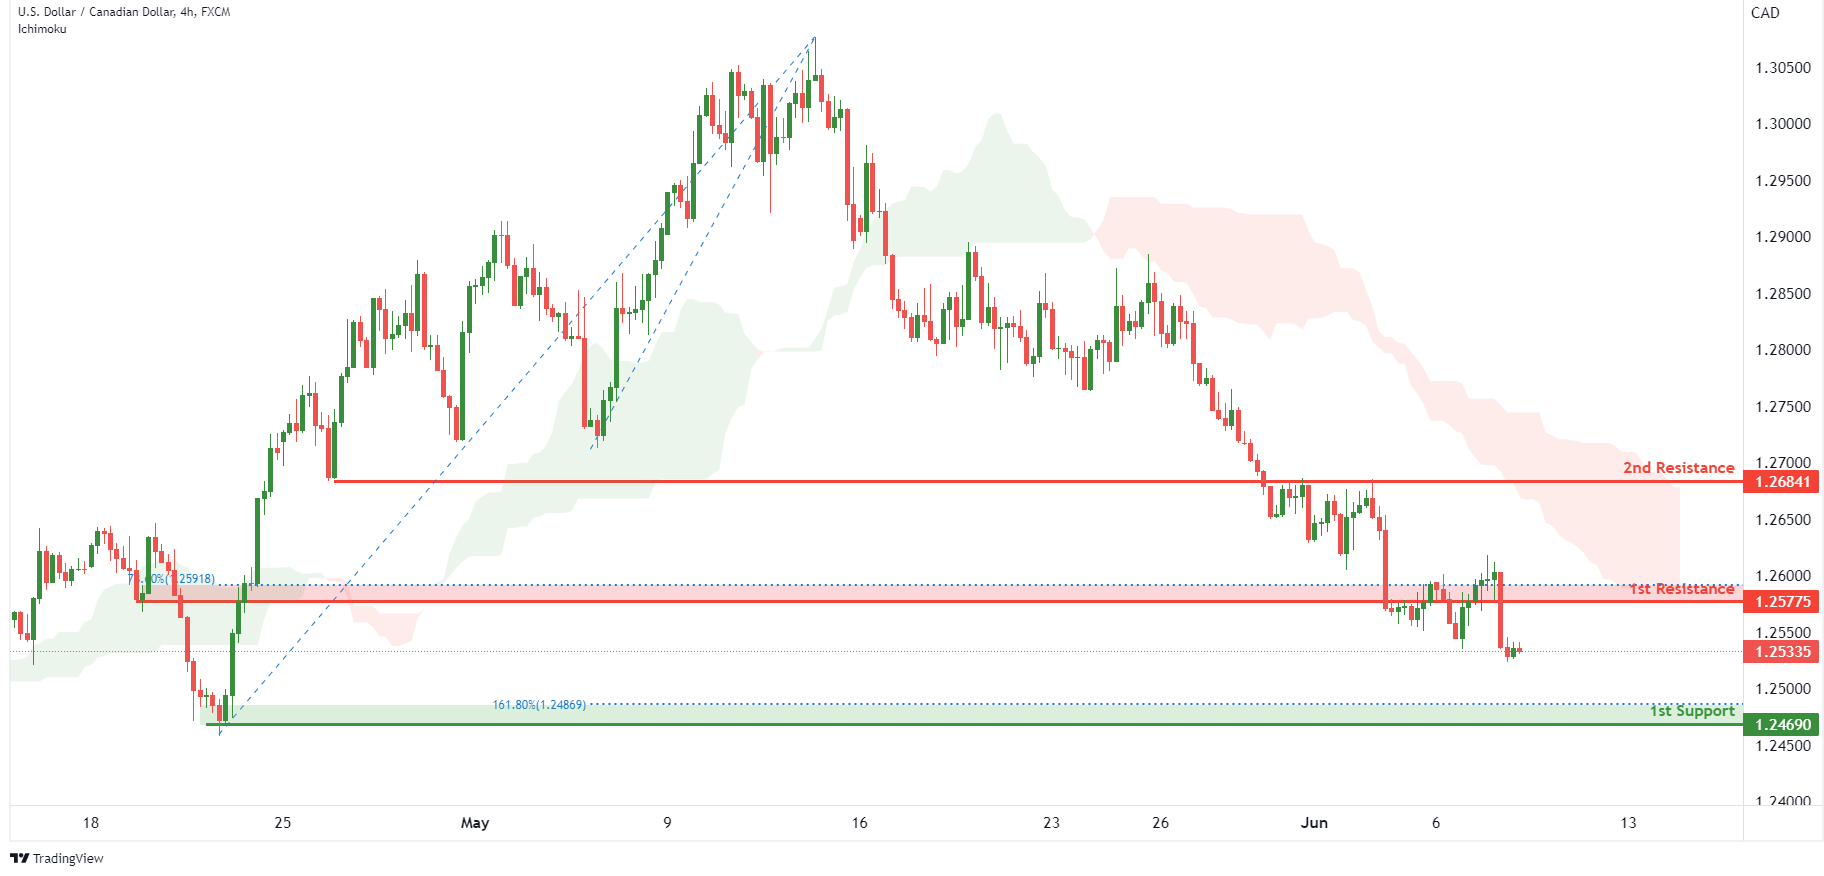
USD/CAD:
On the H4, with price moving below our ichimoku cloud and the recent break of our horizontal support level which is in line with the 28.6% fibonacci retracement level, we have a bearish bias that price will drop to our 1st support at 1.24690 in line with the horizontal swing low support and the 161.8% Fibonacci extension from our 1st resistance at 1.25775. Alternatively, price may break structure and head for our 2nd resistance at 1.26841.
Areas of consideration:
- H4 time frame, 1st resistance at 1.25775
- H4 time frame, 1st support at 1.24690
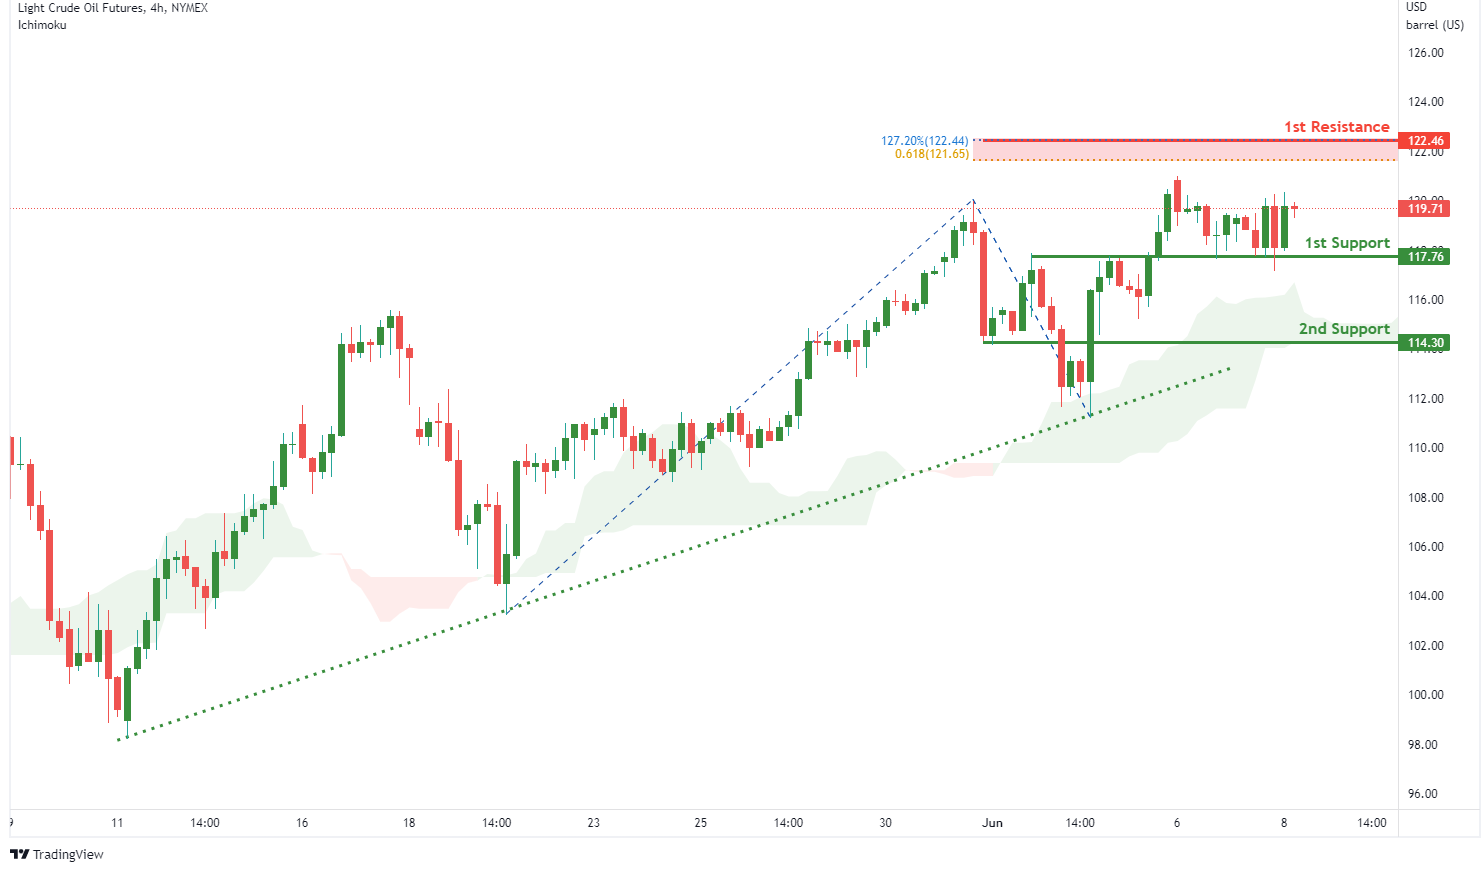
OIL:
On the H4, with price moving above the ichimoku cloud, we have a bullish bias that price will rise from our 1st support at 117.76 where the horizontal pullback support is to our 1st resistance at 122.46 in line with the 61.8% fibonacci projection and 127.2% Fibonacci extension. Alternatively, price may break structure and head for 2nd support at 114.30.
Areas of consideration:
- H4 time frame, 1st resistance of 122.46
- H4 time frame, 1st support of 117.76
Dow Jones Industrial Average:
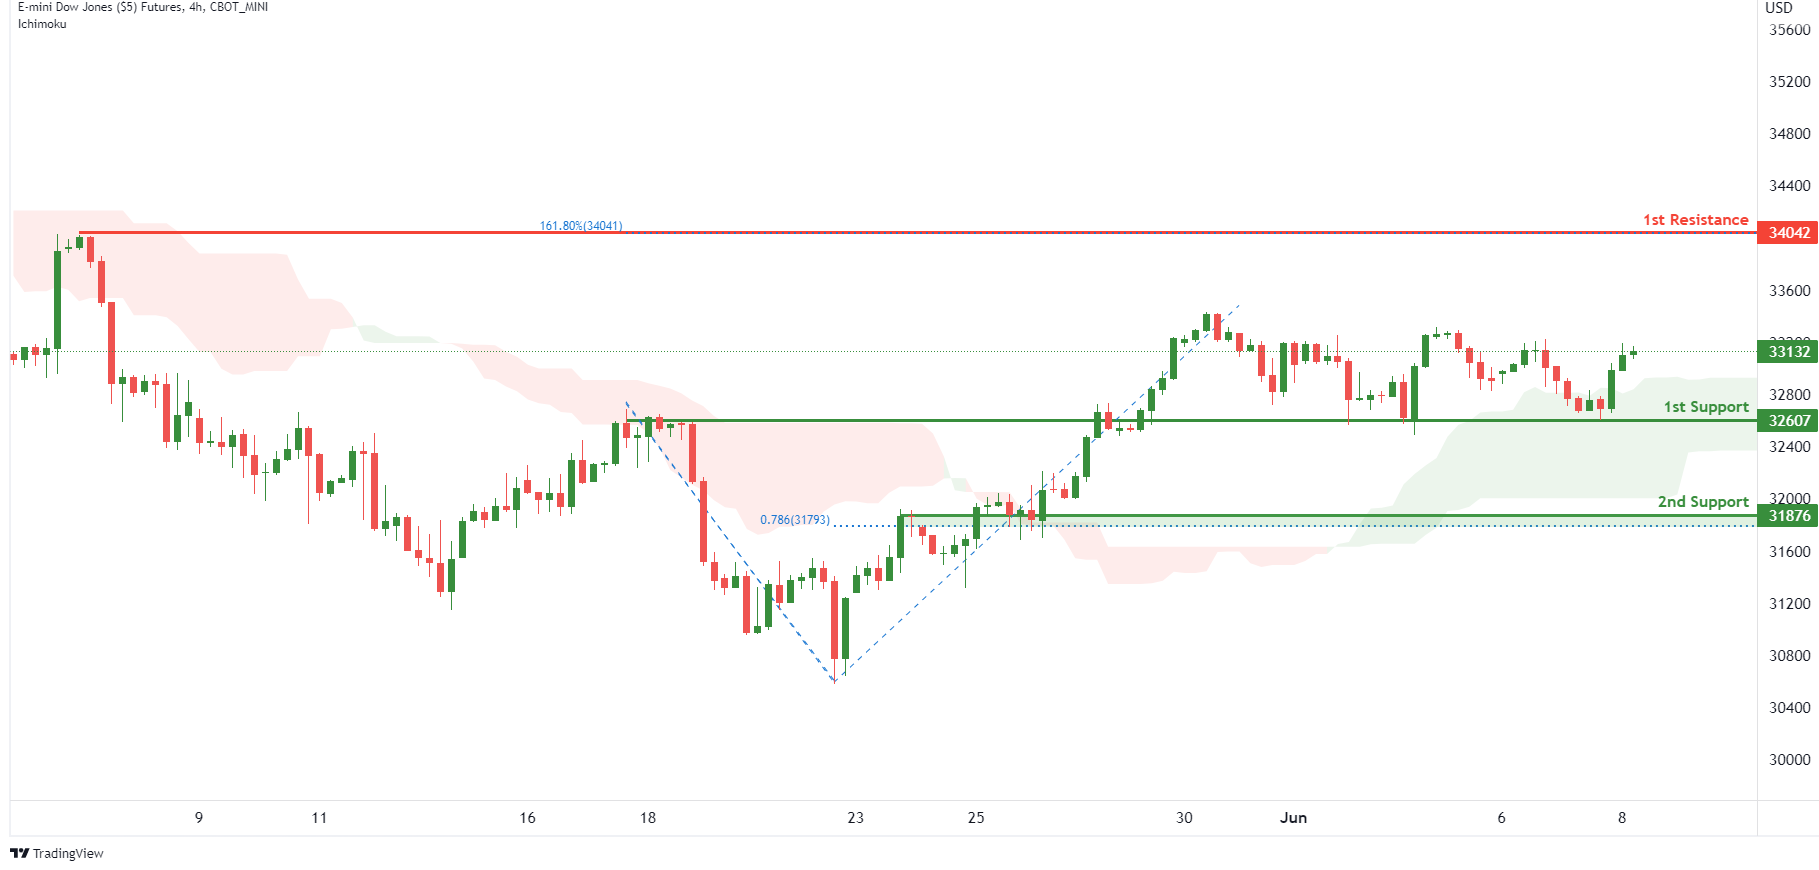
On the H4, with price moving above the ichimoku cloud, we have a bullish bias that price will rise from our 1st support at 32607 where the horizontal pullback support is to our 1st resistance at 34042 in line with the swing high resistance and 161.8% Fibonacci extension. Alternatively, price may break structure and head for 2nd support at 31876 where the pullback support and 78.6% fibonacci retracement are.
Areas of consideration :
- H4 time frame, 1st resistance at 34042
- H4 time frame, 1st support at 32607