Sample Category Title
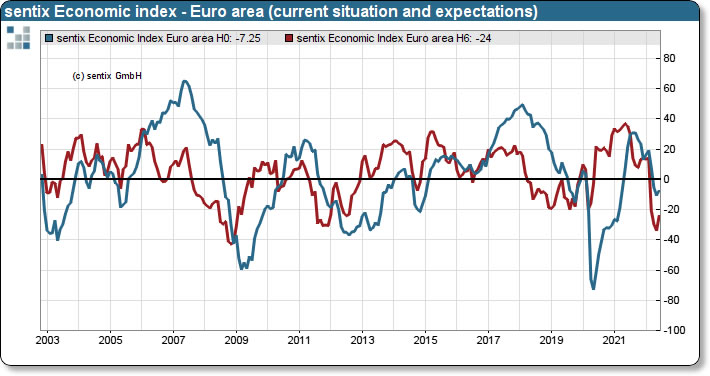
Eurozone Sentix investor confidence rose to -15.8, real economy is not suffering as quickly and as severely than expected
Eurozone Sentix Investor Confidence rose from -22.6 to -15.8 in June, above expectation of -20.0. Current Situation Index rose from -10.5 to -7.3. Expectations Index rose from -34.0 to -24.0.
Sentix said, "the real economy is not suffering as quickly and as severely from phenomena such as rising inflation and supply chain problems as one might have suspected.
"While consumers are already suffering much more from rising prices, many companies are still benefiting from inflation-related pull-forward effects. So far, many companies have also been able to pass on their sharply rising costs to their customers.
"But this is likely to be a finite phase. At a certain point, end consumers will have to cut back. Then, at the latest, the ability of companies to pass on their costs without restriction will also come to an end. In addition, there is a foresee-able change in monetary policy, which could also become more restrictive in the Eurozone from July.
"On the other hand, it should be positive that according to the sentix topic barometer the inflation peak should have been passed for the time being."
RBA Board Raises the Cash Rate by 50 Basis Points; Another 50 in July
We expect the Board will decide on another 50 basis point increase in July. By front loading the moves it can firmly establish its inflation fighting commitment. The cash rate is then likely to move in 25 basis point increments with a pause as the Board moves above neutral to a peak in February of 235 basis points.
The RBA Board decided to raise the cash rate by 50 basis points at its June Board meeting.
This bold decision came as quite a surprise to many analysts. Even the decidedly bearish market was priced for a more modest move.
In our latest preview on June 3, we noted that “The arguments set out above would also be consistent with a 50 basis point move. However, given that the Board actively considered 40 basis points at the May meeting we think it more likely that the 40 basis point option will be taken.”
The key observation in the Governor’s statement was, “Inflation… is higher than earlier expected. Global factors account for much of the increase. But domestic factors are playing a role too, with capacity constraints in some sectors and the tight labour market contributing to upward pressure on prices.”
This statement clearly signals that the Bank now recognises that it has a significant challenge to contain inflation and today’s decision points to it now being prepared to act decisively.
For that reason, we expect that the next move in July will also be a 50 basis point increase.
That would push the cash rate to 135 basis points. Having eliminated the emergency policy settings of 2020 at today’s meeting the next move would be to take back the 75 basis points of cuts we saw in 2019 when the Bank was frustrated at the consistently low inflation prints. Recall that the cash rate entered 2019 at 1.5%.
A slowdown in the pace of hikes in August can be expected but a response will still be necessary to the likely upside surprise on inflation for the June quarter with a further 25 basis point move required.
With the cash rate having reached 160 basis points by August it will be prudent for the Bank to pause. Our analysis of the leverage in household balance sheets points to a cash rate of around 160 basis points being “in the neighbourhood” of neutral – better to pause at that point to assess the impact on household consumption; house prices; the labour market; consumer and business confidence; and the response of wages growth to these inflation pressures.
We expect further increases of 25 basis points will be required in November and December in response to another disturbing inflation print for the September quarter. 2022 would end with a cash rate of 2.1% - a policy stance that we would assess as in the contractionary zone.
Readers will be aware that we expect that the FOMC will have paused following its December rate move and the RBA is likely to take some guidance from that decision. We expect that the 25 basis point increase from the RBA in February will be the last in this tightening cycle with the terminal rate settling at 2.35%.
That terminal rate is only slightly higher than the 2.25% terminal rate we forecast following the May Board meeting.
Even though the RBA’s forecasts and our own forecasts point to a larger inflation task than expected in May the decision to front end load the hikes (we only expected one hike of 40 basis points in June to be followed by 25’s) will prove to be much more effective in meeting the inflation challenge by signalling clearly to economic agents that the RBA is very serious about its role in returning inflation to within the band by 2024.
Containing inflationary expectations must be the most urgent task of a central bank.
That final paragraph now rings quite clearly that “The Board is committed to doing what is necessary to ensure that inflation in Australia returns to target over time.”
Bitcoin is Unlikely to Bottom So Early and High
Bitcoin rose 4.9% on Monday, ending at around $31.5K. However, on Tuesday morning, the first cryptocurrency collapsed 7% to $29.5K, the second such bear attack in the past seven days. Both were of similar magnitude, but the latter should have a more considerable negative effect. It more than offset Monday’s gains and temporarily brought the price back to levels from May 30.
The BTCUSD consolidation has been going on for more than a month. Earlier it was formed as a triangle with decreasing amplitude of fluctuations, but since the end of last month, it became more like a sideways pattern, from which it makes several failed attempts to break upwards.
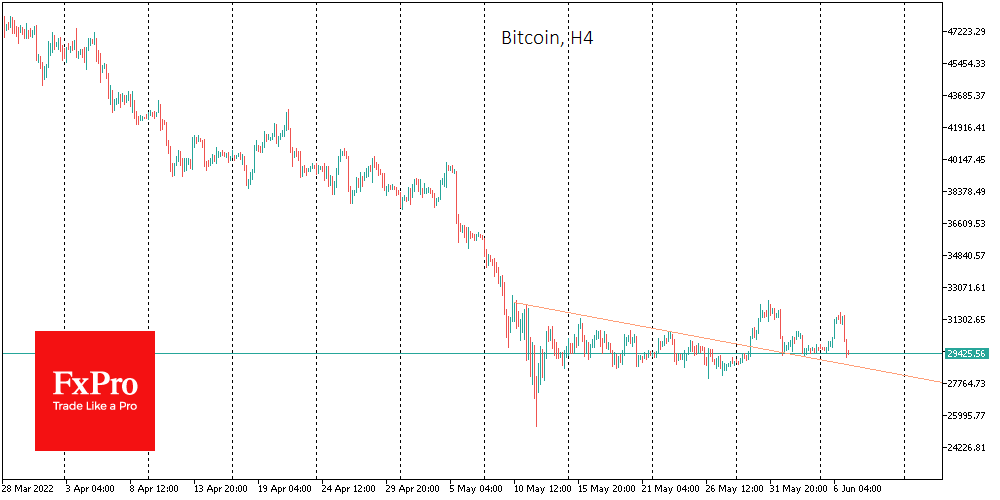
The market dynamics this Tuesday morning are a reminder that the market cannot now rally again as it did in 2020. Bitcoin’s prolonged sideways slide is turning current prices into the norm, although current levels seemed like a good buy for the long term two months ago. 2018 and 2019 teach us that such consolidations can last for months and often lead to new selloffs from frustrated fast earners.
In our view, the bitcoin bear market is not over yet, although it has made a significant part of its way down. The market is full of rumours that short-term buyers have already capitulated, backed up by Kathy Wood. But the whole bear market rarely ends at this phase. Far more often, a bull market begins when medium-term investors and even some long-term investors capitulate, bringing stressed market professionals into play. It is unlikely to reach this point before the price returns to the highs of 2017.
Bitcoin’s short-term volatility is irrelevant, MicroStrategy CEO Michael Saylor said. He said BTC is the surest thing in a very volatile world and is more suited to long-term investment rather than trading.
According to a survey by The Economist, 37% of respondents in the world’s leading economies are interested in having their governments adopt cryptocurrencies as legal tender.
EURJPY’s Non-Stop Rally Hits 7½-Year High; Bullish But Overbought
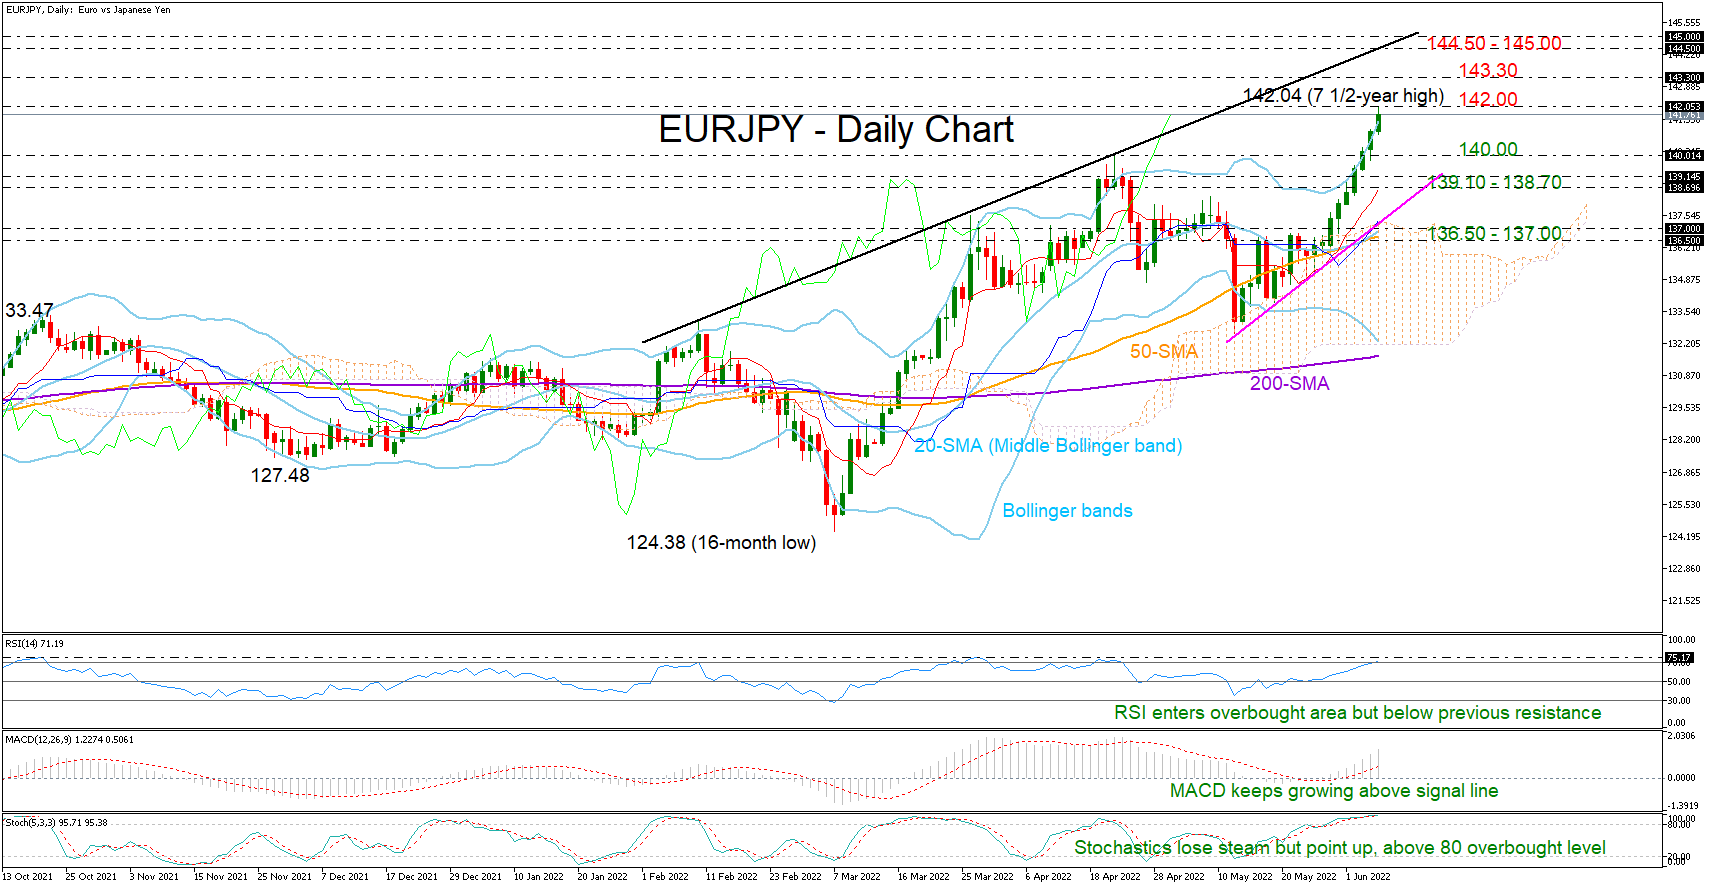
EURJPY has the potential to repeat last week’s exciting bull run, executing another acceleration to a new 7½-year high of 142.00 early on Tuesday.
Having already charted eight consecutive green days and three months of gains, some depreciation would be normal in the coming sessions, especially as the RSI and the fast-Stochastics smoothly sail in the overbought territory. With the price having closed marginally above the upper Bollinger band over the past three days, the odds for a downside correction are growing larger. Nevertheless, given the persisting positive momentum in the MACD and the upward slope in the RSI, which is just entering the overbought zone and has yet to reach its former resistance zone, there might be some room for improvement before the next bearish round takes place.
Advancing above the 142.00 psychological level, the bulls may initially take a breather around the 143.30 barrier taken from November 2014. A steeper increase could get congested within the 144.50 – 145.00 restrictive zone, where the 161.8% Fibonacci extension of the April- May downfall is placed. Notably, a resistance line drawn from February's peak is passing through this area too.
If sellers take immediate control, the pair may look for a rebound near 140.00, where April’s ascend almost topped. Slightly lower, the 139.10 – 138.62 tight region, which encapsulates the constraining red Tenkan-sen line, could next come to the rescue, preventing an outlook deterioration towards the short-term support trendline and the 20- and 50-day simple moving averages (SMAs) seen at 136.50 - 137.00.
In brief, EURJPY is trading overbought in the short-term picture and its nonstop bullish momentum could motivate some profit-taking in the near term. But before that happens, the pair may print another higher high.
GBPUSD Flirts with 20-Day SMA, Suggesting More Losses
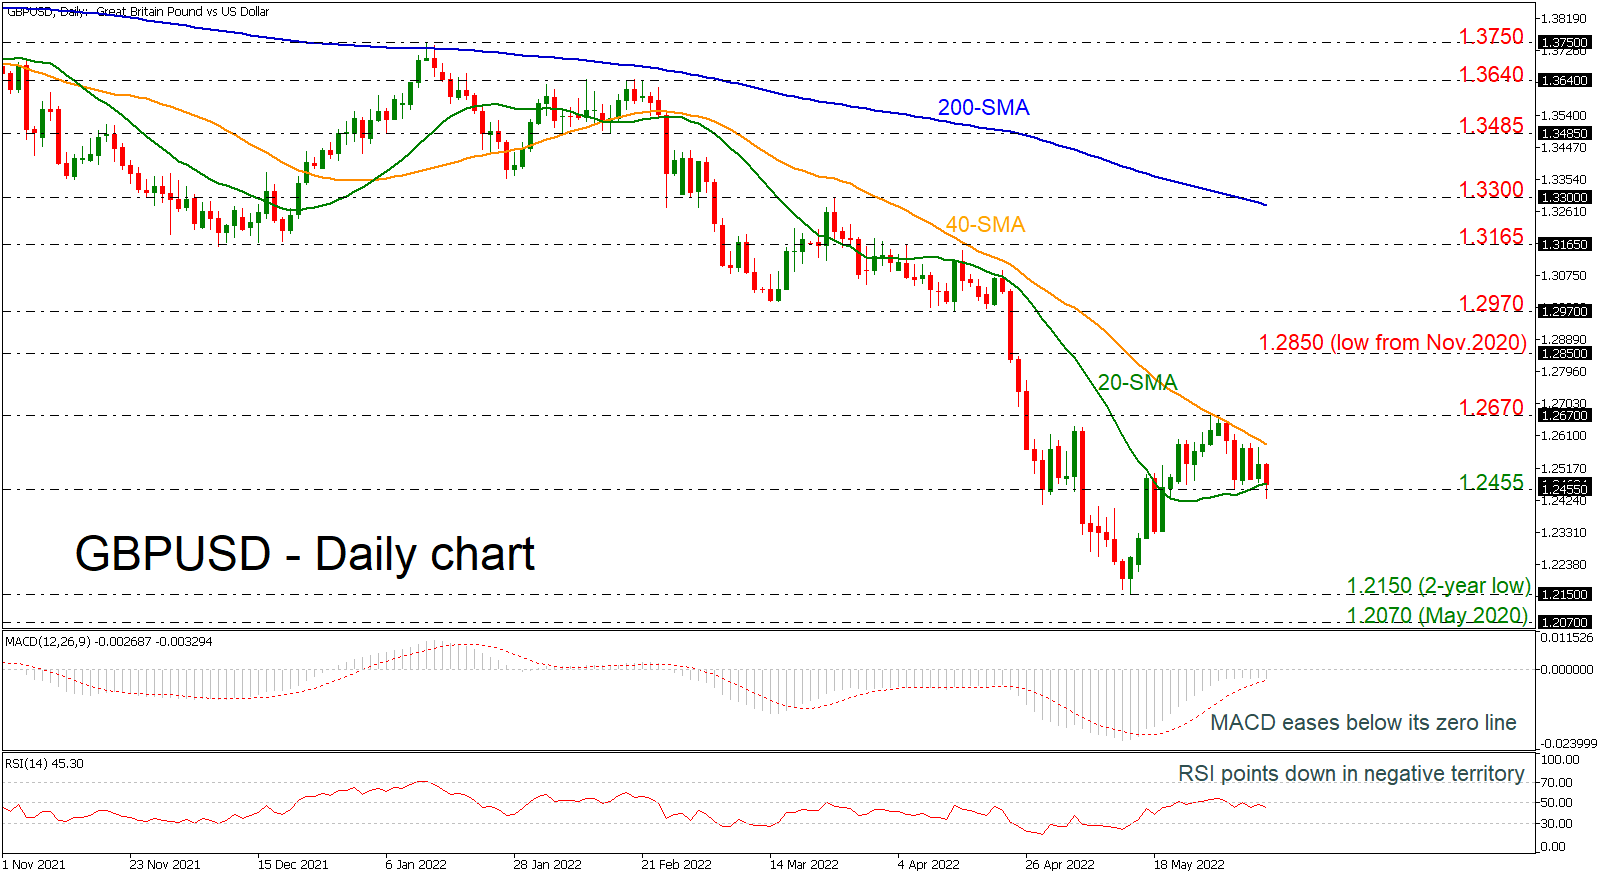
GBPUSD is currently positioned within the 20- and 40-day simple moving averages (SMAs), which are pointing upwards. The current bias appears negative, as the MACD is holding below the zero level, while the RSI is sloping down in the negative territory.
Should weakness extend below the 1.2455 mark, support to downside movements could initially be detected within the 1.2070-1.2150 area, which encapsulates the two-year low. Clearing that zone, the next stop could be around 1.1420, a tested level since March 2020.
Alternatively, the pair needs to overcome the 40-day SMA and the 1.2670 top to meet a key barrier between the 1.2850 resistance. The 1.2970 barrier could act as a resistance too before a more important battle starts near 1.3165 and the 200-day SMA around the 1.3300 psychological level.
In the medium-term picture, the sentiment remains bearish, and only a successful increase beyond the 200-day SMA may switch the current outlook to positive.
All in all, GBPUSD currently maintains a bearish mode both in the short and the medium-term timeframes.
Daily Technical Analysis
EUR/USD
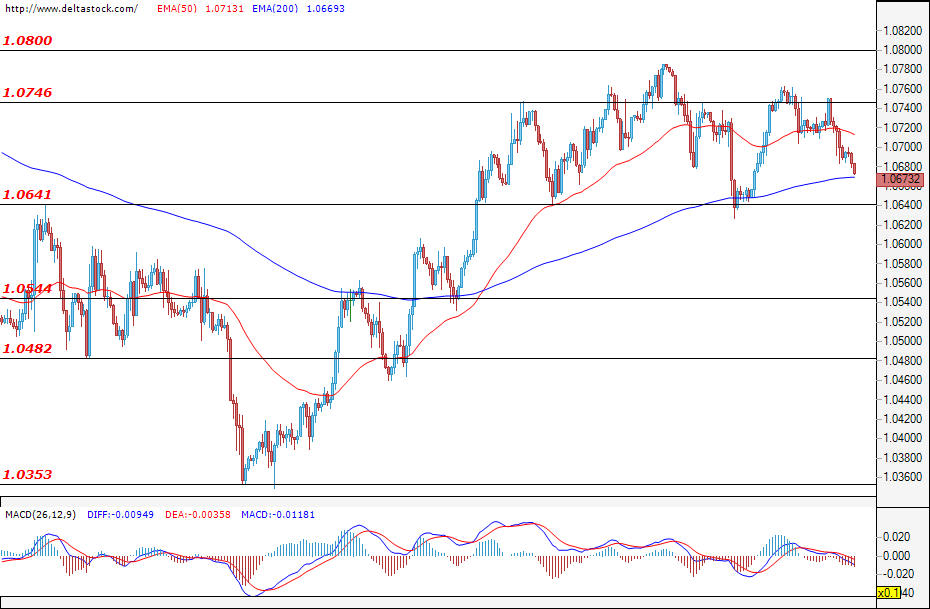
The currency pair continues to move within the relatively narrow range of 1.0640 – 1.0740. During yesterday's trading session, the bulls were limited to the upper limit of the mentioned range, after which they began to give way to the bears, and at the time of writing the analysis, the most likely scenario is for an attack on the support zone at 1.0640. A successful breach of the lower boundary of the range could deepen the sell-off towards the next significant support zone at 1.0540.
USD/JPY
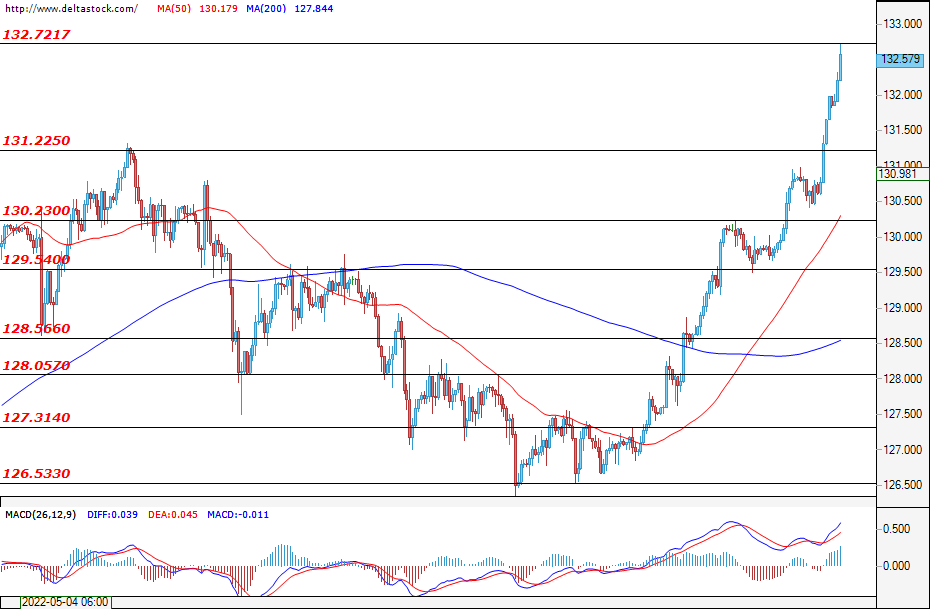
The U.S. dollar continues to gain positions against the Japanese yen during today's trading session. Should it reach the resistance at 132.72, we may witness a negative correction towards the first resistance at 131.22 in order to find better market entry levels and maintain the positive sentiment intact. The next more significant resistance for the currency pair, after the one at 132.70, is the area at around 133.70.
GBP/USD
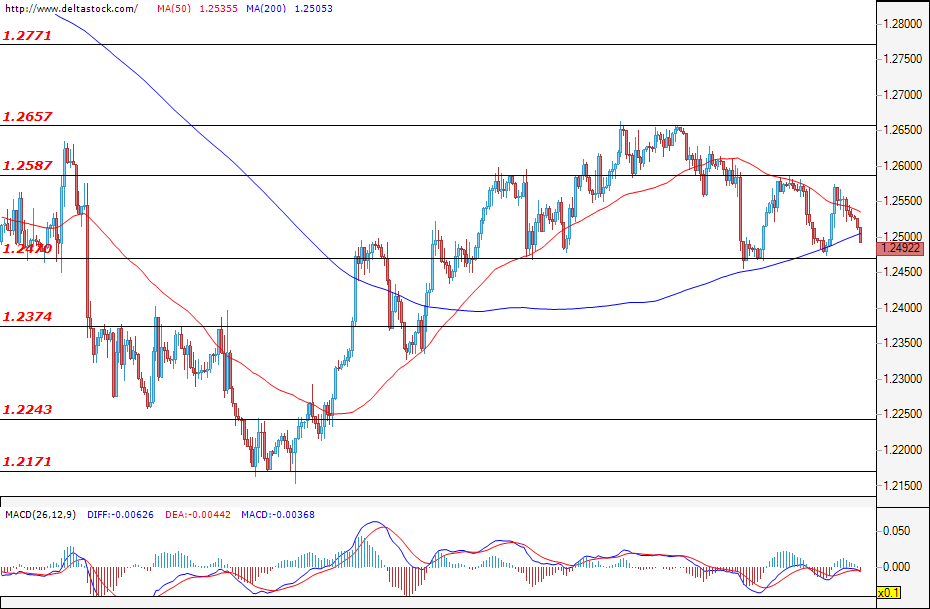
The pound lost ground against the U.S. dollar once again, and at the time of writing the analysis, it is about to test the support zone at 1.2470. This level also plays the role of the lower boundary of the emerging range between 1.2470 and 1.2590. A successful breach of the mentioned support could give the bears the necessary incentive to strengthen their positions and direct the trade towards the next significant support at 1.2375. On the other hand, if the bulls successfully limit the sell-off at 1.2470, then we may return to the previous scenario of maintaining the range move and possibly testing the upper boundary at 1.2590. Today, volatility is likely to pick up after the announcement of the PMI services for the UK at 08:30 GMT.
EUGERMANY40
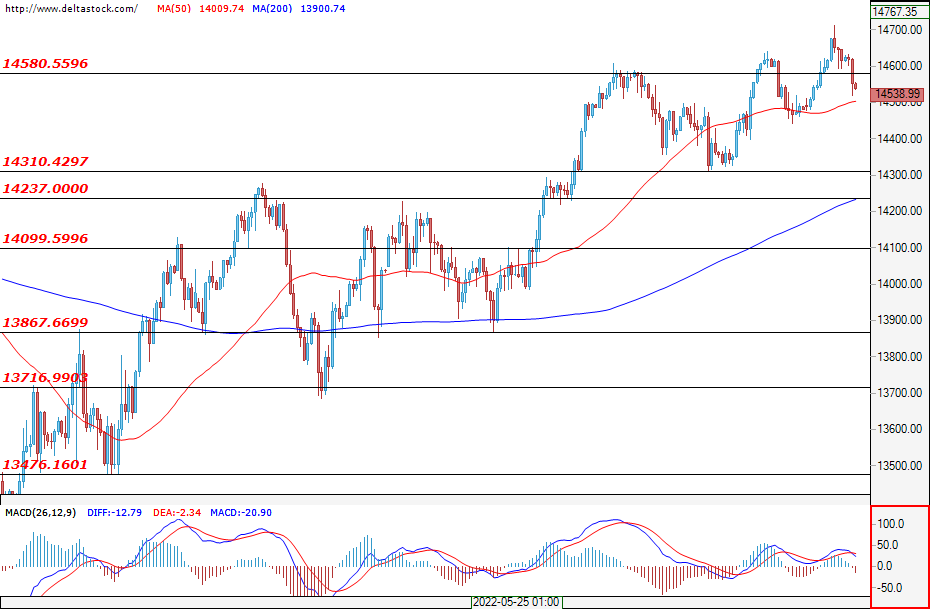
The fleeting breach of the resistance zone at 14580 could not be confirmed, after which the bulls lost some of their momentum. At the time of writing, the German index is trading just below the mentioned resistance, and the formation of a 14310 – 14580 range is a possibility. In the event of bull predominance, the next significant resistance zone would be the level at around 14850.
US30
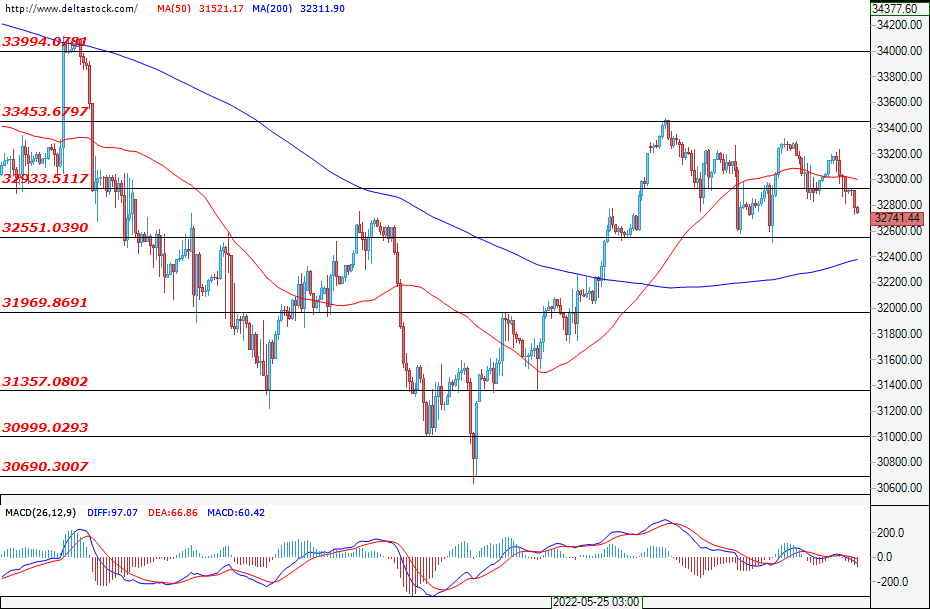
The U.S. blue-chip stock index has been losing ground since the beginning of the week, with the bears holding it firmly in its grasp at the time of writing. This means that we could potentially witness a test of the support zone at 32550. The mentioned support also plays the role of the lower boundary of the formed range of 32550 – 33450. High volatility is likely to persist for the index going into this week as well. Should the sell-off deepen, we could witness a test of the local lows at around 31360.
GBP/JPY Daily Outlook
Daily Pivots: (S1) 163.61; (P) 164.54; (R1) 166.17; More...
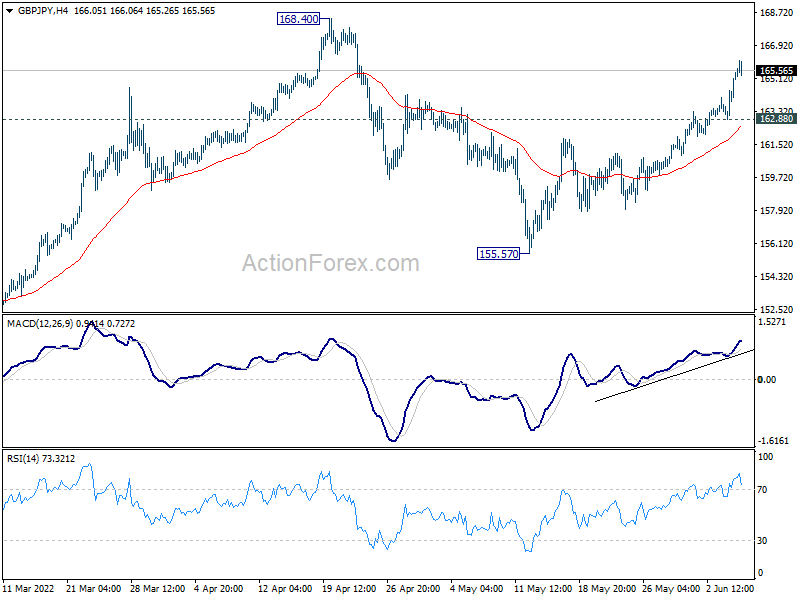
GBP/JPY's rally is in progress today and intraday bias stays on the upside for 168.40 high. Firm break there will resume larger up trend. On the downside, below 162.88 minor support will mix up the outlook and turn intraday bias neutral first.
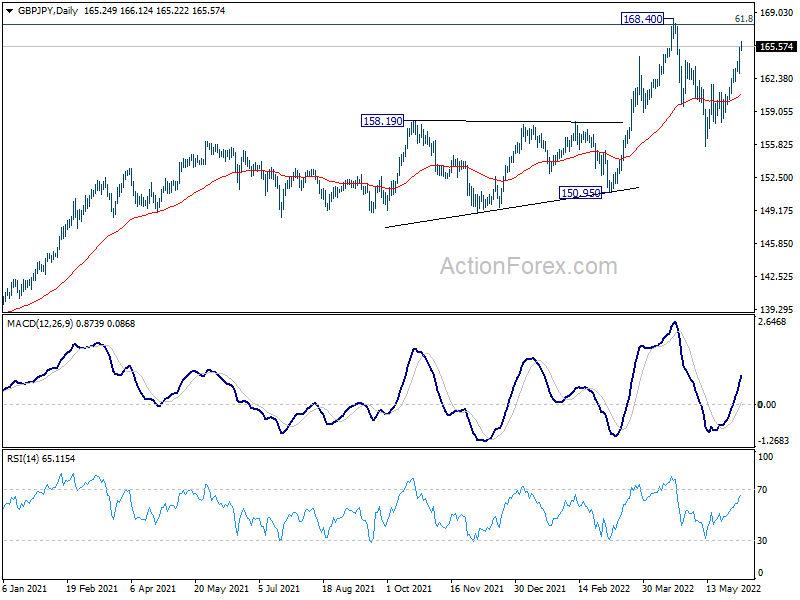
In the bigger picture, up trend from 123.94 (2020 low) is still in progress. Sustained break of 61.8% retracement of 195.86 (2015 high) to 122.75 (2016 low) at 167.93 will be a long term bullish signal, and could pave the way back to 195.86 high. This will now remain the favored case as long as 150.95 support holds, even in case of deep pull back. However, firm break of 150.95 will indicate rejection by 167.93, and bearish trend reversal.
EUR/JPY Daily Outlook
Daily Pivots: (S1) 140.22; (P) 140.67; (R1) 141.50; More....
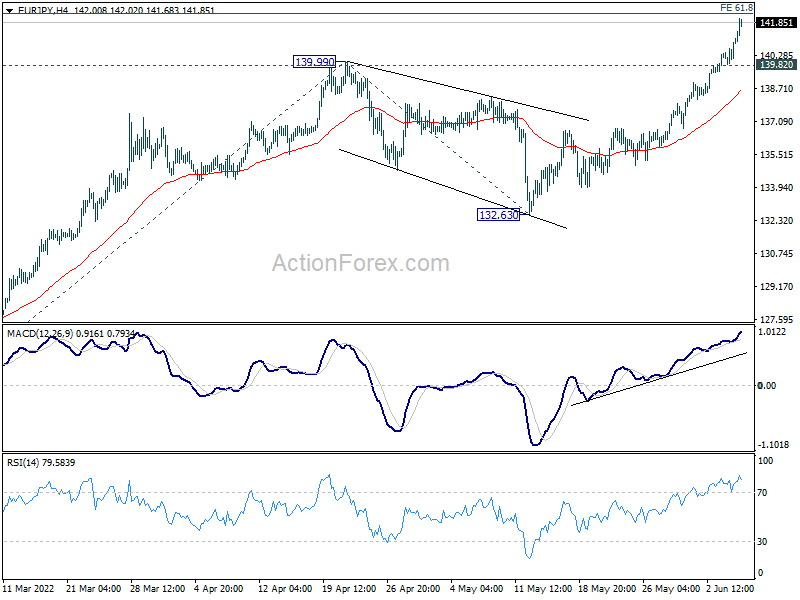
EUR/JPY's rally continues today and intraday bias stays on the upside for 61.8% projection of 124.37 to 139.99 from 132.63 at 142.28. Firm break there will target 100% projection at 148.25 next. On the downside, below 139.82 minor support will turn intraday bias neutral and bring consolidations first, before staging another rally.
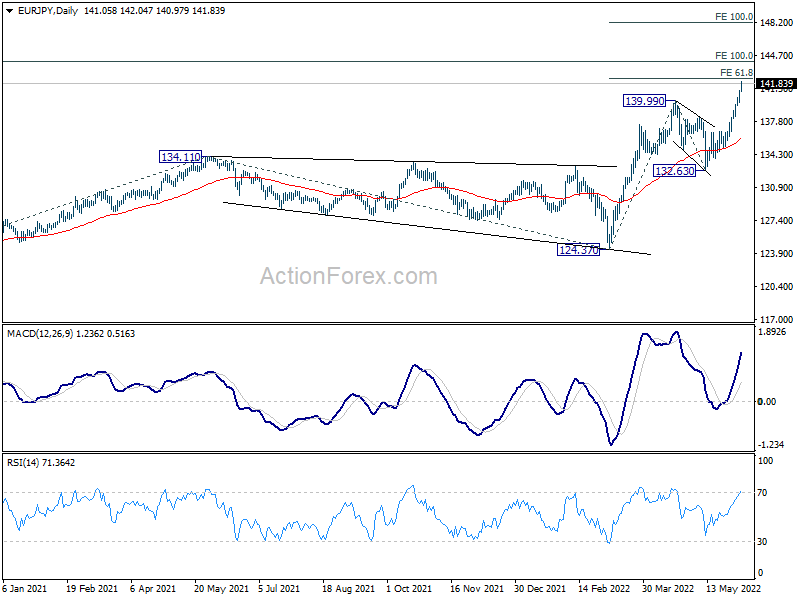
In the bigger picture, up trend from 114.42 (2020 low) is in progress. Such rise is seen as the third leg of the pattern from 109.30 (2016 low). Next target will be 100% projection of 114.42 to 134.11 from 124.37 at 144.06. Firm break there will indicate upside acceleration and target 149.76 long term resistance (2014 high). In any case, outlook will now remain bullish as long as 132.63 support holds, in case of deep pull back.
EUR/GBP Daily Outlook
Daily Pivots: (S1) 0.8512; (P) 0.8550; (R1) 0.8575; More...
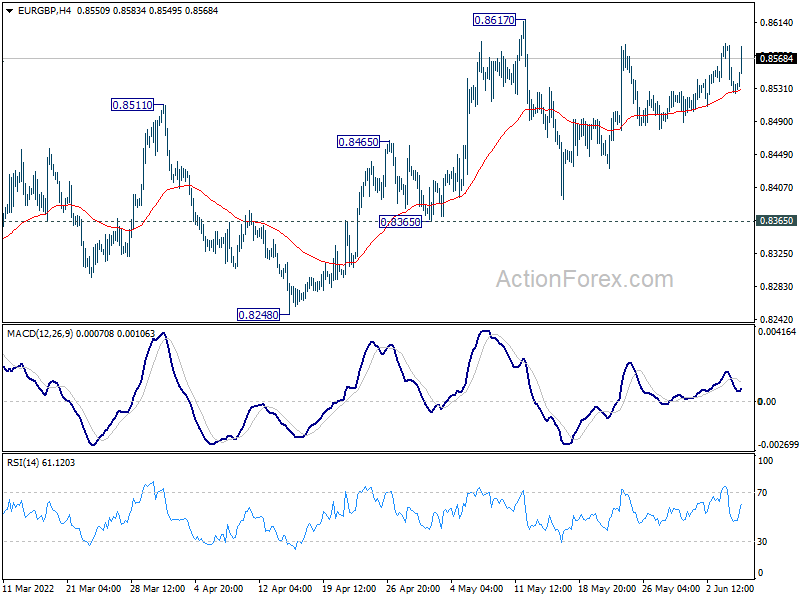
Outlook in EUR/GBP is unchanged and intraday bias stays neutral first. With 0.8365 support intact, further rise is in favor. On the upside, break of 0.8617 will resume rise from 0.8201 medium term bottom to 0.8697 medium term fibonacci level. However, break of 0.8365 will dampen this bullish view, and turn bias back to the downside instead.
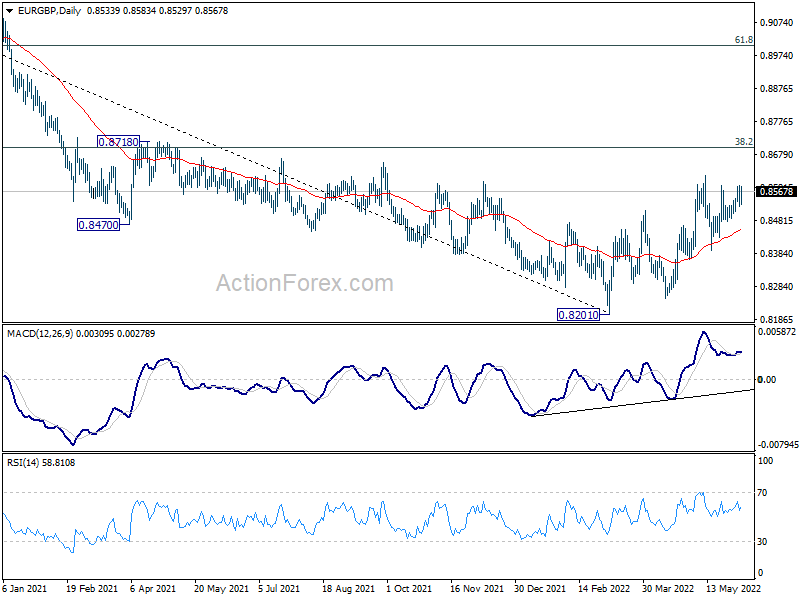
In the bigger picture, a medium term bottom could be in place at 0.8201, on bullish convergence condition in daily and weekly MACD. Rise from there could either be a correction to the down trend from 0.9499 (2020 high), or a medium term up trend itself. In either case, further rise should be seen to 38.2% retracement of 0.9499 to 0.8201 at 0.8697. Sustained break there will target 61.8% retracement at 0.9003.
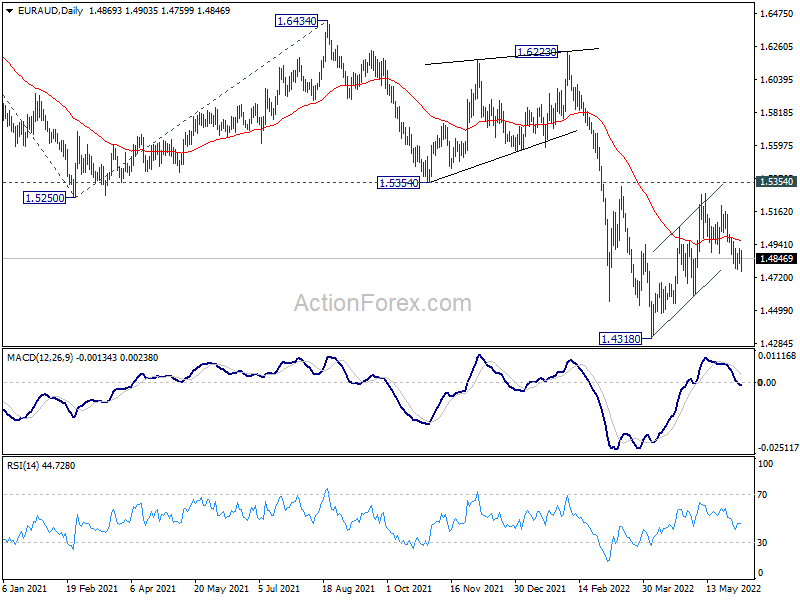
EUR/AUD Daily Outlook
Daily Pivots: (S1) 1.4816; (P) 1.4866; (R1) 1.4912; More...
Intraday bias in EUR/AUD is back on the downside as fall from 1.5277 is resuming. Deeper decline should be seen to 1.4597 support. Firm break there should confirm that rebound from 1.4318 has completed at 1.5277. Next target is a retest on 1.4318 low. However, on the upside, break of 1.4965 will dampen this bearish view and turn bias back to the upside for 1.5277 resistance instead.
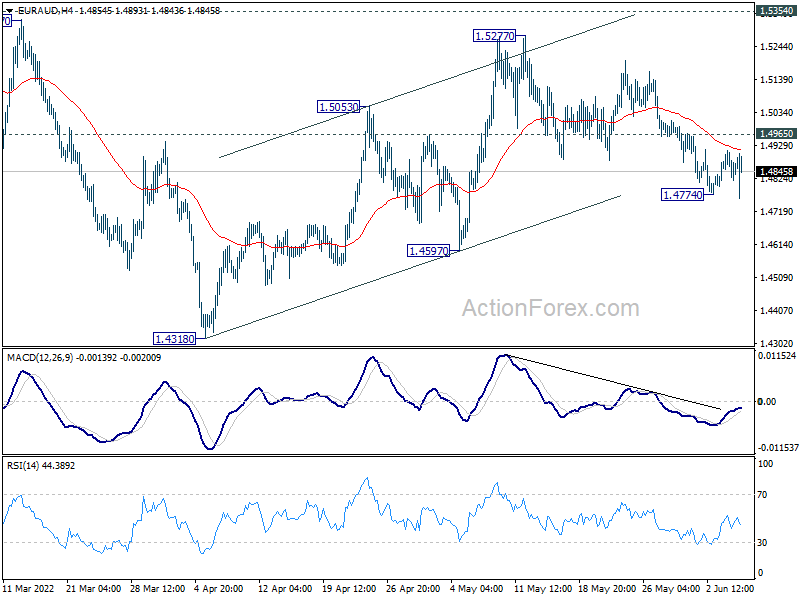
In the bigger picture, as long as 1.5354 support turned resistance holds, larger down trend from 1.9799 (2020 high) is still expected to continue. On resumption, next target is 61.8% projection of 1.9799 to 1.5250 from 1.6434 at 1.3623, which is close to 1.3624 long term support (2017 low). However, firm break of 1.5354 will indicate medium term bottoming and bring stronger rally back to 1.6434 key resistance.