Sample Category Title
Kuroda: BoJ takes a strong stance on continuing with monetary easing
BoJ Governor Haruhiko Kuroda said in a speech that the economy is "still on its way to recovery from the pandemic and has been under downward pressure from the income side due to rising commodity prices". In this situation, "monetary tightening is not at all a suitable measure".
He added that the top priority is to "persistently continue with the current aggressive monetary easing centered on yield curve control". And, unlike other central banks, BoJ has noted faced the "the trade-off between economic stability and price stability". Hence, it's "certainly possible for the Bank to continue stimulating aggregate demand from the financial side."
He concluded that BoJ "will take a strong stance on continuing with monetary easing, in that it will provide a macroeconomic environment where wages are likely to increase so that the rise in inflation expectations and changes in the tolerance of price rises -- which have started to be seen recently -- will lead to sustained inflation."
Technical Outlook and Review
DXY:
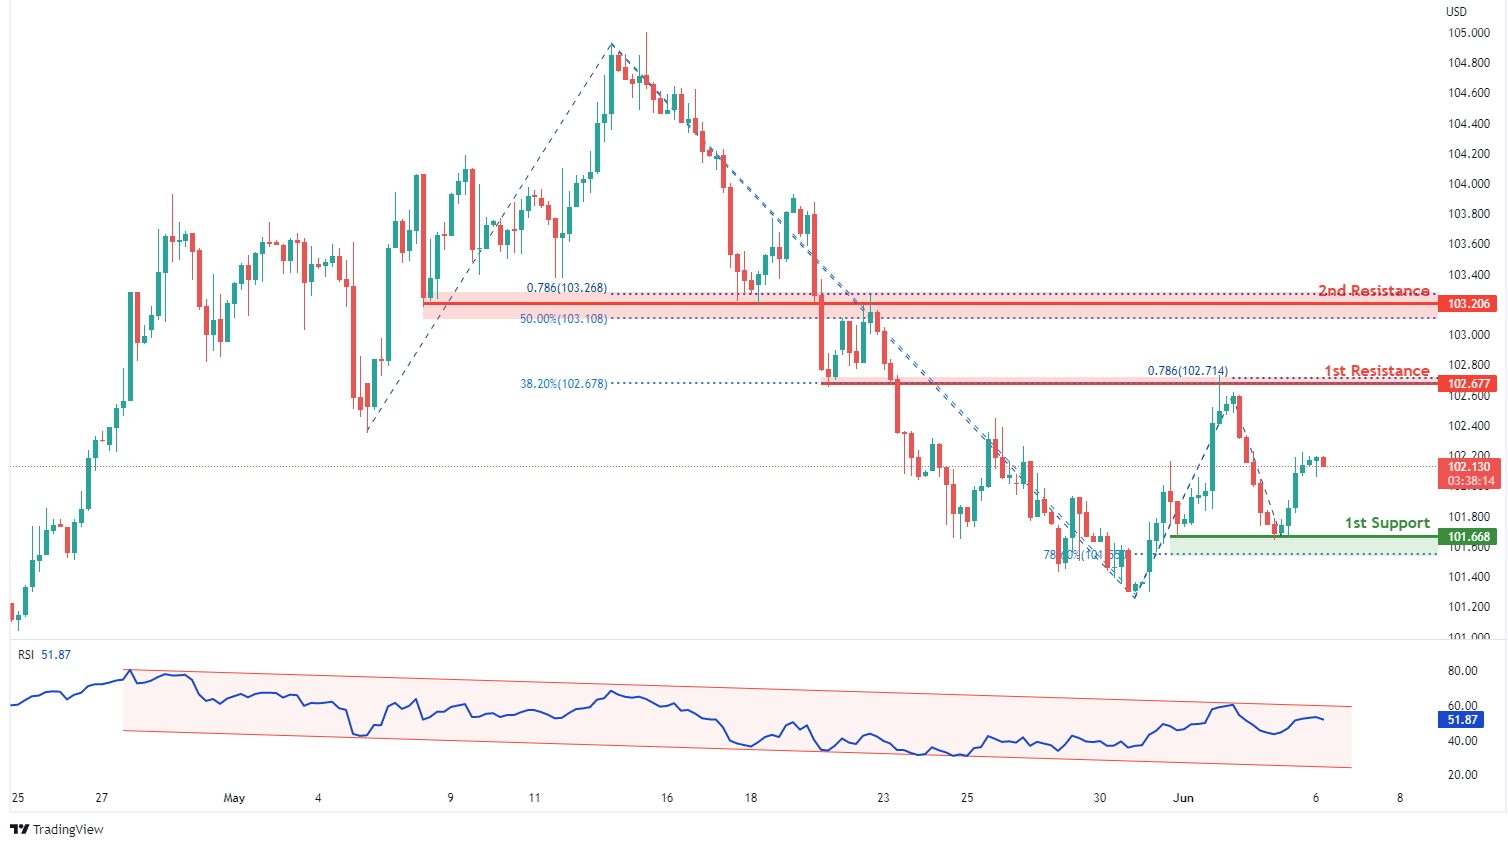
On the H4, with RSI moving in a descending channel, we have a bearish bias that price will drop to our 1st support at 101.668 where the horizontal swing low support and 78.6% fibonacci retracement are from our 1st resistance at 102.677 in line with the horizontal overlap resistance, 38.2% fibonacci retracement and 78.6% fibonacci projection. Alternatively, price may break 1st resistance structure and head for 2nd resistance at 103.206 where the horizontal overlap resistance, 78.6% fibonacci projection and 50% fibonacci retracement are.
Areas of consideration:
- H4 time frame, 1st resistance at 102.677
- H4 time frame, 1st support at 101.668
XAU/USD (GOLD):
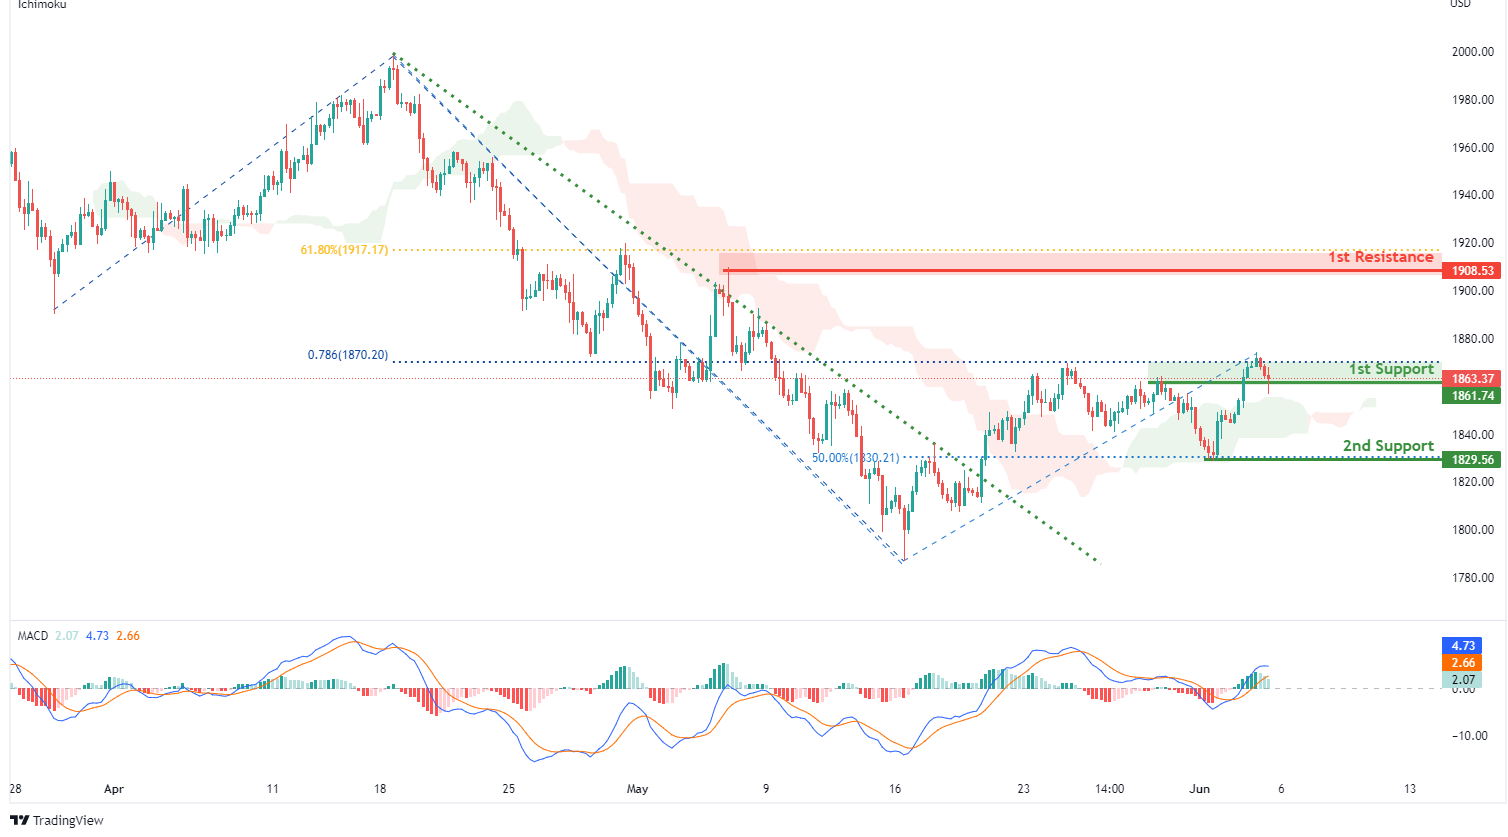
On the H4, with prices moving above the ichimoku indicator and MACD moving in a bullish momentum, we have a bullish bias that price will rise from our 1st support at 1861.74 where the horizontal swing high resistance and 78.6% fibonacci projection to our 1st resistance at 1908.53 where the horizontal swing high resistance and 61.8% fibonacci retracement are. Alternatively, price may break 1st support structure and head for 2nd support at 1829.56 in line with swing low support and 50% fibonacci retracement.
Areas of consideration:
- H4 time frame, 1st Resistance at 1908.53
- H4 time frame, 1st Support at 1861.74
GBP/USD:
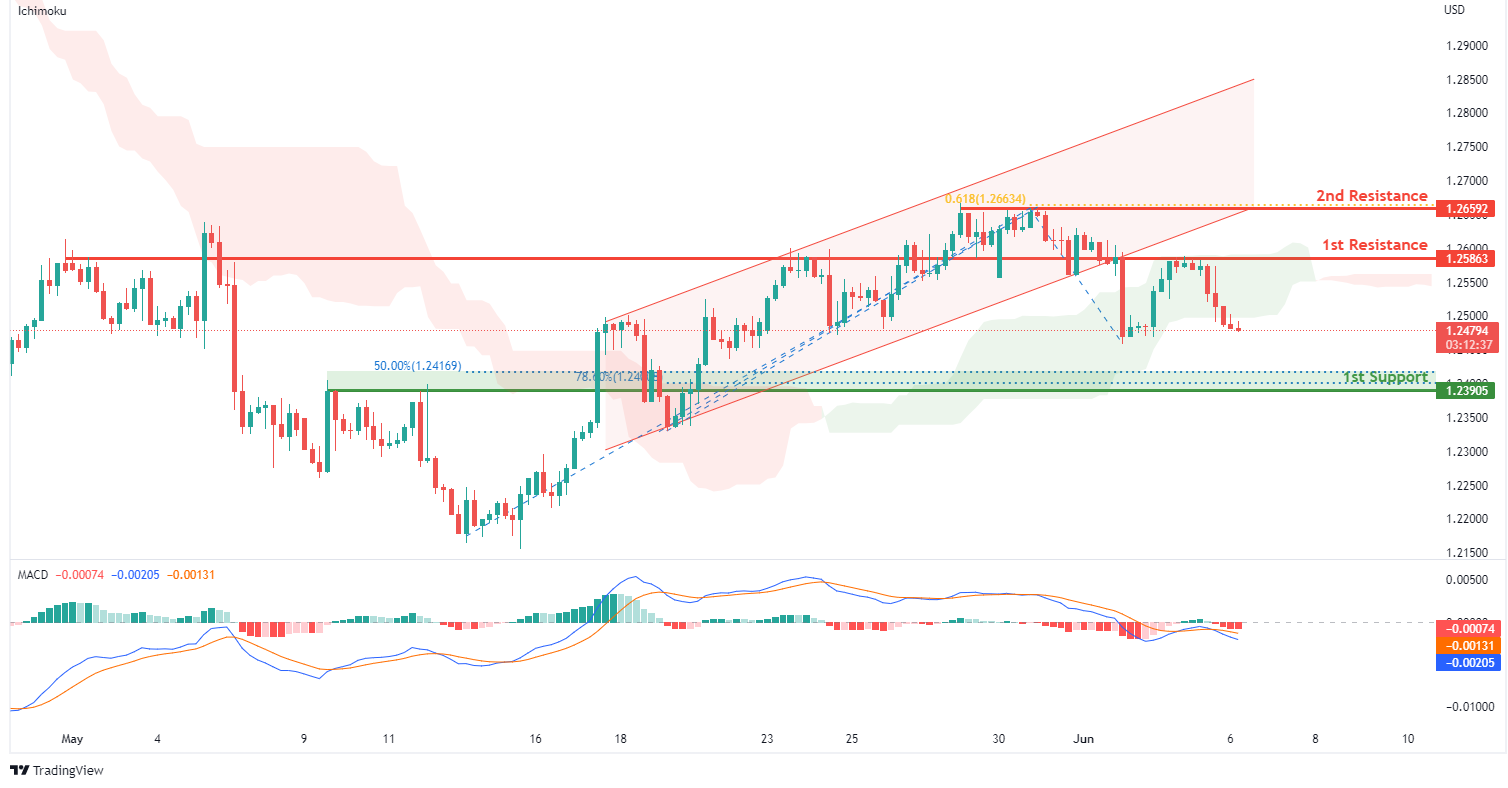
On the H4, with MACD moving in bearish momentum, price moving below the ichimoku indicator and price breakout from ascending channel, we have a bearish bias that price will drop from our 1st resistance at 1.25863 where the horizontal overlap resistance is to our 1st support at 1.23905 in line with the 50% Fibonacci retracement, 78.6% fibonacci retracement and overlap support. Alternatively, price may break 1st resistance structure and head for 2nd resistance at 1.26592 where the horizontal swing high resistance and 61.8% fibonacci projection are.
Areas of consideration:
- H4 1st resistance at 1.25863
- H4 1st support at 1.23905
USD/CHF:
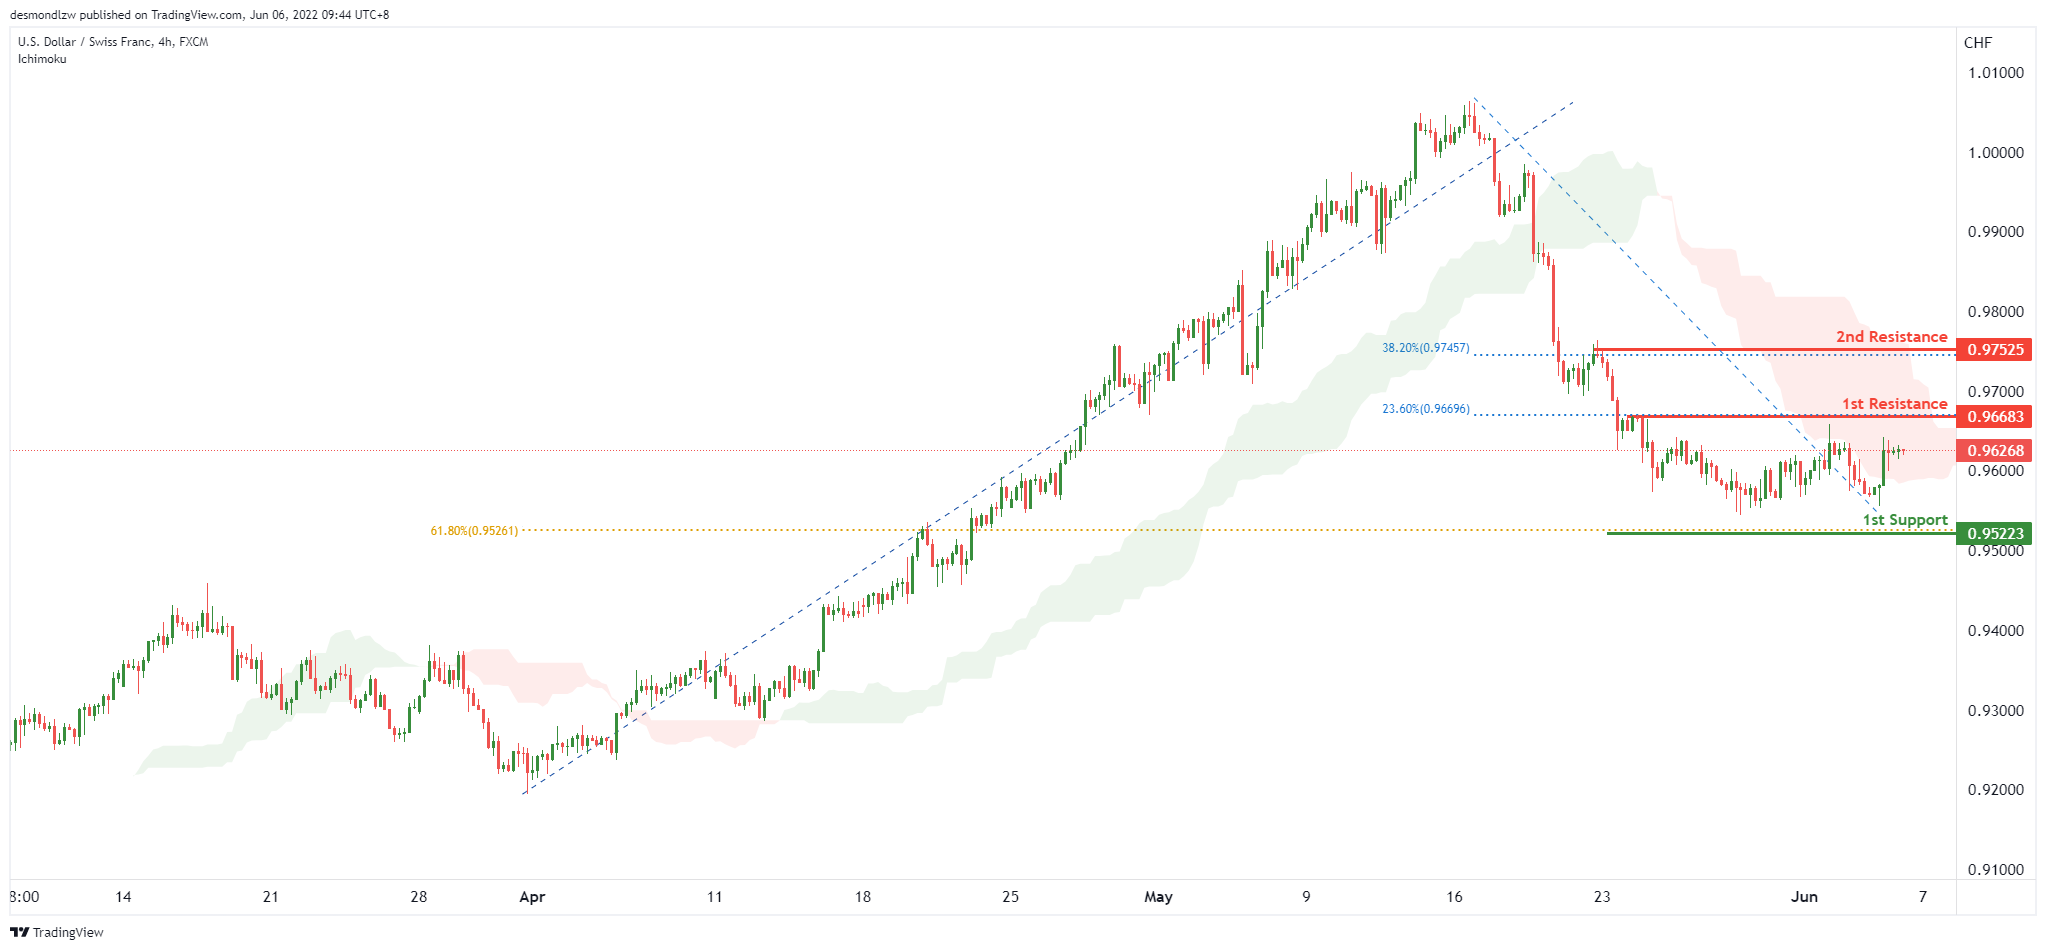
On the H4, with price moving below the ichimoku cloud, we have a bearish bias that price will drop to our 1st support at 0.95223 where the 61.8% Fibonacci retracement is from our 1st resistance at 0.96683 in line with the pullback resistance. Alternatively, price may break 1st resistance structure and head for 2nd resistance at 0.97525 where the swing high resistance is.
Areas of consideration
- 1st support level at 0.95223
- 1st resistance level at 0.96683
EUR/USD :
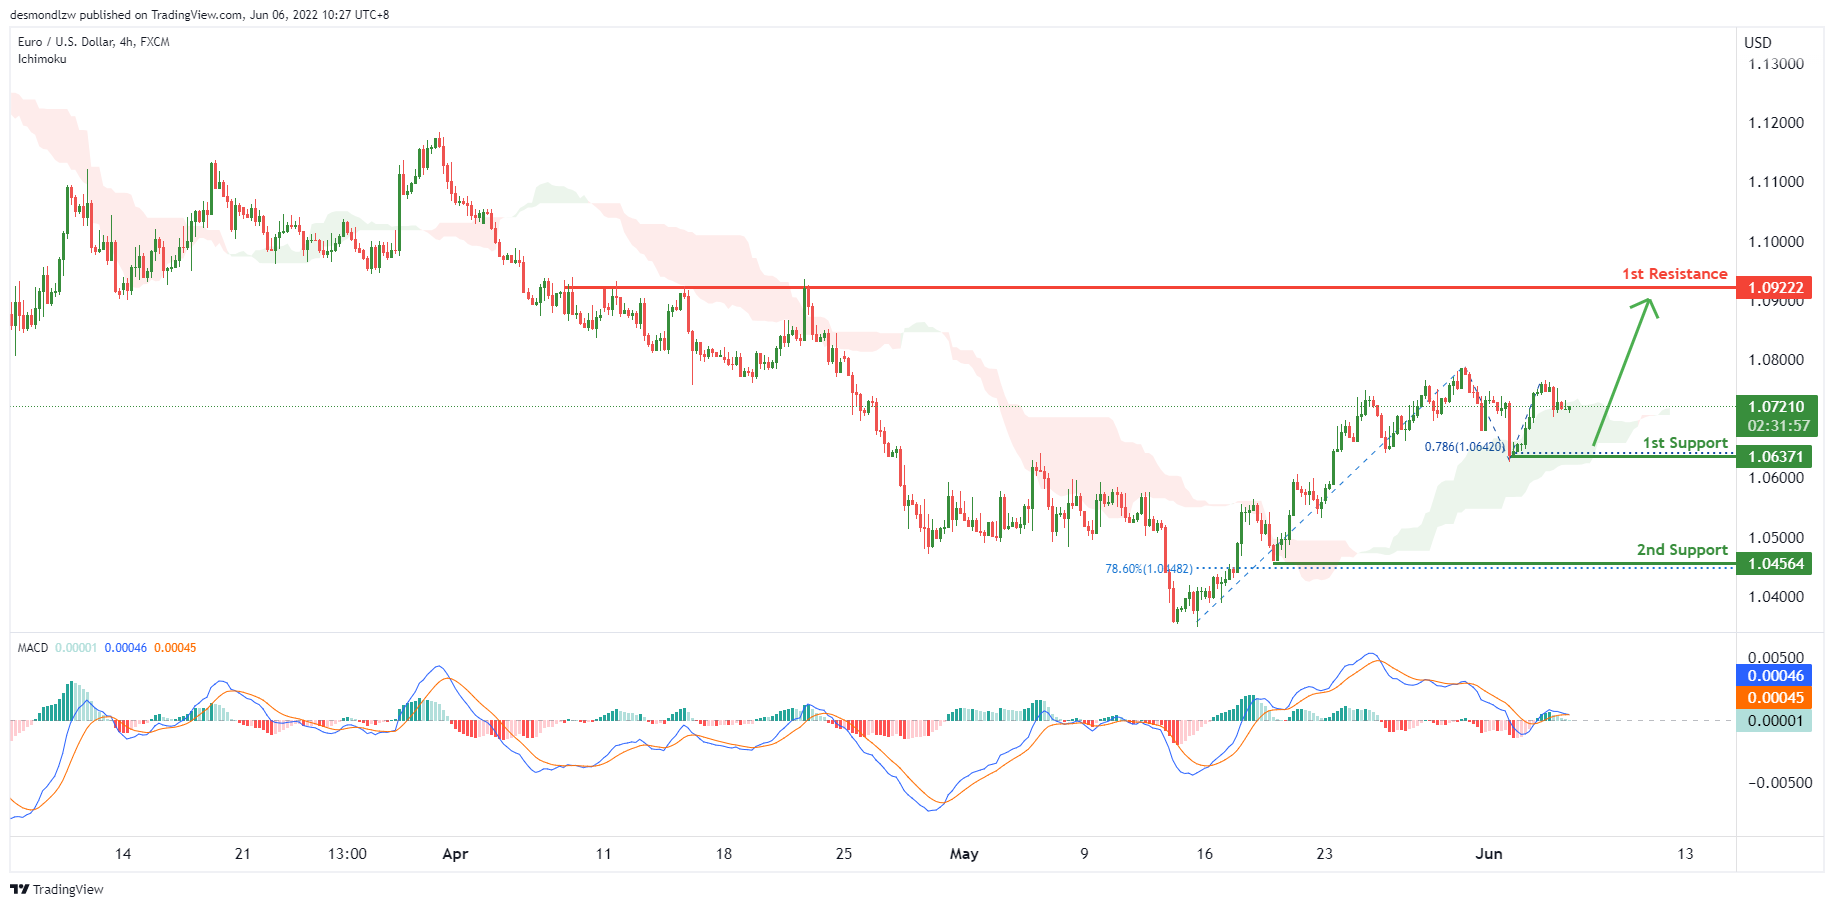
On the H4, with price moving above the ichimoku cloud, we have a bullish bias that price will rise from our 1st support at 1.06371 in line with the 78.6% fibonacci projection to our 1st resistance at 1.09222 overlap resistance and swing high. Alternatively, price may break the 1st support structure and drop to 2nd support at 1.04564 in line with the 78.6% fibonacci retracement
Areas of consideration :
- H4 1st resistance at 1.09222
- H4 1st support at 1.06371
USD/JPY:
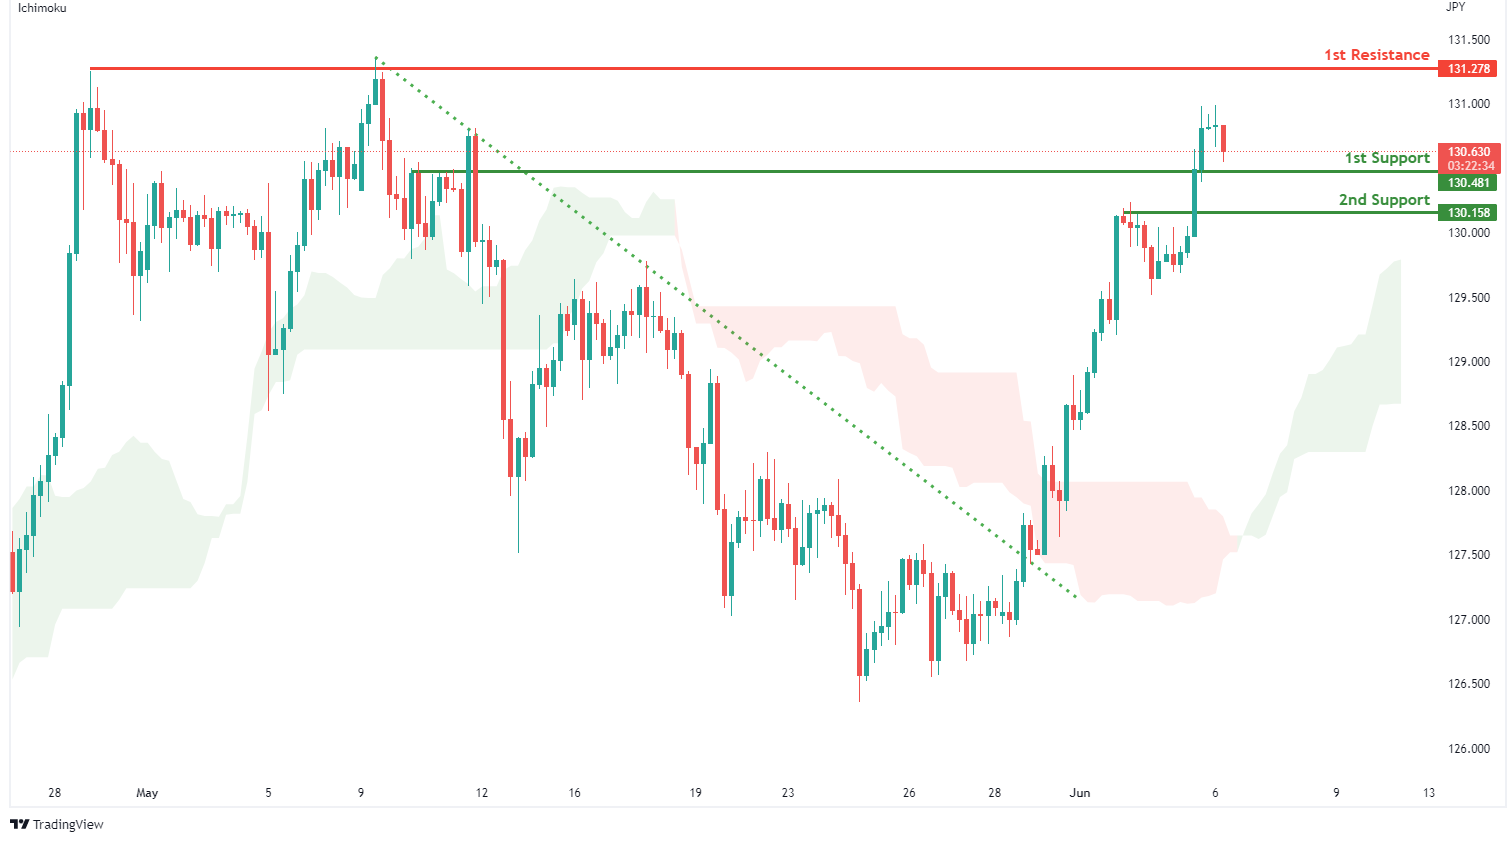
On the H4, with prices moving above the ichimoku indicator and breakout from descending trendline, we have a bullish bias that price will rise from our 1st support at 130.481 where the horizontal overlap support is to our 1st resistance at 131.278 in line with the swing high resistance. Alternatively, price may break 1st support structure and head for 2nd support at 130.158 where the horizontal pullback support is.
Areas of consideration:
- H4 time frame, 1st resistance at 131.278
- H4 time frame, 1st support at 130.481
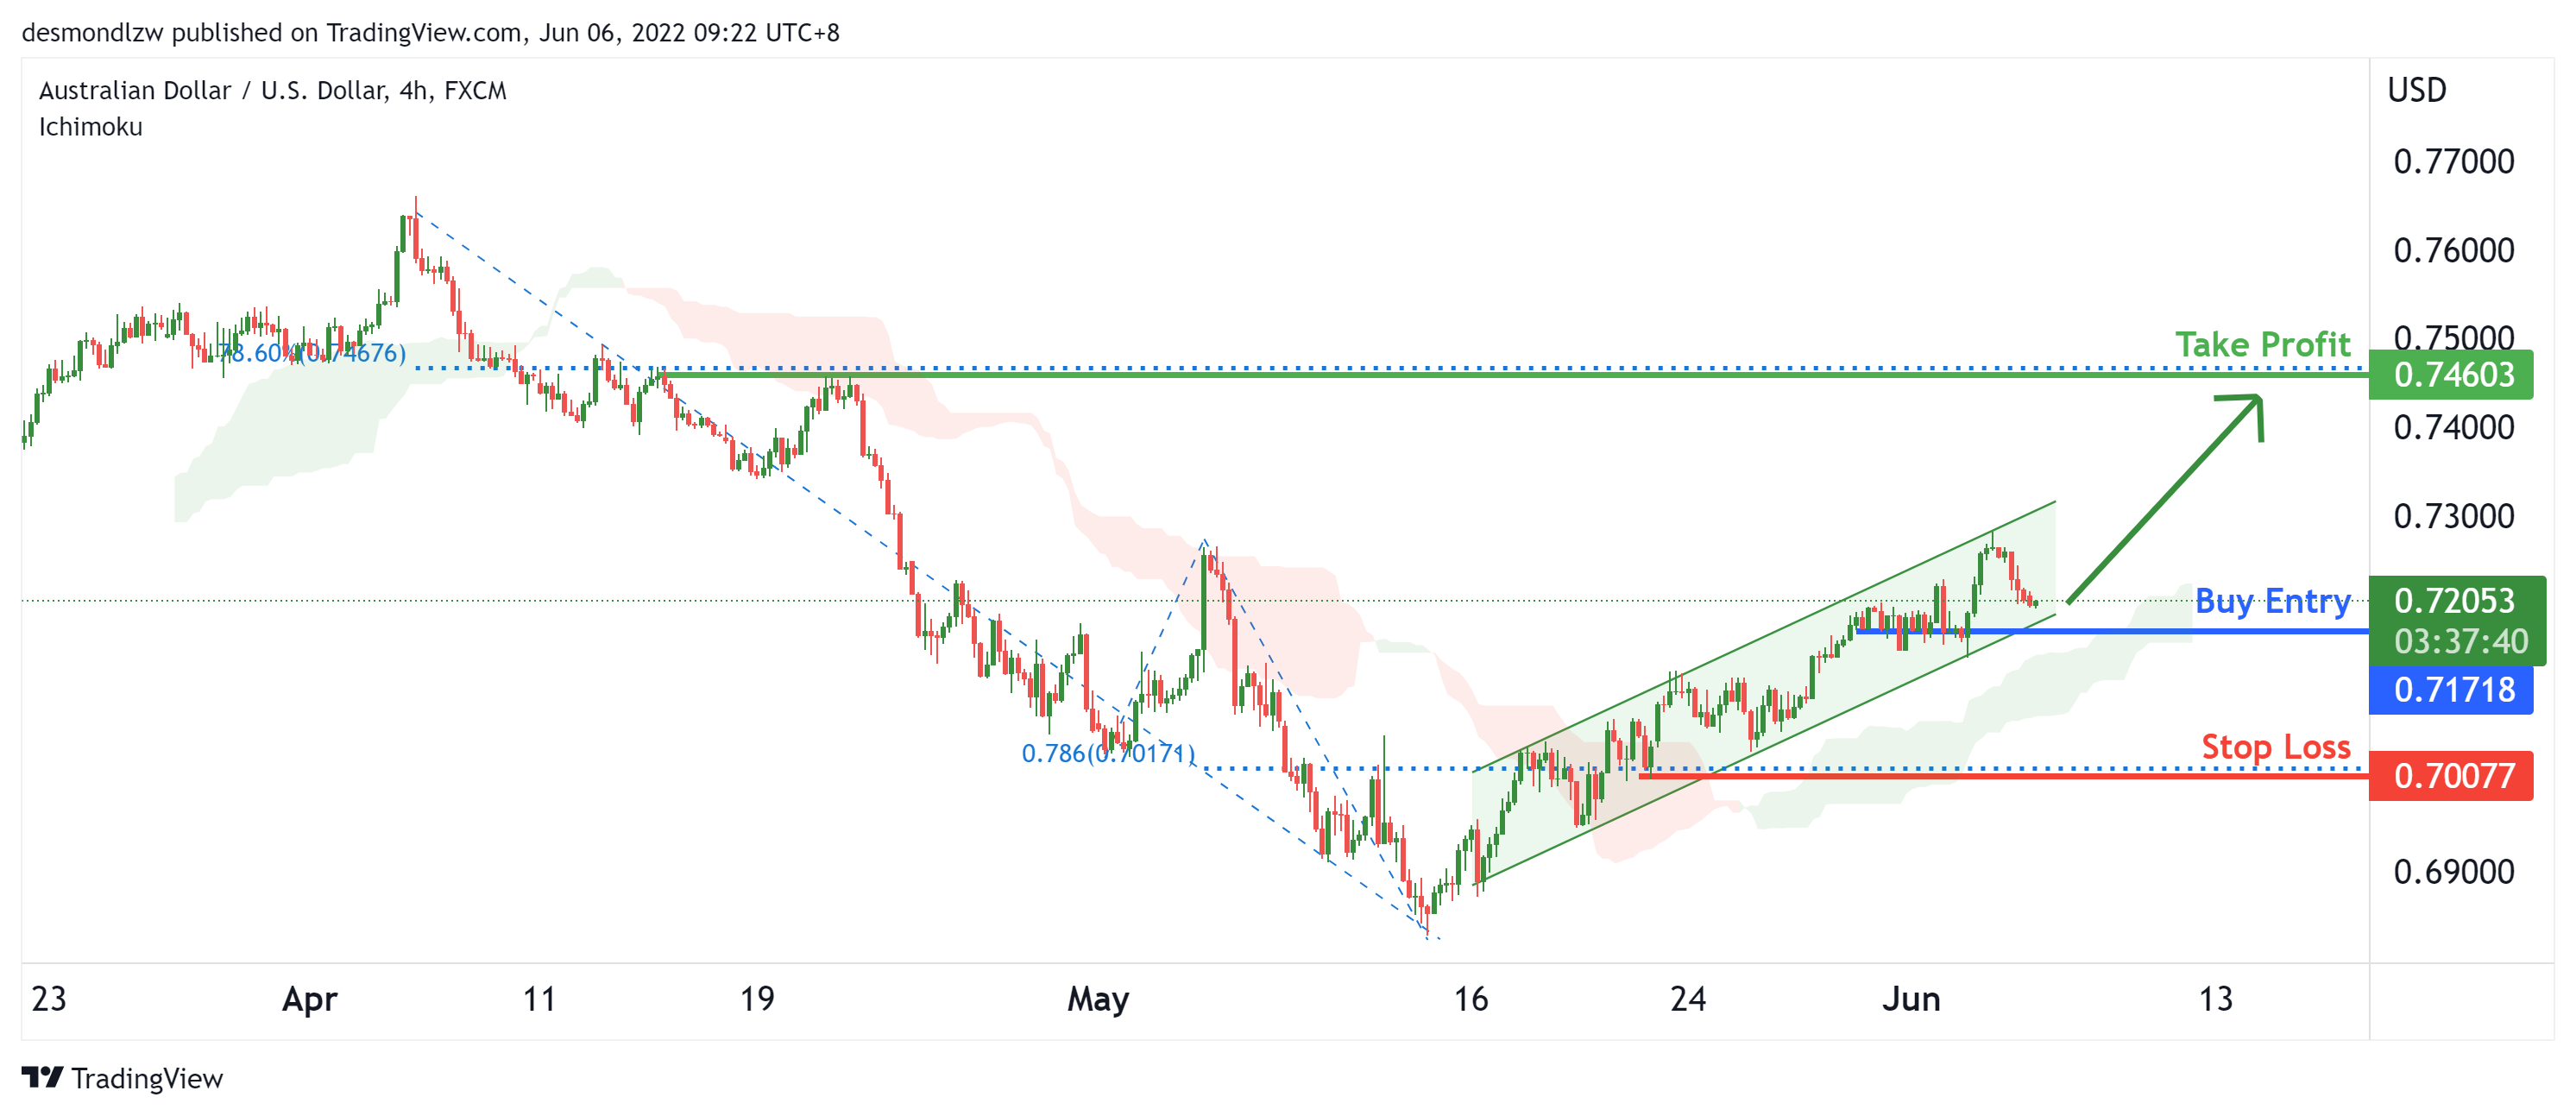
AUD/USD:
On the H4, with price moving above the ichimoku cloud and price moving within the ascending trend channel, we have a bullish bias that price will rise to our 1st resistance at 0.74603 where the swing high is in line with the 78.6% Fibonacci retracement from our 1st support at 0.71718. Alternatively, price may break 1st support structure and head for 2nd support at 0.70435 where the horizontal pullback support is, in line with the 78.6% fibonacci projection and 23.6% Fibonacci retracement.
Areas of consideration
- H4 1st resistance at 0.74603
- H4 1st support at 0.71718
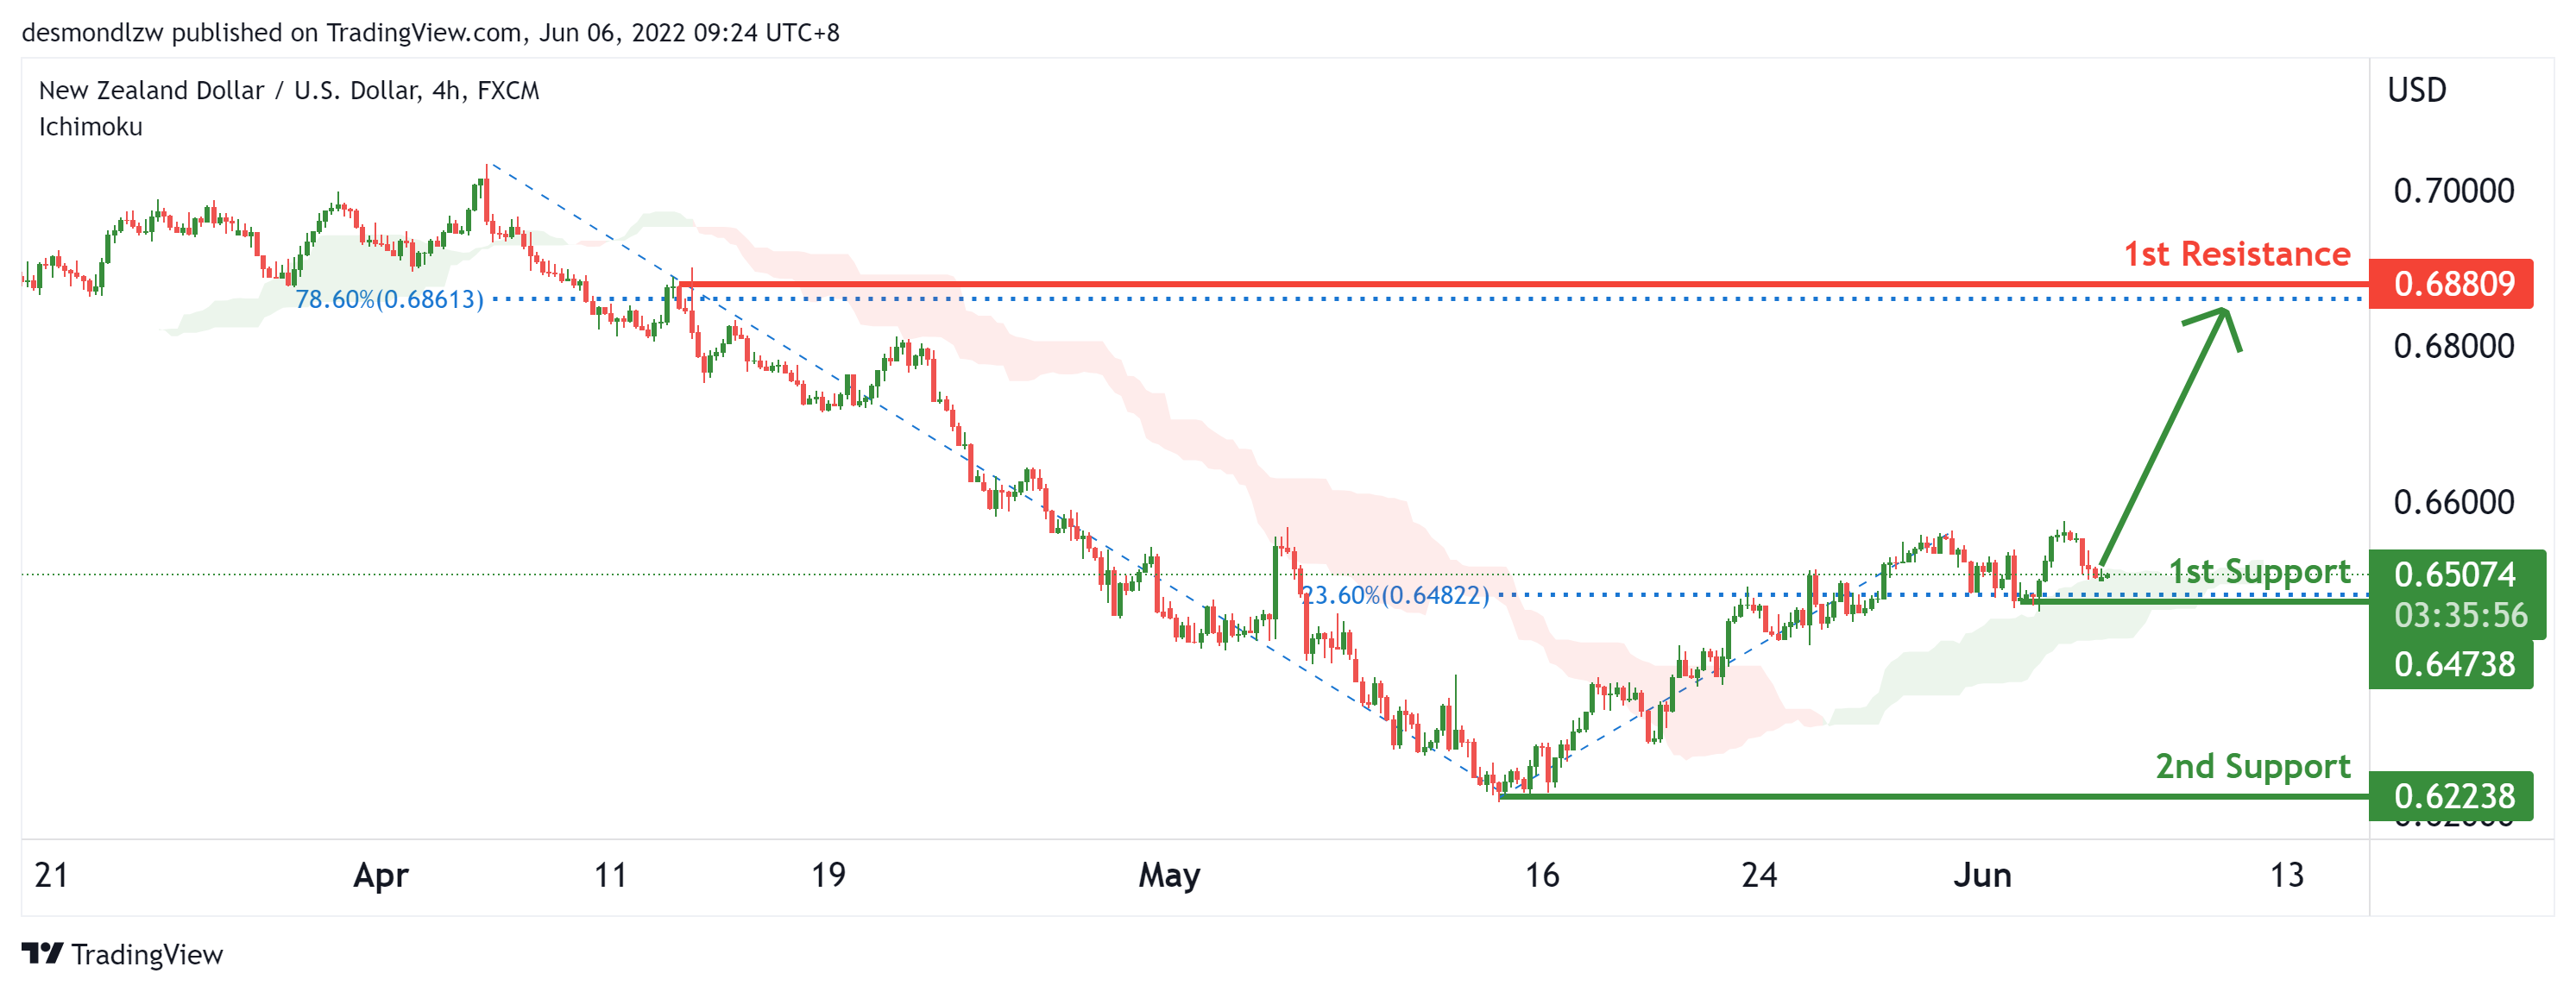
NZD/USD:
On the H4, with price moving above the ichimoku cloud, we have a bullish bias that price will rise from our 1st support at 0.64738 in line with the 23.6% fibonacci retracement to our 1st resistance at 0.68809 in line with the 78.6% fibonacci retracement. ALternatively, price may reverse off the 1st support and drop to 2nd support at 0.62238 at the swing low.
Areas of consideration:
- H4 time frame, 1st support at 0.64738
- H4 time frame, 1st resistance at 0.68809
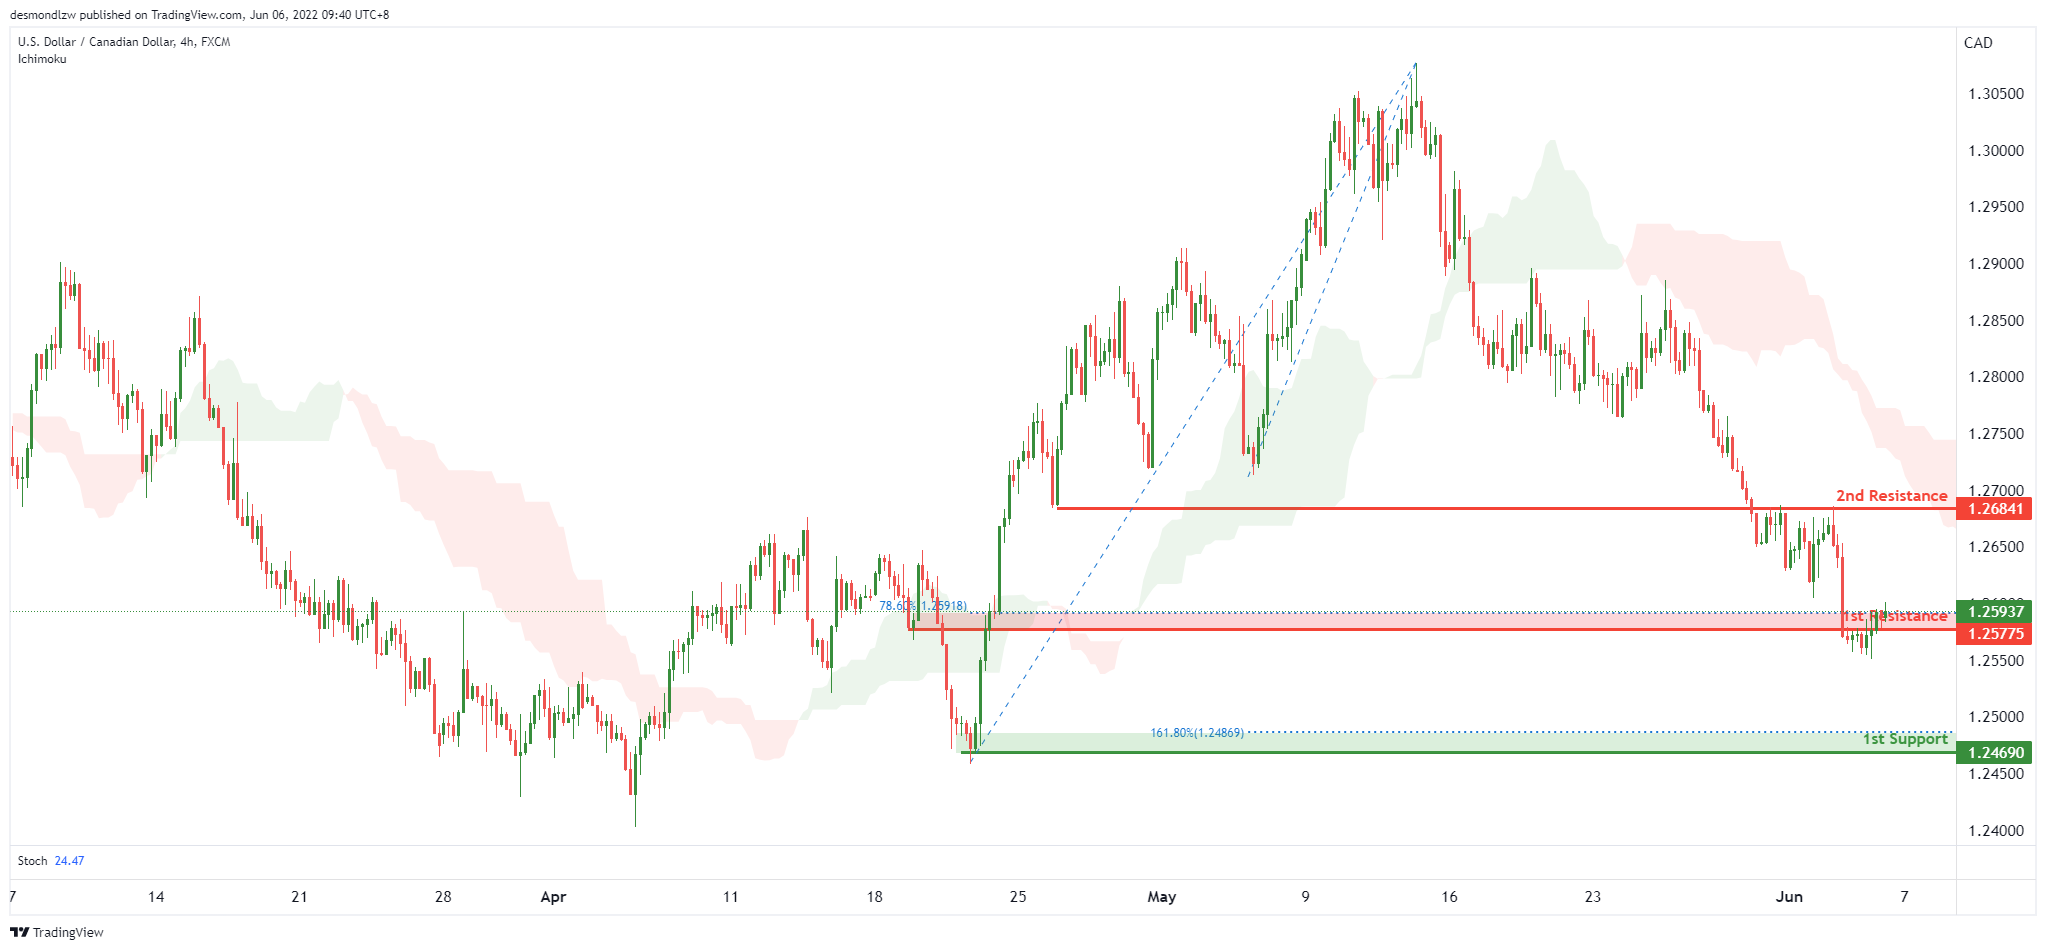
USD/CAD:
On the H4, with price moving below our ichimoku cloud and the recent break of our horizontal support level which is in line with the 28.6% fibonacci retracement level, we have a bearish bias that price will drop to our 1st support at 1.24690 in line with the horizontal swing low support and the 161.8% Fibonacci extension from our 1st resistance at 1.25775. Alternatively, price may break structure and head for our 2nd resistance at 1.26841.
Areas of consideration:
- H4 time frame, 1st resistance at 1.25775
- H4 time frame, 1st support at 1.24690
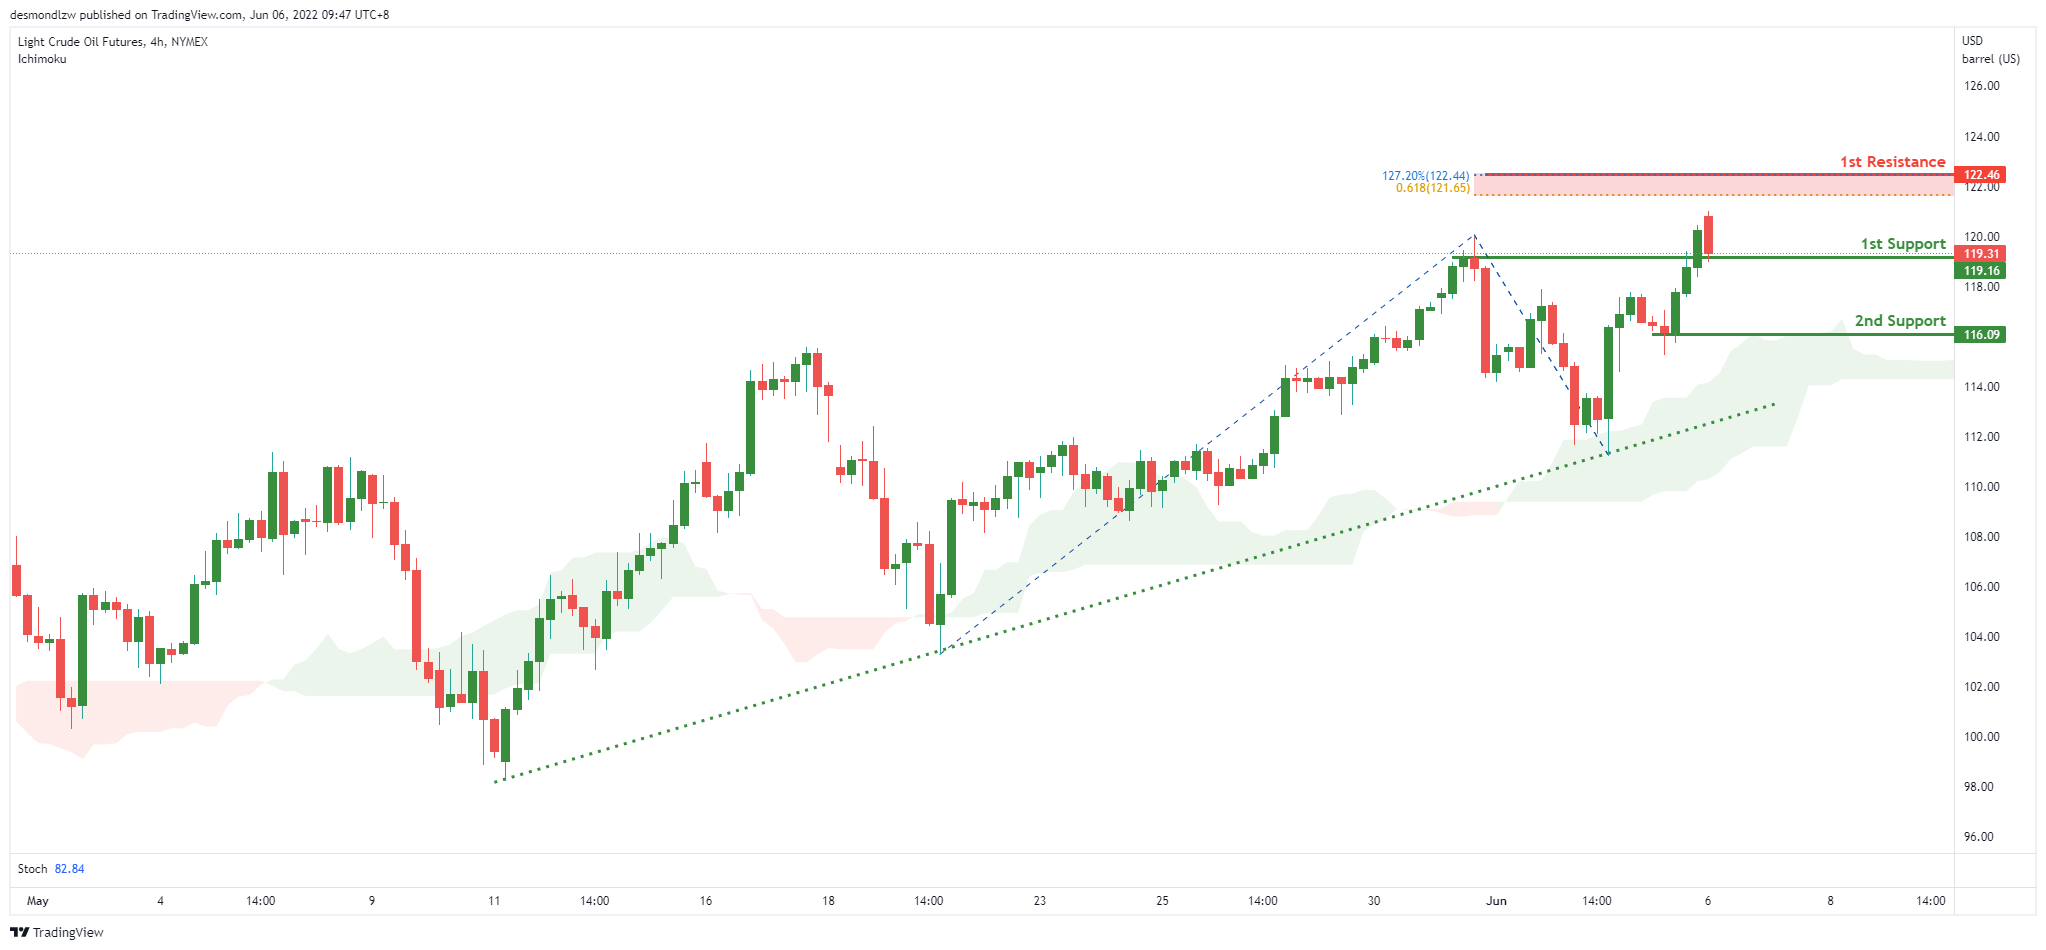
OIL:
On the H4, with price moving above the ichimoku cloud, we have a bullish bias that price will rise from our 1st support at 119.16 where the horizontal pullback support is to our 1st resistance at 122.46 in line with the 61.8% fibonacci projection and 127.2% Fibonacci extension. Alternatively, price may break structure and head for 2nd support at 116.09.
Areas of consideration:
- H4 time frame, 1st resistance of 114.56
- H4 time frame, 1st support of 111.83
Dow Jones Industrial Average:
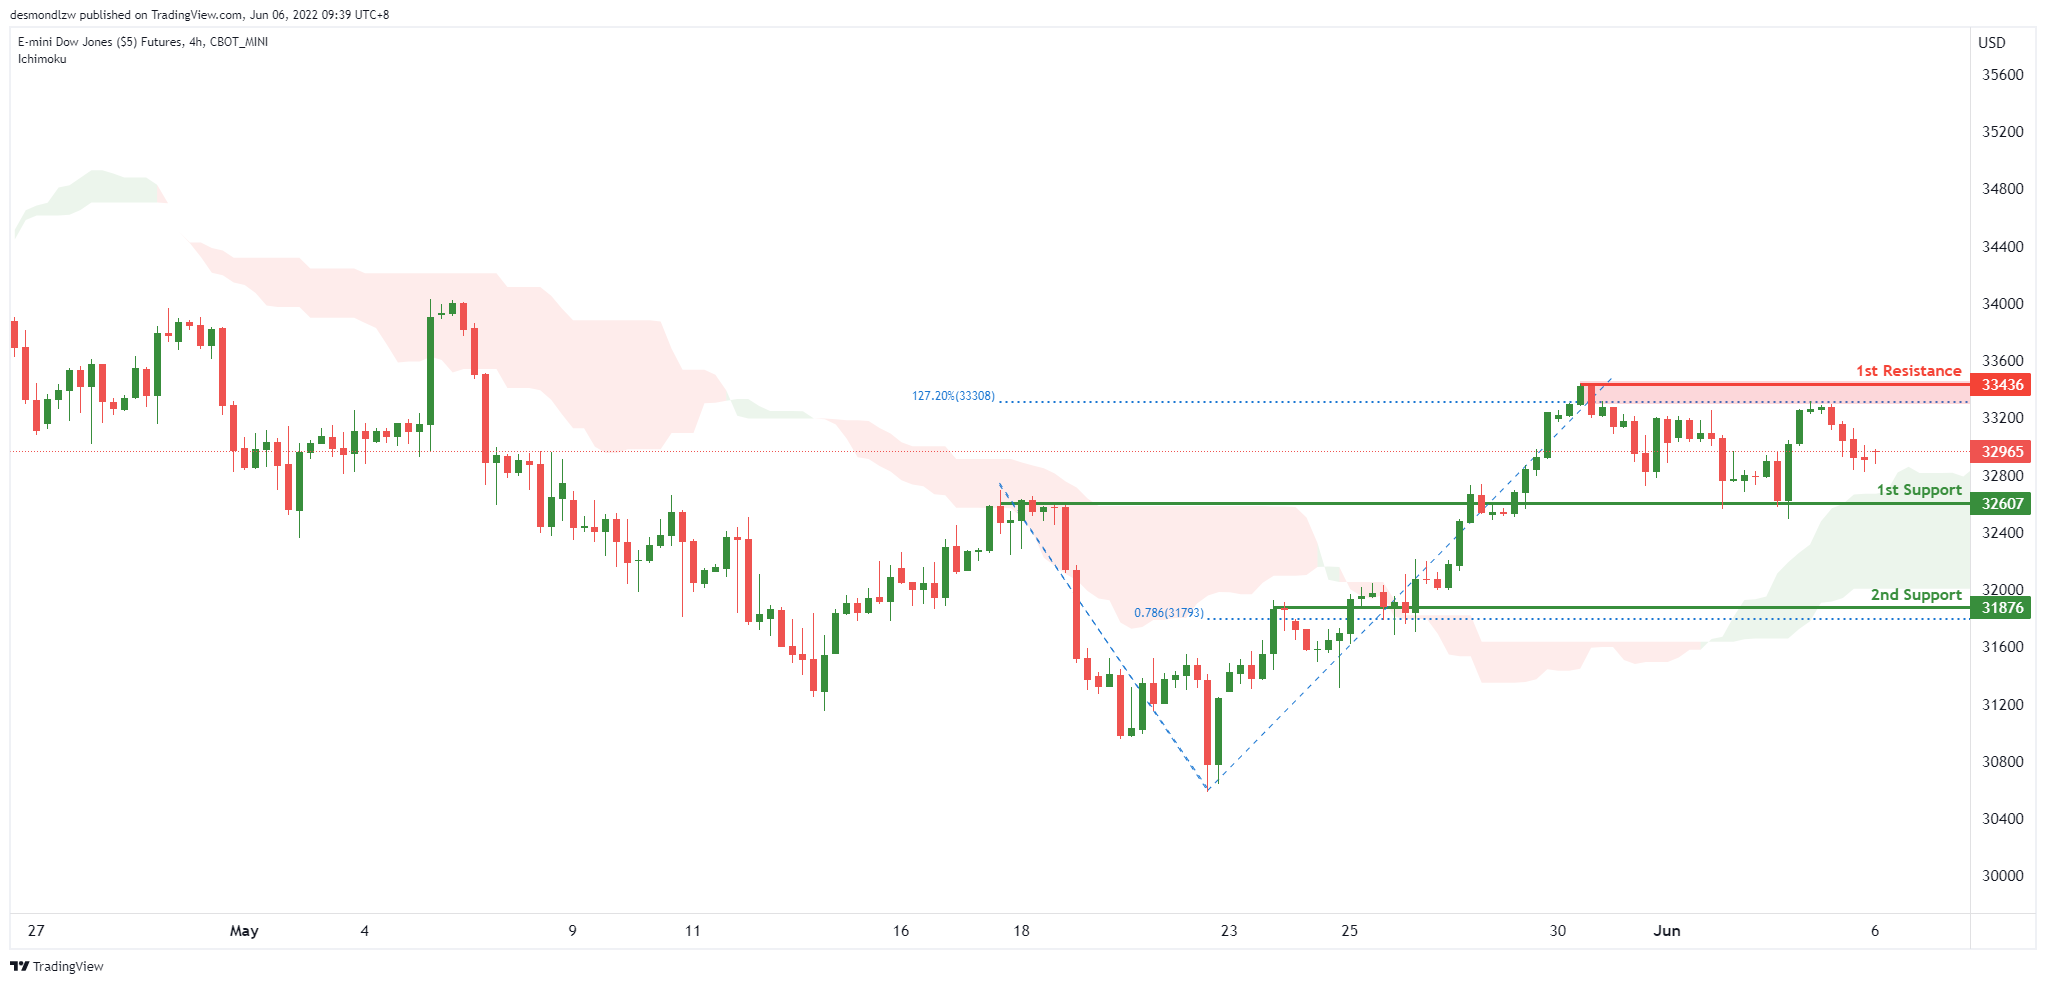
On the H4, with price moving above the ichimoku cloud, we have a bullish bias that price will rise from our 1st support at 32607 where the horizontal pullback support is to our 1st resistance at 33436 in line with the swing high resistance and 127.2% Fibonacci extension. Alternatively, price may break structure and head for 2nd support at 31876.
Areas of consideration :
- H4 time frame, 1st resistance at 33463
- H4 time frame, 1st support at 32607
Eco Data 6/6/22
[php_everywhere instance="1"]
Forex and Cryptocurrency Forecast
EUR/USD: Inflation and Labor Market Decide It All
The total result of the week can be considered close to zero. If the EUR/USD pair completed the previous five-day period at 1.0730, the final chord sounded at 1.0720 this time. At the same time, we cannot say that the past week was very boring: the maximum volatility was 160 points, 1.0786 at the high and 1.0626 at the low.
The DXY dollar index fell to a 5-week low of 101.29 on Monday, May 30. The reason was the expectation that the Fed may suspend the cycle of raising interest rates after raising it in June and July. Of course, provided that inflation in the US goes down.
However, the trend reversed on Tuesday. There was data from the Eurozone, according to which inflation there soared to a record level. Bloomberg's consensus forecast assumed a 7.8% increase in consumer prices in May. However, according to the European Union Statistics Office, they rose by 8.1% in annual terms after rising by 7.4% in April, which was the highest figure in the history of calculations. Oil prices have also risen to their highs since the beginning of March. As a result, the yield on US 10-year bonds began to rise again, reaching its highest level since May 19, at 2.88%. Along with treasuries, the dollar began to strengthen, and the EUR/USD pair went south, reaching the local weekly bottom on June 01.
The trend changed once again on Thursday, June 02 after the release of data from the US labor market. Employment in the country was expected to grow by 300K. However, in reality, the growth was only 128K, which is clearly not enough to maintain stability in the labor market and threatens unemployment. The negative picture was somewhat corrected by the number of new jobs created outside the agricultural sector (NFP). This indicator was published at the very end of the working week and amounted to 390K with the forecast of 325K and the previous value of 436K. A little more than 200K new jobs need to be created each month to keep the US job market stable. So the NFP of 390K looks pretty positive. As for unemployment, it did not change over the month and remained at the level of 3.6% in May, which is lower than the forecast of 3.5%.
The EUR/USD pair is now trading close to the 2015-2016 lows, while the DXY index has caught up with the December 2016 high, which is the highest point in the last 20 years.
Some currency strategists, such as, for example, analysts at the Swiss holding UBS Wealth Management, believe that the growth of the dollar may stop. The market has already taken into account in quotations both the tightening of monetary policy by the US Central Bank and the rise in interest rates, and no new triggers for the next rally are expected. So, in their opinion, the rise of the EUR/USD pair in the last three weeks may turn out to be not just a technical correction, but a change in the medium-term trend.
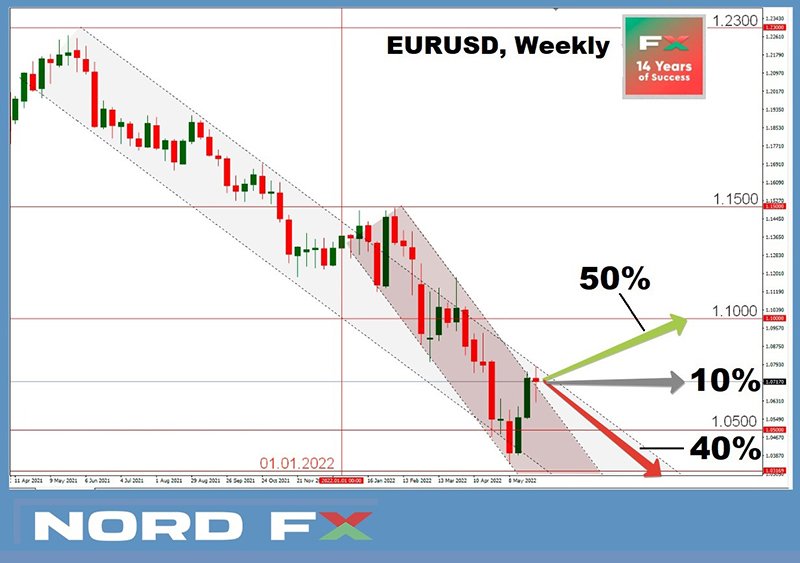
65% of analysts agree that the pair will try to break through the 1.0800 resistance next week, 35% expect the pair to return to May lows and the remaining 10% are neutral. It should be noted that with the transition from a weekly to a monthly forecast, the number of bull supporters decreases to 50%, and their maximum target is the zone 1.0900-1.1000. As for oscillators on D1, 80% are colored green (a quarter of them are in the overbought zone), and 20% are neutral gray. There is parity among the trend indicators: 50% vote for the growth of the pair, 50% for its fall. The nearest resistance is located in zone 1.0750-1.0800. If successful, the bulls will try to break through the resistance of 1.0900-1.0945, then 1.1000 and 1.1050, after which they will meet resistance in the 1.1120-1.1137 zone. For the bears, task number 1 is to break through the support of 1.0625-1.0640, then 1.0480-1.0500, and then update the May 13 low at 1.0350. If successful, they will move on to assault the low of January 01, 2017, at 1.0340, below there are only the goals of 20 years ago.
Eurozone GDP data will be released on Wednesday, June 08. However, the key event of the upcoming week will certainly be the ECB meeting on Thursday June 09. Markets are waiting for the decision of the European regulator on the interest rate, which is currently 0%, as well as for the comments on further monetary policy. In addition, the number of initial jobless claims in the US will also become known on Thursday, and a whole package of data on the US consumer market will be published on Friday, June 10.
GBP/USD: In Anticipation of Inflation Forecast
Great Britain celebrated the "platinum" anniversary of Elizabeth II on Thursday, June 02: the 70th anniversary of her accession to the throne of the United Kingdom of Great Britain and Northern Ireland (it happened in 1952). Bank holidays were announced in the country on this occasion, on June 02 and 03.
Other economic events of the week include the publication of the UK Manufacturing PMI, which was slightly lower in May than the April value: 54.6 against 55.8, but it exactly corresponded to the forecast, so the market reacted sluggishly to it. In general, the dynamics of the pair resembled the dynamics of EUR/USD, although the downward pressure in this case was stronger. Like a week earlier, the GBP/USD pair remained in the side corridor of 1.2460-1.2665 and ended the trading session at 1.2497.
Data on business activity in the UK construction and services sectors, as well as the Composite Business Activity Index (PMI), will be published on Tuesday, June 7 and Wednesday June 8. In addition, the Bank of England will publish its latest review of inflation expectations at the end of next week. According to forecasts, they will be significantly higher than the historical maximum (4.4% in 2008), and a jump to 5.0% and above will increase the likelihood of a further increase in the key interest rate on the British pound. A by-election should also take place at the end of June, which will be seen as a test of support for the policies of Prime Minister Boris Johnson and the Conservative Party.
In anticipation of these events, forecasts for the pound look very uncertain. At the moment, 40% have voted for its strengthening, 40% - for weakening and 20% - for the continuation of the sideways trend. Among the trend indicators on D1, only 10% indicate the growth of the pair, 90% indicate a fall. Among the oscillators, the ratio of forces is slightly different: 25% look to the south, 35% is neutral, 40% point to the north. Supports are located at 1.2460, 1.2400, 1.2370, 1.2300, 1.2200, then 1.2154-1.2164 and 1.2075. A strong point of support for the pair is at the psychologically important level of 1.2000. In case of growth, the pair will have to overcome the resistance of 1.2600, and then 1.2665, 1.2700-1.2750, 1.2800-1.2835 and 1.2975-1.3000.
USD/JPY: The Pair Is On the Way to 20-Year Highs
The rising dollar is also pushing the USD/JPY pair to update its 20-year highs. It reached a height of 130.97 last week, coming close to the May 09 high of 131.34.
Listing above the reasons for the strengthening of the American currency, we did not mention another one: the meeting of US President Joe Biden with Fed Chairman Jerome Powell on Tuesday, May 31. The central topic of discussion was inflationary pressure, causing discontent among all segments of the country's population. As a result, Joe Biden gave the head of the US Central Bank full independence in the fight against inflation and allowed the use of all the tools available to the regulator, including an aggressive increase in interest rates and a $9 trillion reduction in the balance sheet.
As for the Bank of Japan, it is still not ready to curtail its ultra-soft policy. According to this regulator, monetary stimulus should help the country's economy recover from the doldrums caused by the COVID-19 pandemic. Weak economic statistics played against the yen as well. The volume of industrial production in Japan in April fell by 1.3%, instead of the expected reduction by 0.2%. A new round of the coronavirus pandemic in China was named as the reason.
At the moment, only 25% of experts vote for a new assault on the height of 131.34, 65% expect a rollback to the south, and the remaining 10% have taken a neutral position. Indicators have a completely different picture. Both for trend indicators on D1 and for oscillators, all 100% are colored green. True, as for the latter, 20% is in the overbought zone.
The nearest support is located at 129.70-130.20, followed by zones and levels 128.60, 128.00, 127.50, 127.00, 126.00-126.35 and 125.00. The target of the bulls is to renew the May 09 high at 131.34. As the ultimate goal, the January 01, 2002 high of 135.19 is seen.
Data on Japan's GDP for the Q1 of this year will be published next week, on Wednesday, June 08. This indicator is expected to be minus 0.3% (previous value was minus 0.2%). Such a fall will be another argument for the Bank of Japan in favor of maintaining monetary stimulus and negative interest rate.
CRYPTOCURRENCIES: From $8,000 to $1,555,000 per 1 BTC
Bitcoin's current small rally has been labeled by some analysts as a "typical bull trap". And if you look at the chart, we can only admit that they are right: a sharp rise to $32,490 at the beginning of the week and then an equally sharp fall and return to the Pivot Point of the last three weeks, the level of $30,000.
Also, if we compare the charts of BTC / USD and the S&P500, Dow Jones and Nasdaq stock indices, it becomes clear that the attempt of the main cryptocurrency to start living its own life has failed. And bitcoin is once again following the stock market, albeit with some delay.
At the time of writing this review, on the evening of Friday 03 June, the total capitalization of the crypto market is at the level of $1.225 trillion ($1.194 trillion a week ago). The Crypto Fear & Greed Index is firmly entrenched in the Extreme Fear zone and is at around 10 points (12 a week ago). The BTC/USD pair is trading at $29.770.
According to a report by analyst firm Glassnode, long-term BTC holders are the only ones who didn't lose their heads in the bear market and continue to buy the asset around the $30,000 mark. The current accumulation process mainly involves wallet owners with balances of less than 100 BTC and more than 10,000 BTC. The volumes of the former have increased by 80,724 BTC, the latter - by 46.269 BTC. At the same time, the total number of wallets with non-zero balances indicates the absence of new buyers. A similar situation was observed after the May 2021 sale. Unlike the sales of March 2020 and November 2018, followed by a surge in online activity and new bull runs, the latest sale does not yet boast an influx of new users.
Moreover, leading mining companies are gradually leaving the ranks of holders. An analytical report by Compass Mining notes that the influx of coins from miners has reached its highest level since January. The fact is that the profitability of mining is falling due to halvings and increasing computational complexity. And it is necessary to pay off loans and other obligations and support operational activities. So mining companies have to part with their own BTC reserves.
As an example, let's take such a long-term holder as Marathon Digital. This company, like a number of others, has long been unprofitable, while it needs to raise about half a billion dollars until the end of 2022. Therefore, it is possible that Marathon Digital will be soon forced to sell some of its 10,000 BTC coins.
Analyst Capo, who previously predicted bitcoin to fall below $30,000, expects altcoins and bitcoin to fall further: "My opinion has not changed, and I expect altcoins to fall by 40-60%, and bitcoin by 25-30%. Then it will take 1 to 3 months to recover." The analyst noted that the S&P500 index is now in the region of a strong resistance level (4,150-4,200), and this may cause a resumption of the bearish trend for both the stock and cryptocurrency markets.
Another crypto strategist and trader, Kevin Swanson, disagrees with Capo, he predicts bitcoin will rise to $37,000 in the coming weeks. True, this movement will alternate with sharp declines, such as on June 01. Swanson's take on bitcoin's upward bounce is based on his thesis that BTC made a temporary bottom around $26,700 on May 12. "Looking at the 2021 low [$29,000]," he writes, "one would think that bitcoin is unlikely to go lower. This makes me think that this bottom [$26,700] could act as a long-term support zone."
Alex Mashinsky, CEO of Celsius crypto company, believes that the fall in the market has been too long and cryptocurrencies are waiting for a bullish trend with an eight-fold increase in bitcoin. In an interview with Kitco News, he stated that the cryptocurrency markets will recover and even inflation will not be a long-term problem for them. "You can push the spring as hard as you want, but the harder you push, the more it bounces."
The head of Celsius noted that even large investment bankers are increasingly involved in cryptocurrency. "Even JPMorgan, which usually doesn't talk about cryptocurrency, released a report the other day claiming that panic may be exaggerated and is expected to rebound to $38,000 from where we we are today."
Scott Maynard, Chief Investment Officer at Guggenheim, opined at the Davos Forum that the "fundamental price of bitcoin" is in the $400,000 region. Such a high estimate is due to the effect of the "unrestrained printing of US dollars" by the US Federal Reserve. At the same time, he believes that the market may see a bottom for bitcoin in the $8,000 area.
Ki Young Ju, head of market data platform CryptoQuant, believes BTC will not fall below $20,000. This statement was supported by the expert with the remark that "support by institutional investors is at an unprecedented high level." Ju cited data on the work of the Coinbase Custody exchange. According to the charts, the volume of bitcoins under management has continuously increased for 5 quarters, from October 2020 to December 2021. The increase was 296% at the end of the period, reaching 2.2 million BTC.
Based on the data obtained, Ju concluded that in order to reduce the cost of BTC to the level of $20,000, it is necessary to sell off all the capital accumulated during the period of consolidation to the level of 500 thousand dollars. BTC. According to the crypto analyst, institutions are not yet ready for this step. The expert added that the value of the coin is likely to have already reached the bottom of this decline cycle.
Venture capitalist Tim Draper confirmed his prediction that the price of bitcoin will exceed six figures in the coming months. He reiterated in a new interview that the coin will reach a price of $250,000 "by the end of this year or the beginning of next". Tim Draper believes that women will drive the adoption and growth of bitcoin, and the fact that they will increasingly use this cryptocurrency for purchases will be a catalyst.
"Recently we had 1 woman for 14 bitcoin holders, now it's something like 1 to 6. And I think there will be more eventually. What I mean is that women control about 80% of retail spending. If suddenly all women have crypto wallets and they buy things with bitcoins, everything will change. And you will see the price of the coin, which will surpass my estimate of $250,000," the investor said.
According to a study by the largest US bank JPMorgan, the dynamics of the volatility of gold and bitcoin caught up and they began to move in unison. Moreover, the bank's experts do not exclude that in the future the capitalization of the two investment assets will be equal, since in the eyes of investors, bitcoin is more in line with the role of a hedge asset.
Analysts at the crypto channel InvestAnswers considered three options, according to which the capitalization of bitcoin can reach 40%, 60% or 100% of the capitalization of gold. In this case, the price of BTC could be around $515,000, $786,000 or $1,300,000, respectively, by 2030. If we take a combination of all 3 aforementioned rate benchmarks, the average expected target is around $867,000.
And another target level was determined by InvestAnswers experts by choosing the average value of a selection of forecasts from Fidelity, ARK Invest and other companies. By combining some of the well-known crypto models, they came to the BTC rate around $1,555,000 for 1 coin.
EUR/USD Weekly Outlook
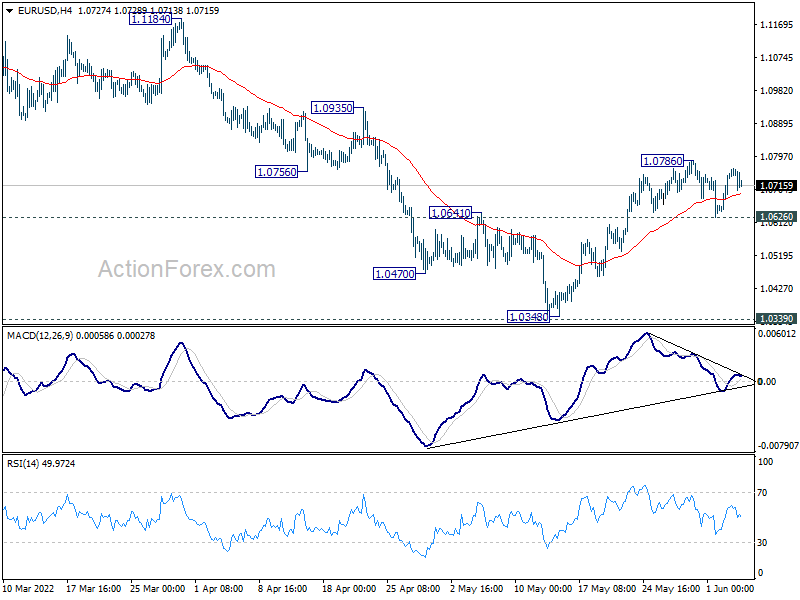
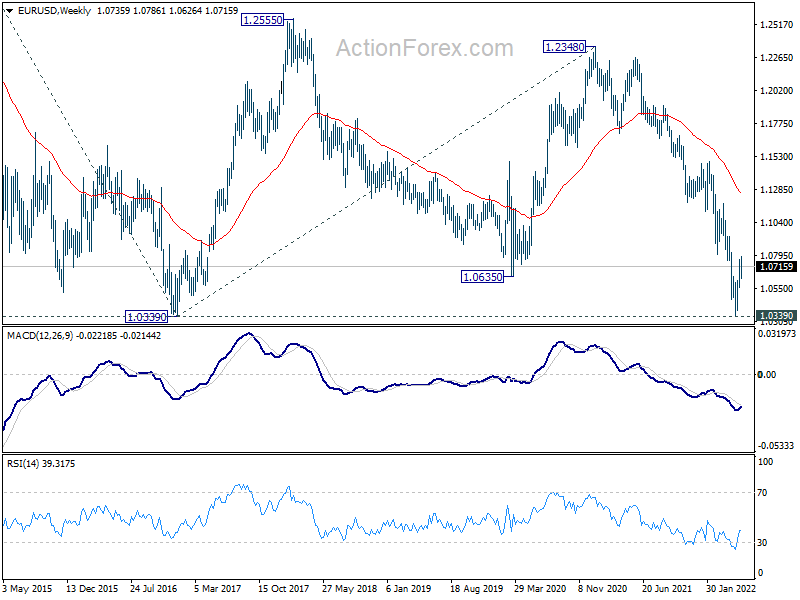
EUR/USD edged higher to 1.0786 last week but turned sideway since then. On the downside, break of 1.0626 minor support will indicate rejection by 55 day EMA, and turn bias back to the downside for retesting 1.0348. On the upside, break of 1.0786, and sustained trading above 55 day EMA (now at 1.0757) will target 1.0935 resistance next.
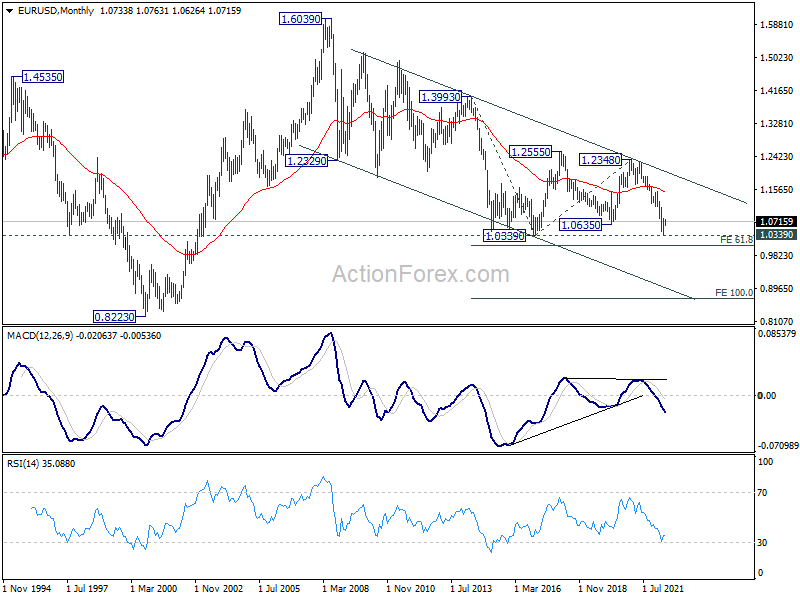
In the bigger picture, focus stays on 1.0339 long term support (2017 low). Decisive break there will resume whole down trend from 1.6039 (2008 high). Next target is 61.8% projection of 1.3993 to 1.0339 from 1.2348 at 1.0090. However, firm break of 1.0805 support turned resistance will delay this bearish case and bring medium term corrective rebound first.
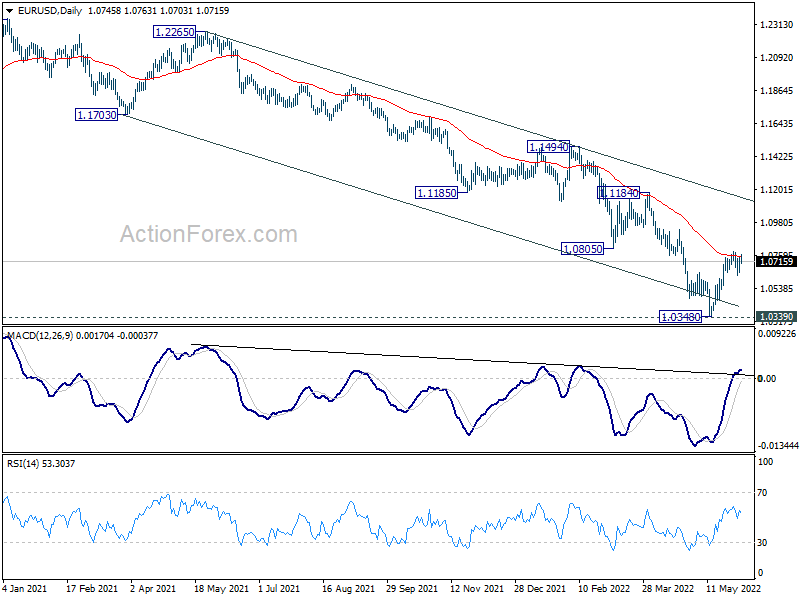
In the long term picture, current development suggests that long term down trend from 1.6039 (2008 high) is ready to resume. Break of 1.0339 will target 61.8% projection of 1.3993 to 1.0339 from 1.2348 at 1.0090. Decisive break there could bring downside acceleration towards 100% projection at 0.8694.
USD/JPY Weekly Outlook
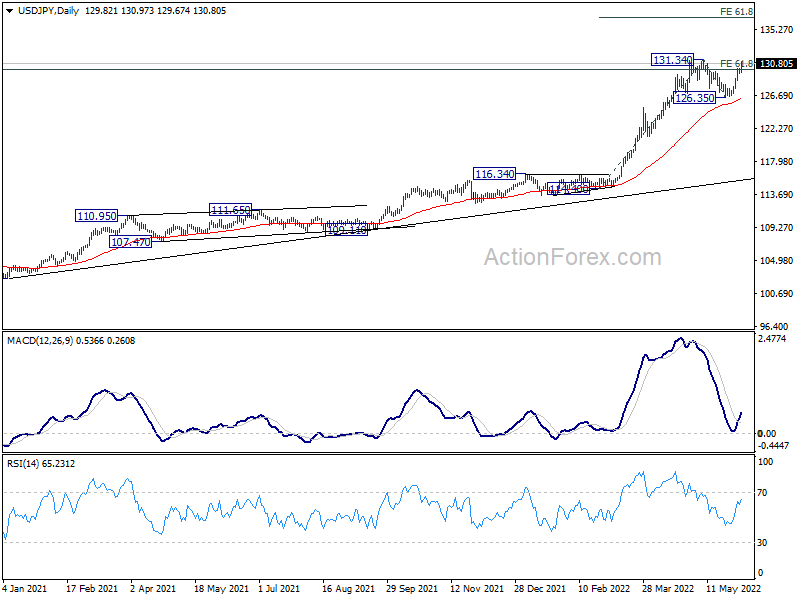
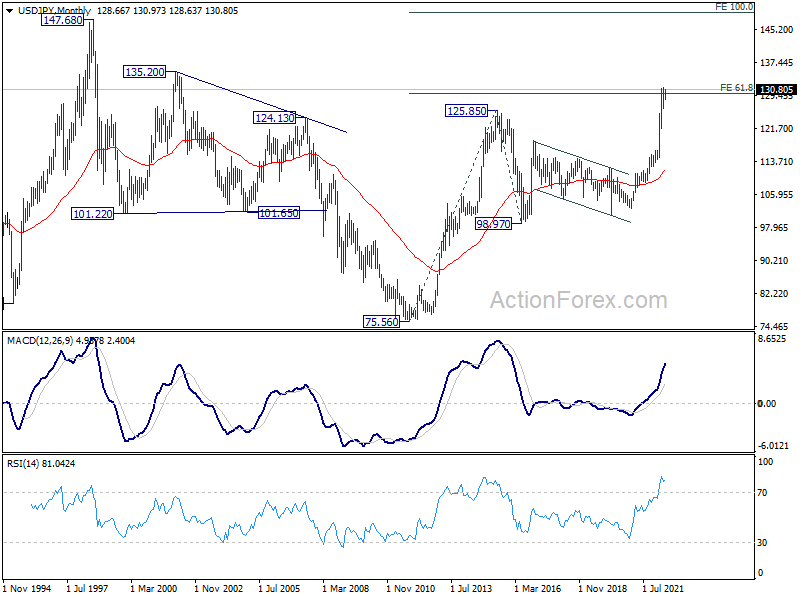
USD/JPY rebounded strongly last week and initial bias stays on the upside this week. Decisive break of 131.34 resistance will confirm larger up trend resumption. Next target is 61.8% projection of 114.40 to 131.34 from 126.35 at 136.81. On the downside, below 129.50 minor support will delay the bullish case and turn intraday bias neutral first.

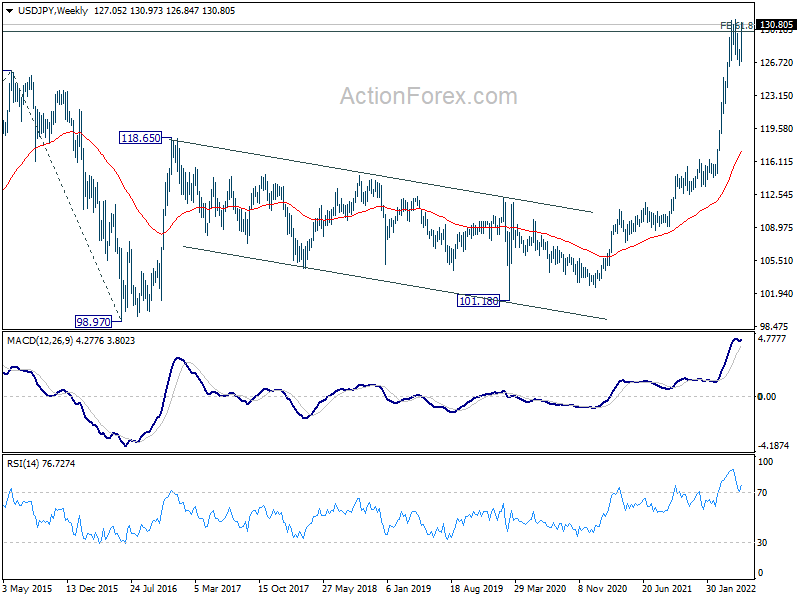
In the bigger picture, current rally is seen as part of the long term up trend form 75.56 (2011 low). Sustained trading above 61.8% projection of 75.56 (2011 low) to 125.85 (2015 high) from 98.97 at 130.04 will pave the way to 100% projection at 149.26, which is close to 147.68 (1998 high). For now, this will remain the favored case as long as 126.35 support holds.
In the long term picture, the up trend from 75.56 (2011 low) long term bottom to 125.85 (2015 high) has just resumed. First target at 61.8% projection of 75.56 to 125.85 from 98.97 at 130.04 was already met. Next is 100% projection at 149.26, which is close to 147.68 (1998 high).
GBP/USD Weekly Outlook
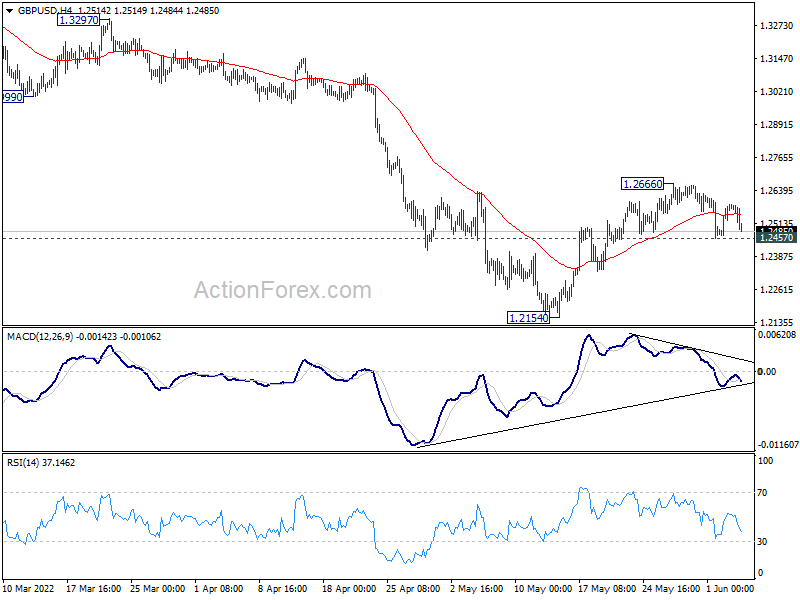
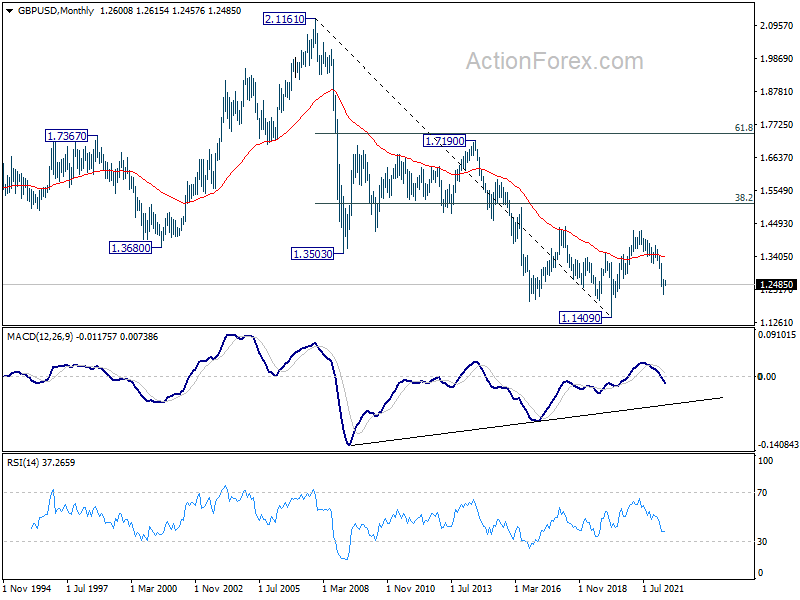
GBP/USD retreated last week but stayed in tight range. Initial bias remains neutral this week first. On the downside, break of 1.2457 minor support will suggest that rebound from 1.2154 has completed. Intraday bias will be back on the downside for resting this low. On the upside, above 1.2666 will target 55 day EMA (now at 1.2722).
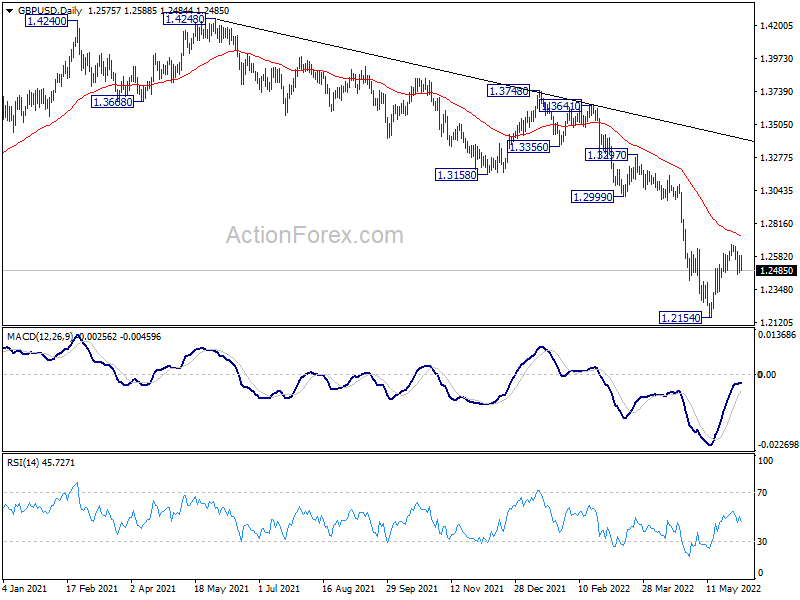
In the bigger picture, fall from 1.4248 (2018 high) could be a leg inside the pattern from 1.1409 (2020 low), or resuming the longer term down trend. Deeper decline is expected as long as 1.2999 support turned resistance holds. On resumption, next target is 1.1409 low.
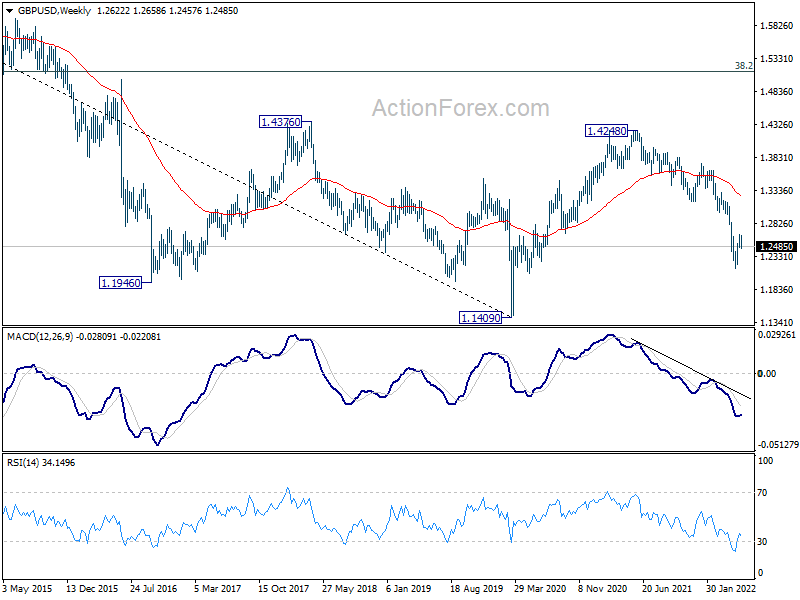
In the longer term picture, rebound from 1.1409 long term bottom should have completed at 1.4248 already, well ahead of 38.2% retracement of 2.1161 to 1.1409 at 1.5134. The development argues that price actions from 1.1409 are developing into a corrective pattern only. That is, long term bearishness is retained for resuming the downside from 2.1161 (2007 high) at a later stage.
USD/CHF Weekly Outlook
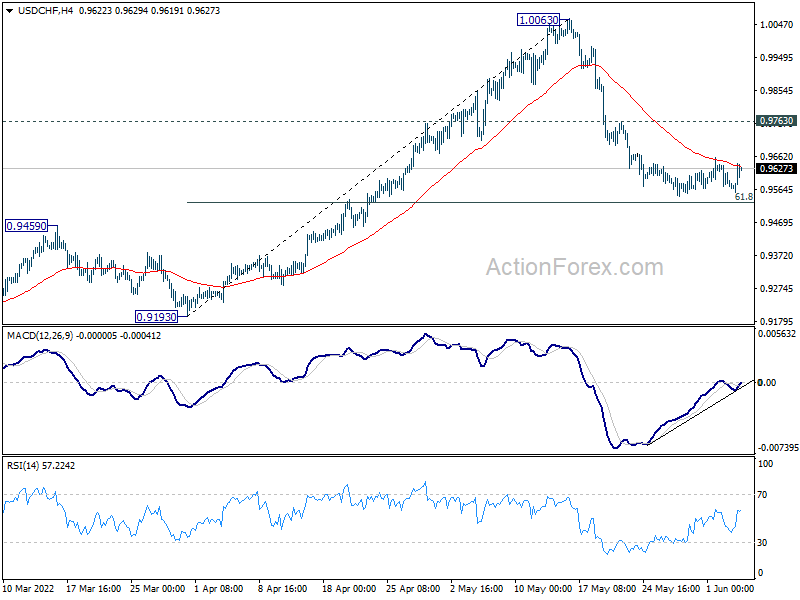
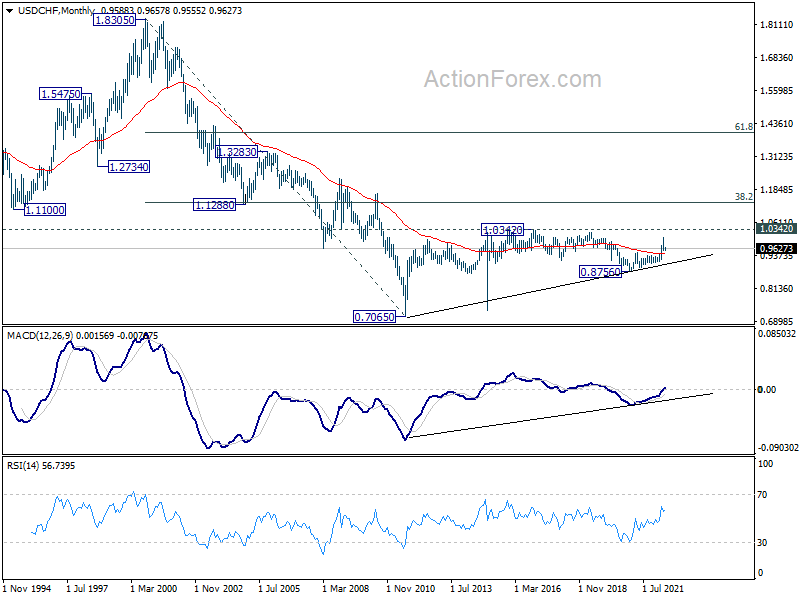
USD/CHF stayed in range last week and outlook is unchanged. Strong support is expected at 61.8% retracement of 0.9193 to 1.0063 at 0.9525 to complete the pull back from 1.0063. On the upside, above 0.9763 minor resistance will turn bias back to the upside for retesting 1.0063 high. However, sustained break of 0.9525 will bring deeper decline to 0.9193 support.
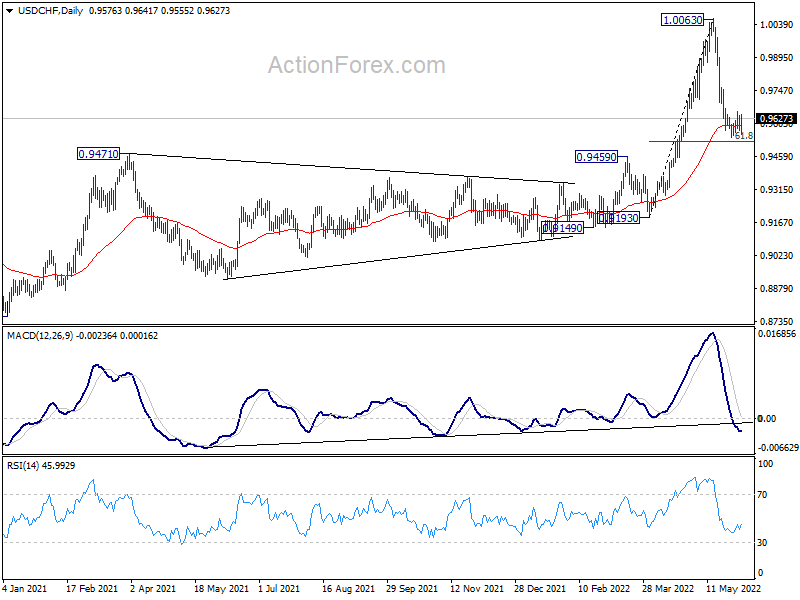
In the bigger picture, down trend from 1.0342 (2016 high) should have completed with three waves down to 0.8756 (2021 low) already. Rise from 0.8756 is likely a medium term up trend of its own. Next target is 1.0237/0342 resistance zone. This will remain the favored case as long as 0.9471 resistance turned support holds. However, sustained break of 0.9471 will extend long term range trading with another falling leg.
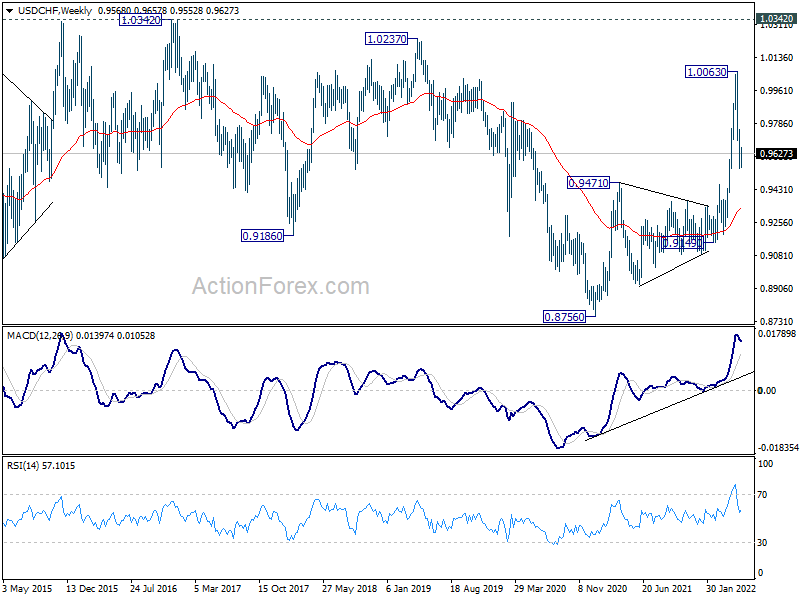
In the long term picture, current development argues that the correction from 1.0342 (2016 high) has completed at 0.8756 (2020 low) already. Rise from 0.7065 (2011 low) might be ready to resume. Firm break of 1.0342 will confirm and target 38.2% retracement of 1.8305 (2000 high) to 0.7065 at 1.1359.
AUD/USD Weekly Outlook
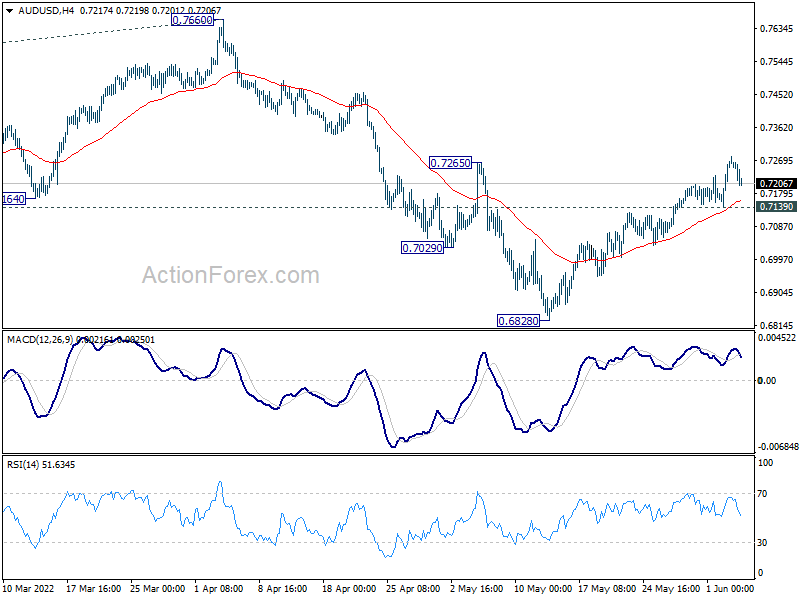
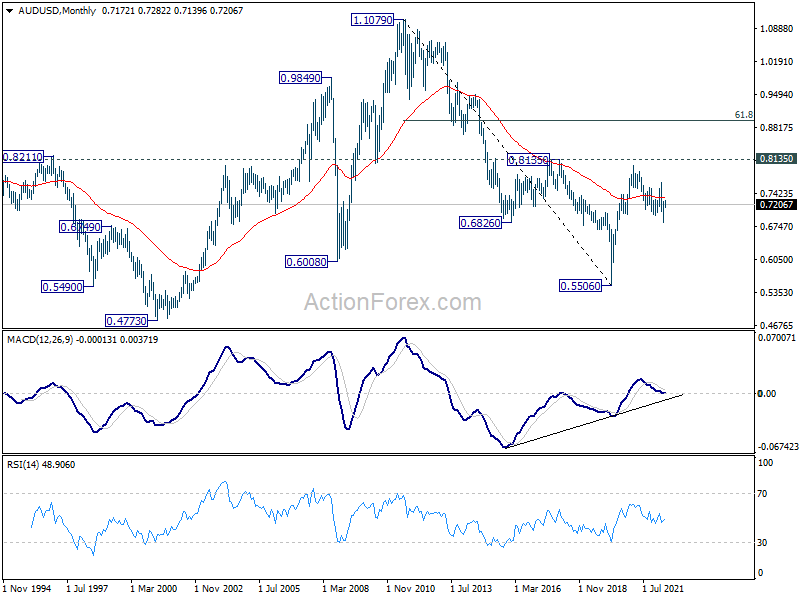
AUD/USD's rebound from 0.6828 extended higher last week. Current development raised the chance that whole fall corrective fall from 0.8005 has completed at 0.6828. Initial bias stays on the upside this week for 0.7660 resistance. On the downside, however, break of 0.7139 minor support will mix up the outlook and turn intraday bias neutral first.
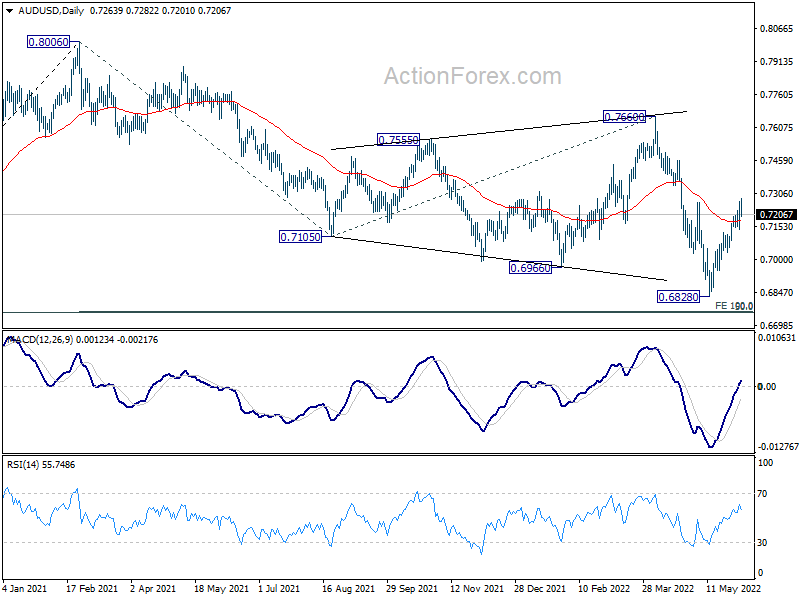
In the bigger picture, price actions from 0.8006 are seen as a corrective pattern to rise from 0.5506 (2020 low). Deeper fall could be seen to 50% retracement of 0.5506 to 0.8006 at 0.6756. This coincides with 100% projection of 0.8006 to 0.7105 from 0.7660 at 0.6760. Strong support is expected from 0.6756/60 cluster to contain downside to complete the correction. Meanwhile, firm break of 0.7660 resistance will confirm that such corrective pattern has completed, and larger up trend is ready to resume.
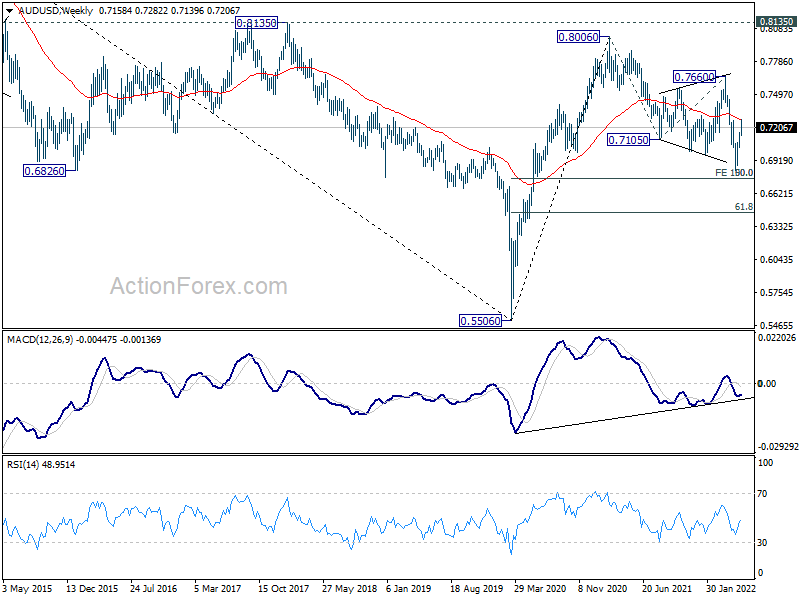
In the longer term picture, focus remains on 0.8135 structural resistance. Decisive break there will argue that rise from 0.5506 is developing into a long term up trend that reverses whole down trend from 1.1079 (2011 high). However, rejection by 0.8135 will keep long term outlook neutral at best.
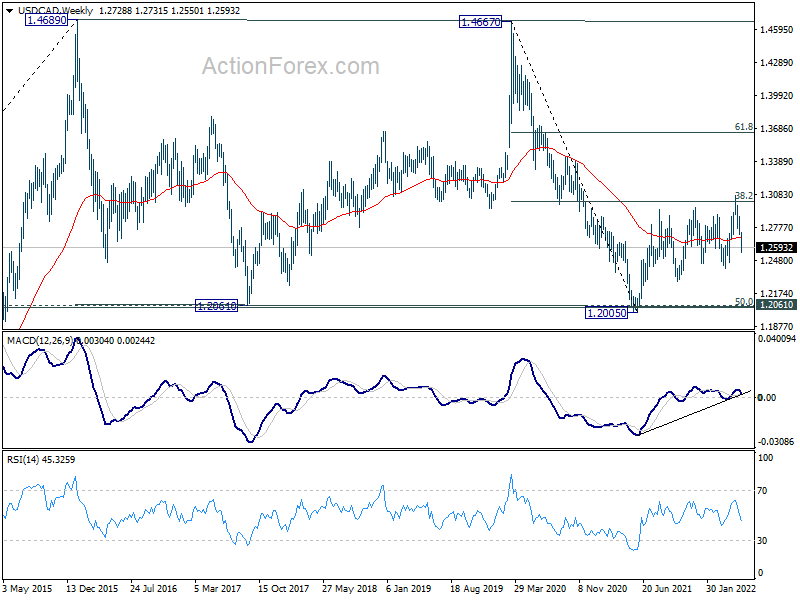
USD/CAD Weekly Outlook
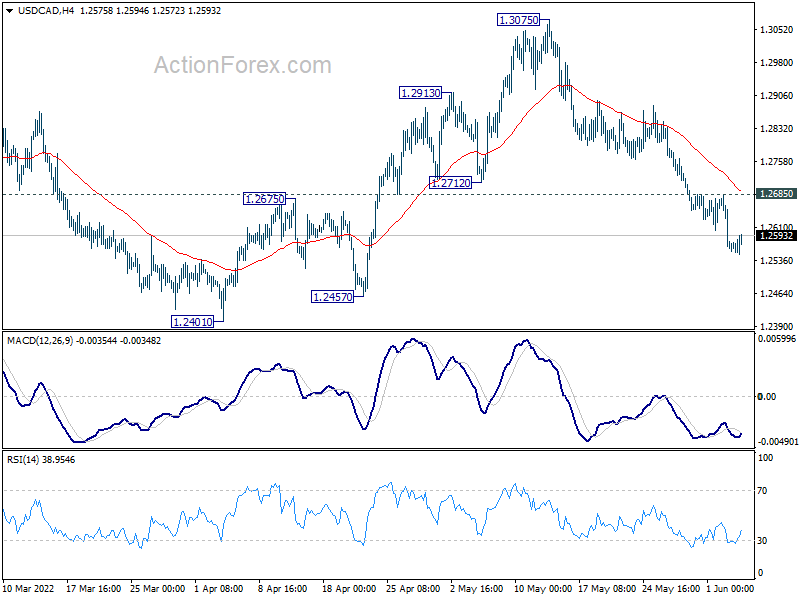
USD/CAD's fall from 1.3075 extended lower last week. Initial bias remains on the downside this week for 1.2401 support. Decisive break there will argue that whole rebound from 1.2005 has completed, after rejection by 1.3022 fibonacci resistance. Deeper fall would then be seen to retest this low. On the upside, above 1.2685 minor resistance will mix up the near term outlook and turn intraday bias neutral first.
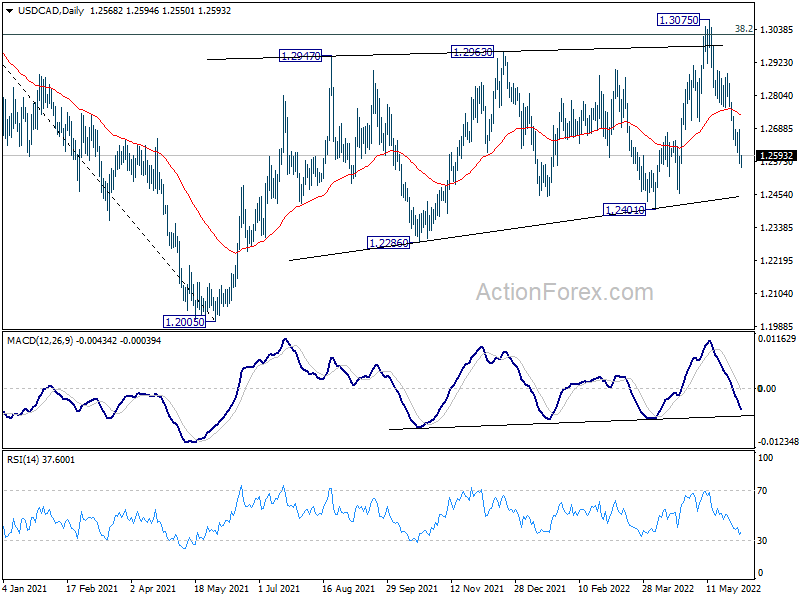
In the bigger picture, focus stays on 38.2% retracement of 1.4667 (2020 high) to 1.2005 (2021 low) at 1.3022. Sustained break there should confirm that the down trend from 1.4667 has completed after defending 1.2061 long term cluster support. Further rise would then be seen towards 61.8% retracement at 1.3650. However, rejection by 1.3022 will maintain medium term bearishness. Break of 1.2005 will resume the down trend from 1.4667 and that carries larger bearish implications too.
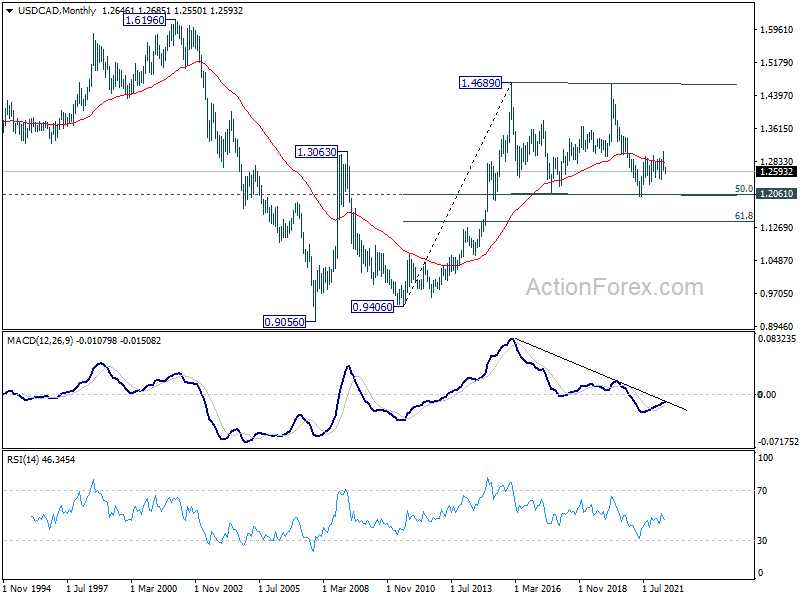
In the longer term picture, price actions from 1.4689 (2016 high) are seen as a consolidation pattern only. That is, up trend from 0.9506 (2007 low) is still expected to resume at a later stage. This will remain the favored case as long as 1.2061 support holds, which is close to 50% retracement of 0.9406 to 1.4689 at 1.2048. However, firm break of 1.2061 support will argue that USD/CAD has already started a long term down trend. Next target is 61.8% retracement of 0.9406 to 1.4689 at 1.1424.