Sample Category Title
AUD/USD Pair Entered a Short-Term Bearish Zone Below $0.7250
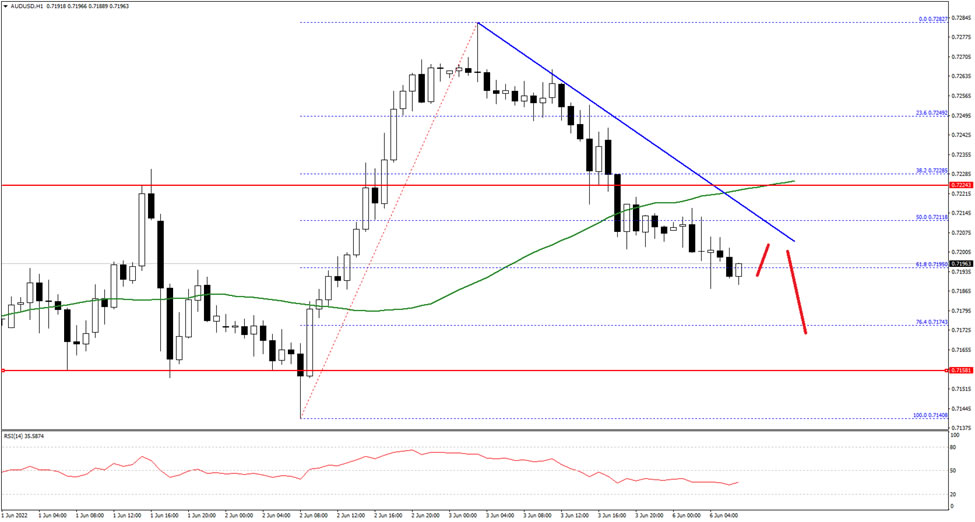
The Aussie Dollar started a fresh decline from the 0.7280 zone against the US Dollar. The AUD/USD pair traded below the 0.7250 support zone to enter a short-term bearish zone.
The pair gained pace for a move below the 0.7220 and settled below the 50 hourly simple moving average. The pair is now showing a few bearish signs below the 0.7200 level. An immediate resistance is near the 0.7205 level and a bearish trend line on the hourly chart.
The next key resistance on the upside is near the 0.7225 level. If there is an upside break above the 0.7225 level, the pair could rise steadily towards the 0.7280 level in the near term. Any more gains could send the pair towards 0.7320 on FXOpen.
An immediate support on the downside is near the 0.7180 level. The next key support is near the 0.7150 level. A downside break below the 0.7150 support could lead the pair towards the 0.7080 support.
Elliott Wave Analysis: Rally on Silver Can Extends Above $23
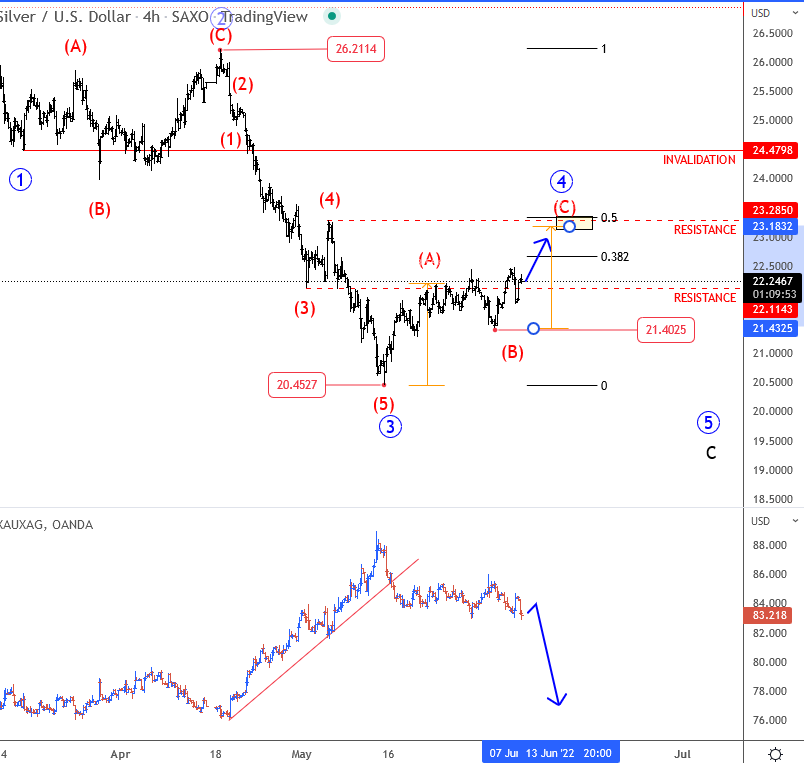
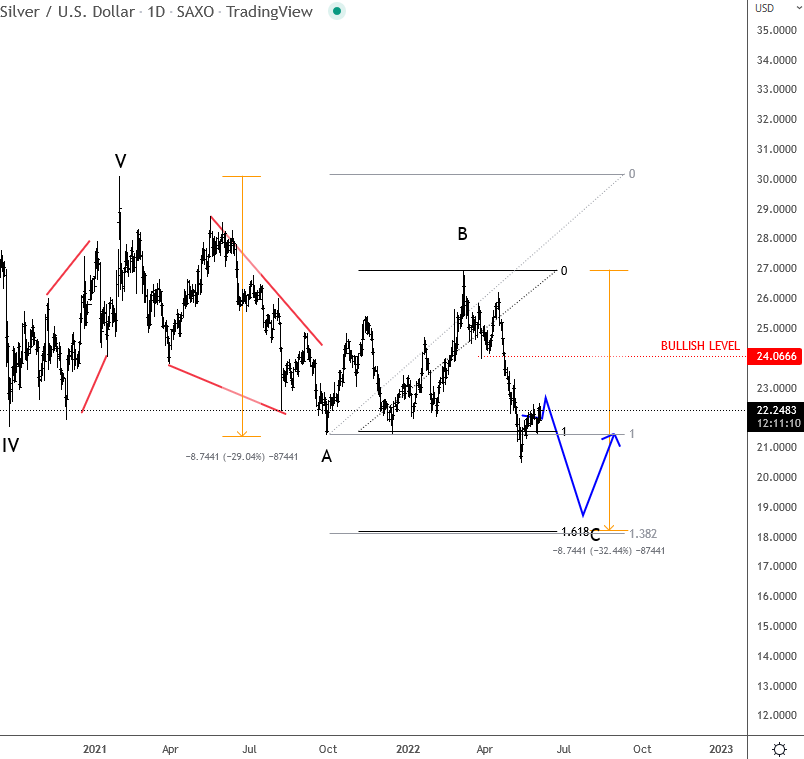
Silver is still trading in a monthly correction within wave (B)/(2), but bears slowed down after reaching 20.00 support area which is fine as we can count five waves down from 26.20, within extended wave 3. We know that correction is normal in these developments so ideally, this is now a temporary pause within a downtrend; a bear market rally in wave 4, that can possibly reach even 23.28 resistance of a former wave four. Gold/silver ratio also can be looking for a lower prices which is bullish metals, short-term.
US Equity Futures Point Higher on Tariff Relief Hopes
US stocks stabilized slightly in the futures market after Gina Raimondo, the Commerce Secretary, hinted that the government could remove the tariffs that were implemented by Donald Trump. In the statement, she hinted that steel and aluminum tariffs will keep them intact in a bid to protect American workers. Some of those items whose tariffs could be removed include household goods and other products like bicycles and furniture. The president is expected to determine what to do with those tariffs in the coming weeks. While some industries have benefited from those tariffs, others have not, and the US trade deficit has widened.
The British pound moved sideways against the US dollar as investors reacted to ongoing political drama in the UK. It is estimated that some rebel Tory members of parliament will table a vote of no confidence in the coming days. Johnson has insisted that he won’t step down over the parties that were held in Downing Street during lockdowns. The political drama is happening as the UK has a long weekend to celebrate the Queen’s Jubilee.
The economic calendar will have no major events today. Still, investors will be looking forward to a busy week. The highlights will be interest rate decisions by the Reserve Bank of Australia (RBA) and the European Central Bank (ECB). The RBA is expected to deliver its second interest rate decision of the year while the ECB will provide its guidance on its rate hike in July. Other important events to watch will be the upcoming services and composite PMIs and US inflation data.
EURUSD
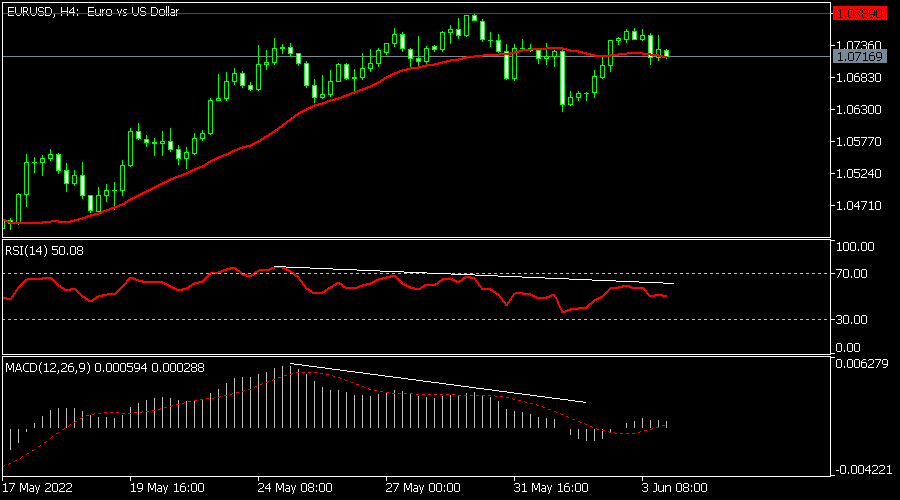
The EURUSD pair is trading at 1.0716, which is slightly below last week’s high of 1.0760. The pair has moved to the 25-day moving average while the Relative Strength Index (RSI) has continued moving in a downward trend. It is also along the 61.8% Fibonacci retracement level, and it seems like it has formed a double-top pattern. Therefore, the pair will likely have a bearish breakout towards the ECB decision.
USDCHF
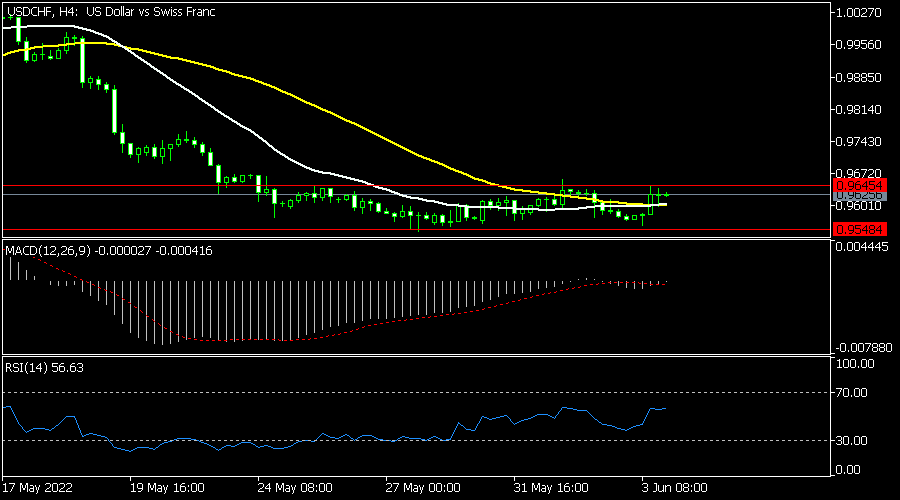
The USDCHF pair has been moving sideways in the past few days. It is trading at 0.9625, which is slightly above last week’s low of 0.9548. It is in a narrow channel whose upper part is at 0.9645. Also, the pair is consolidating around the 25-day and 50-day moving average while the Relative Strength Index has pointed upwards. The MACD is near its neutral point, meaning that the pair will likely have a bullish breakout.
USDJPY
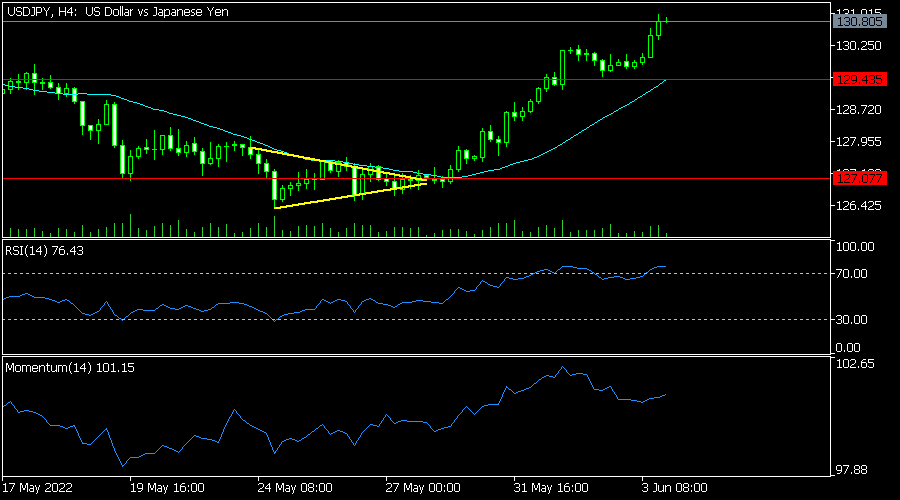
The weakness of the Japanese yen continued as the USDJPY pair rose to the highest level since May 10. It has managed to move above the important resistance level at 129.43, which was the highest level on April 20. It rose above the 25-day and 50-day moving averages while the Relative Strength Index and the momentum oscillators have kept rising. Therefore, the pair will likely keep rising this week.
EURUSD Moves in Narrow Range Around 1.0700
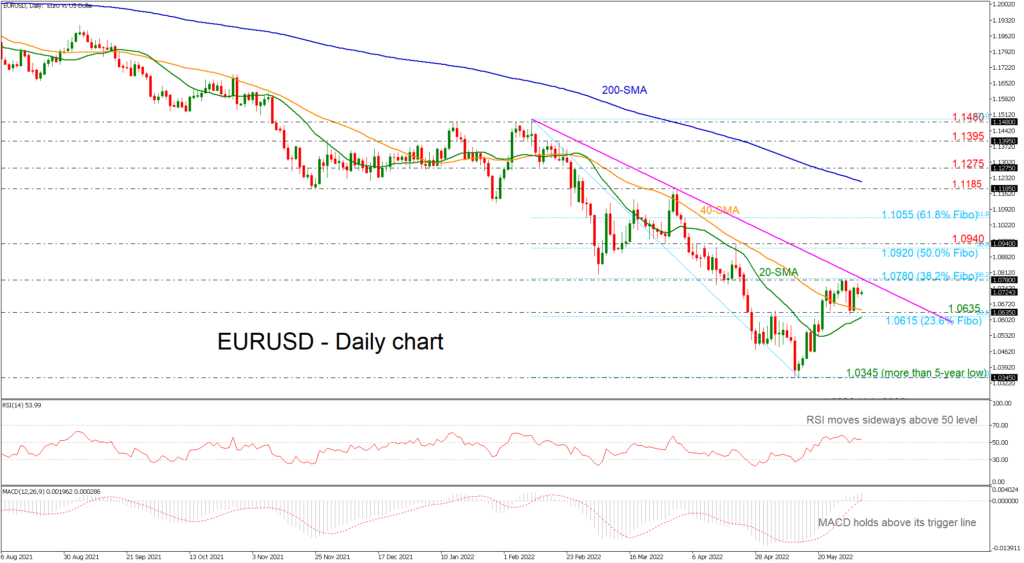
EURUSD is holding within a tight range of 1.0635 to 1.0780 after surpassing of the 20- and 40-day simple moving averages (SMAs). The RSI is moving sideways above the neutral threshold of 50, while the MACD is extending its bullish movement above its trigger and zero lines.
Should the price close comfortably above the 38.2% Fibonacci retracement level of the down leg from 1.1480 to 1.0345 at 1.0780 and the medium-term descending trend line, traders could add move value to the pair, pushing the market up to the 50.0% Fibonacci of 1.0920 and the 1.0940 resistance. The 61.8% Fibonacci of 1.1055 has been a strong resistance and therefore should be in focus.
In the negative scenario where the 20-day SMA halts upside movements, the market could retest the 1.0635 support and the 23.6% Fibonacci at 1.0615. If these prove easy to overcome this time, the decline may next pause somewhere near the more-than-five-year low of 1.0345.
In brief, EURUSD is in a neutral mode in the very short-term timeframe and bearish in the bigger picture.
Gold Gets Rejected, But Bulls Could Retry
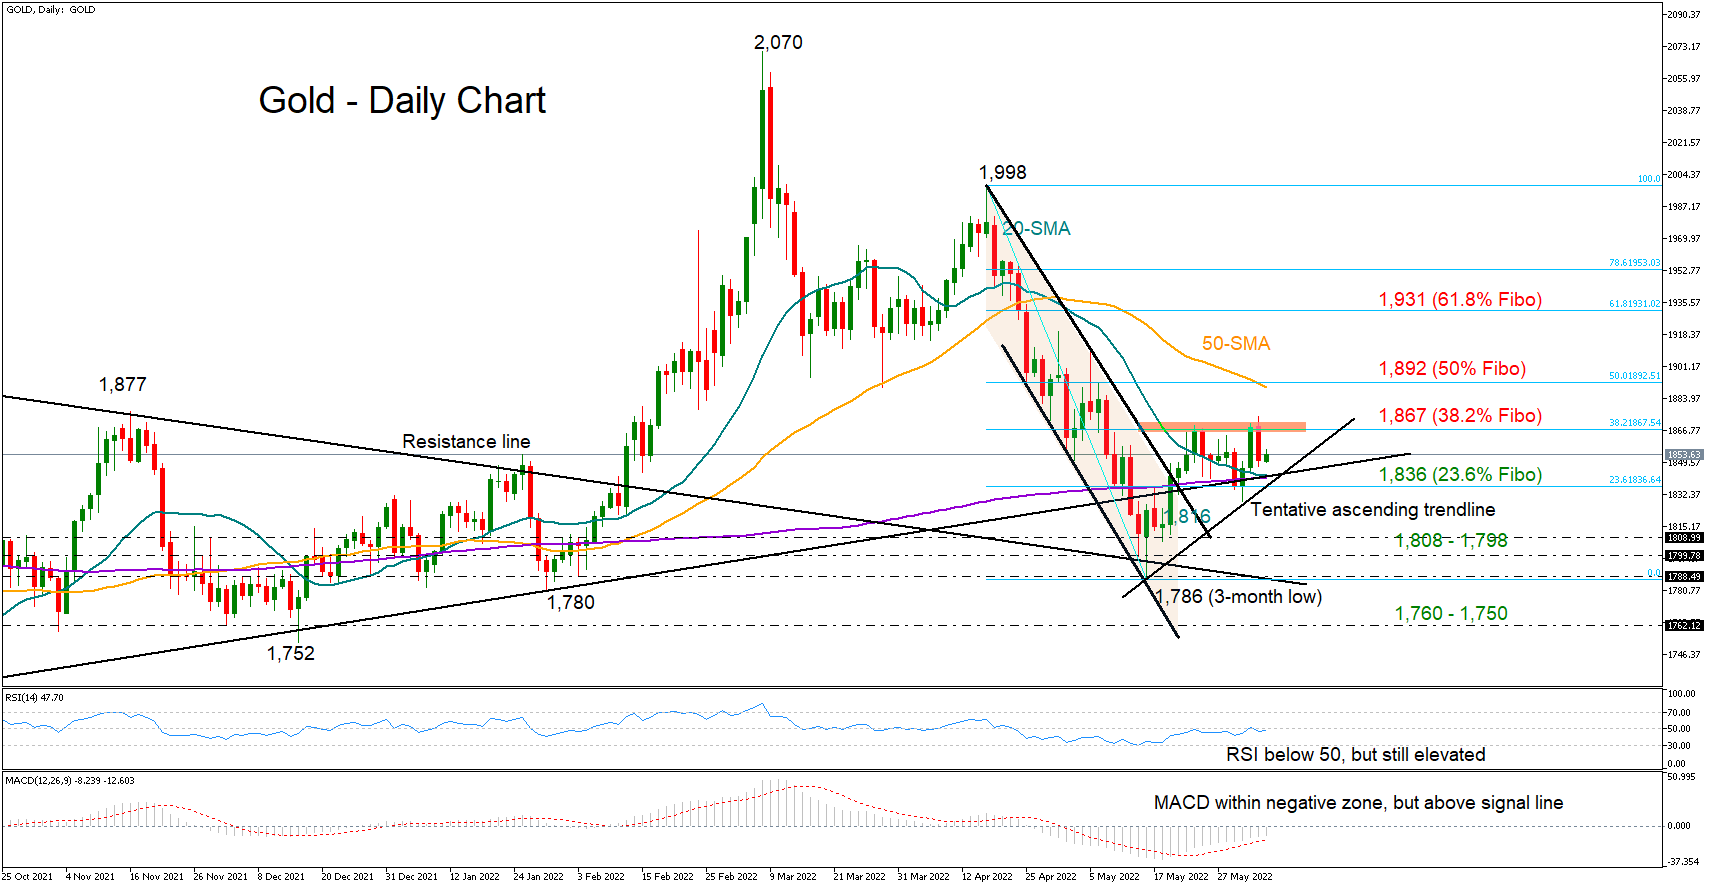
Gold faced its second rejection in two weeks around the wall of $1,867 despite inching to a one-month high of $1,874 on Friday, with the price retreating to the $1,850 territory in the aftermath.
The RSI and the MACD intimate some scepticism as they keep fluctuating in the bearish area. That said, they both preserve an upward direction, while the price itself maintains a soft advance above its 20- and 200-day simple moving averages (SMAs), suggesting that the bulls may not give up yet.
The $1,842 – $1,836 zone, which encapsulates the tentative ascending trendline drawn from $1,786 and the 23.6% Fibonacci retreatment of the downleg from $1,998, could prevent any downfalls towards the $1,808 – $1,798 area. If selling pressures snap the latter, the precious metal may diminish towards the three-month low of $1,786 and the resistance-turned-support line.
In the positive scenario, where the ceiling of $1,867 and the 38.2% Fibonacci crack, the price could immediately meet the 50-day SMA at $1,892. A successful push higher from here would add more credence to the latest rebound, likely resulting in a more exciting bull run up to the 61.8% Fibonacci of $1,931.
Summarizing, despite the persisting resistance around $1,867, gold could make another attempt to resume its bullish momentum in the near term.
Daily Technical Analysis
EUR/USD
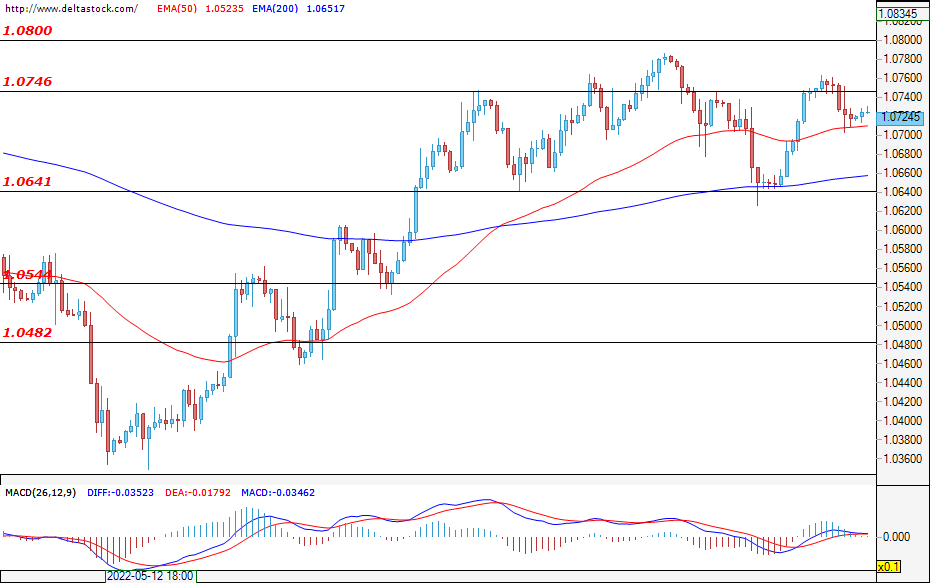
The bulls did not gain enough momentum to successfully breach the resistance at 1.0746, and during the early hours of today`s trading, the pair is hovering just below the aforementioned level. If the buyers re-enter the market, then a new attack on and a violation of the zone at 1.0476 could easily pave the way for a test of the upper target at 1.0800 and would strengthen the positive expectations for the future path of the EUR/USD. If the bears prevail instead, then they would most likely start moving towards the first support at 1.0641, a breach of which would deepen the decline towards the lower zone at 1.0544. The most impactful news from the economic calendar for this week is the announcement of the ECB Interest Rate Decision (Thursday; 11:45 GMT), as well as the U.S. Core CPI and Initial Jobless Claims data (Friday; 12:30 GMT).
USD/JPY
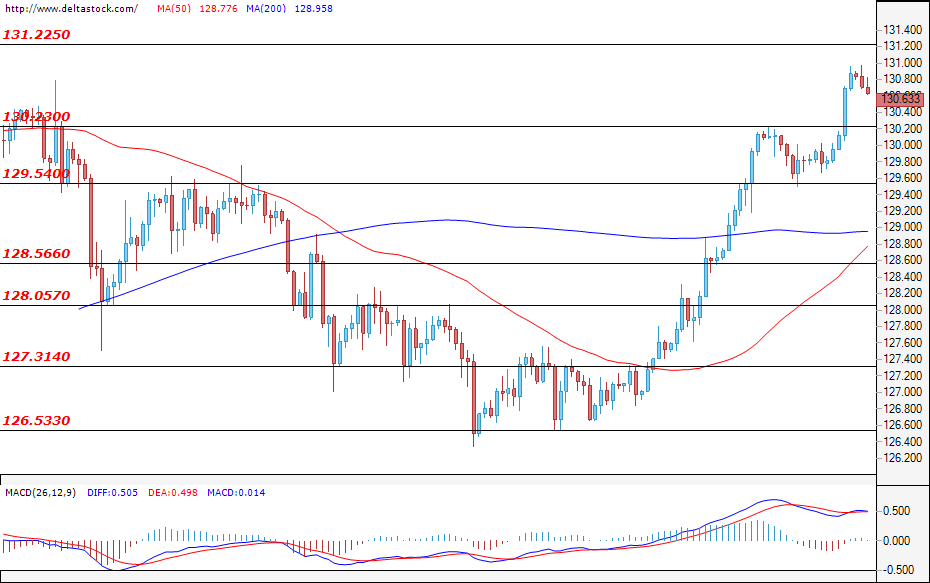
The positive sentiment remained unchanged, and after the breach of the resistance at 130.23, the dollar appreciated against the Yen. At the time of writing the analysis, the Ninja is hovering above the mentioned level and the expectations are for a test of the resistance at 131.22. A violation here could easily lead to new gains and will most likely result in a move towards the zone at 132.00. The first target for the bears can be found at the level of 130.23, which is now acting as a support, followed by the important zone at 129.54.
GBP/USD
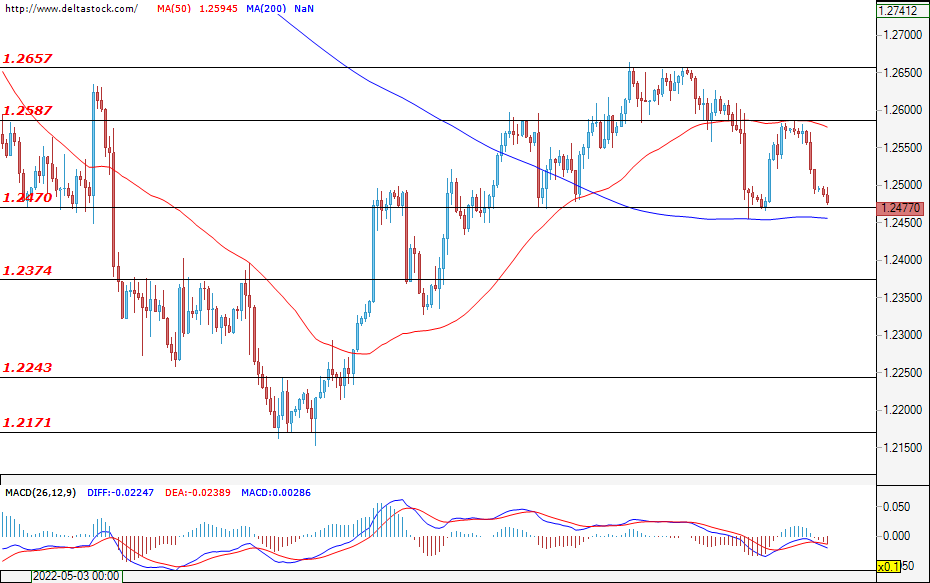
The attack of the bulls was limited to the resistance zone at 1.2587 and the Sterling erased some of its recent gains against the greenback. During the early hours of today`s trading session, the pair is hovering above the major support at 1.2470 and a successful violation here could easily deepen the decline and could head the pair towards a test of the lower target at 1.2374. If the bulls take over instead, then a breach of the resistance zone at 1.2587, followed by another breach of the upper zone at 1.2657, would mark the current move as corrective. This would strengthen the positive expectations for the future path of the Cable and would further increase the odds of a more sustained rally.
EUGERMANY40
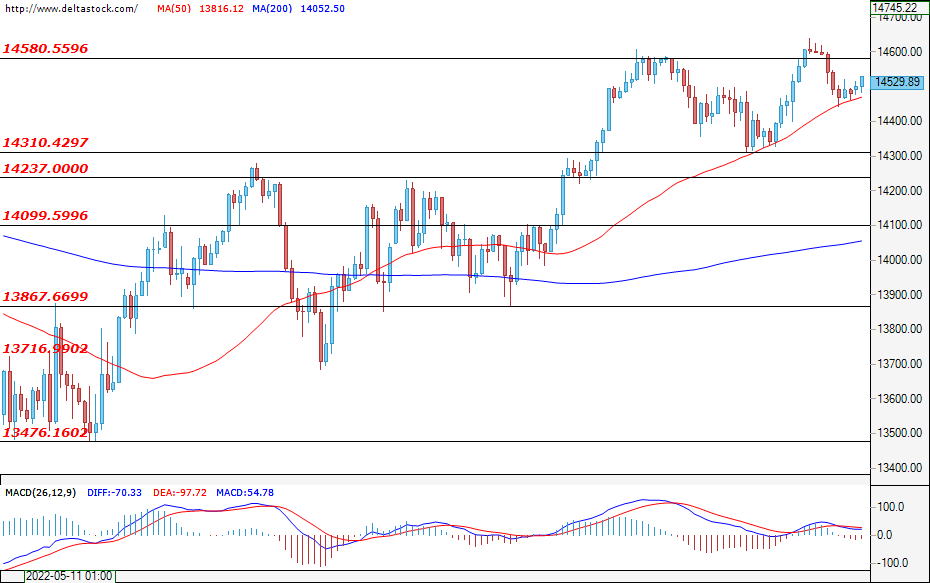
The positive sentiment remained intact, and during the early hours of today`s trading, the German index is holding its positions just under the resistance zone at 14580. A successful breach here could easily lead to new gains and could help ignite a rally towards the next important zone at around 14800. On the other hand, If the bullish momentum fades, then the bears could test the support zone at 14310, but only a violation of the lower target at 14100 could lead to a change in the current sentiment.
US30
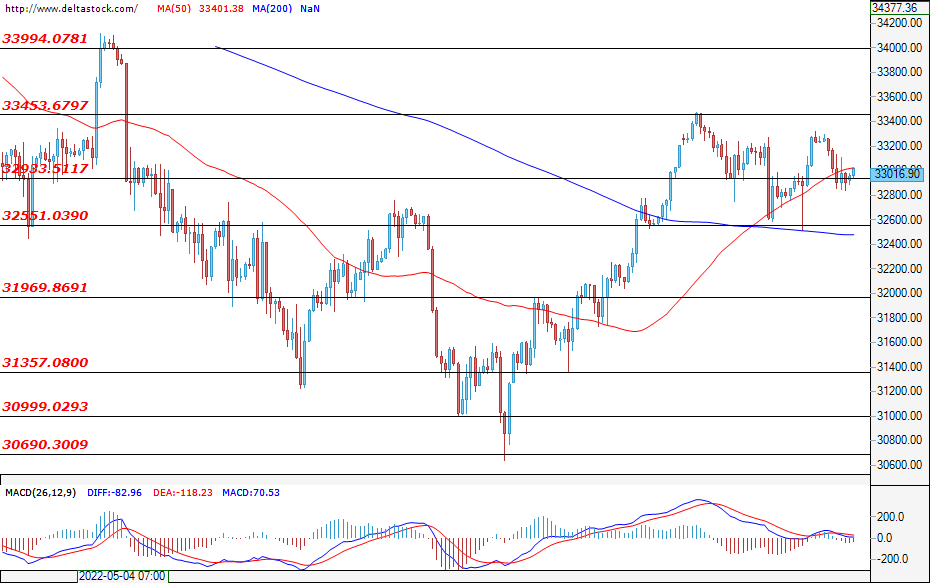
The U.S. blue-chip index is currently testing the support at 32933 after last week's volatile trading. If the price remains limited above the mentioned zone, then a bullish attack on the resistance at 33453 would be the most probable scenario. Only its successful violation, however, followed by a breach of the upper target at 33994, could strengthen the positive expectations and could lead to a more sustained upward move. Worse-than-expected U.S. Core CPI and Initial Jobless Claims data (Friday; 12:30 GMT) could help the bears prevail. If they manage to breach the support at 32551 and the one at 31969, then the sell-off will most likely deepen and the index might reach the local lows at around 31357.
GBP/JPY Daily Outlook
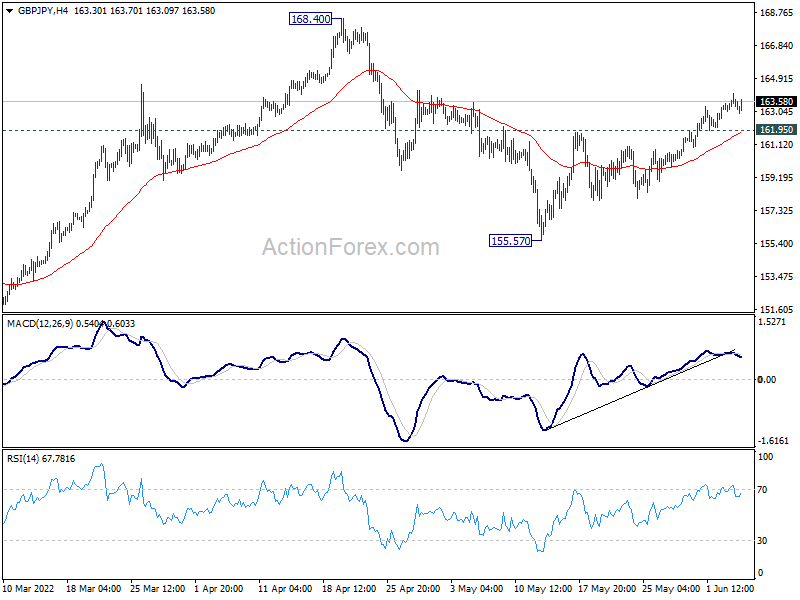
Daily Pivots: (S1) 162.91; (P) 163.50; (R1) 163.94; More...
Intraday bias in GBP/JPY remains on the upside for retesting 168.40 high. Firm break there will resume larger up trend. On the downside, below 160.92 minor support will turn bias back to the downside for extending the correction from 168.40 with another falling leg.
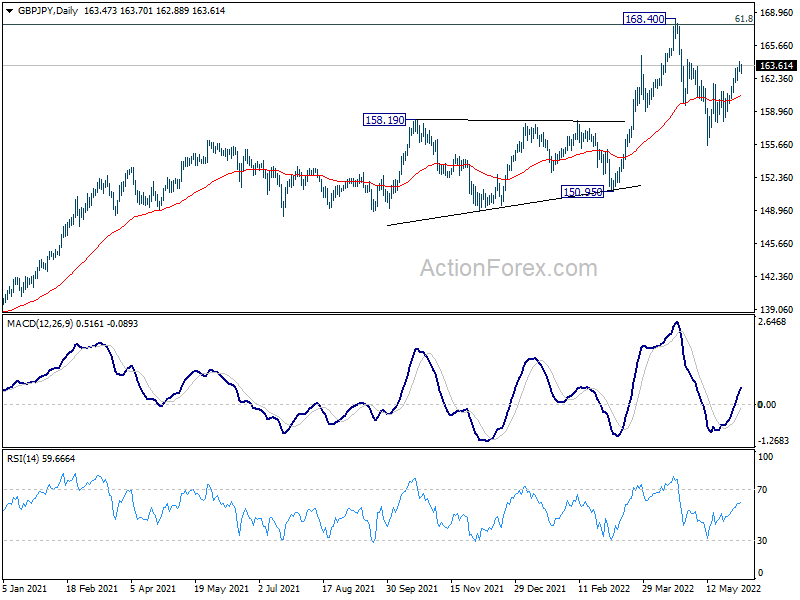
In the bigger picture, up trend from 123.94 (2020 low) is still in progress. Sustained break of 61.8% retracement of 195.86 (2015 high) to 122.75 (2016 low) at 167.93 will be a long term bullish signal, and could pave the way back to 195.86 high. This will now remain the favored case as long as 150.95 support holds, even in case of deep pull back. However, firm break of 150.95 will indicate rejection by 167.93, and bearish trend reversal.
EUR/JPY Daily Outlook
Daily Pivots: (S1) 139.64; (P) 140.00; (R1) 140.57; More....
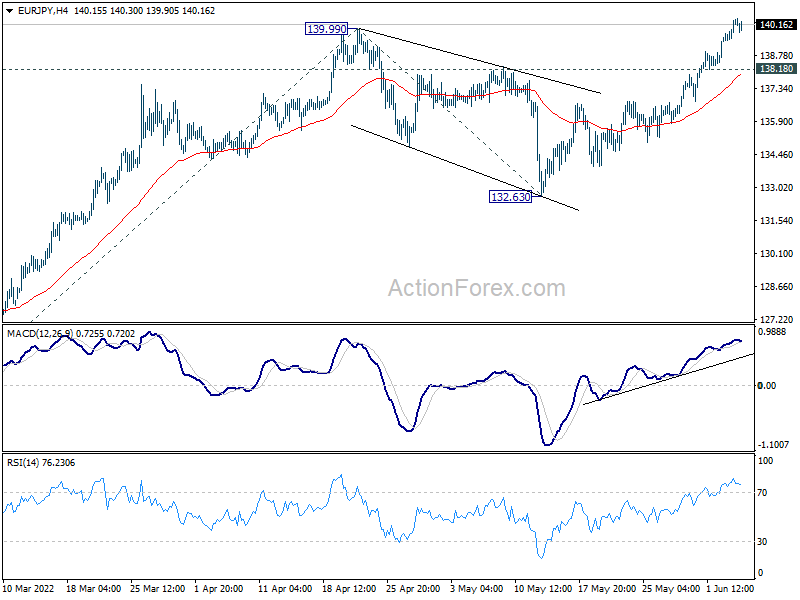
Intraday bias in EUR/JPY remains on the upside for the moment. Current up trend should target 61.8% projection of 124.37 to 139.99 from 132.63 at 142.28 next. On the downside, below 138.18 minor support will turn intraday bias neutral and bring consolidations first, before staging another rally.
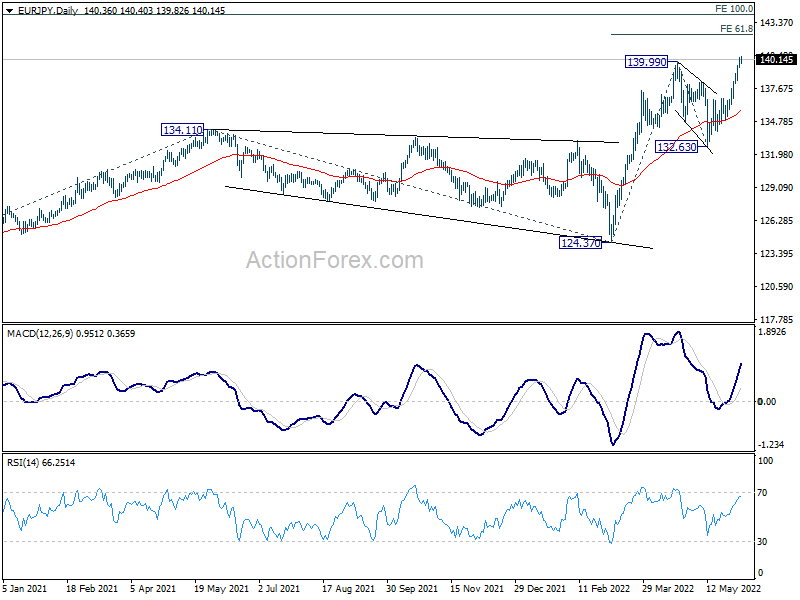
In the bigger picture, up trend from 114.42 (2020 low) is in progress. Such rise is seen as the third leg of the pattern from 109.30 (2016 low). Next target will be 100% projection of 114.42 to 134.11 from 124.37 at 144.06. In any case, outlook will now remain bullish as long as 132.63 support holds, in case of deep pull back.
EUR/GBP Daily Outlook
Daily Pivots: (S1) 0.8553; (P) 0.8569; (R1) 0.8598; More...
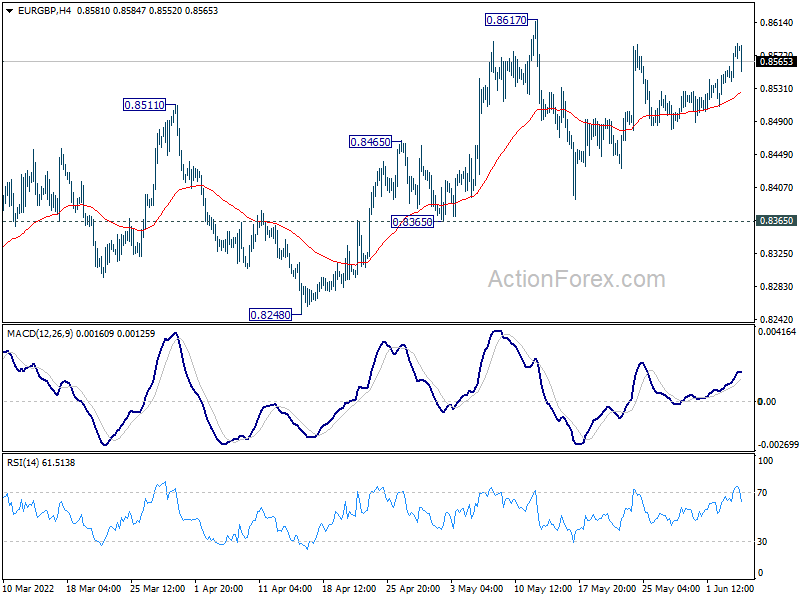
Intraday bias in EUR/GBP remains neutral as range trading continues. With 0.8365 support intact, further rise is in favor. On the upside, break of 0.8617 will resume rise from 0.8201 medium term bottom to 0.8697 medium term fibonacci level. However, break of 0.8365 will dampen this bullish view, and turn bias back to the downside instead.
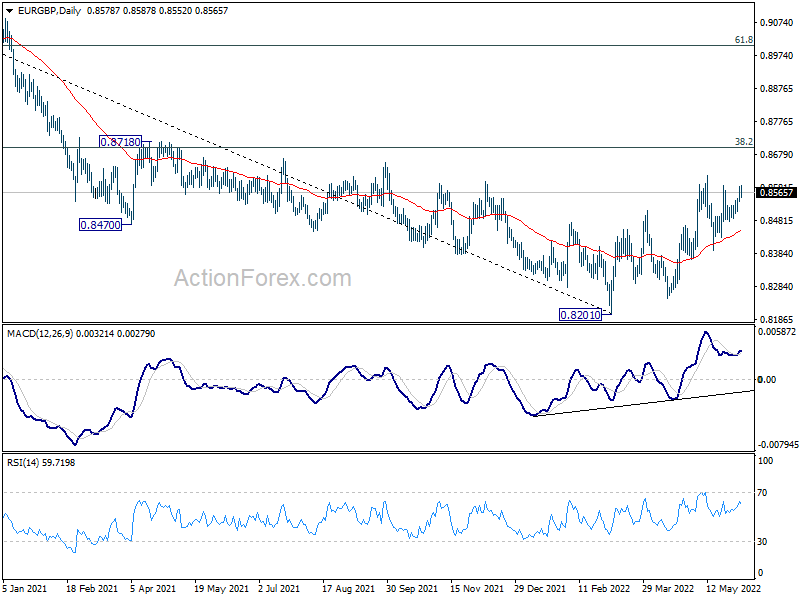
In the bigger picture, a medium term bottom could be in place at 0.8201, on bullish convergence condition in daily and weekly MACD. Rise from there could either be a correction to the down trend from 0.9499 (2020 high), or a medium term up trend itself. In either case, further rise should be seen to 38.2% retracement of 0.9499 to 0.8201 at 0.8697. Sustained break there will target 61.8% retracement at 0.9003.
EUR/AUD Daily Outlook
Daily Pivots: (S1) 1.4803; (P) 1.4842; (R1) 1.4906; More...
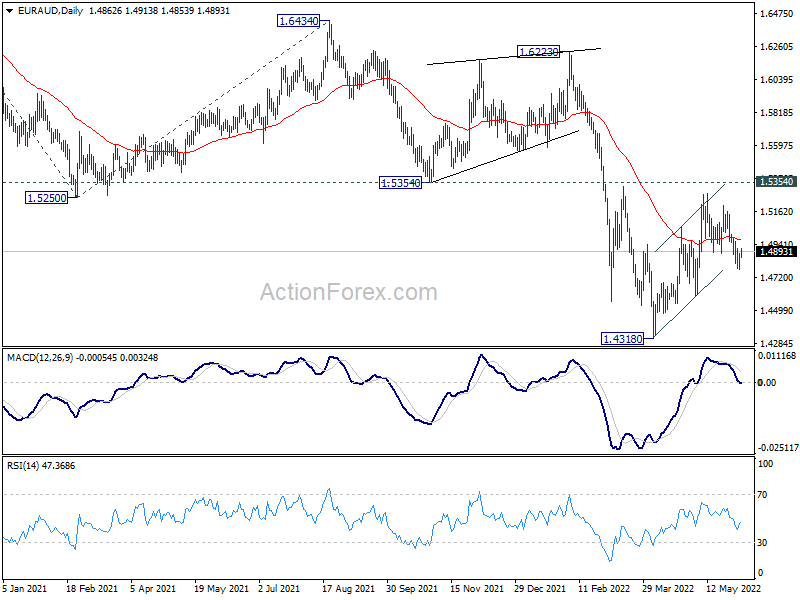
Intraday bias in EUR/AUD remains neutral at this point but further decline is expected with 1.4965 minor resistance intact. Corrective rebound from 1.4318 should have completed at 1.5277 already. Below 1.4774 will target 1.4597 support next. However, on the upside, break of 1.4965 will dampen this bearish view and turn bias back to the upside for 1.5277 resistance instead.
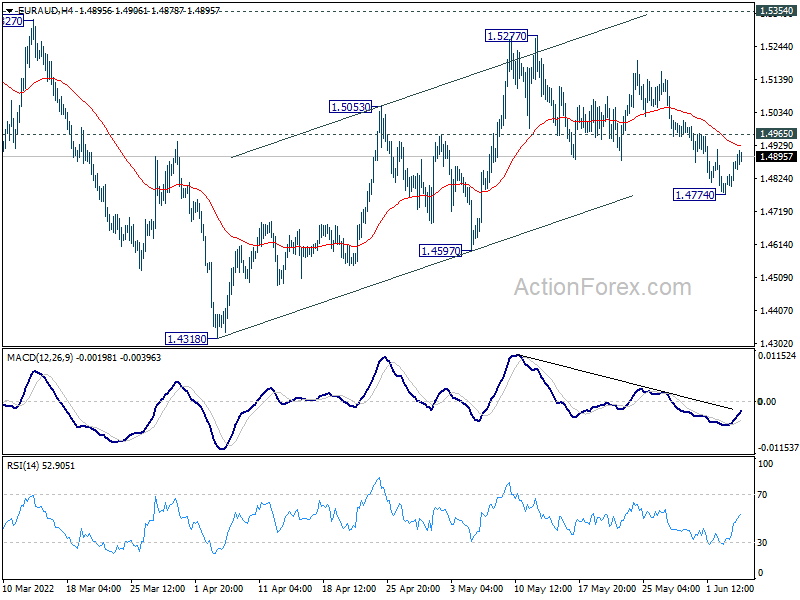
In the bigger picture, as long as 1.5354 support turned resistance holds, larger down trend from 1.9799 (2020 high) is still expected to continue. On resumption, next target is 61.8% projection of 1.9799 to 1.5250 from 1.6434 at 1.3623, which is close to 1.3624 long term support (2017 low). However, firm break of 1.5354 will indicate medium term bottoming and bring stronger rally back to 1.6434 key resistance.