

Sample Category Title
GBP/USD Mid-Day Outlook
Daily Pivots: (S1) 1.2455; (P) 1.2522; (R1) 1.2559; More...
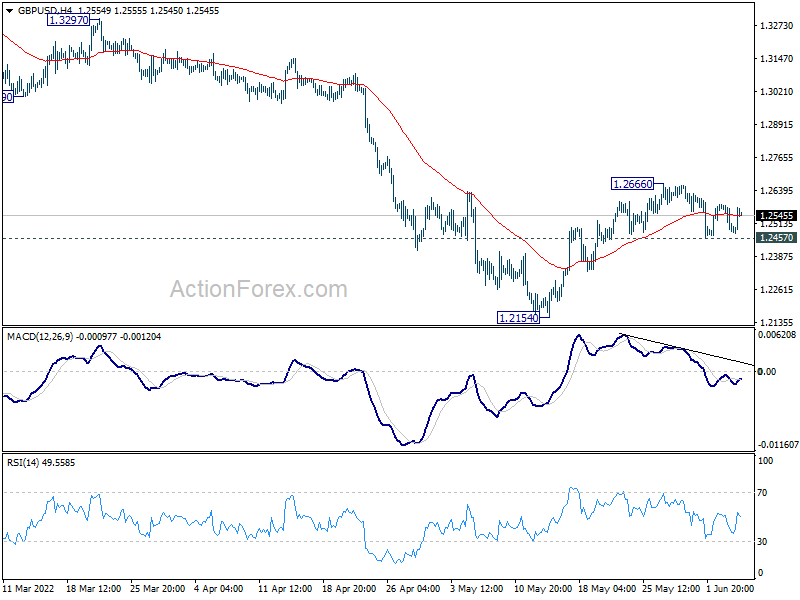
GBP/USD is staying in tight range below 1.2666 and intraday bias remains neutral. On the downside, break of 1.2457 minor support will suggest that rebound from 1.2154 has completed. Intraday bias will be back on the downside for resting this low. On the upside, above 1.2666 will target 55 day EMA (now at 1.2722) and above.
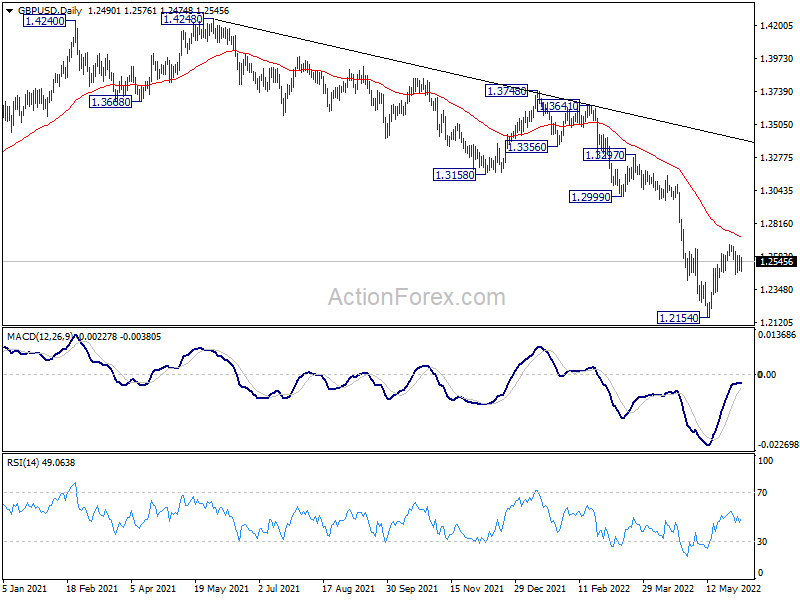
In the bigger picture, fall from 1.4248 (2018 high) could be a leg inside the pattern from 1.1409 (2020 low), or resuming the longer term down trend. Deeper decline is expected as long as 1.2999 support turned resistance holds. On resumption, next target is 1.1409 low.
Sterling Rises on Positive Market Sentiment, But Momentum Weak
Overall market sentiment is positive in the market today, even though trading is subdued with some European countries on holiday. Sterling is trading higher with commodity currencies. On the other hand, Swiss Franc is is the weakest one, followed by Yen and Dollar. Euro is mixed for now. In other markets, Gold is struggling in tight range while WTI crude oil is still gyrating around 120 handle.
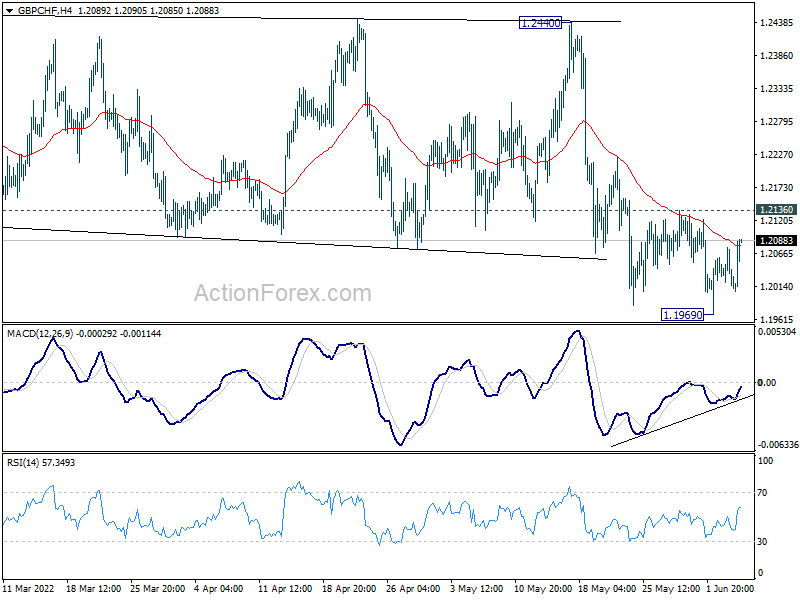
Technically, however, the upside momentum in Sterling is not too convincing, however, except versus Yen. At least, GBP/USD will have to break through 1.2666 minor resistance to resume the the rebound from 1.2154 to be a sign of sustainable buying. Or, GBP/CHF will have to break through 1.2136 minor resistance to confirm short term bottoming at 1.1969.
In Europe, at the time of writing, FTSE is up 1.30%. DAX is up 1.33%. CAC is up 1.32%. Germany 10-year yield is down -0.0003 at 1.279. Earlier in Asia, Nikkei rose 0.56%. Hong Kong HSI rose 2.71%. China Shanghai SSE rose 1.28%. Japan 10-year JGB yield rose 0.0092 to 0.246.
Nikkei hits 2-mth high, ready to extend near term up trend
Riding on broadly positive risk sentiment, Japan's stock indexes surged to highest level in over two months. Topix finished 0.31% higher while Nikkei rose 0.56%. Among the gainers, air and land transportation shares are lifted by optimism that tourism is coming back to Japan.
Based on current momentum, Nikkei should be ready to resume the whole rebound from 24681.74. 28338.81 resistance is the first test, and break will target 100% projection of 24681.74 to 28338.81 from 25688.10 at 29345.17. For now, it's still too early to call for long term up trend resumption in the index. 30k handle could still present huge psychological resistance. But in any case, further rally will remain in favor as long as 27251.24 minor support holds.
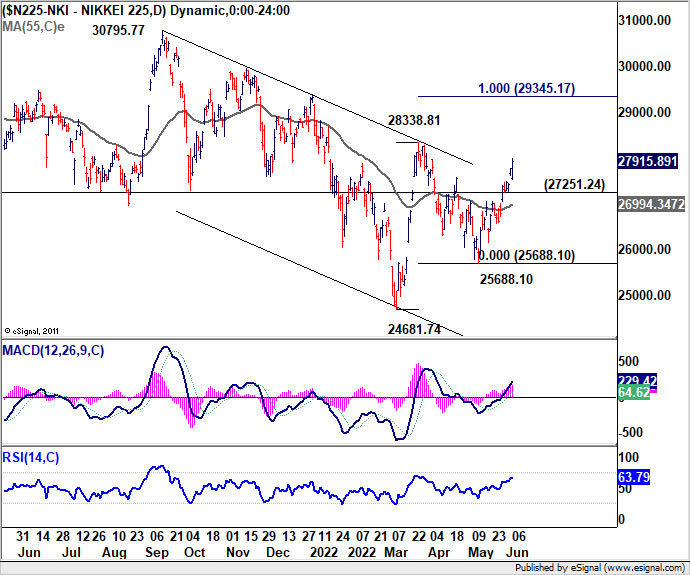
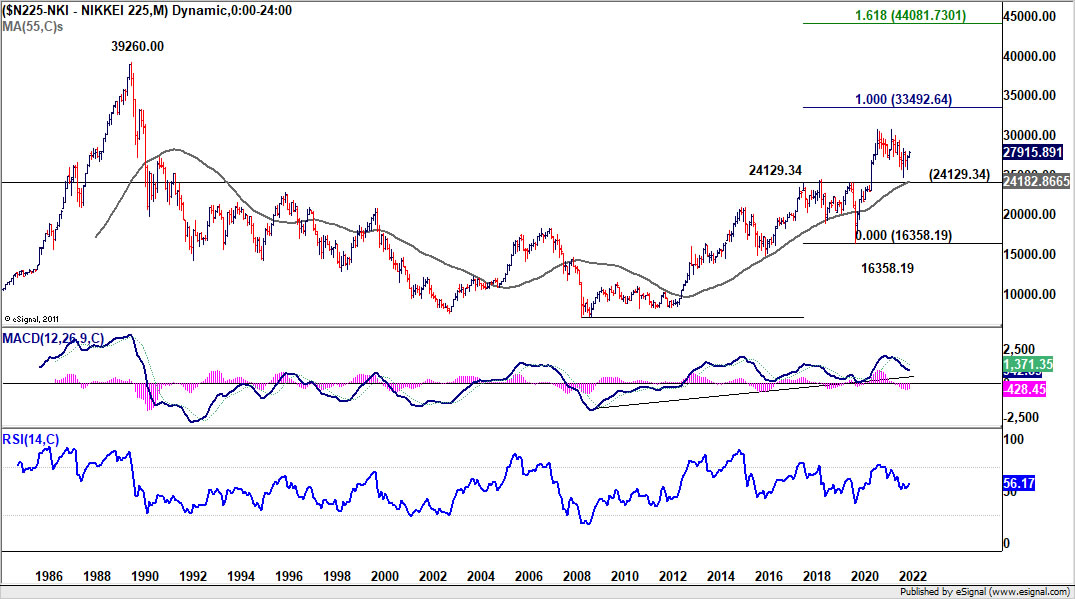
Meanwhile, it should also be noted that the long term outlook in Nikkei is staying bullish, despite the correction that lasted one and half year. It's holding comfortably above 24129.34 structural resistance, as well as 55 month EMA. Both are keeping the up trend from 6994.89 (2008 low) intact.
Kuroda: BoJ takes a strong stance on continuing with monetary easing
BoJ Governor Haruhiko Kuroda said in a speech that the economy is "still on its way to recovery from the pandemic and has been under downward pressure from the income side due to rising commodity prices". In this situation, "monetary tightening is not at all a suitable measure".
He added that the top priority is to "persistently continue with the current aggressive monetary easing centered on yield curve control". And, unlike other central banks, BoJ has noted faced the "the trade-off between economic stability and price stability". Hence, it's "certainly possible for the Bank to continue stimulating aggregate demand from the financial side."
He concluded that BoJ "will take a strong stance on continuing with monetary easing, in that it will provide a macroeconomic environment where wages are likely to increase so that the rise in inflation expectations and changes in the tolerance of price rises -- which have started to be seen recently -- will lead to sustained inflation."
China Caixin PMI services rose to 41.4 in May, composite rose to 42.2
China Caixin PMI Services rose form 36.2 to 41.4 in May, but missed expectation of 47.3. Caixin said services activity fell at softer, but still sharp rate amid COVID-19 restrictions. Drop in overall new work moderated. Input cost inflation eased to nine-month low. PMI Composite rose from 37.2 to 42.2.
Wang Zhe, Senior Economist at Caixin Insight Group said: "Overall, in May, local Covid outbreaks continued and manufacturing and services activity improved slightly, but continued to contract, with services hit harder. Demand was slightly stronger than supply. The fallout from the epidemic on market supply and demand has been transmitted to the labor market, which is deteriorating at a faster pace in both the manufacturing and services sectors. Disrupted supply chains and longer logistics delivery times have yet to improve. Businesses remained under great cost pressure."
GBP/USD Mid-Day Outlook
Daily Pivots: (S1) 1.2455; (P) 1.2522; (R1) 1.2559; More...
GBP/USD is staying in tight range below 1.2666 and intraday bias remains neutral. On the downside, break of 1.2457 minor support will suggest that rebound from 1.2154 has completed. Intraday bias will be back on the downside for resting this low. On the upside, above 1.2666 will target 55 day EMA (now at 1.2722) and above.
In the bigger picture, fall from 1.4248 (2018 high) could be a leg inside the pattern from 1.1409 (2020 low), or resuming the longer term down trend. Deeper decline is expected as long as 1.2999 support turned resistance holds. On resumption, next target is 1.1409 low.
Economic Indicators Update
| GMT | Ccy | Events | Actual | Forecast | Previous | Revised |
|---|---|---|---|---|---|---|
| 01:00 | AUD | TD Securities Inflation M/M May | 1.10% | -0.10% | ||
| 01:45 | CNY | Caixin Services PMI May | 41.4 | 47.3 | 36.2 |
Crude Oil is Attacking $120
The commodity market is full of bulls on Monday. Brent is moving a bit higher than $120 and feels like continuing the rally.
On one hand, there are fundamental reasons, for example, a piece of news from Saudi Arabia, which raised its May official selling price (OSP) to Asia for its flagship Arab Light crude. One may assume that the country is expecting an explosive growth of energy prices, which won’t probably be covered even by the expanded oil extraction limits accepted by OPEC+ earlier.
On the other hand, oil producers are in no hurry to increase their output. The latest report from Baker Hughes showed that over the past week, the Oil Rig Count in the US didn’t change. In Canada, the indicator increased by 17 units, up to 72. The lack of positive dynamics in the US might signal that the shale industry won’t show any improvements in the shale oil output in the second half of 2022.
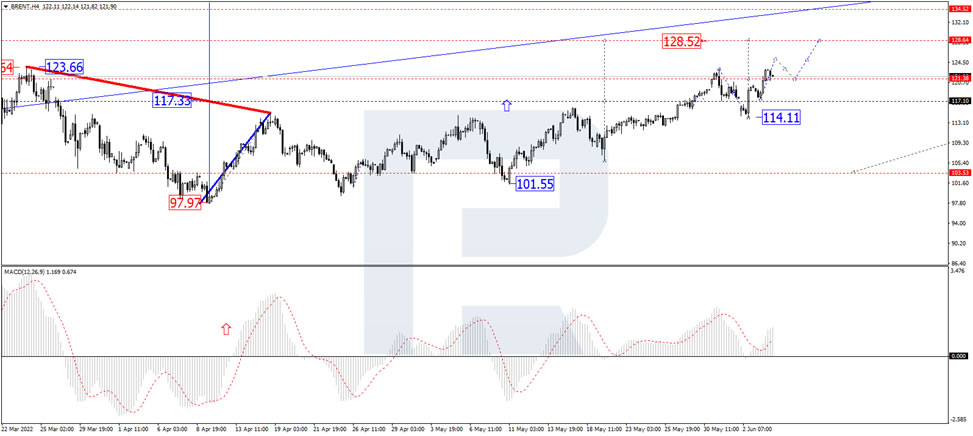
In the H4 chart, after breaking 121.38 upwards, Brent is expected to continue moving within the uptrend and reach 128.52. After that, the instrument may correct to return to 121.38 and then form one ascending wave with the target at 134.50. From the technical point of view, this scenario is confirmed by MACD Oscillator: its signal line is growing above 0 within the histogram area, which means that the uptrend in the price chart may continue.
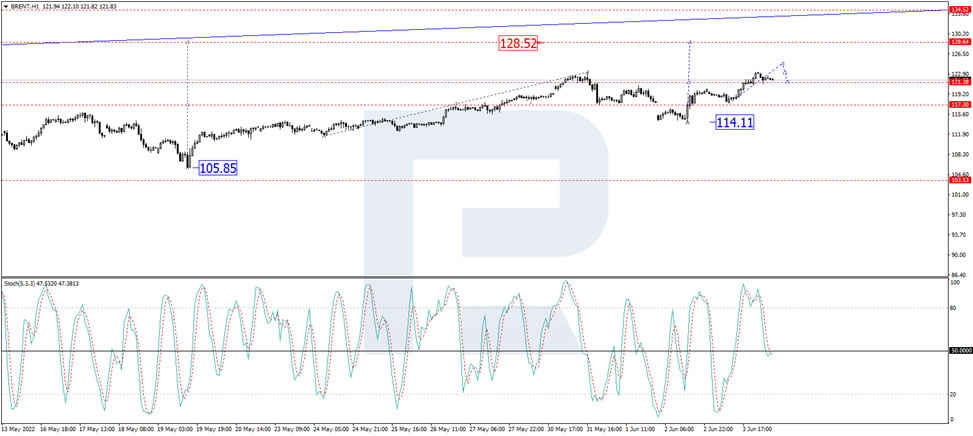
As we can see in the H1 chart, Brent is forming the third ascending wave with the target at 128.50; right now, it is forming the fifth structure inside this wave. The asset has already completed the ascending impulse at 123.22 along with the correction down to 121.38, thus forming a new consolidation range around 121.38. If later the price breaks this range to the upside, the market may resume growing towards 125.00 or even reach the above-mentioned target; if to the downside – start another correction down to 117.10 and then resume trading upwards to reach 128.50. From the technical point of view, this idea is confirmed by the Stochastic Oscillator: after falling towards 50, its signal line is expected to reach 20 and may rebound from this level. Later, the line may grow to break 50 and continue moving towards 80.
Gold Under Pressure, Although Central Banks are Mostly Buying
Gold lost 1% to $1850 on Friday, declining under pressure from the overall pull from risky assets. For short-term traders, it is also telling that this decline mostly erased the gains of the first few days of the month and prevented the rebound from turning into new upside momentum.
Gold came up against the resistance of sellers on Friday, as it did a fortnight ago, trying to move above the 61.8% Fibonacci retracement line from the highs of April near $2000 to the lows of May, below $1790.
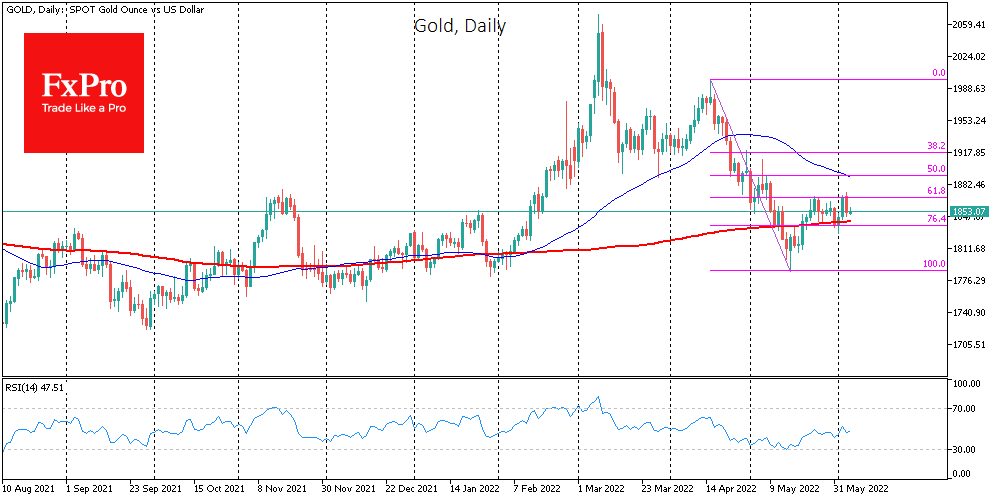
The following potentially significant level is the $1840 area, where the 200-day moving average passes. In early June, the buyers prevented gold from getting below that line, but it makes sense to expect that the bears have entirely abandoned the idea of breaking below it.
It is also interesting that an increase in central bank buying accompanied the fall in the price of gold in April. For April, new data from the World Gold Council showed net purchases by global central banks of 19.4 tonnes after net sales in March.
Central bank purchases should not be taken as a bullish signal for the market as regulators often acted as market stabilisers by selling in the early 2000s during one of the strongest rallies. Uzbekistan (+9.4t), Turkey (+5.6t) and Kazakhstan (+5.3t) were the most substantial buyers of gold. Sales were more modest, with Germany (-0.9t) and Mexico and the Czech Republic (-0.1t each) contributing the most. It will be no surprise if data for May would show an even bigger net buying.
In our view, net purchases of gold by EMs and sales by developed economies indicate a relatively benign financial environment in the global economy. Otherwise, EMs were forced to sell gold to protect their currencies from declines.
Brent Oil Holds above $120 on Fears of Tight Supply in Increased Saudi Arabia’s Prices
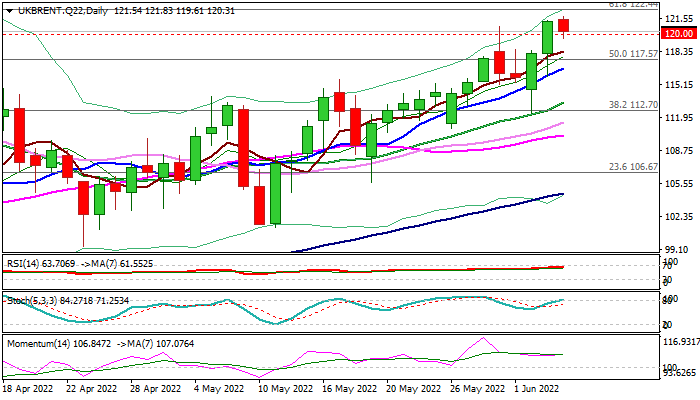
Brent oil is establishing above $120 barrier which was broken on Friday and hit new ten-week high on Monday, as concerns about persisting tight supply on growing doubts that OPEC+ is likely to achieve increased output target and cover shortage caused by ban on Russian oil, while the prices were also lifted by Saudi Arabia’s unexpected increase of oil prices for Asian buyers.
Despite expectations of gradual increase of production from cartel’s member countries, forecasts show that Russian output will fall by 1 – 1.5 million barrels per day by the end of 2022 that would keep oil market under pressure.
Bullish technical studies add to positive outlook as initial bullish signal was generated on last week’s close above $120 level.
Bulls eye Fibo level at $122.44 (61.8% of $138.22/$96.92) and 24 Mar lower top at $123.72, violation of which would spark stronger acceleration higher.
The action should ideally stay above $120, with rising 10DMA offering solid support at $116.74, which should contain extended dips.
Res: 120.87; 121.63; 122.44; 123.72;
Sup: 120.00; 119.61; 117.57; 116.74
June Flashlight for the FOMC Blackout Period
Summary
- We expect that the actual policy changes the FOMC announces on June 15 will be more or less inconsequential in terms of market reaction. That is, the Committee has clearly indicated that it plans to raise its target range for the fed funds rate by 50 bps, and this move is entirely reflected in market pricing.
- At its last meeting on May 4, the FOMC announced a roadmap to shrink its balance sheet in coming months. This plan commenced just this month, so modifications are very unlikely to be made at this meeting.
- The Committee could take more consequential steps in terms of signals about future policy changes. For starters, an upward shift in the "dot plot" seems to be all but assured.
Financial markets are currently priced for a fed funds rate between 2.75% and 3.00% by the end of the year. If the median dot for year-end 2022 shifts higher than this level, then the Committee on balance would be more hawkish than most market participants currently judge, which likely would put upward pressure on bond yields. Bond yields could also move higher if the dot plot indicates that the Committee expects significant additional tightening will occur throughout 2023. - We think the year-end 2022 median dot will be 2.875% or so, which would put the fed funds rate modestly above neutral by year-end and in line with our own forecast. The current median dot for 2023 is 2.75%, and we expect this to shift higher to 3.375% or so. This would signal more tightening at the margin while also striking a balance between some of the more hawkish and dovish FOMC participants. For 2024, we expect the median dot to be largely unchanged from March's 2.75%.
- Most FOMC members seem to believe that further monetary tightening is warranted, but at this time some members do not appear be on board with taking the fed funds rate significantly above "neutral" by the end of the year. Therefore, we think Chair Powell will strike a "balanced" tone in his post-meeting press conference.
We Do Not Expect Any Major Policy Surprises on June 15
There are not likely to be any surprises in enacted policy changes when the next FOMC meeting wraps up on Wednesday, June 15. An increase of 50 bps in the fed funds rate seems all but assured, which would take the target range to 1.25-1.50%. The minutes from the May meeting underscored the broad support for "expeditiously" getting the Fed's primary monetary policy tool back to neutral through a "couple" more 50 bps hikes, and more recent comments from Fed officials show no signs of cold feet.
Plans to adjust the FOMC's other key policy lever—its balance sheet—were adopted at the Committee's meeting on May 4, leaving no balance sheet changes to be made at this particular meeting. Starting this month, the Federal Reserve will allow up to $30 billion of maturing Treasury securities and $17.5 billion of mortgage-backed securities (MBS) to roll off its balance sheet each month. Those caps are set to be doubled to their terminal size in September.
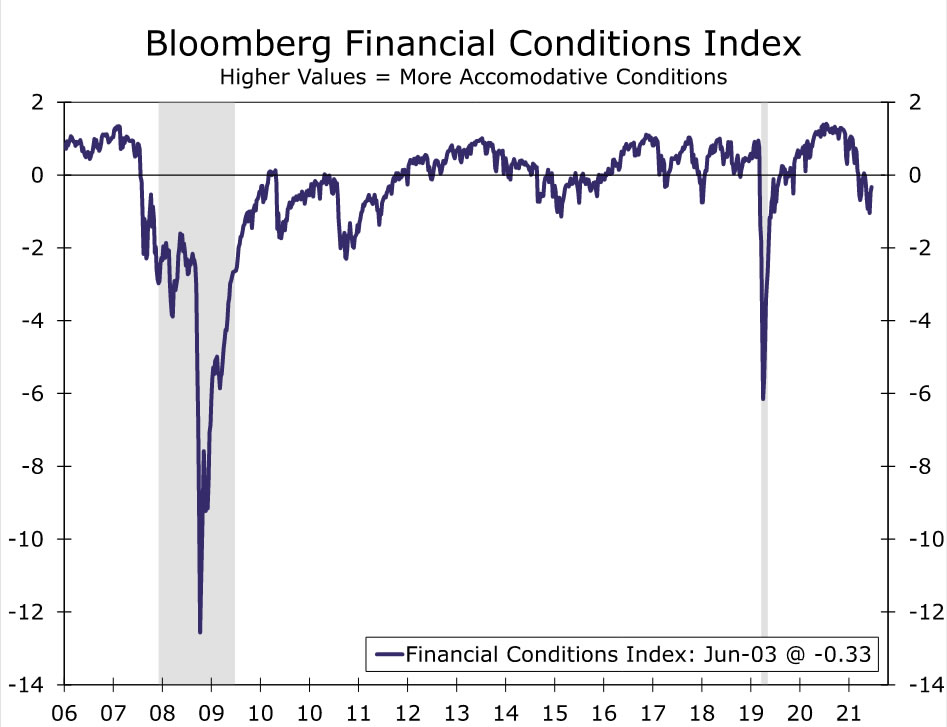
With the increase to the fed funds rate at the upcoming meeting so well telegraphed, the focus will likely be on what comes next for policy amid a still rapidly evolving and unusually uncertain outlook. Since the FOMC's last meeting on May 4, overall financial conditions have hovered around the tightest levels in two years (Figure 1). Treasury yields remain elevated, credit spreads are still wide, at least by the standards of earlier this year, and the S&P 500 index narrowly avoided closing in bear market territory a few weeks ago. Although there has been some easing in recent days, the tighter stance of financial conditions in May indicates that the Fed's hawkish posture is starting to leave its mark.
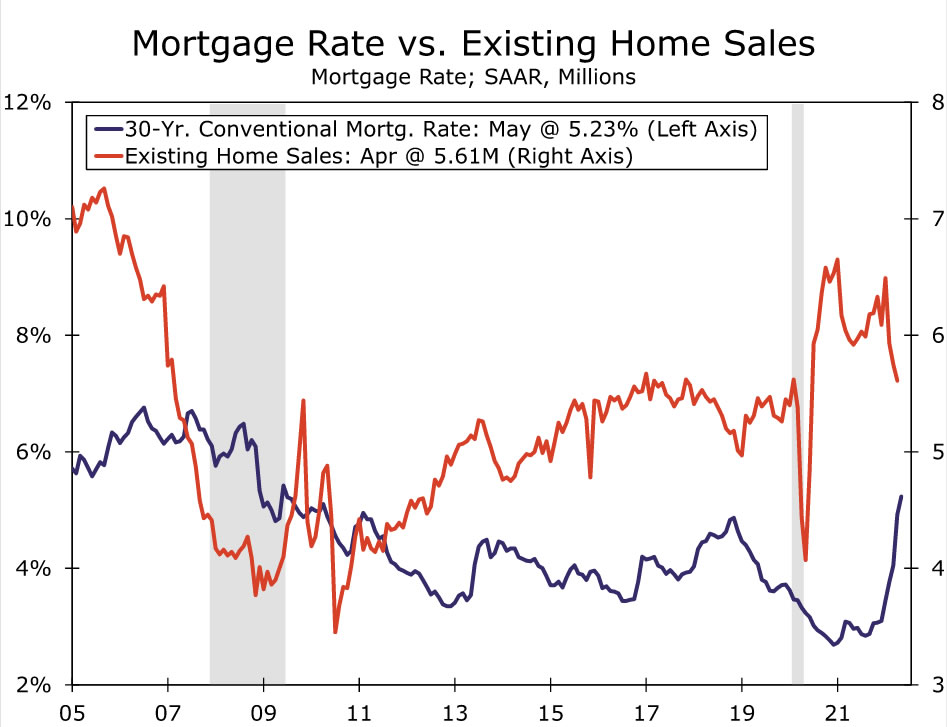
The housing market is the sector in the real economy that has started to feel the tightening in financial conditions the most. Since the FOMC's definitively hawkish pivot around the start of the year, the benchmark 30-year mortgage rate has shot up roughly 200 bps on balance. The dampening effect on the market has been greater than expected, with the Bloomberg Housing & Real Estate Surprise Index quickly nearing the lowest levels since late 2018 (lower index values indicate weaker-than-expected readings). Mortgage purchase applications have retreated nearly 30% from their January high, existing home sales have tumbled 14%, and price appreciation has shown the first hints of backing off its torrid pace of the past two years (Figure 2).
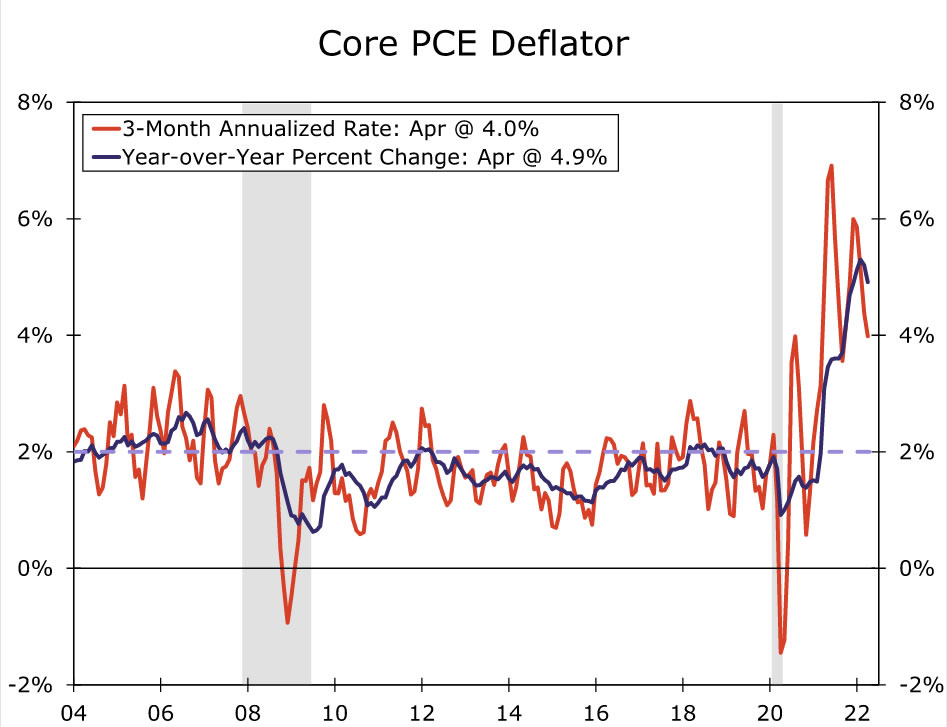
Yet the inflation data and labor market remain red-hot. The year-ago rate of CPI inflation inched down in April but remains up a blistering 8.3%. Core CPI surprised to the upside in April, while the annualized rate of core PCE inflation over the past three months has continued to run at double the Fed's 2% target (Figure 3). The significant upward pressure on prices does not appear to be going away anytime soon either. Gasoline prices climbed to new highs and natural gas prices surged this past month, while services inflation has yet to peak in our view. All told, a definitive slowdown in inflation likely remains months away.
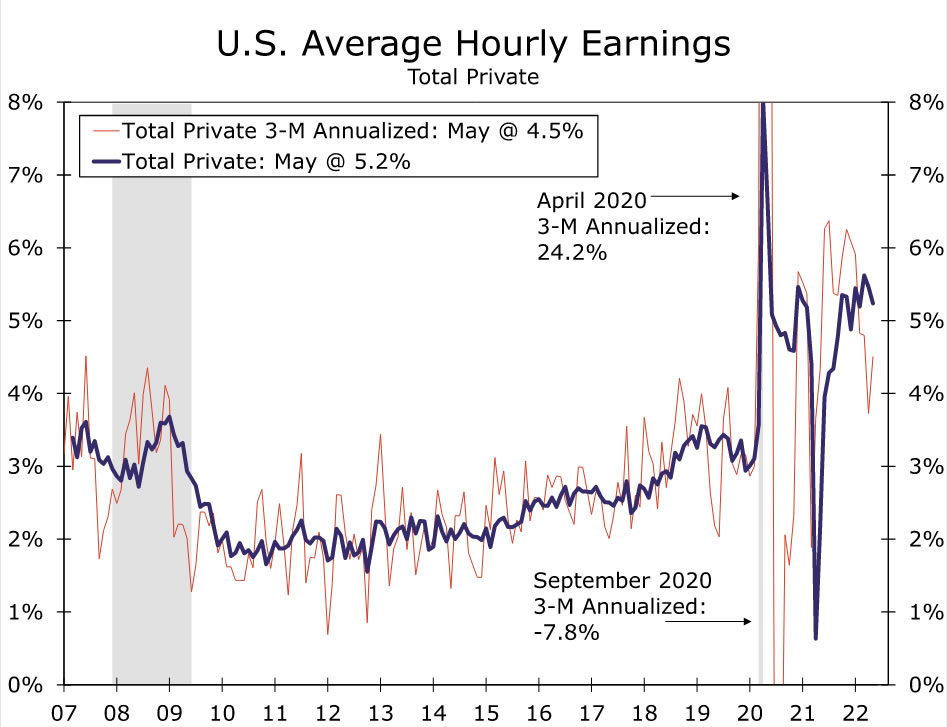
Underpinning the heightened inflation pressures is an extraordinarily strong labor market. Despite job openings slipping in April, there remained nearly two openings for every unemployed worker. Payroll growth surprised to the upside again in May, while at 3.6% the unemployment rate remains at the bottom end of the FOMC's longer-run estimated range. Average hourly earnings growth has eased from the more frenzied pace of hiring registered late last year, but is rising at a 4.5% clip the past three months—still well above a pace consistent with 2% inflation accounting for productivity gains (Figure 4).
How Much Higher Will the Dot Plot Shift?
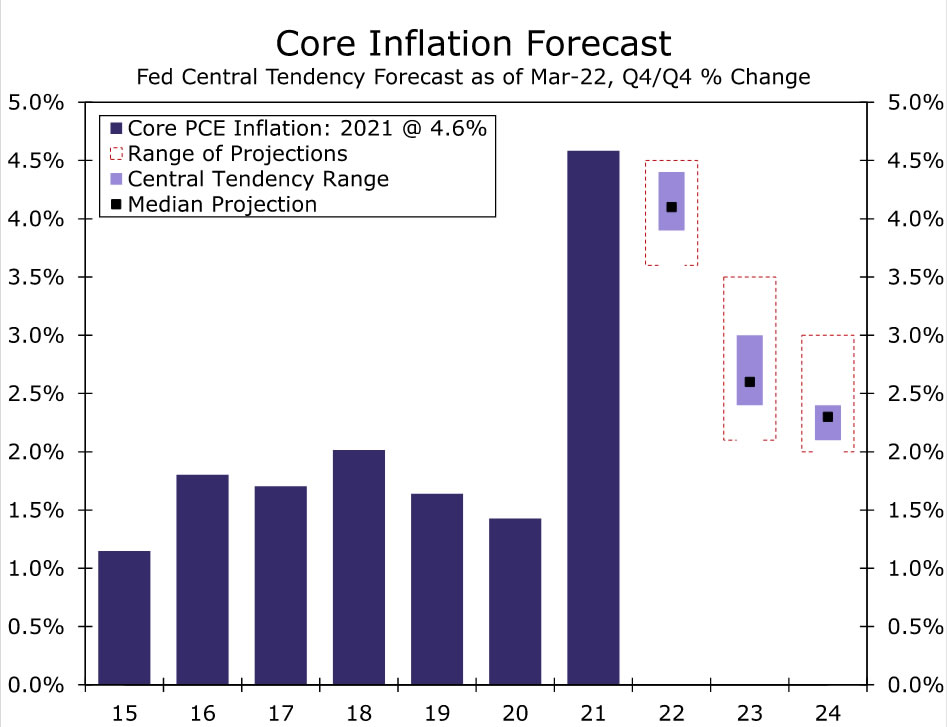
Although there should not be much drama associated with the actual policy changes that the FOMC is expected to announce, there could be some market-moving news in the Summary of Economic Projections (SEP). Four times a year (i.e., March, June, September and December) the Committee updates its SEP, which summarizes the macroeconomic forecasts of the FOMC members. When the last SEP was published in March, the median forecast called for a 4.1% year-over-year rate of core PCE inflation in Q4-2022 (Figure 5). But with core PCE inflation currently running close to 5%, we would not be surprised if the median forecast for the end of this year ticked up modestly.
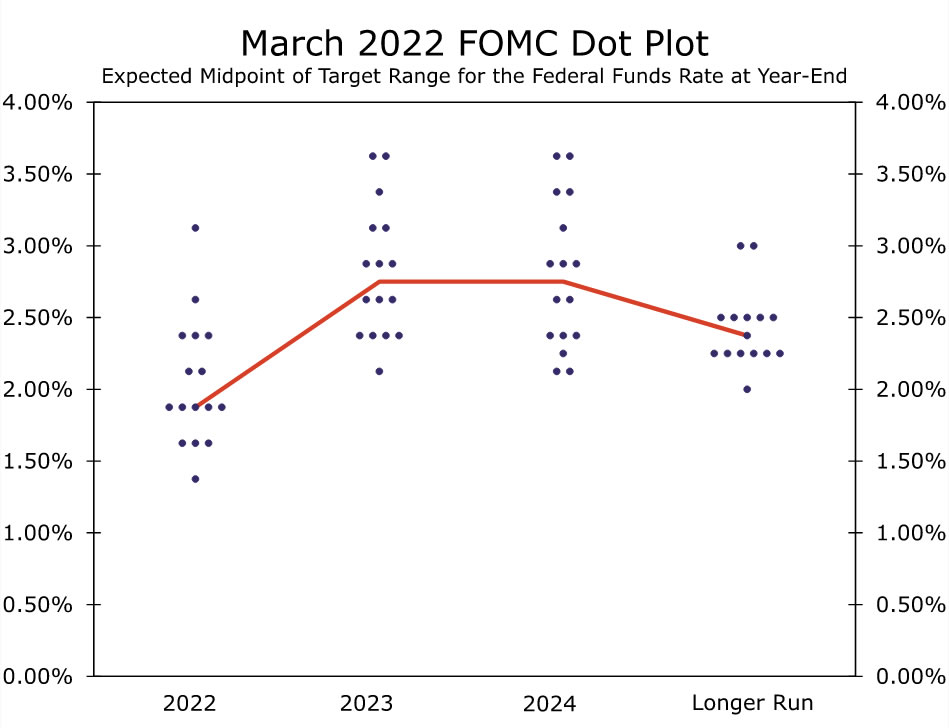
Another likely forecast change, which could potentially be more consequential in terms of market reaction, would be a shift higher in the "dot plot." The median 2022 dot in the dot plot that was released following the March 16 meeting stood at 1.875%, which is about 100 bps higher than the current fed funds rate (Figure 6). The minutes of the May 4 FOMC meeting indicated that there is strong support for 50 bps rate hikes at the "next couple of meetings." If the Committee delivers 50 bps rate hikes at both the June 15 and the July 27 policy meetings, then the median dot from the March SEP would be reached at the July meeting. But with many FOMC members publicly suggesting in recent weeks that the Fed may need to tighten throughout most of the year, an upward shift in the 2022 dot seems to be all but assured.
The minutes of the May 4 FOMC meeting also showed that "all participants reaffirmed their strong commitment and determination to take the measures necessary to restore price stability." Although all Committee members want to restore price stability, they clearly could have different opinions on how much additional monetary tightening will be needed to do so. The dot plot will give each policymaker the opportunity to anonymously express their assessment of the appropriate level for the fed funds rate. Financial markets are currently priced for a fed funds rate between 2.75% and 3.00% at both the end of this year and the end of 2023. Market pricing currently indicates the fed funds rate will top out between 3.00% and 3.25% in spring 2023 before the FOMC begins to modestly ease policy by the end of the year.
If the median dot for the end of this year shifts higher than 2.875% (i.e., the midpoint of a 2.75% to 3.00% target range for the fed funds rate), then the Committee on balance would be more hawkish than most market participants currently judge, which likely would put upward pressure on bond yields. Bond prices also could be adversely affected (i.e., yields could move higher) if the dot plot indicates many FOMC members expect significant additional tightening will occur throughout 2023. We think the year-end 2022 median dot will be 2.875% or so, which would put the fed funds rate modestly above neutral by year-end and in line with our own forecast. The current median dot for 2023 is 2.75%, and we expect this to shift higher to 3.375% or so. This would signal more tightening at the margin while also striking a balance between some of the more hawkish and dovish FOMC participants. For 2024, we expect the median dot to be largely unchanged from March's 2.75%. Cooling inflation later next year and into 2024 should permit the FOMC to start moving the fed funds rate back towards neutral.
With both inflation and the labor remaining so hot, we do not expect the FOMC will be derailed from its hawkish track by the recent tightening in financial conditions. However, with signs that tighter policy is beginning to steep into the economy, we will be watching closely for what the FOMC will need to see to slow down on its current path of policy tightening, let alone for what it will take for the hiking cycle to eventually come to a conclusion.
Will Powell Again Be "Balanced" in His Press Conference?
As is now standard operating procedure, Chair Powell will hold a press conference after the FOMC's statement is released at 2:00 PM EDT on June 15. It is important to note that Powell speaks on behalf of the entire Committee, not just for himself exclusively, in the press conference. Therefore, his answers to the questions he is asked provide some insight into areas of consensus among the FOMC members. We would characterize Powell's tone in his post-meeting press conference on May 4 as "balanced". That is, the Fed Chair was not overly hawkish nor was he overly dovish.
This balanced tone indicates to us that most FOMC members thought on May 4 that further tightening in coming meetings was warranted. James Bullard, the president of the Federal Reserve Bank of St. Louis and one of the more hawkish members of the Committee, has subsequently said that the FOMC should "front load" rate hikes to get the fed funds rate to 3.50% by the end of the year. However, some members do not necessarily appear to be on board with taking the fed funds rate significantly above "neutral", which most would define to be in a range of 2.25% to 2.75%, by the end of the year. For example, president of the Philadelphia Federal Reserve Bank Patrick Harker, has said that he expects "50 bps hikes in June and July," and then a more "measured" pace thereafter. President Raphael Bostic of the Atlanta Fed recently said that a "pause" in the tightening cycle in September "might make sense." Given the seeming divergence in opinion among different Committee members regarding the appropriate stance of policy later this year, we do not expect Chair Powell to be overly hawkish in his post-meeting press conference on June 15. A balanced approach once again appears to be the most likely outcome in our view.
Bitcoin’s Pump or the Start of a Rise? America’s Opening Will Show Us
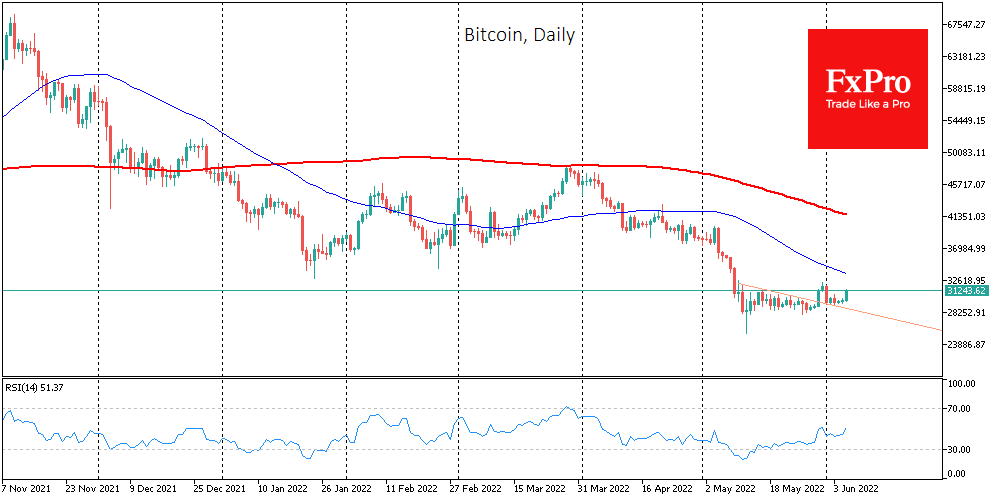
Bitcoin rose 3.1% over the past week, finishing near $30,000. Ethereum added 0.9%, while other leading altcoins in the top 10 showed mixed dynamics, ranging from a 10.7% decline (Solana) to a 23.2% rise (Cardano).
The new week is off to a promising start. BTCUSD has added 4.6% in the last 24 hours, more than 4% since the start of the day and is again testing the $31.0K mark. Cryptocurrency investors were not spooked by Friday’s market decline, as key stock indices were above the recent local lows and had been adding in recent hours.
The total capitalisation of the crypto market, according to CoinMarketCap, rose 3.8% in 24 hours to $1.28 trillion, with the Bitcoin Dominance Index adding 0.2% over the same period to Friday’s 46.5%.
By Monday, the cryptocurrency fear and greed index rose from 10 to 13 points. For about a month now, this indicator has been steadily below 20 – in a state of extreme fear.
While at current levels, BTCUSD remains below the consolidation area at the lows of the middle of last year. It is worth paying attention to the change in the trend seen in the weekly candlesticks. Last week’s lows and highs were higher than the week before. The intraday charts show that the price is being pushed up in the absence of investors in the USA. However, one must make sure that this demand is global. Retail investors may try to promote the start of the rise by feeding them an abundant supply.
BTC was climbing to three-week highs but lost almost all its gains by the end of the week. The first cryptocurrency has been trading in a sideways range around the $30,000 level for more than three weeks.
The bearish trend in the market has caused long-term investors to capitulate. This factor signals that the price has reached a multi-year bottom, according to CryptoQuant.
Reserve Bank of India Deputy Governor T. Rabi Sankar believes central banks’ digital currencies could completely displace private virtual currencies, including bitcoin.
May proved to be a bad month for BTC and ETH miners. Bitcoin miners’ earnings fell 21.9% for the month, while miners of the second cryptocurrency fell 24.1%.
The market will draw its attention to The annual Consensus 2022 this week. This year’s Crypto Industry Excellence Expo will be hosted in Austin, Texas, on June 9-12.
USD/JPY: Bulls Look for Retest of 2022 High after Consolidation
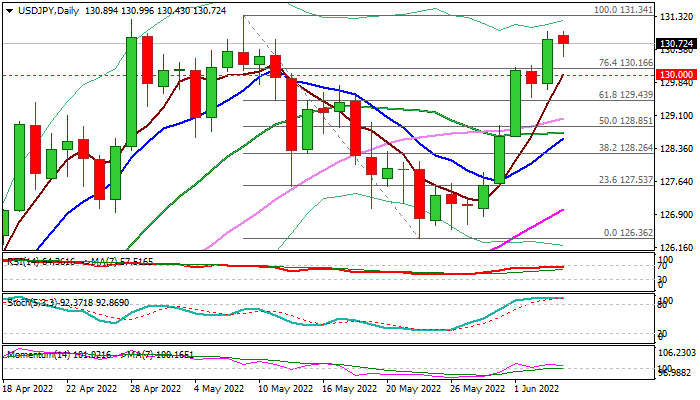
The USDJPY is consolidating under 2022 high in early Monday, following last Friday’s 0.77% advance that keeps bulls intact for further gains.
Last week’s solid US manufacturing and labor data keep the dollar inflated, while traders focus on US inflation report for May and ECB policy meeting, due later this week.
Technical studies on daily chart are bullish and underpinned with positive signal on Friday’s close above 130.16 (Fibo 76.4% of 131.34/126.36 pullback, but overbought stochastic and weaker momentum suggest the pair may hold in extended consolidation before attacking 2022 peak (131.34), break of which would open way for extension towards Fibo projections at 132.51 and 133.24 and Apr 2002 high at 133.83.
Dip-buying remains favored, with broken psychological 130 support (reinforced by 5DMA) expected to keep the downside protected.
Caution on break and close below 129.50 zone (broken Fibo 61.8% / last Thursday’s low) that could sideline bulls.
Res: 130.99; 131.34; 132.51; 133.24
Sup: 130.43; 130.00; 129.68; 129.43
USD/TRY: Turkish Lira Weakens Further and Eyes Record Low for Retest
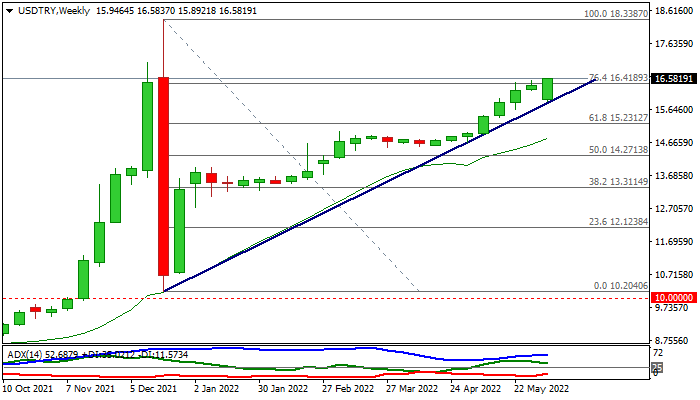
The USDTRY rose to new highest since mid-Dec 2021 on Monday and broke through pivotal Fibo barrier at 16.41 (76.4% of 18.33/10.20) pullback that adds to positive signals.
Lira came under fresh pressure after Turkey CPI data last week showed that inflation rose to 73.5% in May from 70% previous month, also hurt by surging oil prices and sanctions on Russia, Turkey’s biggest trading partner, together with the EU.
Bullish daily techs favor further gains and possible retest of a record high (18.33), though fading bullish momentum and overbought conditions may temporarily slow bulls.
Extended dips should find firm ground above rising 20DMA to keep bias with bulls and provide better levels to re-join bullish market
Res: 17.0664; 16.6628; 16.8758; 17.2204.
Sup: 16.4189; 16.3358; 16.1546; 15.9813.
Nikkei hits 2-mth high, ready to extend near term up trend
Riding on broadly positive risk sentiment, Japan's stock indexes surged to highest level in over two months. Topix finished 0.31% higher while Nikkei rose 0.56%. Among the gainers, air and land transportation shares are lifted by optimism that tourism is coming back to Japan.
Based on current momentum, Nikkei should be ready to resume the whole rebound from 24681.74. 28338.81 resistance is the first test, and break will target 100% projection of 24681.74 to 28338.81 from 25688.10 at 29345.17. For now, it's still too early to call for long term up trend resumption in the index. 30k handle could still present huge psychological resistance. But in any case, further rally will remain in favor as long as 27251.24 minor support holds.
Meanwhile, it should also be noted that the long term outlook in Nikkei is staying bullish, despite the correction that lasted one and half year. It's holding comfortably above 24129.34 structural resistance, as well as 55 month EMA. Both are keeping the up trend from 6994.89 (2008 low) intact.