Sample Category Title
GOLD ( $XAUUSD) Forecasting The Rally After Elliott Wave Zig Zag Pattern
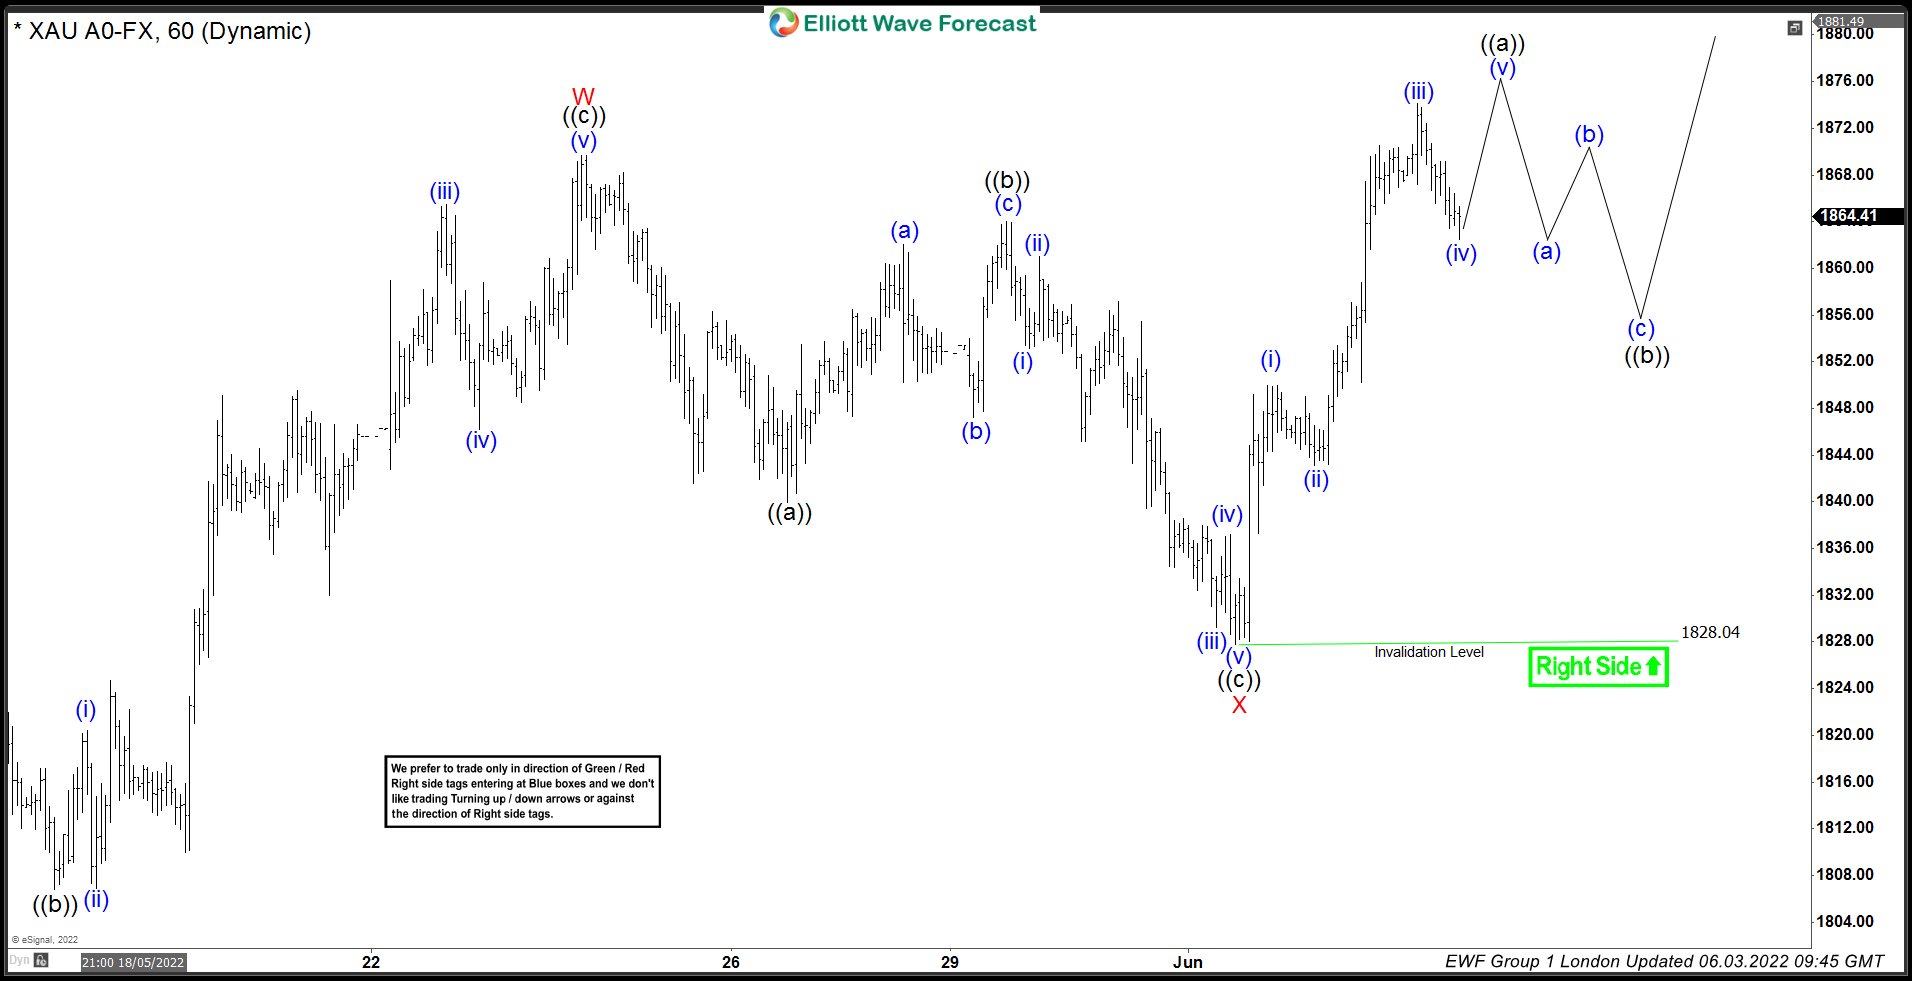
Hello fellow traders. In this technical blog we’re going to take a quick look at the Elliott Wave charts of GOLD, published in members area of the website. As our members know, GOLD is giving us correction of the cycle from the 2069 high. Recently GOLD ( $XAUUSD ) made a pull back that has had a form of Elliott Wave Zig Zag pattern. We expected GOLD to find buyers at the extreme zone from the 05/24 peak. In the further text we are going to explain the Elliott Wave Pattern and the forecast
Before we take a look at the real market example, let’s explain Elliott Wave Zigzag.
Elliott Wave Zigzag is the most popular corrective pattern in Elliott Wave theory . It’s made of 3 swings which have 5-3-5 inner structure. Inner swings are labeled as A,B,C where A =5 waves, B=3 waves and C=5 waves. That means A and C can be either impulsive waves or diagonals. (Leading Diagonal in case of wave A or Ending in case of wave C) . Waves A and C must meet all conditions of being 5 wave structure, such as: having RSI divergency between wave subdivisions, ideal Fibonacci extensions and ideal retracements.
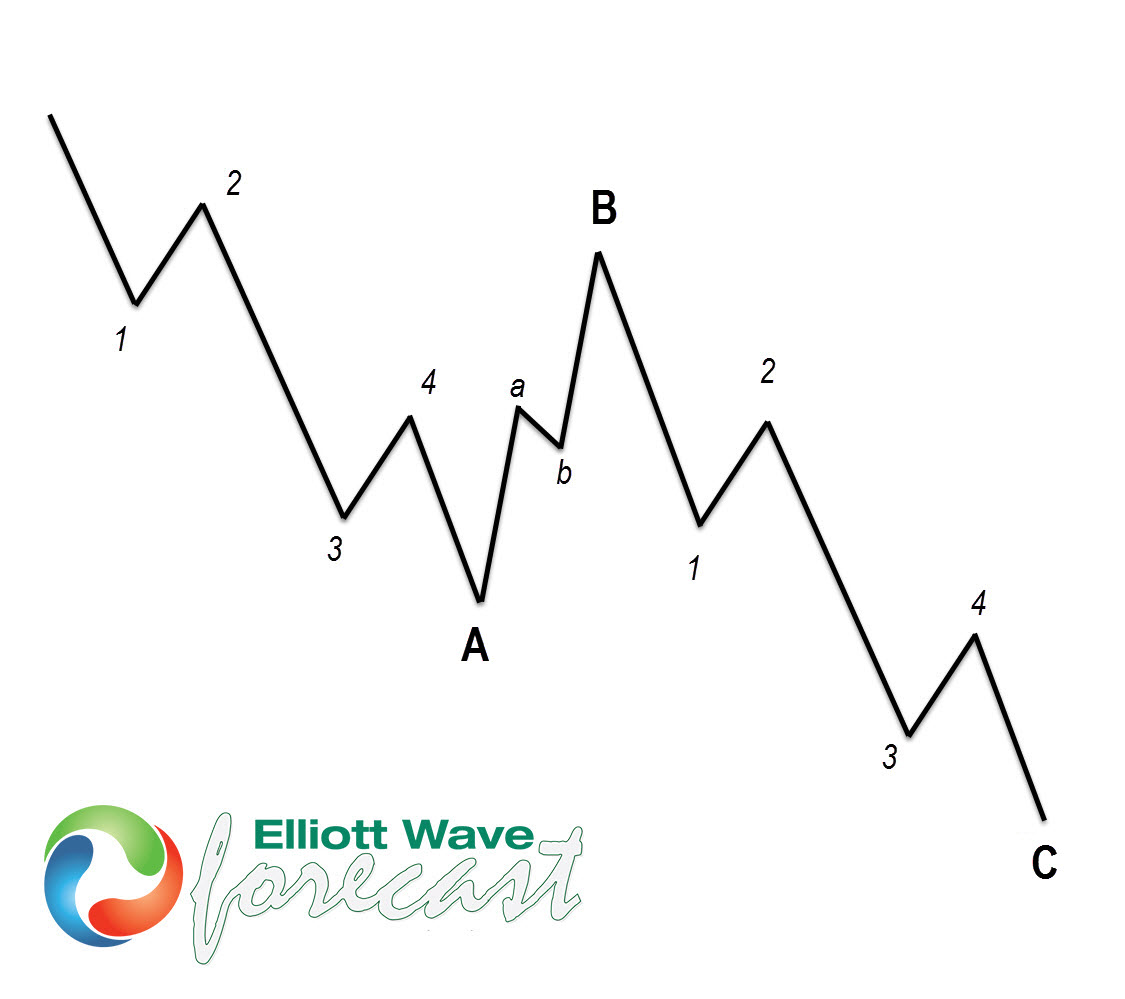
At the chart below we can see what Elliott Wave Zig Zag pattern looks like in real market.
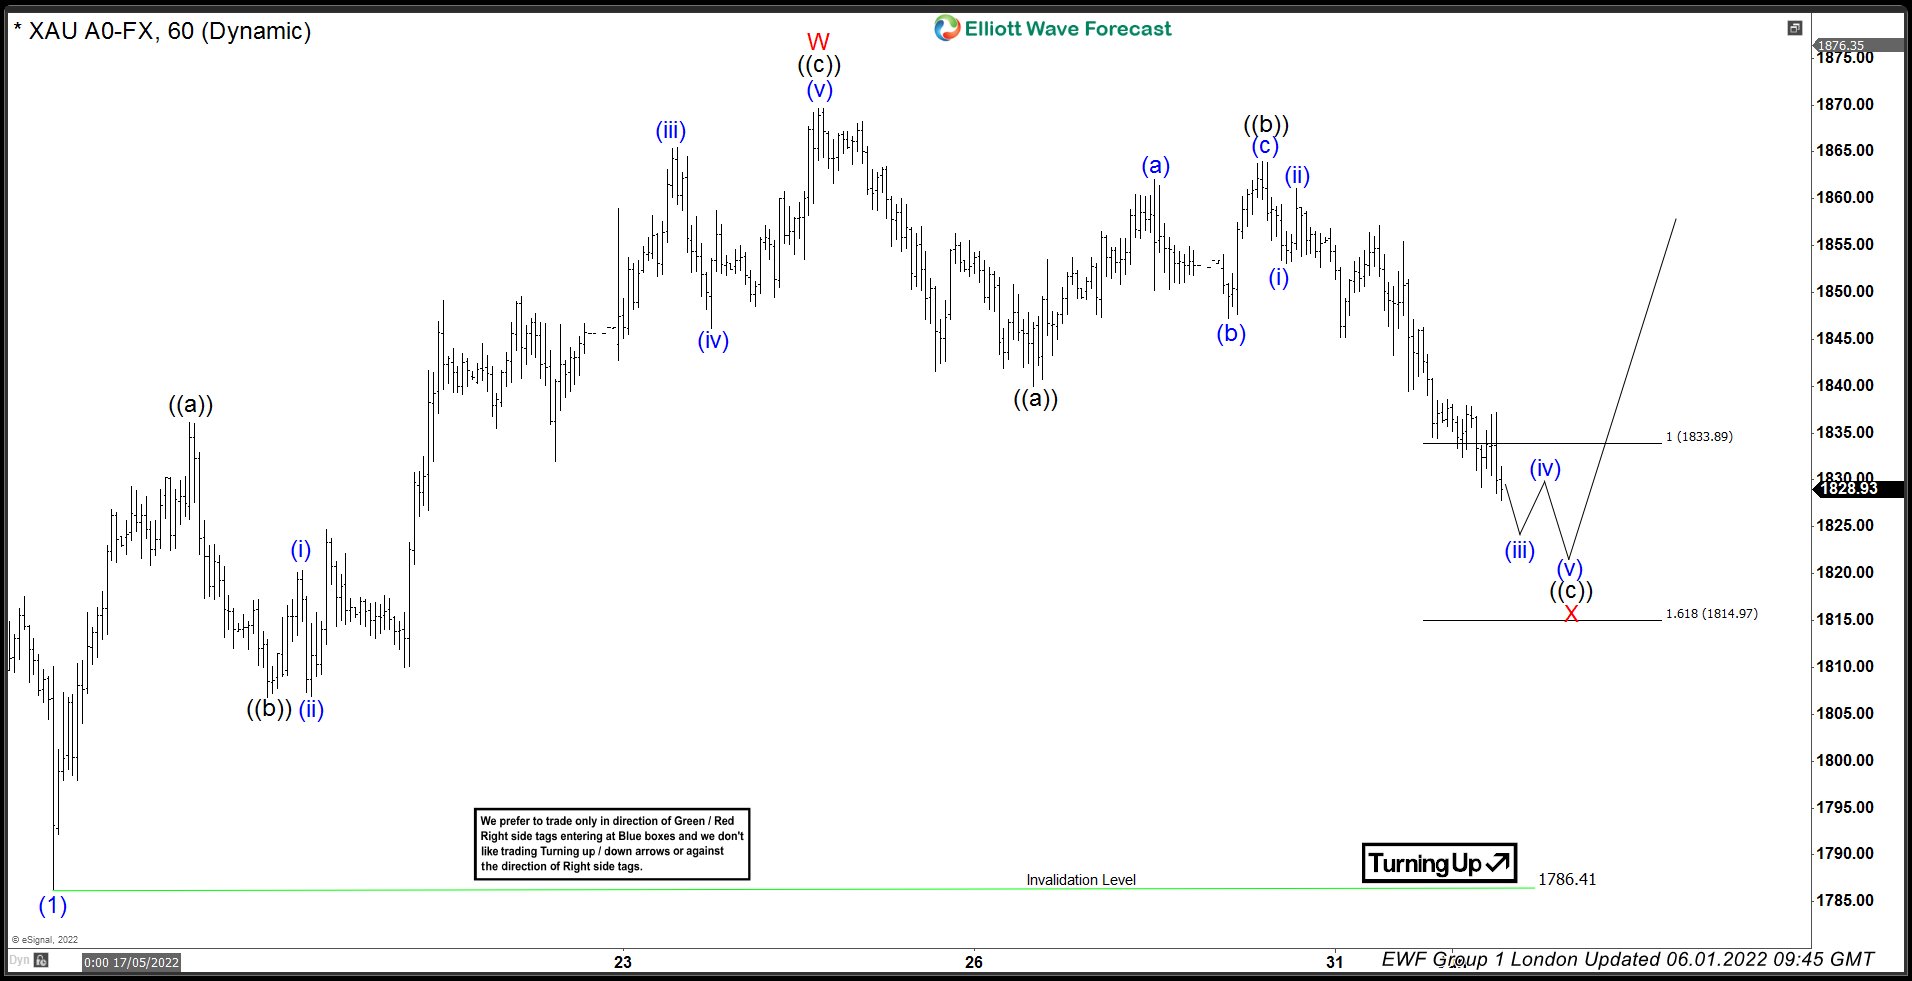
GOLD H1 London Update 06.01.2022
GOLD is giving us pull back against the 1786.4 low. Recovery has already reached the extremes from the peak at 1833.8-1814.9 area and we expect to complete X red soon. We assume pull back is unfolding as Elliott Wave Zig Zag Pattern. That means both A and C leg has to have a form of 5 waves structure. We can count clear 5 waves down in A red leg. We are calling for another marginal push lower within the marked reversal area. Anyway, we don’t recommend selling. We are aware that extreme zone is already reached and minimum number of swings is already there, turn can happen any moment.
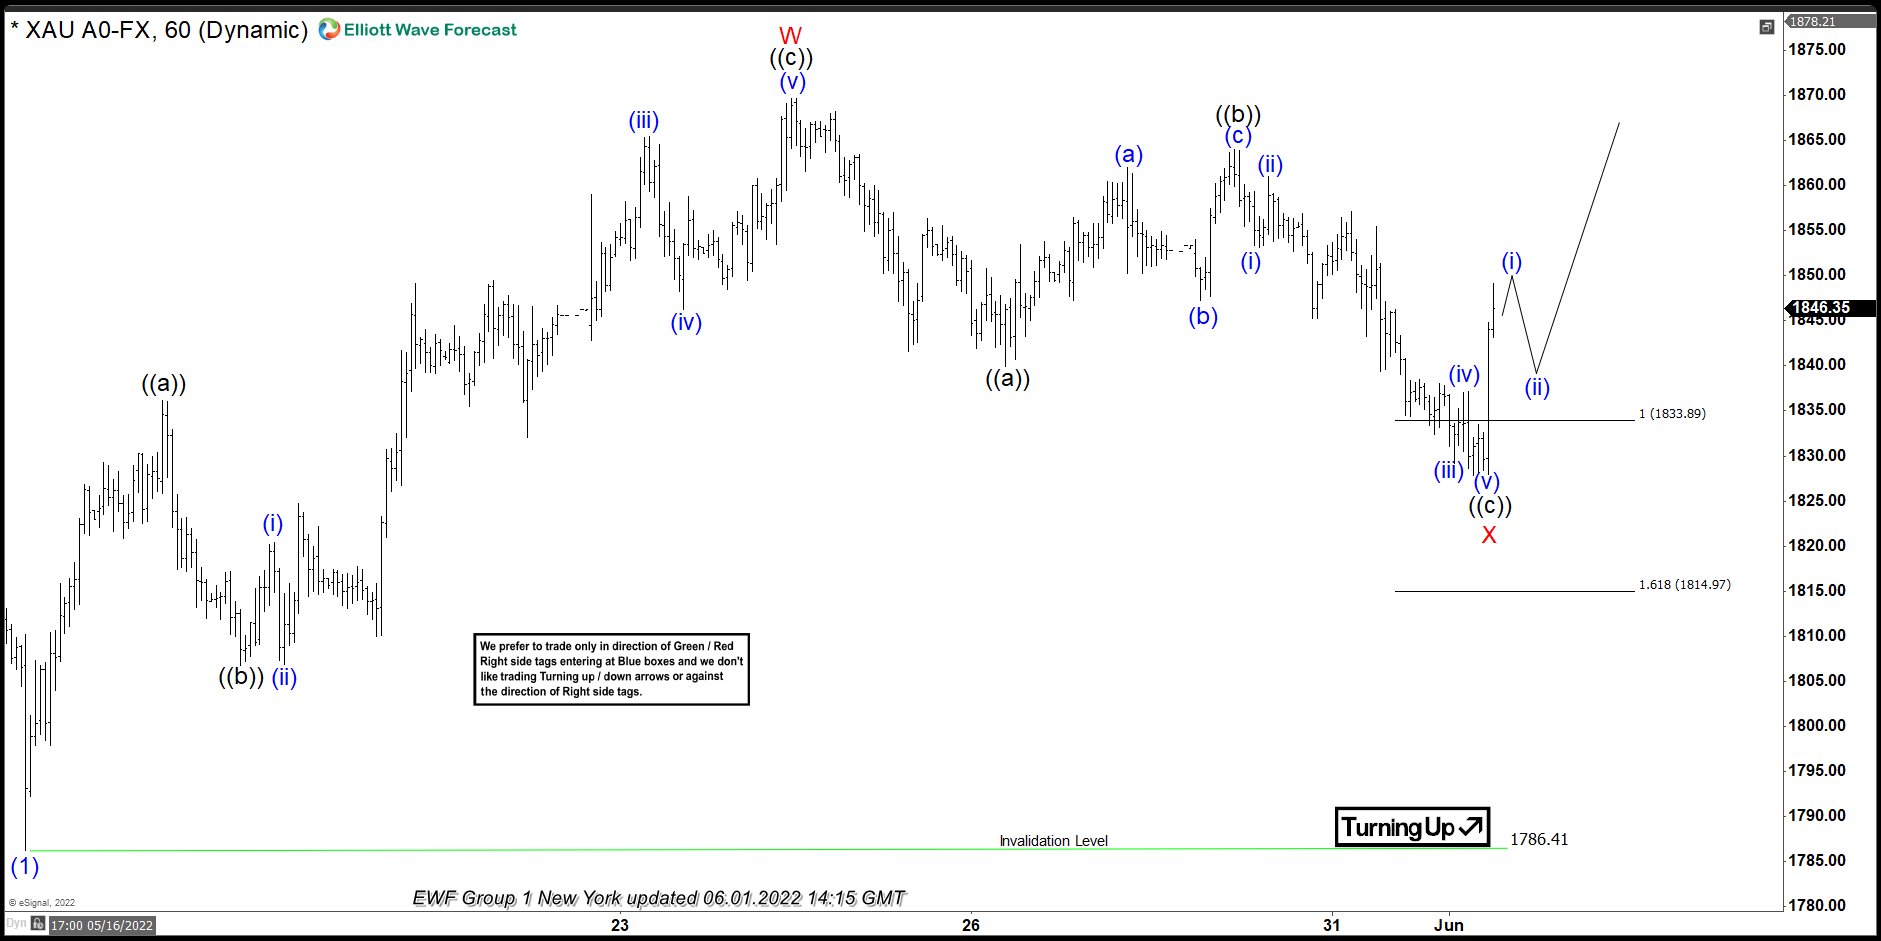
GOLD H1 New York Update 06.01.2022
GOLD has started giving us reaction from the marked zone and we count X red connector completed at 1827.7 low. Now, we need to see further separation up from the mentioned level and break above W red high : 05/24 to confirm next leg up is in progress.
GOLD H1 New York Update 06.03.2022
We got further separation higher and break of 05/24 peak, confirming next leg up is in progress. GOLD can remain supported in near term as far as 1828.04 pivot holds.
Keep in mind that market is dynamic and presented view could have changed in the mean time. You can check most recent updates in the membership area of the website. Remember that not every chart is trading recommendation. Best instruments to trade are those having incomplete bullish or bearish swings sequences. We put them in Sequence Report and best among them are shown in the Live Trading Room. You can check most recent charts in the membership area of the site.
GBPJPY Bullish Impetus Tackles Upper Bollinger Band
GBPJPY is attempting to push north of the high of 163.57 from the 5 May, coincidently where the upper Bollinger band is currently located. The pair is maintaining its bullish demeanour, forming its eighth daily consecutive green candle, after the price unearthed significant upside pressure from around the 158.00 region, where the 100-day simple moving average (SMA) formed a defence. The upward creeping SMAs are suggesting that the positive trend is intact.
Presently, the short-term oscillators are skewed to the upside. The MACD is strengthening over its zero and red trigger lines, while the RSI is improving in the bullish zone. Meanwhile, the stochastic lines have flatlined in the overbought territory, reflecting no abating in positive impetus however hinting of a modest pause in upside price action.
In the positive scenario, immediate resistance is being applied at the 163.57 mark by the May 5 high and from the upper Bollinger band. Nudging higher, the pair could meet the nearby 164.29 deterrent, which is the 23.6% Fibonacci retracement of the up leg from 150.96 until 168.42, while additional appreciation in the price may then challenge the 166.07-168.55 resistance section. Should this obstruction that formed over the end of January until mid-February 2016 period, which curbed advances in April, fail this time to dismiss gains in the price, the early February high of 170.62 could then come into play.
Otherwise, if the pair fades from the upper Bollinger band, an initial support zone from the 162.26 inside swing high until the 38.2% Fibo of 161.76 may provide buyers with a foothold. However, in the event selling pressures overwhelm, the next downside limitations could show face at the 161.00 handle and the mid-Bollinger band at 160.37 ahead of the 50.0% Fibo of 159.69. Surrendering extra ground, the bears may then confront the 100-day SMA at 158.63 and the 158.00 hurdle before aiming for the lower Bollinger band at 156.90.
Summarizing, GBPJPY’s broader bullish structure remains intact above the 147.39-149.04 support foundations. That said, a dive breaking the 154.91-155.45 support border could trigger worries about downward pressures. Yet, for the bullish picture to bolster, the price would need to pilot above the multi-year high extending beyond the 168.55 mark. If the price ebbs beneath the mid-Bollinger band, favourable odds for either direction return to the table.

EURAUD Penetrates the Uptrend Line But Finds Support at 23.6% Fibo
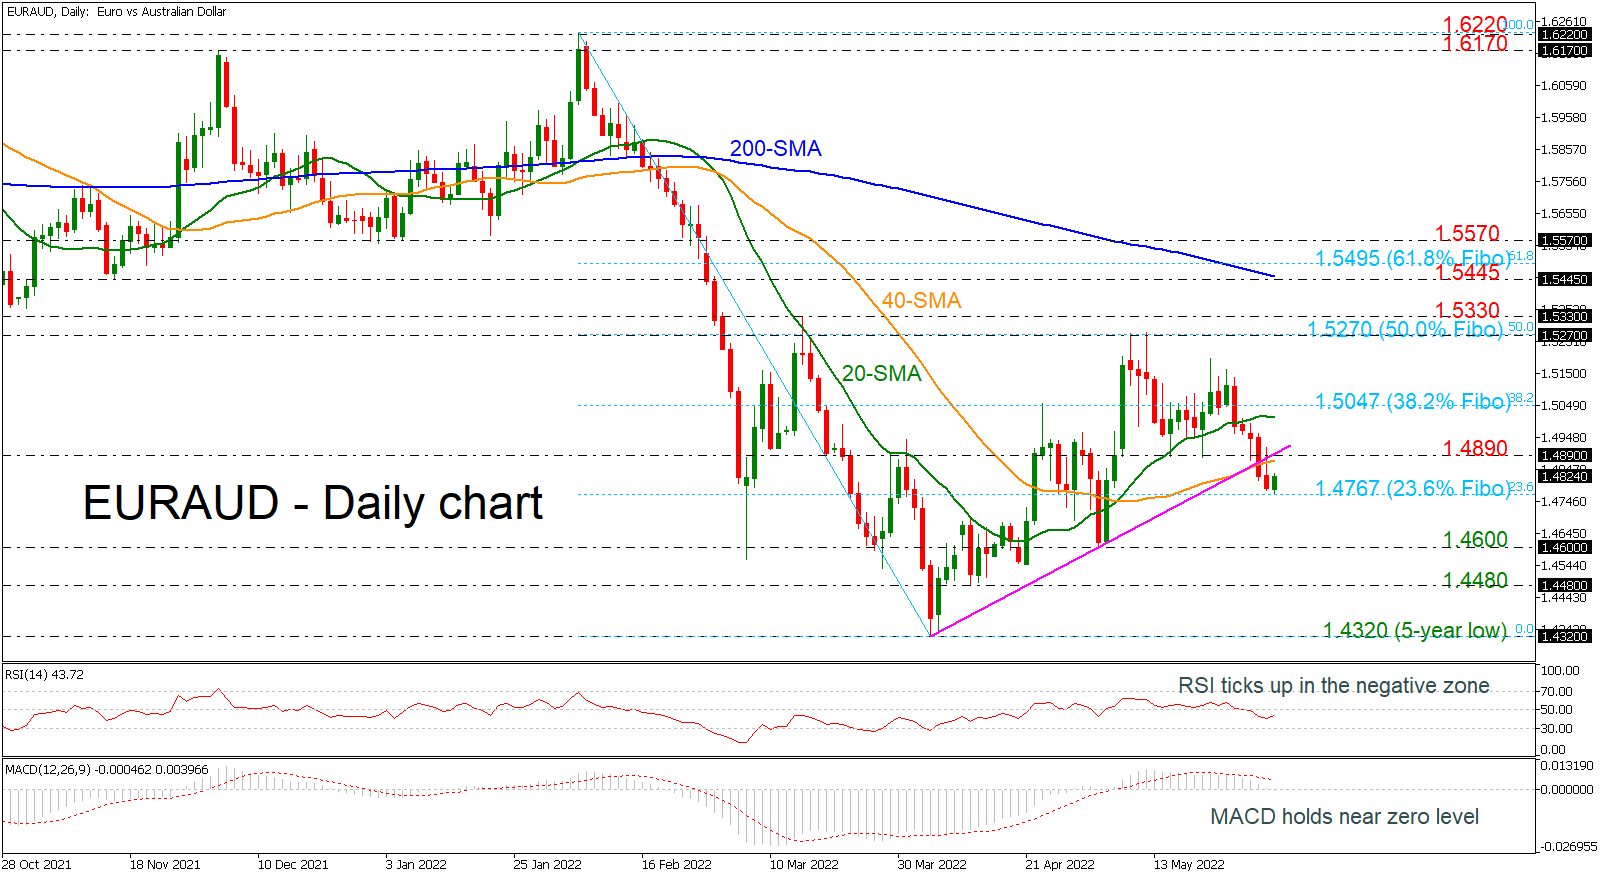
EURAUD is currently rebounding off the 23.6% Fibonacci retracement level of the down leg from 1.6220 to 1.4320 at 1.4767. The pair broke the uptrend line to the downside in the previous sessions, suggesting a bearish movement. The MACD is moving sideways around the zero level; however, the RSI is ticking up in the bearish region.
A failure to overcome the 1.4890 resistance level and the ascending line could send the price down to the 1.4767 support and the 1.4600 psychological mark. Even lower, support could be next found around the 1.4480 barrier, while a decisive close below the five-year low of 1.4320 could stage a steeper sell-off.
Alternatively, if 1.4890 proves easy to get through, the spotlight will turn to the 20-day simple moving average (SMA) at 1.5000, ahead of the 38.2% Fibonacci at 1.5047. On top of that, the bulls would need to clear the 50.0% Fibonacci of 1.5270 to push the rally towards the 1.5330 barrier.
In the medium-term picture, EURAUD turned negative after violating the ascending trend line started from the 1.4320 low. Should the market jump above the previous highs of 1.5270, the outlook may turn brighter.
A Bounce, But Hardly the Start of a Rise in the Crypto Market
Bitcoin rose 2.4% to $30.5K in the past 24 hours. Ethereum added 0.2% to $1820. Ether was unexpectedly among the laggards. Altcoins from the top 10 rose from 1.5% (BNB) to 4.1% (Solana).
Total crypto market capitalisation, according to CoinMarketCap, rose 1.8% overnight to $1.26 trillion. Bitcoin’s dominance index added 0.2% to 46.3%. The cryptocurrency fear and greed index was down 3 points to 10 by Friday and remains in “extreme fear”.
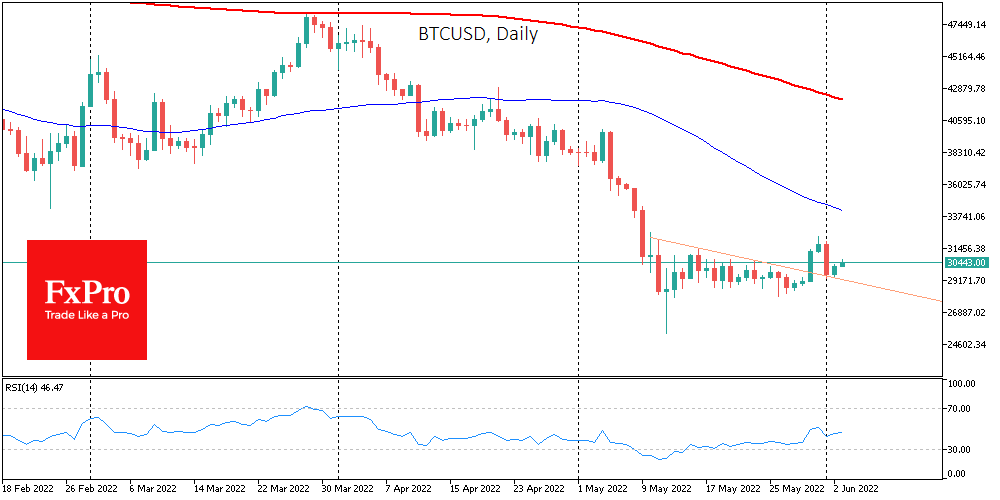
Bitcoin rebounded on Thursday after falling sharply the day before. The strengthening was helped by a weaker dollar and positive stock indexes. The local downtrend (former consolidation triangle from May 10) turned into a support line. For the short term, this is good news. However, it is worth remembering that this is a fragile structure that could be broken by both a stronger dollar and a market reaction to labour market news.
Bitcoin has already reached the “bottom” in the current cycle of decline and will not fall below $25,000, said former BitMEX cryptocurrency exchange CEO, Arthur Hayes. However, a market trend reversal should be expected when the Fed stops raising rates.
According to BTC.TOP CEO Jiang Zhuoer, the bearish phase will end in six months. A possible driver for this could be the Ethereum update, which should occur between October and December. Another bullish factor will be the US Federal Reserve’s refusal to hike rates.
According to a Goldman Sachs survey, 6% of global insurance companies have invested or want to invest in cryptocurrencies. According to the Economist Impact survey, a growing number of investors see digital currencies as a useful tool for portfolio diversification.
GBP/USD: Cable Remains Constructive But Downside Still Vulnerable; US Jobs Data in Focus
Cable is moving within a narrow range in early Friday and remains constructive after Thursday’s 0.75% advance.
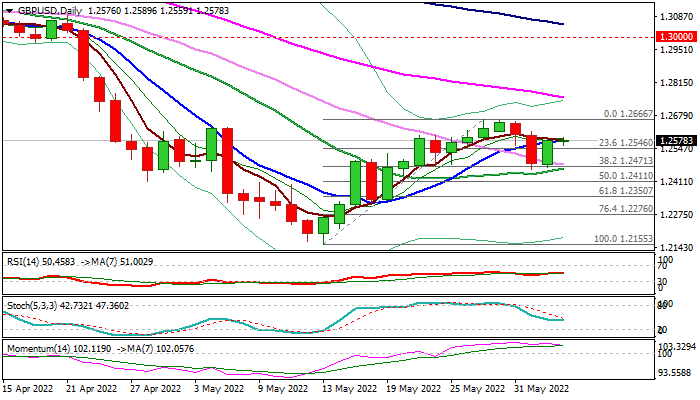
Technical picture is mixed, as moving averages of 10/20/30 days are conflicting, bullish momentum is weaker and RSI neutral.
Falling daily Ichimoku clouds weighs, along with a double-top pattern forming on weekly chart and warning of recovery stall.
Near-term action is struggling at 10DMA (1.2571) which needs to be cleared to open way for full retracement of 1.2666/1.2458 pullback.
On the other side, holding below 10DMA would keep the downside vulnerable, but break of pullback’s low (1.2458), reinforced by 20DMA, would bring bears back to play.
US NFP data are key event today and expected to generate fresh direction signal.
Res: 1.2589; 1.2616; 1.2666; 1.2700
Sup: 1.2546; 1.2471; 1.2458; 1.2411
EURUSD Approaches Key Resistance ahead of US NFP Data
The price of crude oil rose even after the latest decision by OPEC and its partners pledged to boost production. They will increase production by 650k barrels a day in July and August. This is higher than the 400k barrels per day that the cartel has been hiking in the past few months. The decision came a few days after the EU agreed to impose a ban on Russian oil imports. It also came a day after Saudi Arabia said that it will be open to hike production depending on Russia’s supply. Oil also rose after the EIA published a sharp drawdown of oil inventories. They declined by more than 5 million, which was higher than the median estimate of a 1.3 million drawdown.
The US dollar retreated slightly ahead of the upcoming official jobs numbers by the Bureau of Labor Statistics. Economists expect the data to show that the country created 325k jobs in May from the previous 406k. They also see the unemployment rate falling from 3.6% to 3.5%. The most important data to watch will be wages considering that inflation has surged. On Thursday, data by ADP showed that the private sector added just 128k jobs. On the other hand, data by the BLS showed that initial jobless claims declined to 200k.
American stocks moved sideways after Jamie Dimon of JP Morgan warned that the country’s economy faced a hurricane in the coming months. He cited the ongoing inflationary pressures in the country and the slowdown in hiring. Stocks also reacted to the latest earnings and revenue guidance by Microsoft. The company said that it expects its fiscal fourth-quarter sales to be $51.94 billion and $52.4 billion. This was lower than the previous range of between $52.4 billion and $53.2 billion. The company cited the lower guidance to the strong US dollar. This means that the company’s foreign earnings will be lower when converted to the US dollar.
NAS100
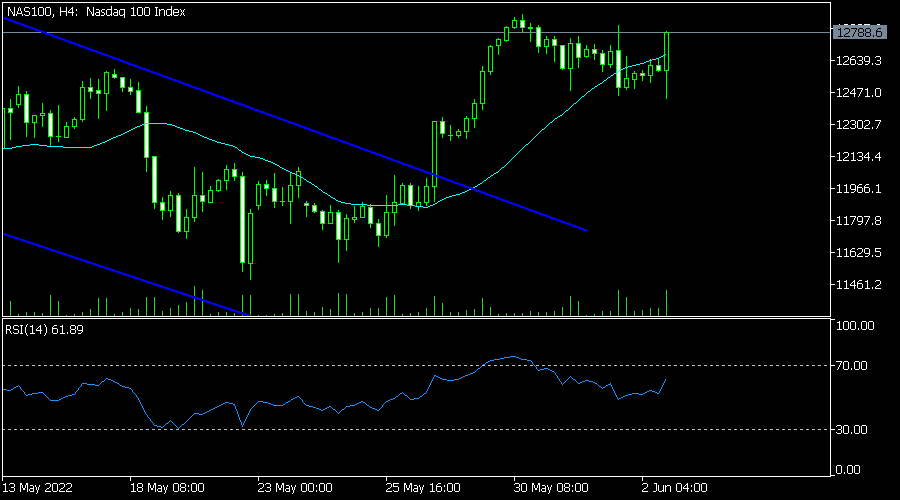
The Nasdaq 100 index rose to a high of $12,780 from this week’s low of $12,400. On the four-hour chart, the index is above the descending channel shown in blue. It managed to cross the 25-day and 50-day moving averages while the Relative Strength Index (RSI) has moved close to the overbought level. Therefore, the index will likely keep rising as bulls target the resistance at $13,000.
EURJPY
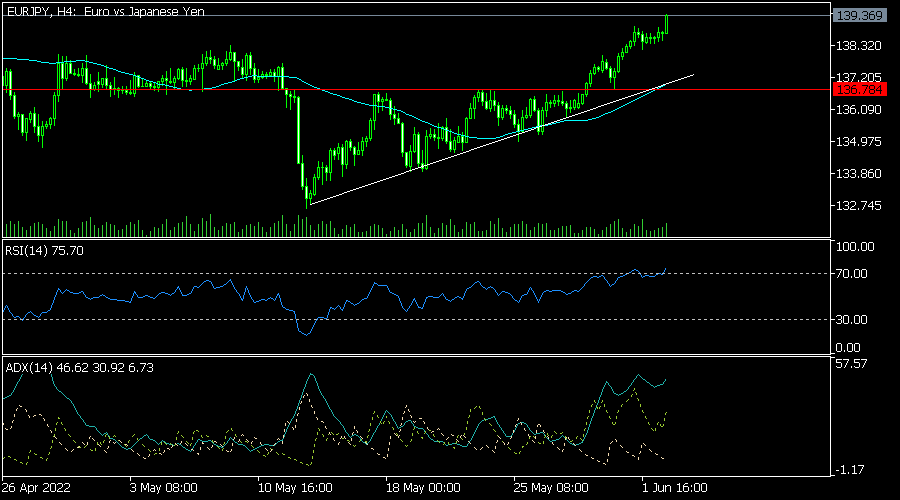
The EURJPY pair rallied to a high of 139.36 after the strong EU PPI data. It rose to the highest level since April 21st. It rose above the important resistance level at 136.78 and the ascending trendline shown in white. It also rose above the 25-day moving average while the Relative Strength Index (RSI) has moved above the overbought level. The Average Directional Index has kept rising. Therefore, the pair will likely continue rising.
EURUSD
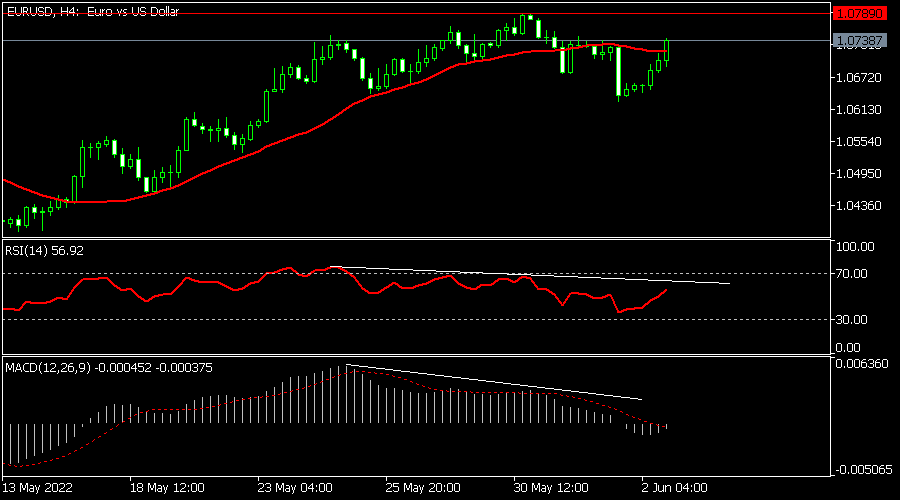
The EURUSD pair continued rising ahead of the upcoming US NFP data. It is trading at 1.0737, which is above the important support at 1.0615. The MACD has moved slightly below the neutral level while the RSI has moved above the neutral level at 50. The pair will likely keep rising ahead of the US jobs data, with the next key resistance being at 1.0790.
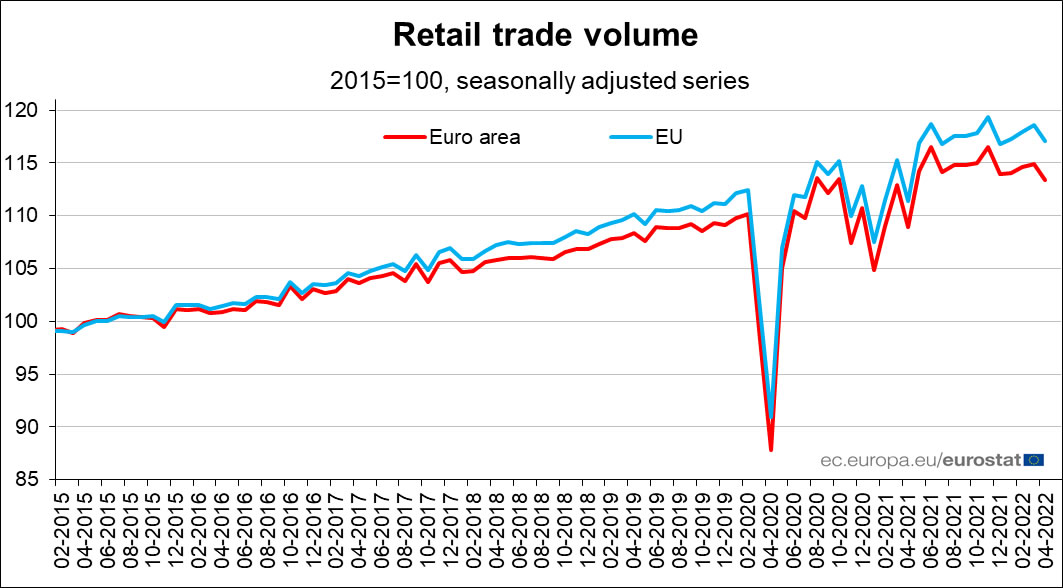
Eurozone retail sales dropped -1.3% mom in Apr, EU down -1.3% mom
Eurozone retail sales dropped -1.3% mom in Apr, much worse than expectation of 0.3% mom rise. Volume of retail trade decreased by -2.6% for food, drinks and tobacco and by -0.7% for non-food products, while it increased by 1.9% for automotive fuels.
EU retail sales dropped -1.3% mom. Among Member States for which data are available, the largest monthly decreases in the total retail trade volume were registered in Slovenia (-7.7%), Germany (-5.4%) and Latvia (-3.9%). The highest increases were observed in Spain (+5.3%), Luxembourg (+3.7%) and Ireland (+1.9%).
Big Picture: A (Mild) Recession in Western Economies Seems Unavoidable
Key takeaways
- The war in Ukraine is contributing to the biggest commodity price shock in decades, adding to already significant inflation pressures and need for vigilant central bank tightening.
- Yet near-term economic growth will continue to be supported by pent-up demand, savings, and the re-opening of economies, benefiting especially service sector activity.
- However, substantial monetary policy tightening will increasingly weigh on economic growth, prompting a mild recession in the US around Q2 23, spilling over to other western economies and EMs later next year.
- Recovery in the Chinese economy in 23 will mitigate some of the setback, but still we expect unemployment to rise in the US and later in other western economies.
- The risk is skewed toward an earlier recession given the scale of financial tightening and erosion of purchasing power from high inflation.
Australian Economic Growth Forecasts Lowered to 4% in 2022 and 2% in 2023
Increased stress for the household sector and a major downward revision to the dwelling construction cycle have lowered our growth forecasts in 2022 from 4.5% to 4.0% and 2.5% to 2.0% in 2023. Still, 2022 is a strong year for growth, as the economy reopens and households take advantage of their high savings rates and solid balance sheets.
Following the release of the March quarter national accounts for Australia we have slightly lowered our growth forecasts for 2022 and 2023.
The 2022 growth rate is lowered from 4.5% to 4.0%; 2023 is reduced from 2.5% to 2.0%; while 2024 is lifted from 2.0% to 2.5%.
In the March quarter national accounts, we saw strong consumer spending growth of 1.5% which was largely funded by a fall in the savings rate from 13.4% to 11.4% releasing $6bn to finance the $8.7bn in additional consumer spending.
At 11.4% currently, the household savings rate remains well above the 6% “equilibrium” rate near where we expect the rate to settle by year’s end.
That fall in the savings rate is likely to release a further $15-20bn to support household spending through the year.
Overall, we expect household spending to increase by a solid 6% over the course of 2022 highlighted by 2.6% and 1.1% growth in the June and September quarters to supplement the (disrupted) 1.5% increase in the March quarter.
That is down from a forecast 6.2%. We are now expecting a more abrupt slowing in the December quarter (revised down from 0.9% to 0.7%) as the reopening effect fades; the boost from a lower savings rate ease; and house prices continue to fall.
Consumer Sentiment is likely to remain weak in the face of higher costs and rising interest rates. However, confidence in job security is likely to remain high and household balance sheets have been strengthened by the accumulation of around $265 billion in excess savings over the last two years.
Perceived job security and the balance sheet buffer will allow households to maintain spending plans at a higher level than would have been the case in the current environment of rising living costs and increases in interest rates.
As we saw in the March quarter there is considerable “opening up” momentum in the household sector despite the material disruptions from Omicron and the floods.
The June and September quarters are likely to continue to see that boost momentum lifting further in the absence of those disruptions in the March quarter.
There is still scope for considerable “catch up” – discretionary services consumption is still 12% below pre Covid levels.
The major states – NSW and Victoria – which were most impacted by lock downs will be in catch up. While nationally overall spending is 2.5% above pre Covid levels it is 5.3% above pre Covid levels outside NSW and Victoria.
However, by the December quarter, with the savings rate converging on that 6% equilibrium level and households becoming increasingly stretched by further increases in the cost of living (food; rents; energy); rising interest rates and falling house prices we anticipate that momentum in consumer spending will slow appreciably.
That lacklustre momentum will extend into 2023 with consumer spending growth likely to slow from 6% in 2022 to a below trend 2.5% in 2023.
In turn businesses who are currently generally quite upbeat will have to review their investment plans. We expect business investment growth to slow from 8% in 2022 to 4% in 2023.
Another key factor behind our downward revisions to growth in both 2022 and 2023 is the dwelling construction cycle.
Detached house dwelling approvals have been signalling a very strong cycle, but dwelling construction contracted for the second quarter in a row in the March quarter. Activity has been clearly impacted by labour / material shortages, and runaway costs.
Projects are taking longer to complete while some are being shelved. We have lowered our forecast for dwelling construction growth from 9.4% to 5.6% in 2022; and pushed some of the Home Builder related activity into 2023 but severely written down overall activity, particularly in the second half of 2023.
Supply and demand for new dwellings is expected to dry up under the weight of high costs; labour shortages; and restrained demand.
These forecasts are heavily reliant on our policy; wages; and inflation forecasts.
We have not changed those key parameters: peak in RBA cycle of 2.25% by May next year; peak to trough fall in house prices of 14% to mid 2024; inflation moving back toward the target zone by end 2023; wages growth to peak in 2023; the unemployment rate to bottom out at 3.2% by end 2022 and increasing in the second half of 2023 as demand slows and overseas migration returns to pre Covid levels by end 2024.
Eurozone PMI composite finalized at 54.8, risks skewed to downside for coming months
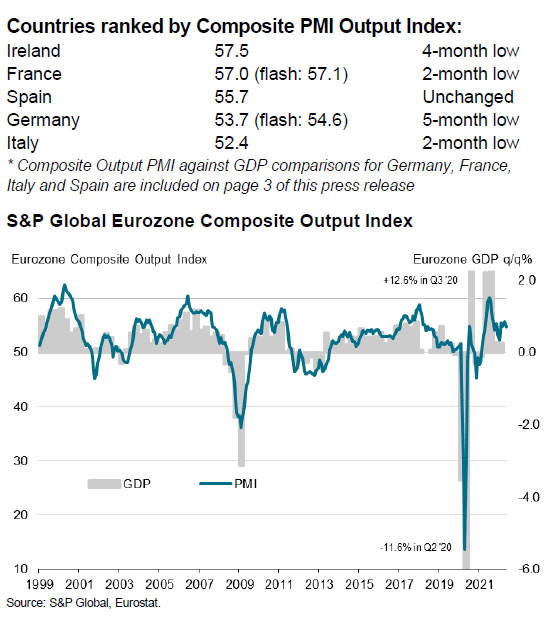
Eurozone PMI Services was finalized at 56.1 in May, down from April's 57.7. PMI Composite was finalized at 54.8, down from April's 55.8, a 4-month low. Looking at some member states, Ireland PMI composite dropped to 4-month low at 57.5. France dropped to 2-month low at 57.0. Spain was unchanged at 55.7. Germany dropped to 5-month low at 53.7. Italy dropped to 2-month low at 52.4.
Chris Williamson, Chief Business Economist at S&P Global Market Intelligence said: "Strong demand for services helped sustain a robust pace of economic growth in May, suggesting the eurozone is expanding an underlying rate equivalent to GDP growth of just over 0.5%. However, risks appear to be skewed to the downside for the coming months...
"The near-term fate of the eurozone economy will therefore depend on the extent to which a fading tailwind of pent-up demand can offset the headwinds of geopolitical uncertainty amid the Ukraine war, supply chain disruptions and the rising cost of living, the latter likely exacerbated by tightening monetary conditions."