

Sample Category Title
GBP/USD Mid-Day Outlook
Daily Pivots: (S1) 1.2500; (P) 1.2543; (R1) 1.2618; More...
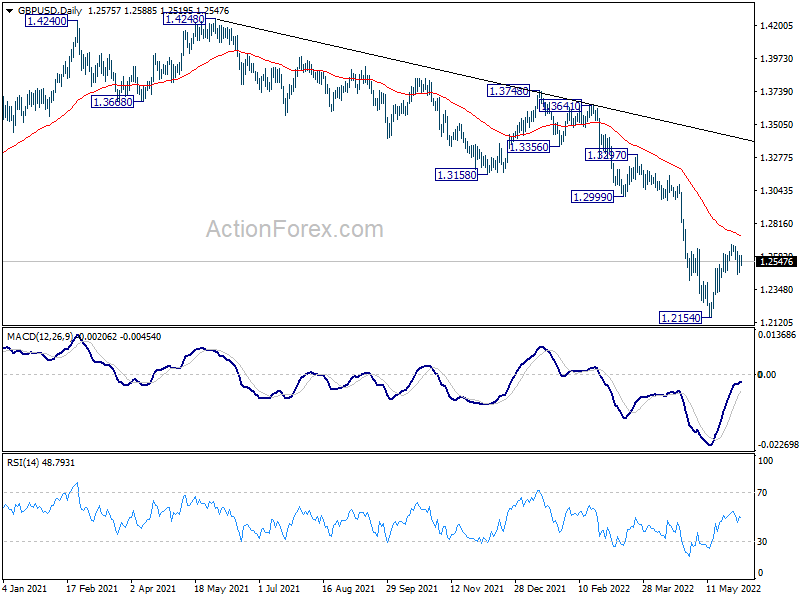
Intraday bias in GBP/USD remains neutral at this point and outlook is unchanged. On the upside, above 1.2666 will resume the rebound from 1.2154. Sustained of 55 day EMA (now at 1.2726) will target 1.2999 support turned resistance. On the downside, though, break of 1.2457 minor support will turn bias back to the downside for retesting 1.2154 low instead.
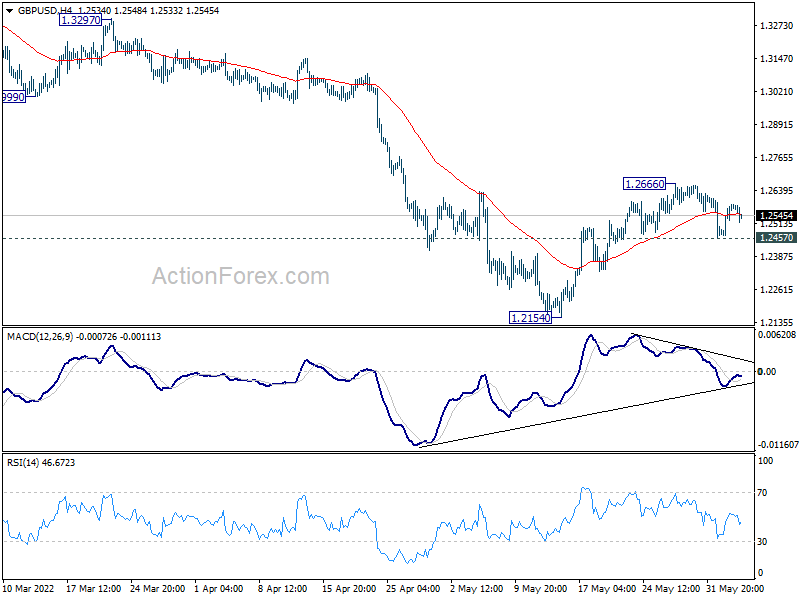
In the bigger picture, fall from 1.4248 (2018 high) could be a leg inside the pattern from 1.1409 (2020 low), or resuming the longer term down trend. Deeper decline is expected as long as 1.2999 support turned resistance holds. On resumption, next target is 1.1409 low.
USD/CHF Mid-Day Outlook
Daily Pivots: (S1) 0.9556; (P) 0.9597; (R1) 0.9621; More...
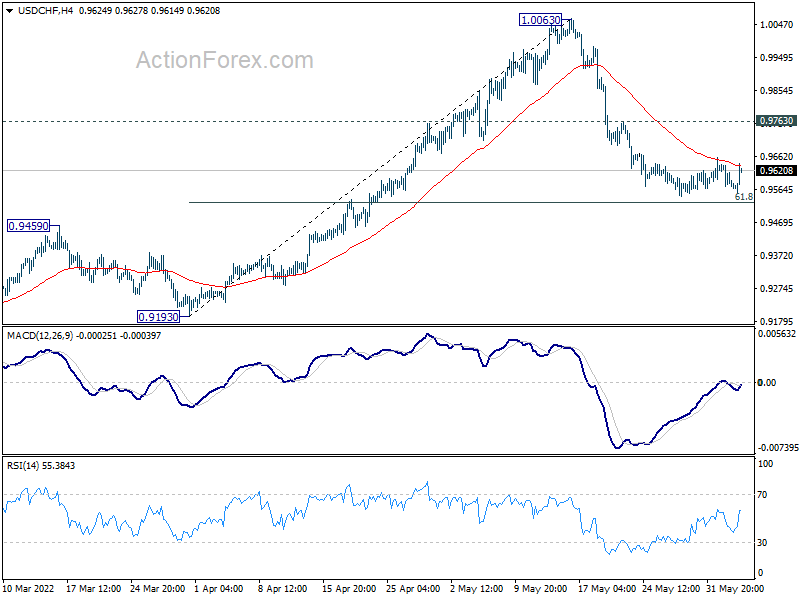
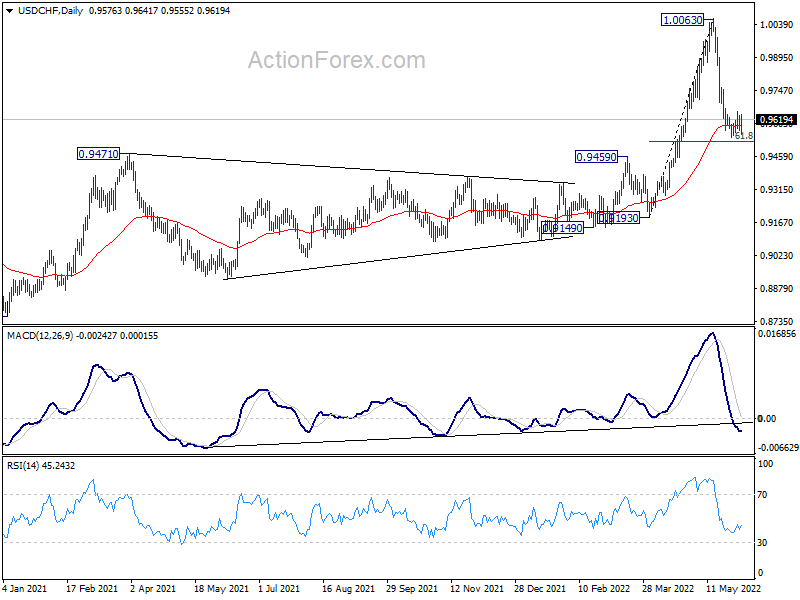
Intraday bias in USD/CHF stays neutral and outlook is unchanged. Strong support is expected from 61.8% retracement of 0.9193 to 1.0063 at 0.9525 to complete the pull back from 1.0063. On the upside, above 0.9763 minor resistance will turn bias back to the upside for retesting 1.0063 high. However, sustained break of 0.9525 will bring deeper decline to 0.9193 support.
In the bigger picture, down trend from 1.0342 (2016 high) should have completed with three waves down to 0.8756 (2021 low) already. Rise from 0.8756 is likely a medium term up trend of its own. Next target is 1.0237/0342 resistance zone. This will remain the favored case as long as 0.9471 resistance turned support holds. However, sustained break of 0.9471 will extend long term range trading with another falling leg.
USD/JPY Mid-Day Outlook
Daily Pivots: (S1) 129.53; (P) 129.88; (R1) 130.26; More...
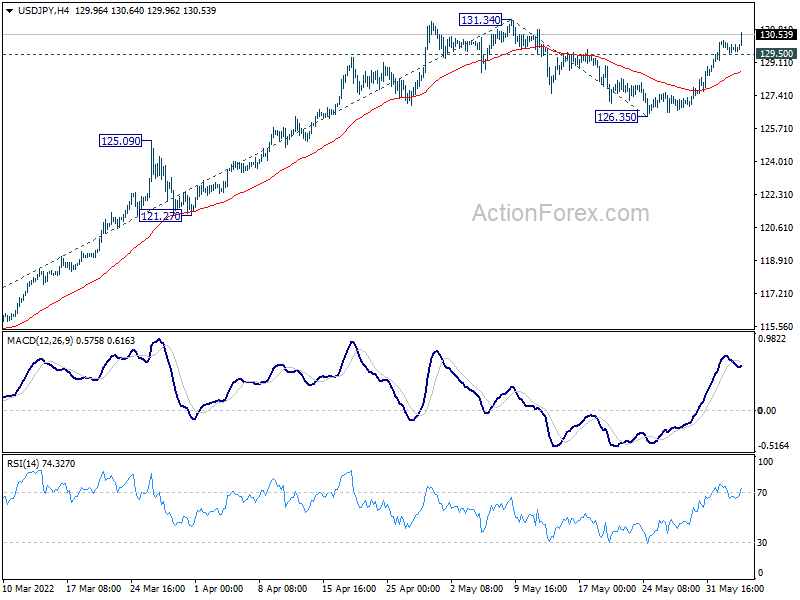
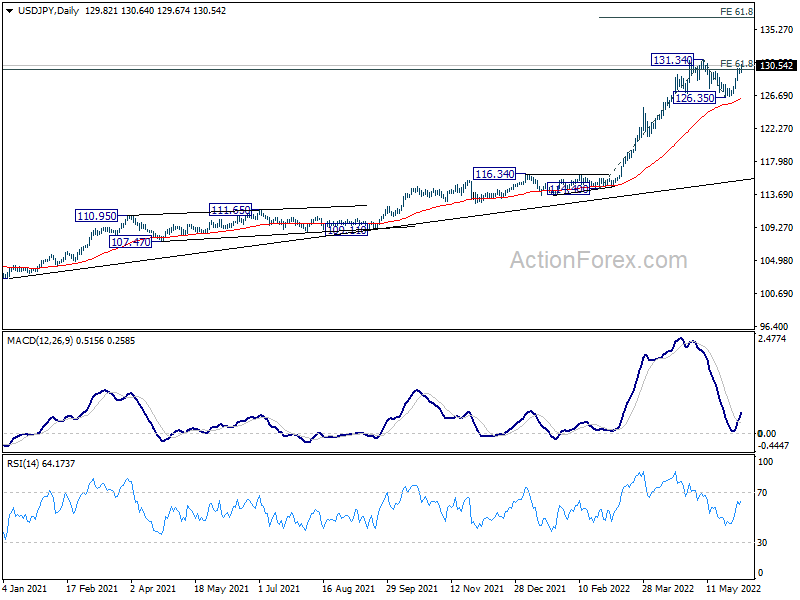
USD/JPY's rally continues today and intraday bias stays on the upside for 131.34 resistance. Decisive break of 131.34 resistance will confirm up trend resumption for 61.8% projection of 114.40 to 131.34 from 126.35 at 136.81. On the downside, below 129.50 minor support will delay the bullish case and turn intraday bias neutral first.
In the bigger picture, current rally is seen as part of the long term up trend form 75.56 (2011 low). Sustained trading above 61.8% projection of 75.56 (2011 low) to 125.85 (2015 high) from 98.97 at 130.04 will pave the way to 100% projection at 149.26, which is close to 147.68 (1998 high). For now, this will remain the favored case as long as 121.27 support holds.
Dollar Rises on Strong NFP, Yen Selling Persists
Dollar jumps broadly in early US session after stronger than expected headline non-farm payroll numbers. For now, the greenback is still behind Canadian and Australian Dollar in the weekly race, however. On the other hand, Yen's selloff is extending again, as pressured by strong rally in global benchmark treasury yields. European majors are mixed, with Euro being slightly stronger.
Technically, the focus for the rest of the session would be on Dollar against European majors. To be specific, levels to watch include 1.0626 minor support in EUR/USD, 12.2457 minor support in GBP/USD, and 0.9763 minor resistance in USD/CHF. Break of these levels could set the base for more Dollar rally next week.
In Europe, UK is on Platinum Jubilee holiday. DAX is up 0.24%. CAC is up 0.25%. Germany 10-year yield is up 0.029 at 1.271. Earlier in Asia, Hong Kong and China were on holiday. Nikkei rose 1.27%. Japan 10-year JGB yield dropped -0.0089 to 0.236. Singapore Strait Times rose 0.16%.
US NFP grew 390k in May, unemployment rate unchanged at 3.6%
US non-farm payroll employment grew 390k in May, above expectation of 325k. Prior month's growth was also revised up from 428k to 436k. Overall non-farm employment was still down by -822k, or -0.5% from its prepandemic level.
Unemployment rate was unchanged at 3.6% for the third month in a row, above expectation of 3.5%. No of unemployed was essentially unchanged at 6.0m. Participation rate rose 0.1% to 62.3%.
Average hourly earnings rose only 0.3% mom, below expectation of 0.4% mom.
Eurozone retail sales dropped -1.3% mom in Apr, EU down -1.3% mom
Eurozone retail sales dropped -1.3% mom in Apr, much worse than expectation of 0.3% mom rise. Volume of retail trade decreased by -2.6% for food, drinks and tobacco and by -0.7% for non-food products, while it increased by 1.9% for automotive fuels.
EU retail sales dropped -1.3% mom. Among Member States for which data are available, the largest monthly decreases in the total retail trade volume were registered in Slovenia (-7.7%), Germany (-5.4%) and Latvia (-3.9%). The highest increases were observed in Spain (+5.3%), Luxembourg (+3.7%) and Ireland (+1.9%).
Eurozone PMI composite finalized at 54.8, risks skewed to downside for coming months
Eurozone PMI Services was finalized at 56.1 in May, down from April's 57.7. PMI Composite was finalized at 54.8, down from April's 55.8, a 4-month low. Looking at some member states, Ireland PMI composite dropped to 4-month low at 57.5. France dropped to 2-month low at 57.0. Spain was unchanged at 55.7. Germany dropped to 5-month low at 53.7. Italy dropped to 2-month low at 52.4.
Chris Williamson, Chief Business Economist at S&P Global Market Intelligence said: "Strong demand for services helped sustain a robust pace of economic growth in May, suggesting the eurozone is expanding an underlying rate equivalent to GDP growth of just over 0.5%. However, risks appear to be skewed to the downside for the coming months...
"The near-term fate of the eurozone economy will therefore depend on the extent to which a fading tailwind of pent-up demand can offset the headwinds of geopolitical uncertainty amid the Ukraine war, supply chain disruptions and the rising cost of living, the latter likely exacerbated by tightening monetary conditions."
USD/JPY Mid-Day Outlook
Daily Pivots: (S1) 129.53; (P) 129.88; (R1) 130.26; More...
USD/JPY's rally continues today and intraday bias stays on the upside for 131.34 resistance. Decisive break of 131.34 resistance will confirm up trend resumption for 61.8% projection of 114.40 to 131.34 from 126.35 at 136.81. On the downside, below 129.50 minor support will delay the bullish case and turn intraday bias neutral first.
In the bigger picture, current rally is seen as part of the long term up trend form 75.56 (2011 low). Sustained trading above 61.8% projection of 75.56 (2011 low) to 125.85 (2015 high) from 98.97 at 130.04 will pave the way to 100% projection at 149.26, which is close to 147.68 (1998 high). For now, this will remain the favored case as long as 121.27 support holds.
Economic Indicators Update
| GMT | Ccy | Events | Actual | Forecast | Previous | Revised |
|---|---|---|---|---|---|---|
| 22:30 | AUD | AiG Performance of Construction Index May | 50.4 | 55.9 | ||
| 06:00 | EUR | Germany Trade Balance (EUR) Apr | 3.5B | 5.6B | 3.2B | |
| 06:45 | EUR | France Industrial Output M/M Apr | -0.10% | 0.40% | -0.50% | -0.40% |
| 07:45 | EUR | Italy Services PMI May | 53.7 | 54.5 | 55.7 | |
| 07:50 | EUR | France Services PMI May F | 58.3 | 58.4 | 58.4 | |
| 07:55 | EUR | Germany Services PMI May F | 55 | 56.3 | 56.3 | |
| 08:00 | EUR | Eurozone Services PMI May F | 56.1 | 56.3 | 56.3 | |
| 09:00 | EUR | Eurozone Retail Sales M/M Apr | -1.30% | 0.30% | -0.40% | 0.30% |
| 12:30 | CAD | Labor Productivity Q/Q Q1 | -0.50% | -1.20% | -0.50% | -0.60% |
| 12:30 | USD | Nonfarm Payrolls May | 390K | 325K | 428K | 436K |
| 12:30 | USD | Unemployment Rate May | 3.60% | 3.50% | 3.60% | |
| 12:30 | USD | Average Hourly Earnings M/M May | 0.30% | 0.40% | 0.30% | |
| 13:45 | USD | Services PMI May F | 53.5 | 53.5 | ||
| 14:00 | USD | ISM Services PMI May | 56.7 | 57.1 |
AUDUSD Completes ‘Death Cross’ But Bullish Structure Intact
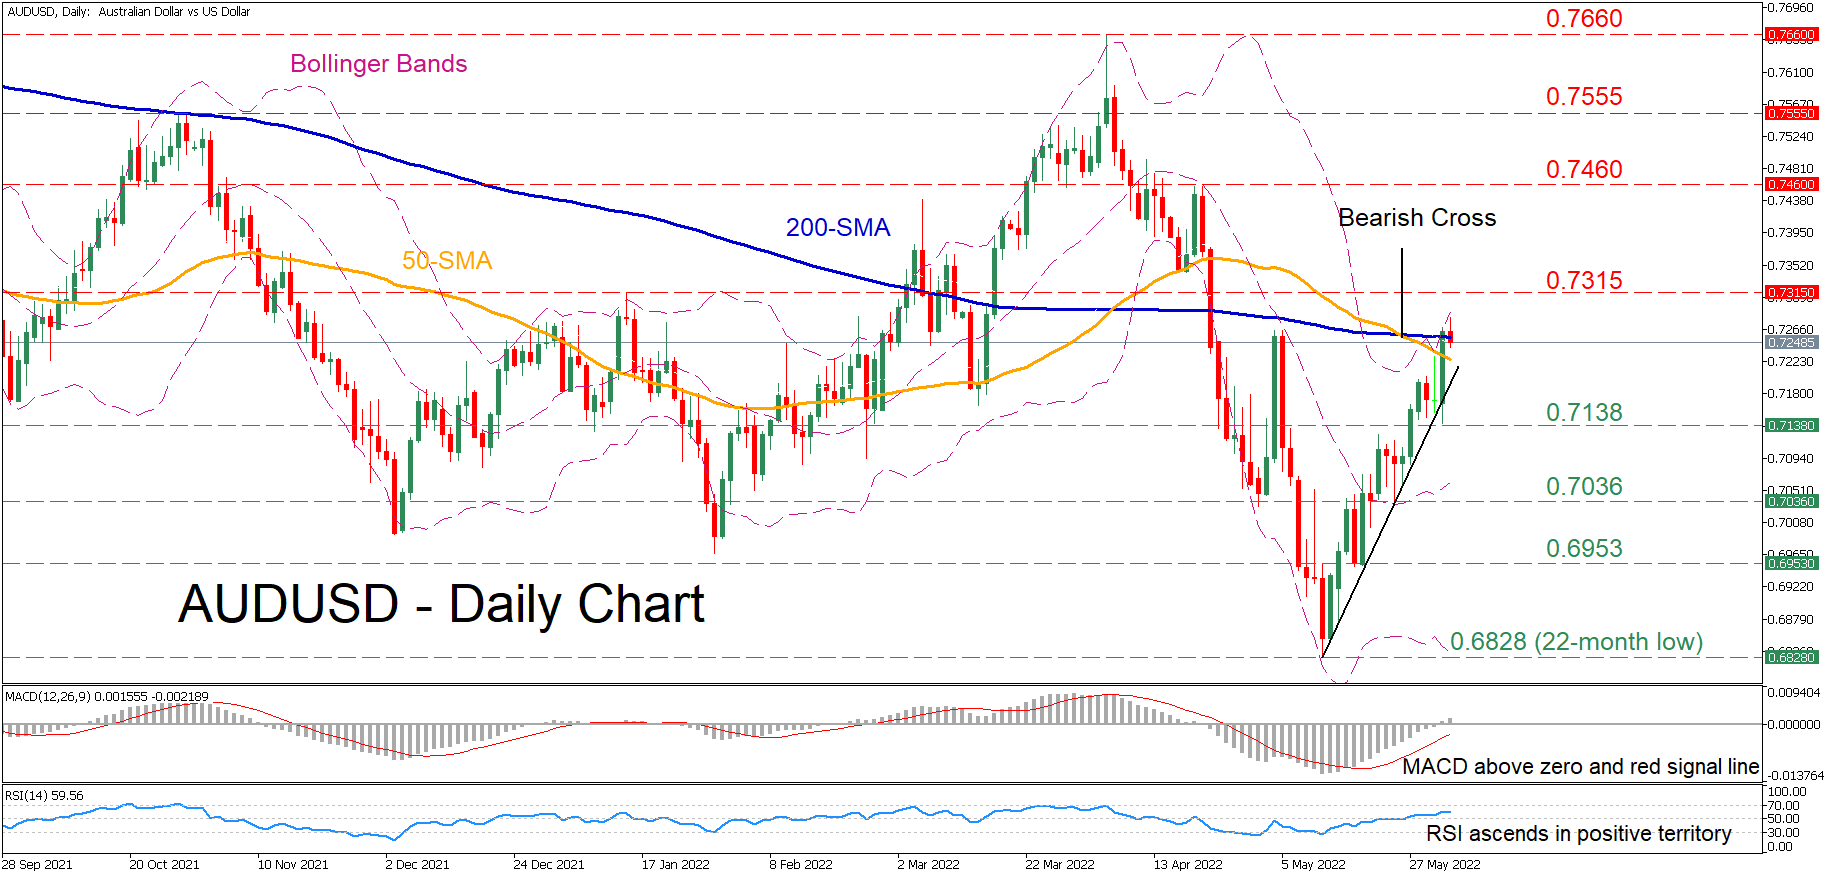
AUDUSD has been marching higher after finding its feet at the 22-month low of 0.6828 in early May. However, the pair’s advance is currently on pause as the 200-day simple moving average appears to be acting as a strong resistance barrier for the price.
The momentum indicators suggest that bullish forces have gained total control. Specifically, the MACD histogram has jumped above both zero and its red signal line, while the RSI is ascending in beyond its 50-neutral threshold.
If buying pressure intensifies further and the price profoundly crosses above the 200-day SMA, initial resistance could be encountered at the January peak of 0.7315. Piercing through this region, the bulls could aim at 0.7460 before the spotlight turns to the 0.7555 obstacle. An upside violation of the latter might pave the way for the 2022 high of 0.7660.
On the downside, should positive momentum wane and the price reverse downwards, 0.7138 could act as the first line of defence. Breaching this floor, further declines may then cease at 0.7036 before 0.6953 appears on the radar. Failing to halt there, the price could then descend to challenge the 22-month low of 0.6828.
Overall, AUDUSD appears to have the necessary momentum to push even higher and resume its short-term upside trajectory. For that scenario to materialize, the price needs to initially cross above its 200-day SMA.
US NFP grew 390k in May, unemployment rate unchanged at 3.6%
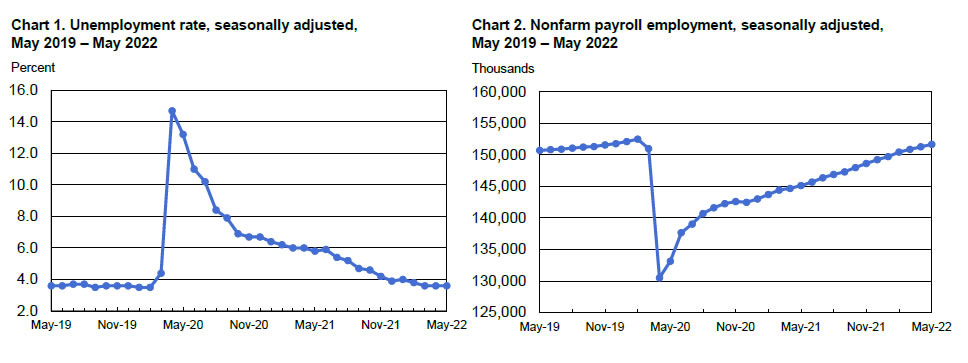
US non-farm payroll employment grew 390k in May, above expectation of 325k. Prior month's growth was also revised up from 428k to 436k. Overall non-farm employment was still down by -822k, or -0.5% from its prepandemic level.
Unemployment rate was unchanged at 3.6% for the third month in a row, above expectation of 3.5%. No of unemployed was essentially unchanged at 6.0m. Participation rate rose 0.1% to 62.3%.
Average hourly earnings rose only 0.3% mom, below expectation of 0.4% mom.
GOLD ( $XAUUSD) Forecasting The Rally After Elliott Wave Zig Zag Pattern
Hello fellow traders. In this technical blog we’re going to take a quick look at the Elliott Wave charts of GOLD, published in members area of the website. As our members know, GOLD is giving us correction of the cycle from the 2069 high. Recently GOLD ( $XAUUSD ) made a pull back that has had a form of Elliott Wave Zig Zag pattern. We expected GOLD to find buyers at the extreme zone from the 05/24 peak. In the further text we are going to explain the Elliott Wave Pattern and the forecast
Before we take a look at the real market example, let’s explain Elliott Wave Zigzag.
Elliott Wave Zigzag is the most popular corrective pattern in Elliott Wave theory . It’s made of 3 swings which have 5-3-5 inner structure. Inner swings are labeled as A,B,C where A =5 waves, B=3 waves and C=5 waves. That means A and C can be either impulsive waves or diagonals. (Leading Diagonal in case of wave A or Ending in case of wave C) . Waves A and C must meet all conditions of being 5 wave structure, such as: having RSI divergency between wave subdivisions, ideal Fibonacci extensions and ideal retracements.
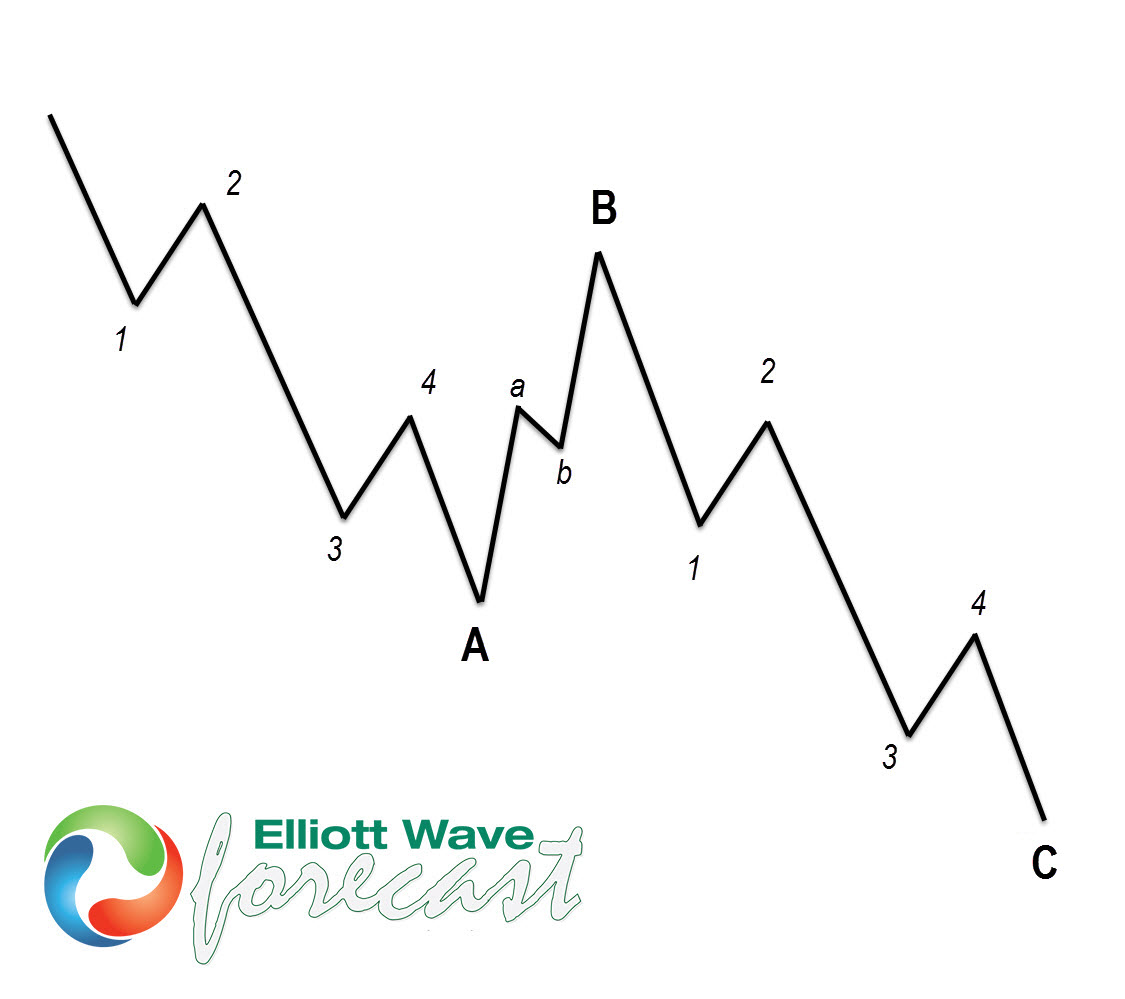
At the chart below we can see what Elliott Wave Zig Zag pattern looks like in real market.
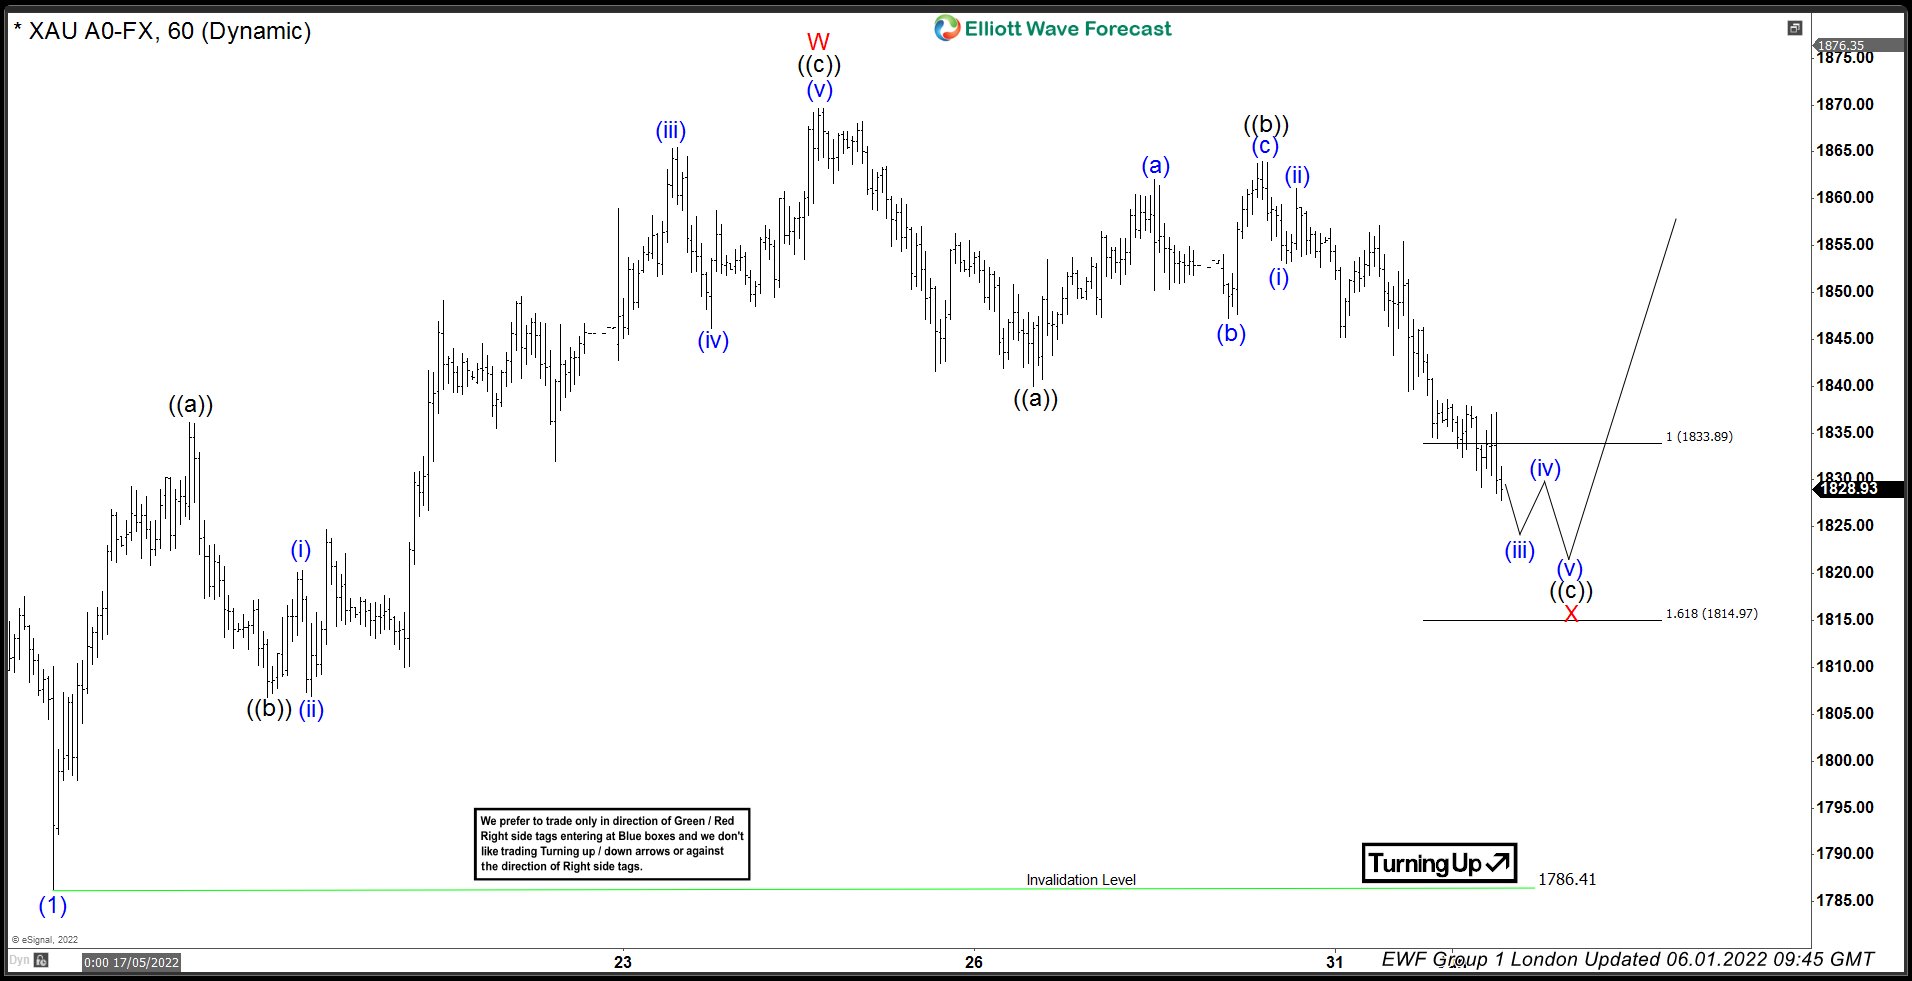
GOLD H1 London Update 06.01.2022
GOLD is giving us pull back against the 1786.4 low. Recovery has already reached the extremes from the peak at 1833.8-1814.9 area and we expect to complete X red soon. We assume pull back is unfolding as Elliott Wave Zig Zag Pattern. That means both A and C leg has to have a form of 5 waves structure. We can count clear 5 waves down in A red leg. We are calling for another marginal push lower within the marked reversal area. Anyway, we don’t recommend selling. We are aware that extreme zone is already reached and minimum number of swings is already there, turn can happen any moment.
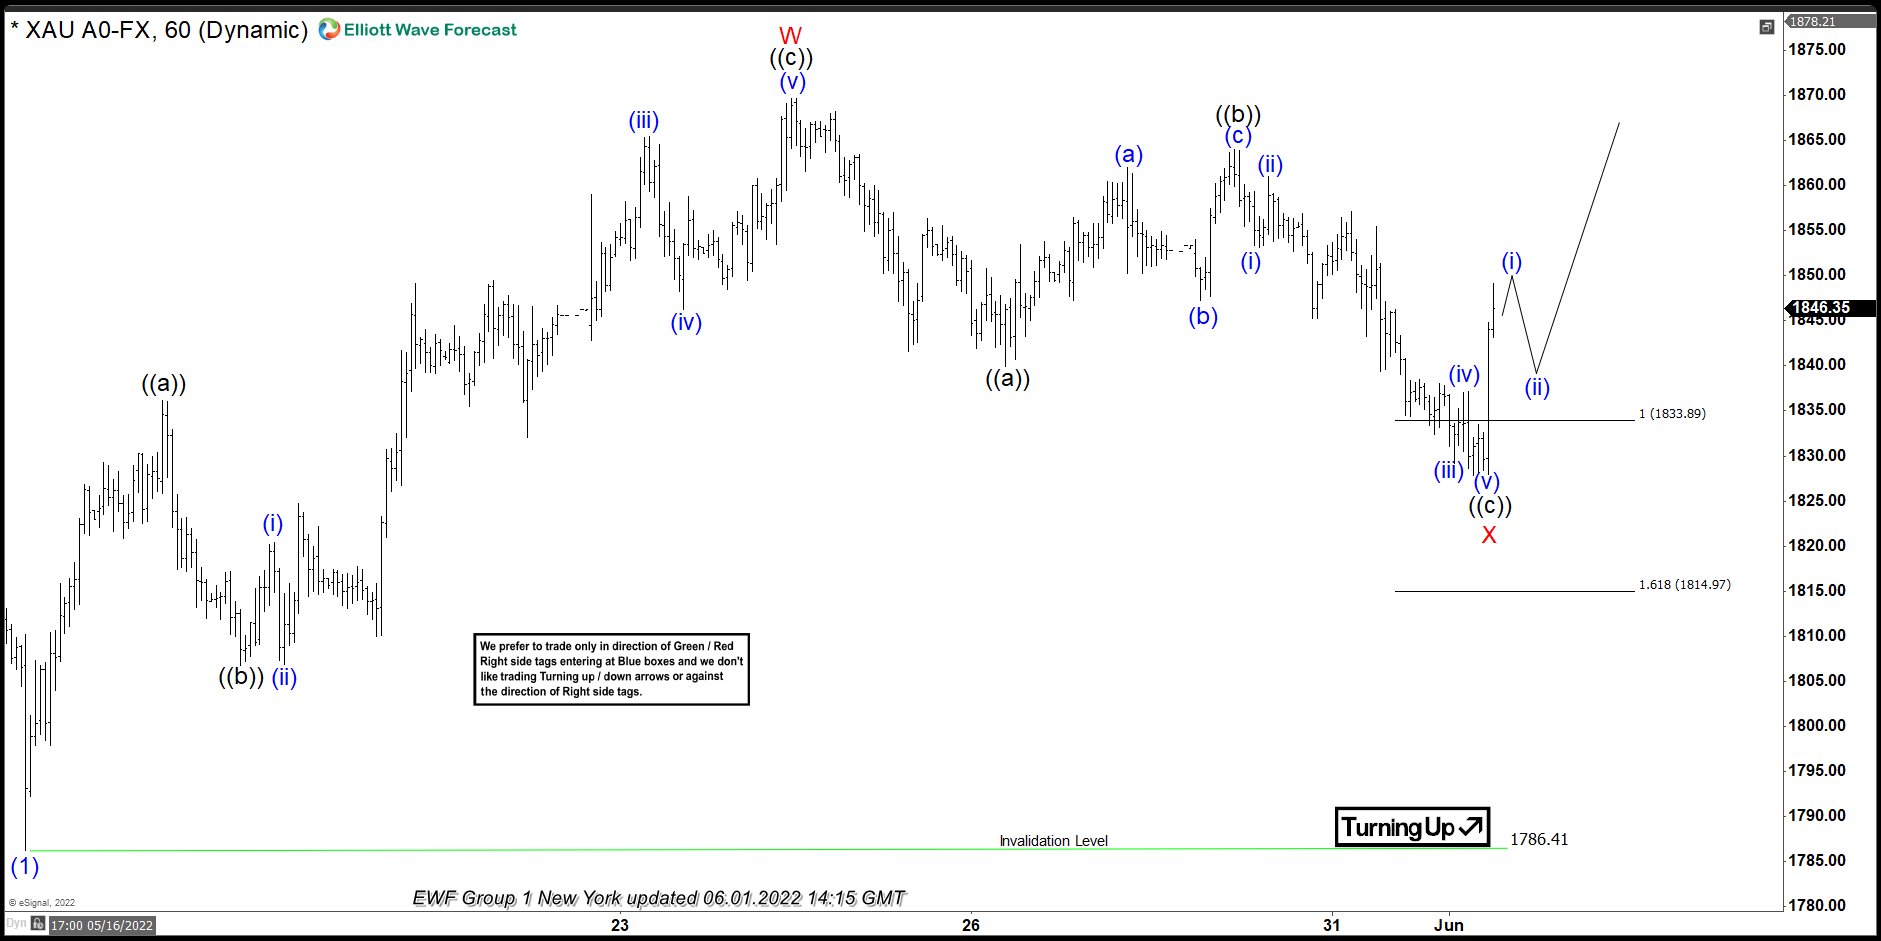
GOLD H1 New York Update 06.01.2022
GOLD has started giving us reaction from the marked zone and we count X red connector completed at 1827.7 low. Now, we need to see further separation up from the mentioned level and break above W red high : 05/24 to confirm next leg up is in progress.
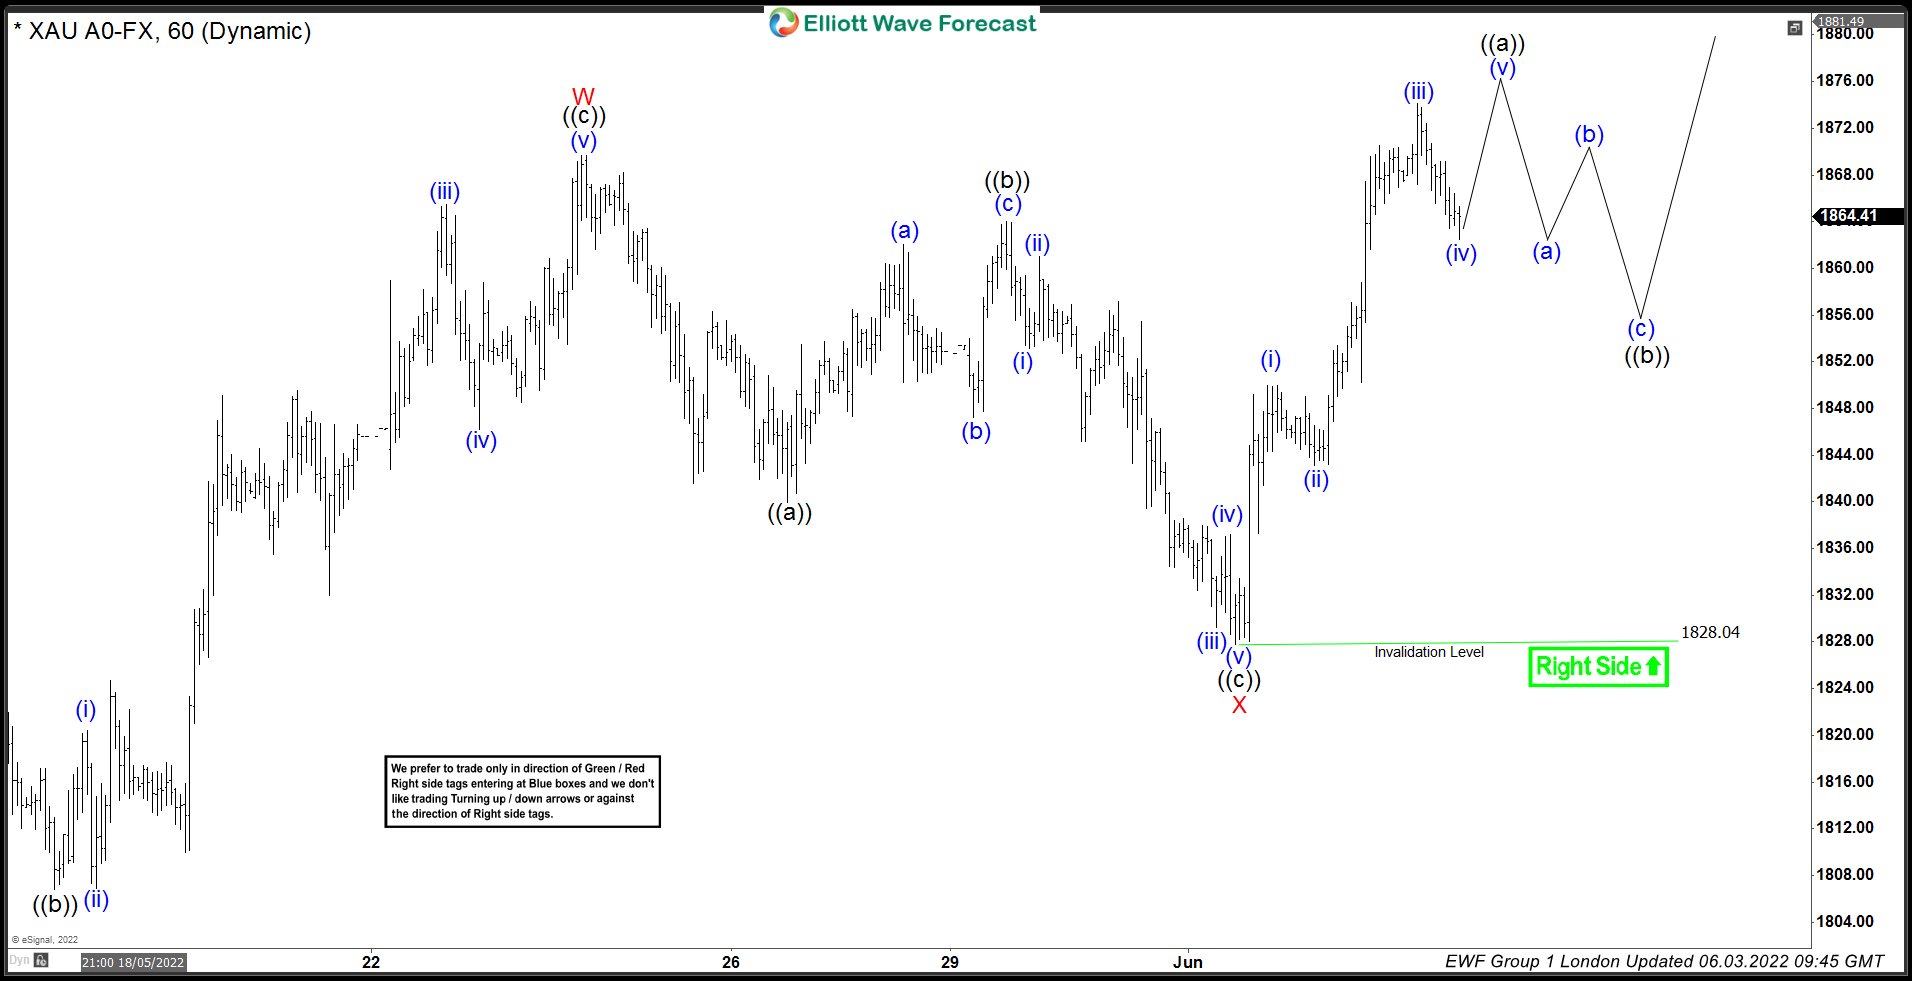
GOLD H1 New York Update 06.03.2022
We got further separation higher and break of 05/24 peak, confirming next leg up is in progress. GOLD can remain supported in near term as far as 1828.04 pivot holds.
Keep in mind that market is dynamic and presented view could have changed in the mean time. You can check most recent updates in the membership area of the website. Remember that not every chart is trading recommendation. Best instruments to trade are those having incomplete bullish or bearish swings sequences. We put them in Sequence Report and best among them are shown in the Live Trading Room. You can check most recent charts in the membership area of the site.
GBPJPY Bullish Impetus Tackles Upper Bollinger Band
GBPJPY is attempting to push north of the high of 163.57 from the 5 May, coincidently where the upper Bollinger band is currently located. The pair is maintaining its bullish demeanour, forming its eighth daily consecutive green candle, after the price unearthed significant upside pressure from around the 158.00 region, where the 100-day simple moving average (SMA) formed a defence. The upward creeping SMAs are suggesting that the positive trend is intact.
Presently, the short-term oscillators are skewed to the upside. The MACD is strengthening over its zero and red trigger lines, while the RSI is improving in the bullish zone. Meanwhile, the stochastic lines have flatlined in the overbought territory, reflecting no abating in positive impetus however hinting of a modest pause in upside price action.
In the positive scenario, immediate resistance is being applied at the 163.57 mark by the May 5 high and from the upper Bollinger band. Nudging higher, the pair could meet the nearby 164.29 deterrent, which is the 23.6% Fibonacci retracement of the up leg from 150.96 until 168.42, while additional appreciation in the price may then challenge the 166.07-168.55 resistance section. Should this obstruction that formed over the end of January until mid-February 2016 period, which curbed advances in April, fail this time to dismiss gains in the price, the early February high of 170.62 could then come into play.
Otherwise, if the pair fades from the upper Bollinger band, an initial support zone from the 162.26 inside swing high until the 38.2% Fibo of 161.76 may provide buyers with a foothold. However, in the event selling pressures overwhelm, the next downside limitations could show face at the 161.00 handle and the mid-Bollinger band at 160.37 ahead of the 50.0% Fibo of 159.69. Surrendering extra ground, the bears may then confront the 100-day SMA at 158.63 and the 158.00 hurdle before aiming for the lower Bollinger band at 156.90.
Summarizing, GBPJPY’s broader bullish structure remains intact above the 147.39-149.04 support foundations. That said, a dive breaking the 154.91-155.45 support border could trigger worries about downward pressures. Yet, for the bullish picture to bolster, the price would need to pilot above the multi-year high extending beyond the 168.55 mark. If the price ebbs beneath the mid-Bollinger band, favourable odds for either direction return to the table.

EURAUD Penetrates the Uptrend Line But Finds Support at 23.6% Fibo
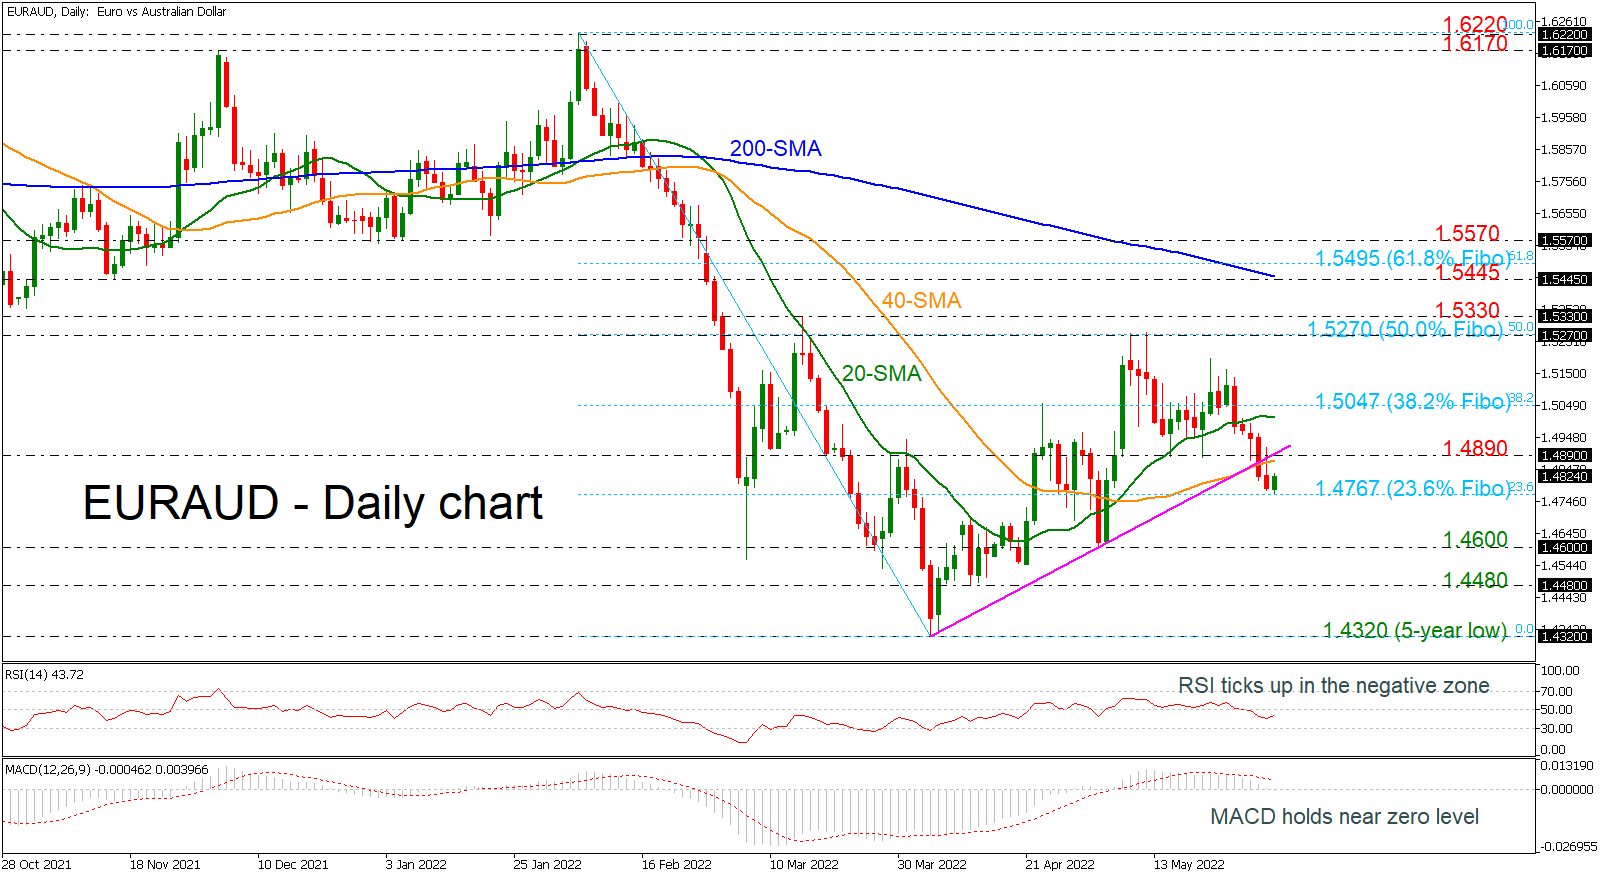
EURAUD is currently rebounding off the 23.6% Fibonacci retracement level of the down leg from 1.6220 to 1.4320 at 1.4767. The pair broke the uptrend line to the downside in the previous sessions, suggesting a bearish movement. The MACD is moving sideways around the zero level; however, the RSI is ticking up in the bearish region.
A failure to overcome the 1.4890 resistance level and the ascending line could send the price down to the 1.4767 support and the 1.4600 psychological mark. Even lower, support could be next found around the 1.4480 barrier, while a decisive close below the five-year low of 1.4320 could stage a steeper sell-off.
Alternatively, if 1.4890 proves easy to get through, the spotlight will turn to the 20-day simple moving average (SMA) at 1.5000, ahead of the 38.2% Fibonacci at 1.5047. On top of that, the bulls would need to clear the 50.0% Fibonacci of 1.5270 to push the rally towards the 1.5330 barrier.
In the medium-term picture, EURAUD turned negative after violating the ascending trend line started from the 1.4320 low. Should the market jump above the previous highs of 1.5270, the outlook may turn brighter.
A Bounce, But Hardly the Start of a Rise in the Crypto Market
Bitcoin rose 2.4% to $30.5K in the past 24 hours. Ethereum added 0.2% to $1820. Ether was unexpectedly among the laggards. Altcoins from the top 10 rose from 1.5% (BNB) to 4.1% (Solana).
Total crypto market capitalisation, according to CoinMarketCap, rose 1.8% overnight to $1.26 trillion. Bitcoin’s dominance index added 0.2% to 46.3%. The cryptocurrency fear and greed index was down 3 points to 10 by Friday and remains in “extreme fear”.
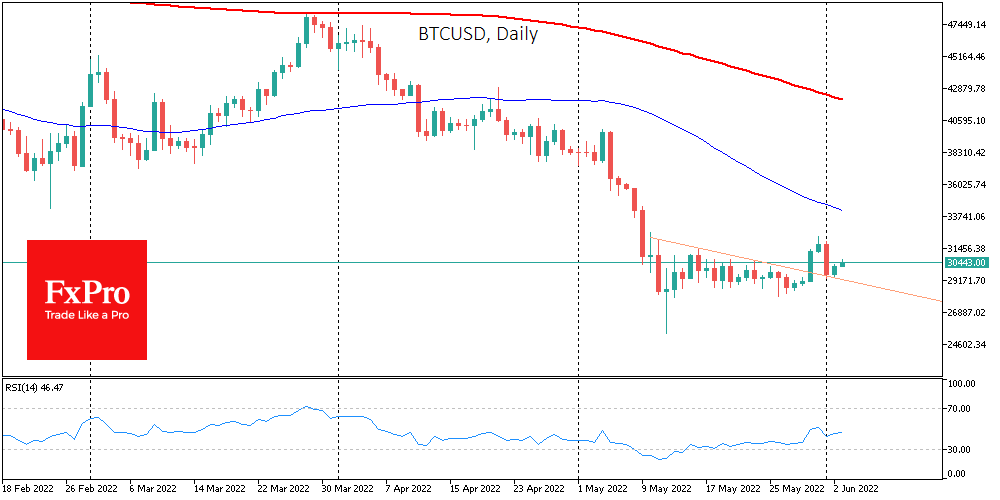
Bitcoin rebounded on Thursday after falling sharply the day before. The strengthening was helped by a weaker dollar and positive stock indexes. The local downtrend (former consolidation triangle from May 10) turned into a support line. For the short term, this is good news. However, it is worth remembering that this is a fragile structure that could be broken by both a stronger dollar and a market reaction to labour market news.
Bitcoin has already reached the “bottom” in the current cycle of decline and will not fall below $25,000, said former BitMEX cryptocurrency exchange CEO, Arthur Hayes. However, a market trend reversal should be expected when the Fed stops raising rates.
According to BTC.TOP CEO Jiang Zhuoer, the bearish phase will end in six months. A possible driver for this could be the Ethereum update, which should occur between October and December. Another bullish factor will be the US Federal Reserve’s refusal to hike rates.
According to a Goldman Sachs survey, 6% of global insurance companies have invested or want to invest in cryptocurrencies. According to the Economist Impact survey, a growing number of investors see digital currencies as a useful tool for portfolio diversification.