Sample Category Title
BTCUSD Falls Without a Parachute
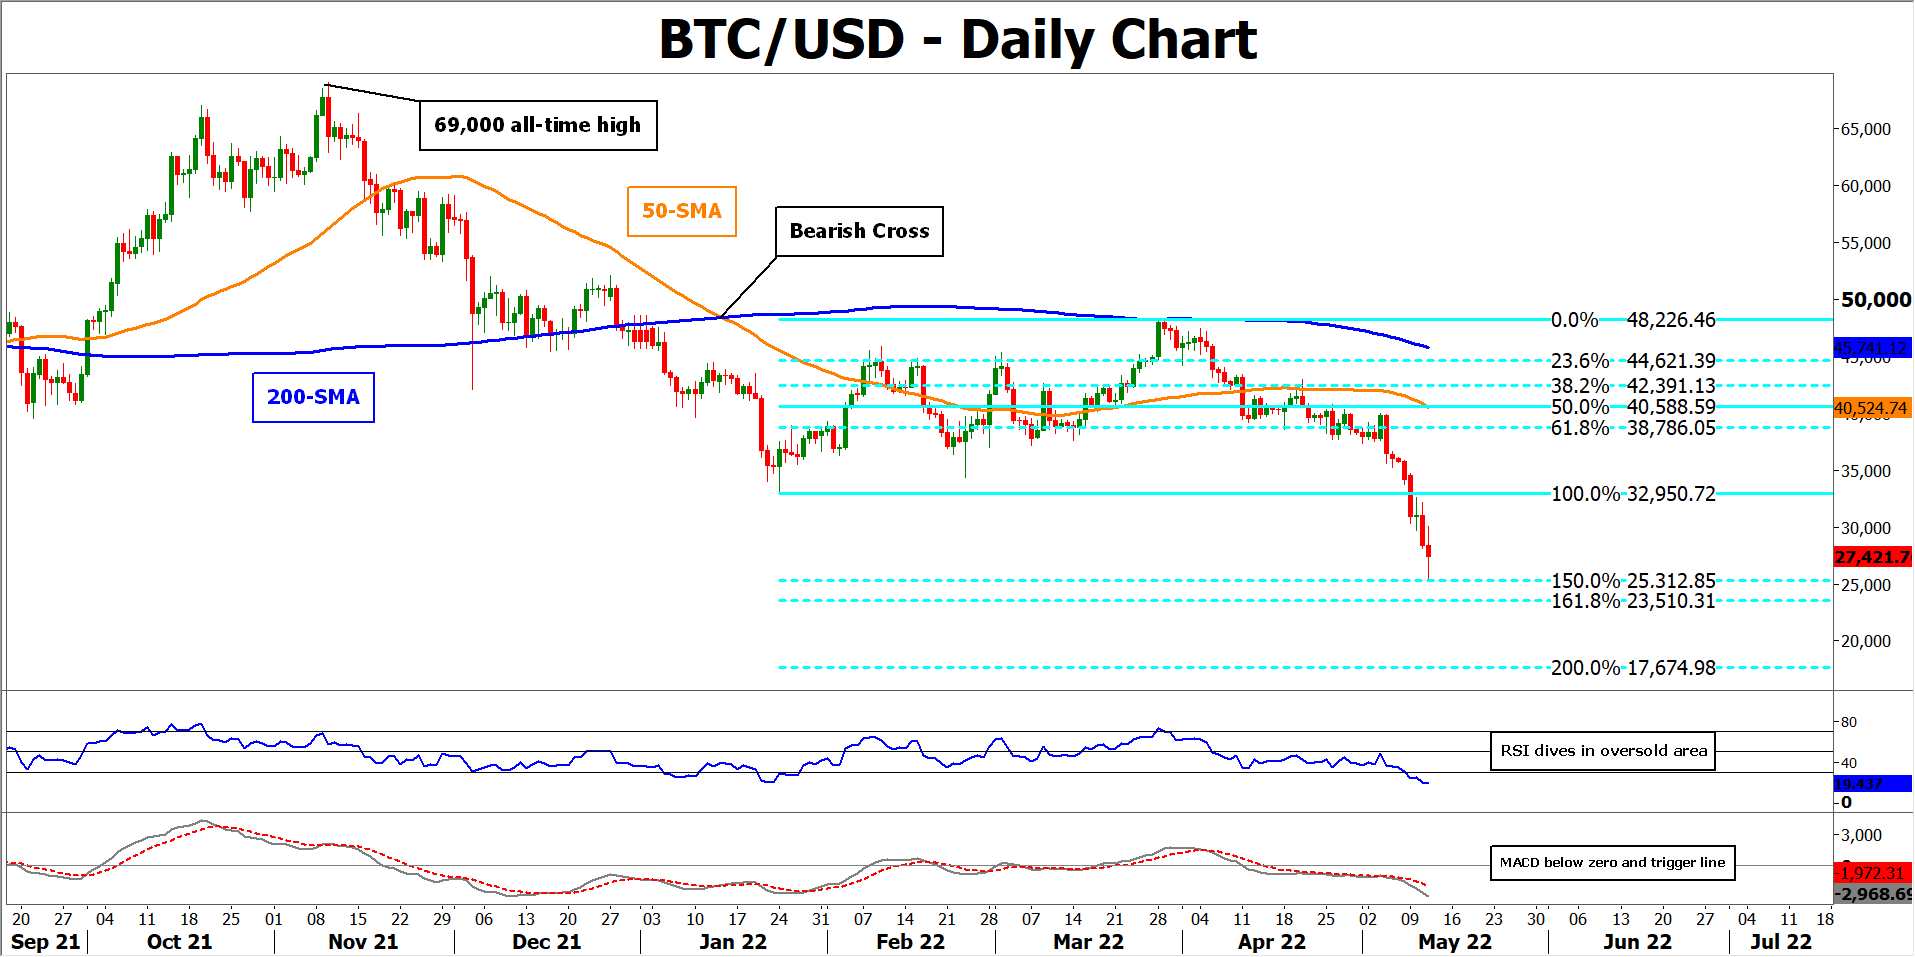
BTCUSD has come under tremendous selling pressure in the past few daily sessions, generating a fresh 16-month low. Overall, the technical picture has started to deteriorate, with a series of lower lows and lower highs forming on the daily chart.
The momentum indicators further confirm the bearish near-term bias. The RSI is dipping downwards in the oversold area, while the MACD histogram is currently beneath both zero and its red signal line.
Should negative momentum intensify, the price could generate fresh 2022 lows and might halt its decline at the 25,312 level, which is the 150% Fibonacci extension of the 32,950-48,226 up leg. Diving beneath that region, the 161.8% Fibo of 23,510 may act as the next line of defence. A violation of the latter zone could then turn the spotlight to the 200% Fibo of 17,674.
On the flipside, if the bulls re-emerge and push the price higher, initial resistance could be encountered at the 32,950 barrier. Piercing through this ceiling, the 61.8% Fibo of 38,786 may prove a tough obstacle before the attention shifts to 50% Fibo of 40,588, which overlaps with the 50-day simple moving average. Higher up, further advances could then stall at the 38.2% Fibo of 42,391.
Overall, BTCUSD remains in a sharp downtrend, while its technical picture is becoming increasingly worrisome. For that bearish tone to reverse, the price must initially jump above the 32,950 ceiling.
Elliott Wave analysis: EUR/USD breaking down from a triangle
Stocks are trading down sharply, after the US CPI data yesterday when numbers above expectations were enough for speculators to sell stocks and buy the USD on hawkish FED projections, with even a 75bp hike in view in the next meeting.
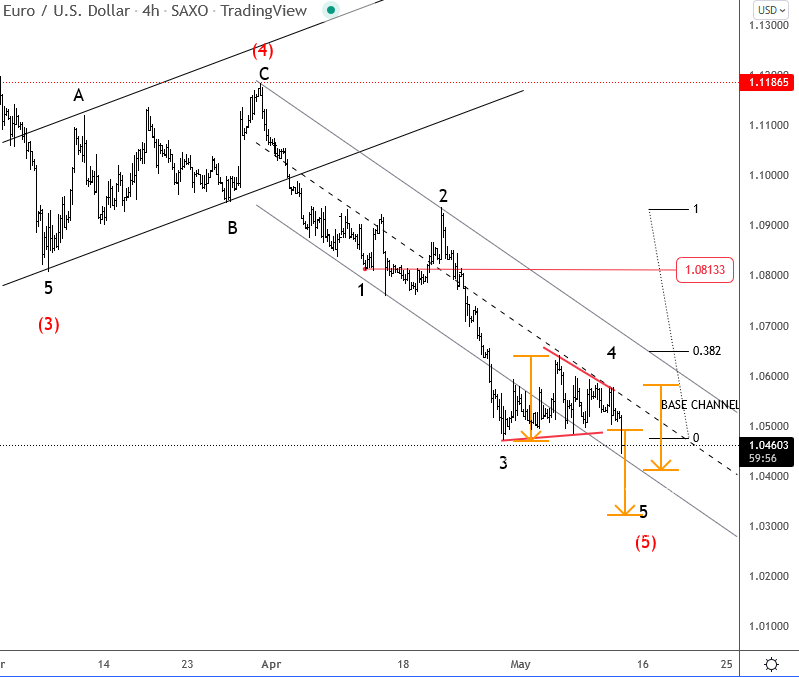
Finally, the EURUSD is breaking down, and ECB cannot stop the bears with their comments, we need real policy actions from the ECB for a change in trend. Pair broke below 1.05 level which was a key spot for a continuation down into a fifth wave. So as long as this price holds, trend is down, but keep in mind that drop is coming out of a triangle, so it's final stages of a higher degree trend, therefore be aware of a reversal. Why? Because, firstly everyone just watches or will give up on the direction of the pair, when it's in a chop in a triangle range, but then, after a breakdown, everyone wants to catch the move, most of them too late and action is overcrowded, thus the opposite may follow. Fifth wave projection is at 1.03 and 1.04.
Daily Technical Analysis
EUR/USD
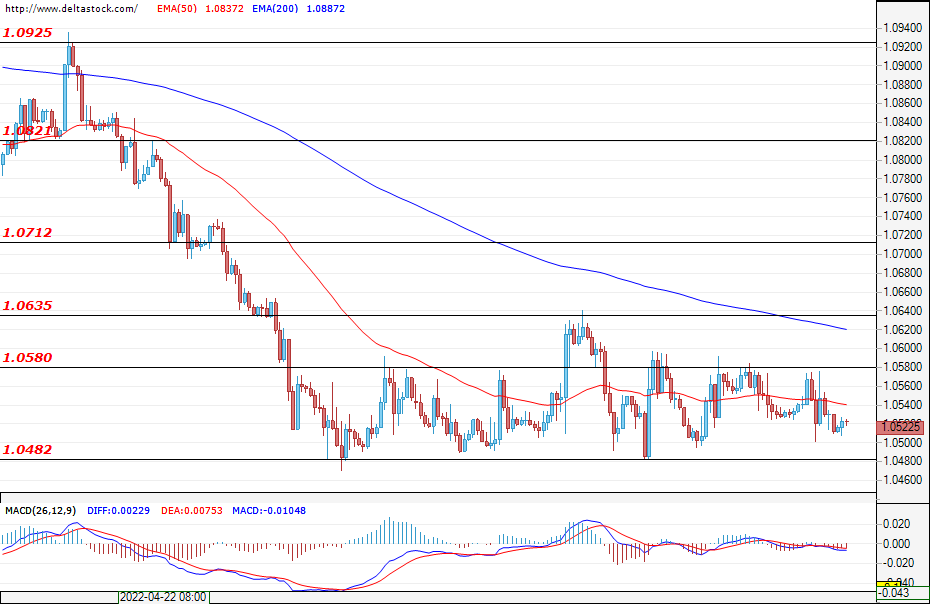
The pair continues to trade between the support at 1.0482 and the resistance at 1.0580. The range has been going on for two weeks now, with neither side taking the initiative. The market needs a catalyst in order to find a clear direction, and so far the rise in the U.S. interest rates and inflation data have failed to provide this initial jolt. There is accumulated liquidity around both the support and the resistance levels and it is likely that the first breach of the range will be fake and the market will move in the opposite direction. The market is likely to remain in "standby" mode, and more activity can be expected in case of a confirmed breach in one of the support and resistance areas. Today, increased volatility can be expected around the announcement of the PPI data for the United States at 13:30 GMT.
USD/JPY
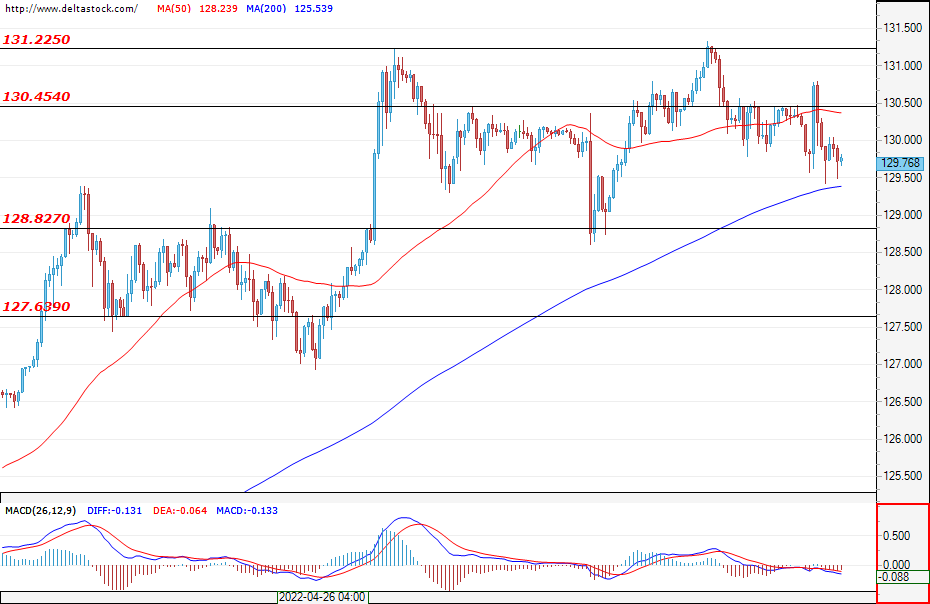
The dollar retreated from the highs against the yen. The market is currently entering a range phase, with the main support being 128.82. First resistance zones for the bulls are 130.45 and 131.22. It is expected that the uptrend will continue again as a breach of 131.22 would pave the road towards 133.00. Before that, however, it is possible for the bulls to retreat and look for better opportunities to enter under the support of 128.82.
GBP/USD
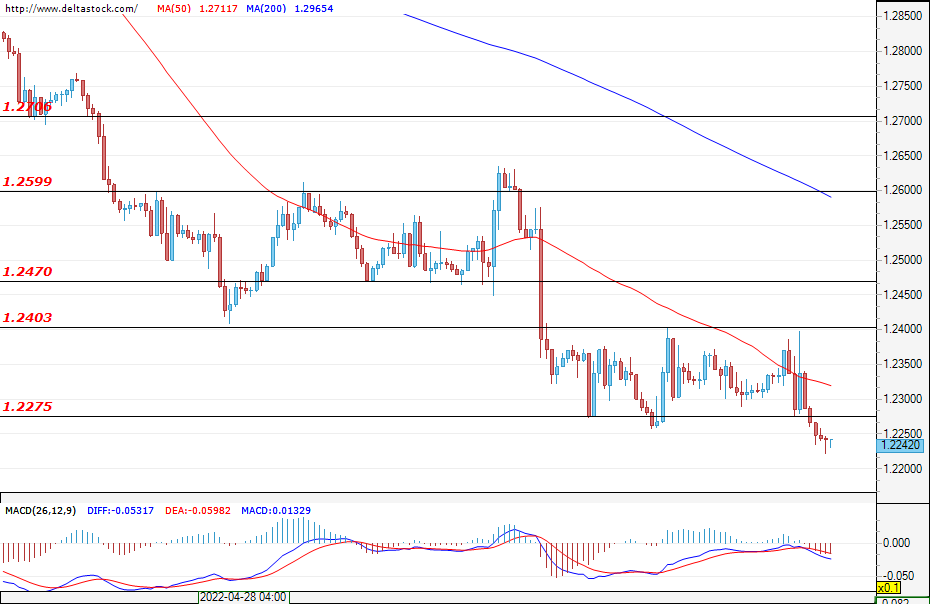
The Cable breached the support at 1.2275 at the end of the trading session. In the early hours of today, there isn't much activity, but with the opening of the European markets, a test of the breach at 1.2275 is possible. If it turns out to be fake and prices stay above the support, then attacks on the resistance zones at 1.2403 and 1.2470 can be expected. On the higher time frames, the declines seem quite stretched and a deeper pullback from the current levels is possible. If, however, the bearish pressure continues, then the declines could deepen towards 1.2060. This area has been a crucial support level for the market since 2016, and so if it is cleared, then the sterling could have a very bumpy road ahead of it.
EUGERMANY40
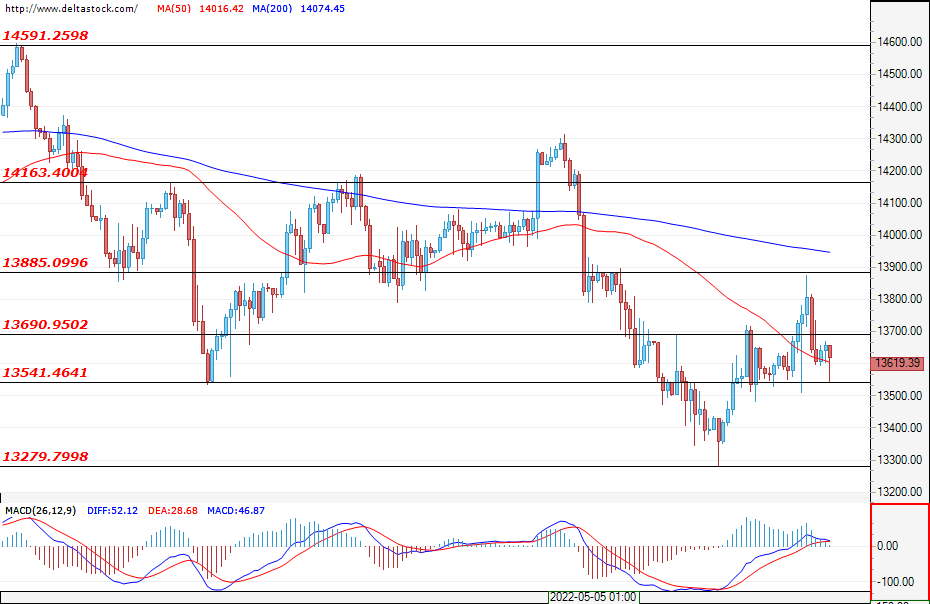
Yesterday, the German index managed to solidify the support at around 13540 and the bulls tested the resistance at 13885. Most of the gains for the day were erased due to downturns in the U.S. stock markets, but the session ended in the green. The trade is expected to continue in the wide range between the support at 13540 and the resistance at 14160. The first resistance of the day is the area at around 13690.
US30
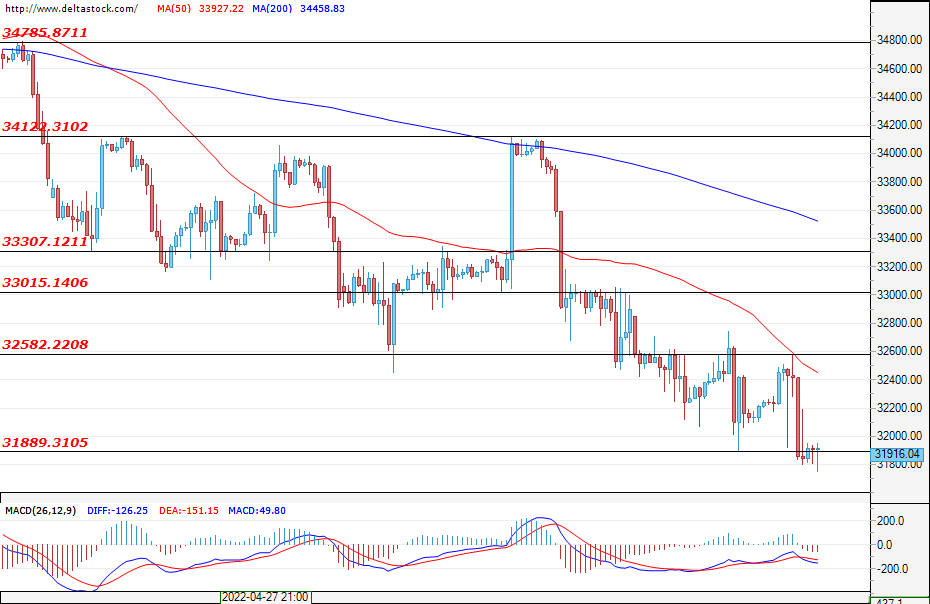
The U.S. blue chips are about to realise a fifth consecutive week of losses. Such a phenomenon is rare and so the sentiment is already extremely negative. However, a relief rally towards the resistance at around 33,000 can be expected soon. The support at 31890 was briefly disrupted and the coming days will show whether yesterday's downturns signalled the capitulation of the bulls. The first resistance for the bulls is 32580, while difficulties can be also encountered at around 32200. Given that the collapse continues, a breach of 31890 and a decline towards 31670 can be expected.
US Oil Bounces Higher
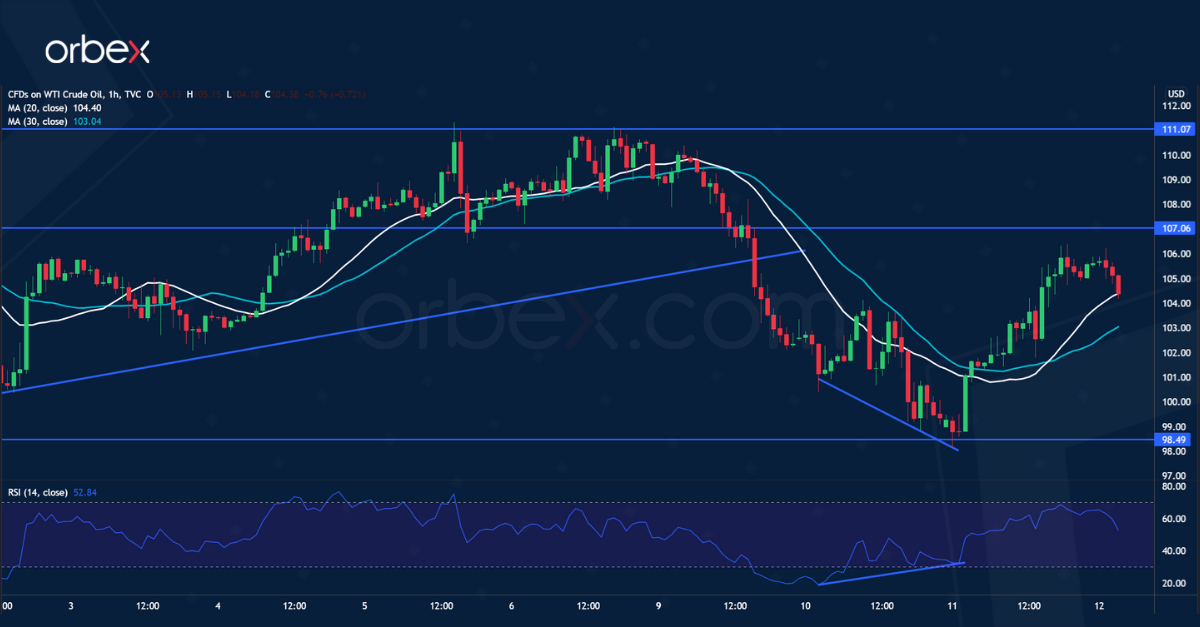
WTI crude rallies as Russia retaliates by sanctioning European gas companies. A fall below the rising trendline near 106.00 has put the bulls on the defensive. The price has met bids at 98.50 and in conjunction with a bullish RSI divergence could attract more buying interest. Optimism may gain traction if buyers succeed in holding above this demand zone. A close above support-turned-resistance at 107.00 would put the bulls back in the game. Then a break above 111.00 could trigger an extended rally above 117.00.
XAU/USD Tests Demand Area
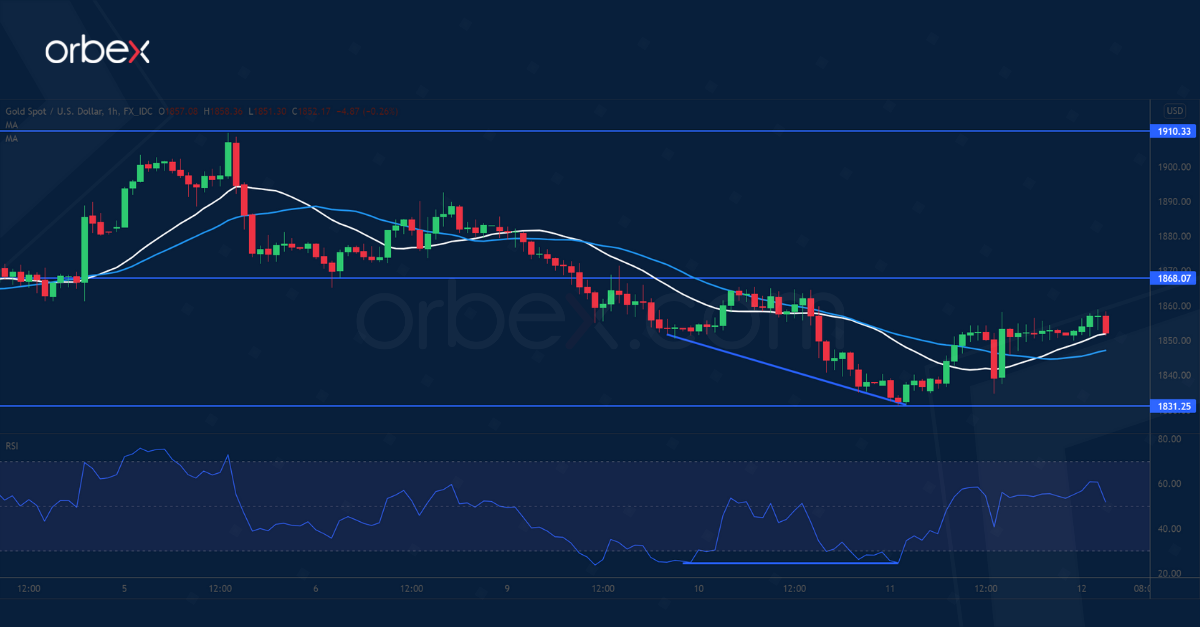
Bullion steadied after the US CPI receded in April. The price action has found some support at the base of the February bullish breakout. A bullish RSI divergence indicates a slowdown in the downward momentum, a prerequisite for a reversal. 1868 is a key resistance and a breakout would confirm the demand zone and prompt sellers to cover their bets. Then 1910 is the last hurdle before sentiment would turn around. On the downside, a break below 1831 would send the precious metal to the psychological level of 1800.
AUD/USD Saw Brief Recovery
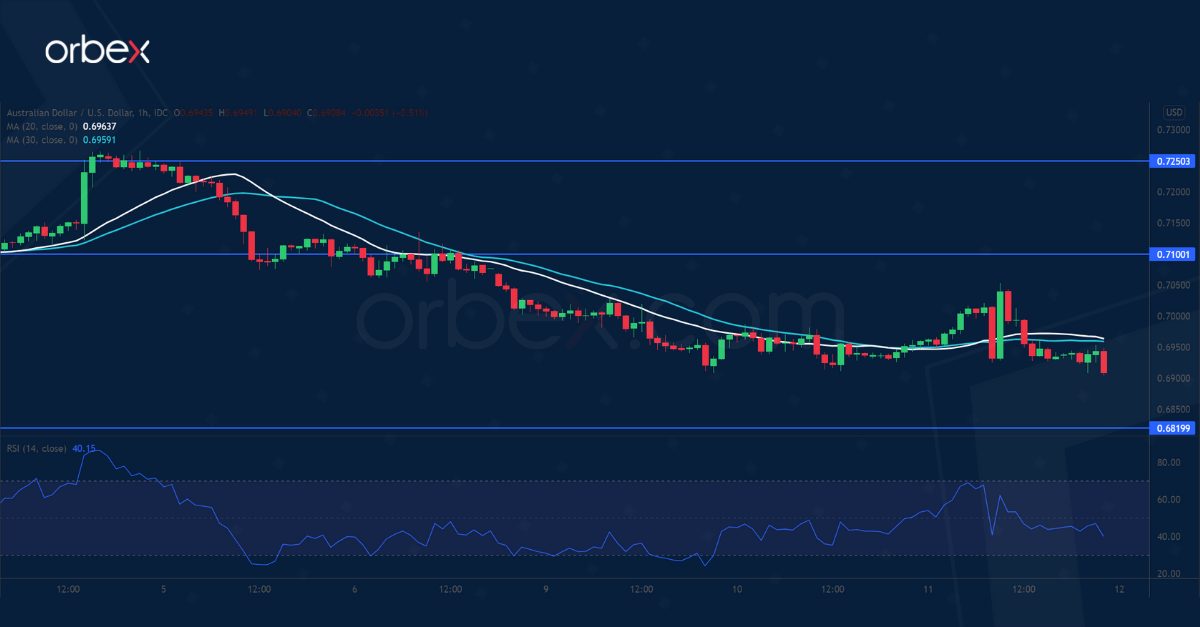
The Australian dollar struggles as Beijing vows to support its Covid-hit economy. A drop below the psychological level of 0.7000 near this year’s low may have put the Aussie on a bearish trajectory in the medium-term. On the hourly chart, the RSI’s double bottom in the oversold area may cause a limited rebound. Selling interest could be expected at 0.7100 at the origin of the latest sell-off. A drop below the intermediate support at 0.6920 would extend losses towards June 2020’s lows around 0.6820.
Core Bond Markets May Have Entered a Period of Consolidation, Correction Perhaps
Markets
US headline/core inflation for April came in at 8.3%/6.2% yesterday, defying expectations for a bigger decline from the 40-year highs. Core inflation also showed more signs of broadening and being increasingly persistent. It wasn’t the surprise reading both markets and the Fed hoped for, fueling concerns of an aggressive tightening cycle that may smother the economy.
US stocks initially clung on to the fact inflation fell nevertheless but that proved a too-weak argument in a sell-on-upticks market. The Nasdaq again underperformed (-3.18%). US bond yields soared up to 12 bps shortly after the CPI release only to end up with +2.6 bps at the front. Yields on longer tenors even turned red, losing almost 8 bps at the very long end. The 10y lost the 3% mark.
European/German yields initially joined the US move higher but here too things soon went in reverse. German Bund yields fell as much as 3.1 bps, European swap yields printed losses of more than double. This happened even as ECB’s Lagarde finally caved and hinted at a July rate hike.
In this respect, EUR/USD’s performance was disappointing. Overall risk-off even pushed the pair marginally lower to 1.0512. The trade-weighted dollar index keeps knocking on the 104 door. Sterling was long an ocean of calm yesterday but came under pressure around the time US stocks started sliding. EUR/GBP rose from 0.855 to 0.858. GBP/USD closed at 1.225, the weakest level since May 2020. Asian stocks lose 1-3% this morning on lingering inflation worries. Market news is limited. US bond yields extend their recent correction with 1.2 to 4.4 bps. Hong Kong intervened in its currency (see below). The Japanese yen outperforms. USD/JPY eases sub 130. EUR/USD is filling bids in the low 1.05 area. US PPI and jobless claims on today’s eco calendar are worth mentioning but we don’t expect them to influence markets. Yesterday’s moves on core bond markets suggest we may have entered a period of consolidation, correction perhaps, where growth worries take over from the tightening/inflation narrative. First support in the US 10y is situated at 2.83% but the crucial one is located around 2.72%. Germany’s 10y is losing the 1% support with the next reference around 0.80% (2018 top).
If uncertainty about the eco outlook indeed becomes the dominant theme, it’ll be difficult for EUR/USD to escape the gravitational pull from 1.05. Sterling extends yesterday’s losses after Q1 GDP growth came in lower than expected at 0.8% q/q while the cost-of-living crisis suggests no improvement for the coming quarters. UK Finance minister Sunak is said to provide more relief in August but that may be too little too late. EUR/GBP surpasses 0.86 resistance (Nov/Dec 2021 correction highs).
News Headlines
The Hong Kong Monetary Authority (HKMA) intervened in the currency market to prevent the HK dollar from weakening beyond the allowed USD/HKD 7.75 to 7.85 trading band. The HKMA bought HKD 1.586 bln. The peg of the Hong Kong dollar with the US dollar is under pressure due to rising US yields/interest differential between US and Hong Kong money market rates. Interventions aim to drain liquidity from the local market to raise local money market rates. It was the first time since early 2019 that HKMA had to intervene in the currency market to support the local currency. In October 2020 it last intervened to prevent the HKD from strengthening outside the allowed bond. USD/HKD still trades near 7.85. According the a report in the Financial times, Turkish authorities are raising pressure on local bank to limit corporate clients from buying foreign currency against the Turkish lira in order to prevent a further weakening of the local currency. According to the article, banks have to seek approval from the central bank for bigger amounts of FX purchases. Since the start of the year, the Turkish lira has traded relatively stable even as combination of elevated inflation (69.97% Y/Y in April) and a low policy rate (14%) leave the currency with a deeply negative real interest rate. However, over the previous days, the lira again showed tentative signs of weakening with EUR/TRY rising to 16.23, compared to levels around EUR/TRY 15.53 end last month.
The Crypto Meltdown
US inflation data didn’t print a soft-enough figure to reverse the market selloff. Inflation in the US was 8.3% in April, higher than 8.1% expected by analysts, but happily, less than 8.5% printed a month earlier. But core inflation, which excludes the most volatile food and energy prices, surged 0.6% in April from 0.3% a month earlier.
There is still hope that the 8.5% print of March was a peak, but it looks like the overheating in consumer prices won’t be easy to cool down. The producer price index is due today, and the expectation is a cool down in the US factory gate prices from 11.2% in March to 10.7% in April.
Disappointing US inflation data sent another shock wave to the US stock markets sending all major US indices tumbling on Wednesday. The S&P500 lost more than 1.5%, while Nasdaq, which is more sensitive to interest rates tumbled more than 3% and slipped below the 12K level for the first time since November 2020.
Apple and Nvidia gave back another 5% yesterday, as Amazon dived more than 3% to a two-year low.
The US dollar remained upbeat, and the dollar index returned above the 104 mark as the lower-than-expected cool down in the US inflation figure revived the Fed hawks.
The pound-dollar is testing the 1.22 this morning as the UK-European relationship is souring on the Northern Ireland headache. According to the latest news, the EU will hurry up to launch infringement procedures against the UK and to suspend the trade agreement if the British government puts forward legislation to revoke its commitment over trade with Northern Ireland. The pound bears have their eyes set on the 1.20 mark, which could be a dip in the actual selloff.
In commodities, gold rebounded from the 200-DMA, as the US 10-year yield eased despite yesterday’s higher-than-expected inflation print in the US. The yellow metal will likely remain under the pressure of the rising US yields, and the negative trend could strengthen below the 200-DMA level, which stands at about the $1840 level at the moment.
US crude, on the other hand, sees decent dip buying interest below the $100 per barrel, even with the souring prospects of a healthy global economic recovery. There is one good news on the wire, though: Covid cases in Shanghai halved this week, sparking hope that the lockdown measures could soon be over in China’s economic heart. Yet, zero Covid is hard to achieve, and the risk of a renewed lockdown is omnipresent, if the Chinese government doesn’t soften the rules, which they don’t seem to be willing to do.
The crypto meltdown
Cryptocurrencies are shaken by an overall risk selloff, and the TerraUSD’s broken peg against the dollar this week.
The Terra incident is causing an industry-based panic, as Terra is the world’s third biggest stable coin, that couldn’t hold its promise to maintain a stable value in terms of US dollars. The Terra-USD peg is mostly based on the belief that one could always exchange Luna to guarantee a $1 peg for Terra. But apparently that belief is not working anymore, and trust is a foremost ingredient in cryptocurrencies success. So, you bet, the level of stress in other cryptocurrencies is mounting. Terra’s sister coin Lune lost 94%, as Bitcoin plunged below the $30K mark yesterday. It wasn’t only Terra’s fault; a disappointing US inflation data also encouraged the selloff in Bitcoin.
With the latest crypto cataclysm, US Treasury secretary Janet Yellen is pushing for regulation. But, what the crypto industry needs right now is a returning trust, and enthusiasm regarding how the digital tokens would fit into our increasingly digitalized lives, rather than a government regulation.
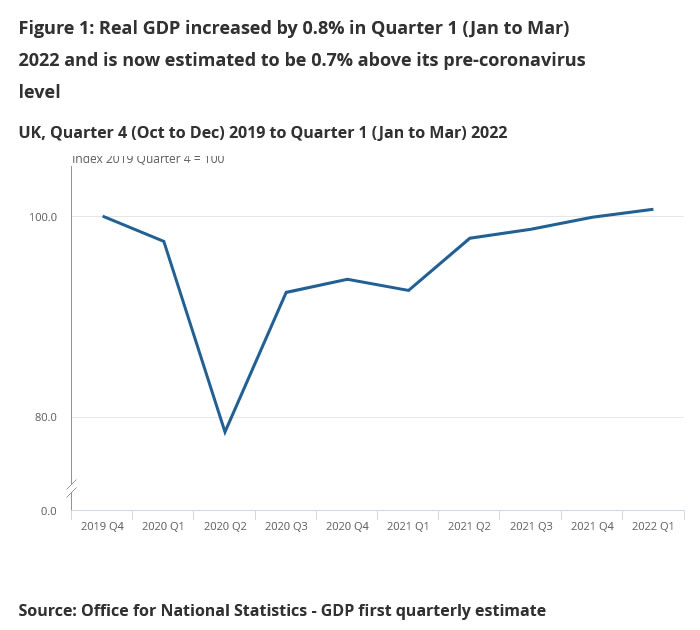
UK GDP contracted -0.1% mom in Mar, up 0.8% qoq in Q1
UK GDP contracted -0.1% mom in March, worse than expectation of 0.1% mom growth. That came after no growth in February (revised down from 0.1%). For the month, services dropped -0.2%. Production dropped -0.2%. Construction grew 1.7%. Monthly GDP is still 1.2% above pre-coronavirus levels, with services 1.5% above, construction 3.7% above and production -1.6% below.
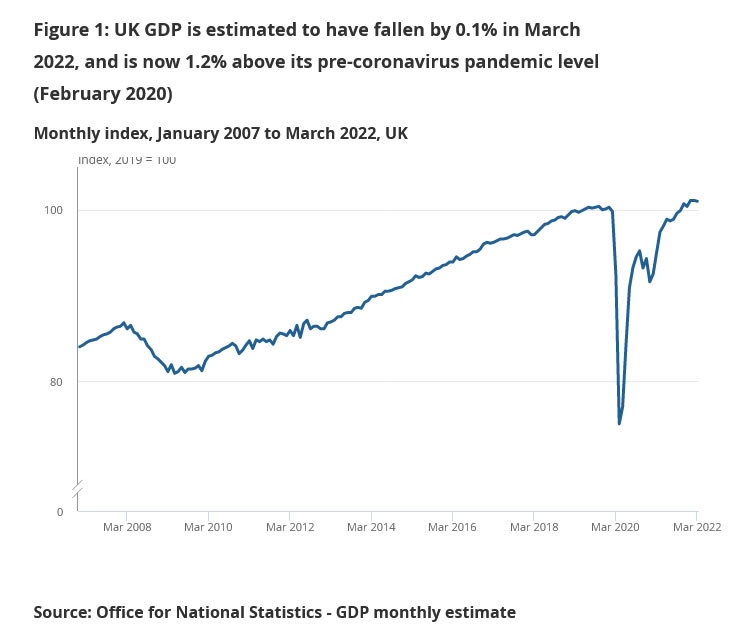
For Q1, GDP grew 0.8% qoq, below expectation of 1.0% qoq. Services rose 0.4% qoq. Production rose 1.2% qoq. Construction rose 3.8% qoq. Quarterly GDP was 0.7% above pre-coronavirus level.
Also released, manufacturing production came in at -0.2% mom, 1.9% yoy in March, versus expectation of 0.0% mom, 2.3% yoy. Industrial production was at -0.2% mom, 0.7% yoy, versus expectation of 0.1% mom, 0.4% yoy. Goods trade deficit widened to GBP -23.9B, versus expectation of GBP -18.5B.
EUR/USD Daily Outlook
Daily Pivots: (S1) 1.0485; (P) 1.0531 (R1) 1.0560; More...
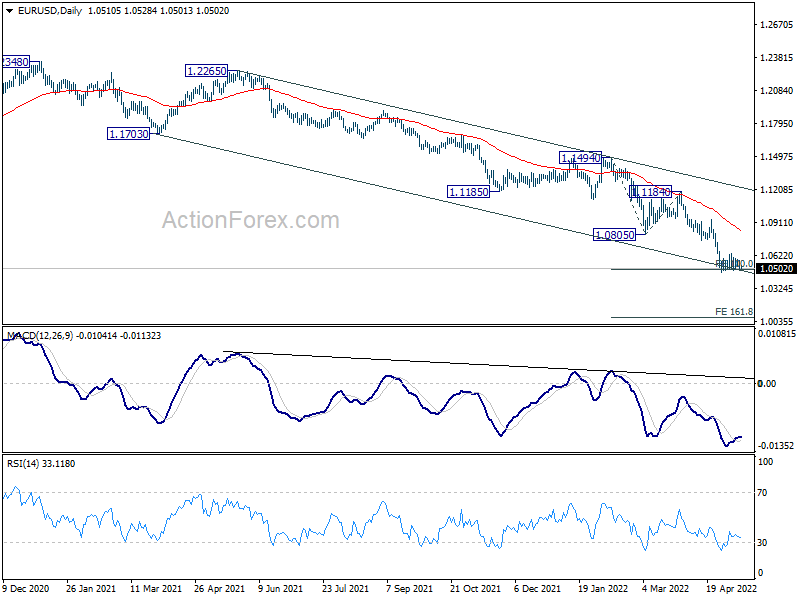
Intraday bias in EUR/USD remains neutral as range trading continues. Further decline is in favor as long as 1.0641 minor resistance holds. Break of 1.0470 will resume larger down trend to 161.8% projection of 1.1494 to 1.0805 from 1.1184 at 1.0069. On the upside, break of 1.0641 will turn bias to bring stronger rebound instead.
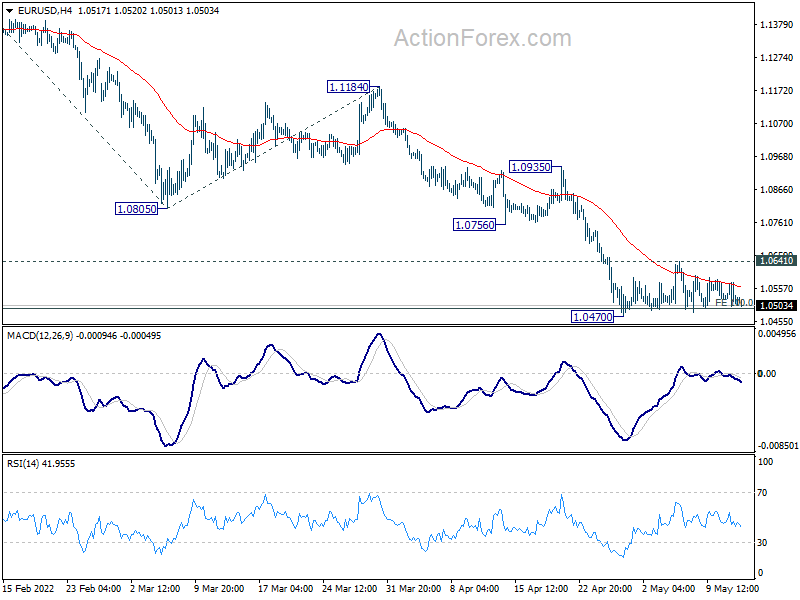
In the bigger picture, the decline from 1.2348 (2021 high) is expected to continue as long as 1.1185 support turned resistance holds. The break of 1.0635 (2020 low) now raises the chance that it's resuming long term down trend from 1.6039 (2008 high). Retest of 1.0339 (2017 low) low should be seen next. Decisive break there will confirm this bearish case.