Sample Category Title
WTI Wave Analysis
- WTI reversed from support area
- Likely to rise to resistance level 108.80
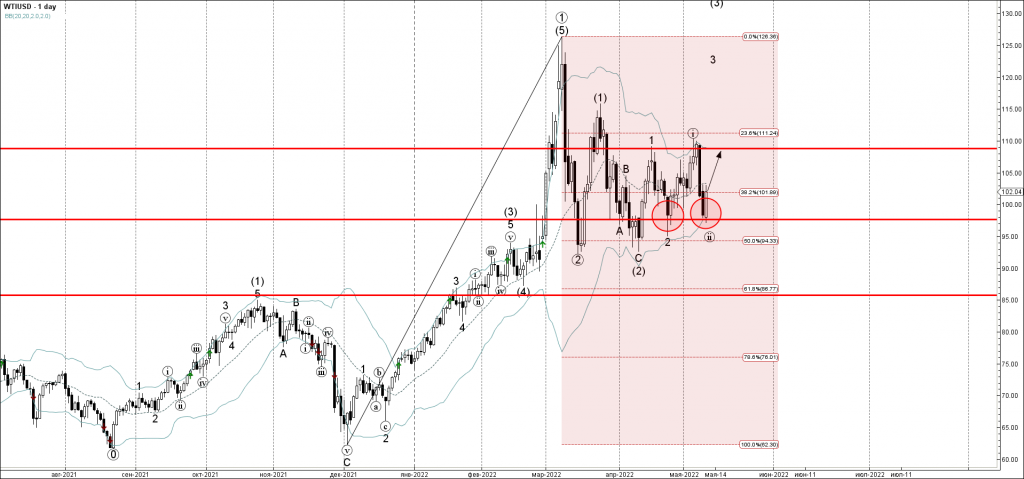
WTI crude oil recently reversed up from the support area located between the key support level 97.60 (which has been reversing the pair from April) and the lower daily Bollinger Band.
The price is currently forming the daily Bullish Engulfing – which should stop the earlier downward correction (ii).
Given the clear uptrend – WTI crude oil can be expected to rise further toward the next resistance level 108.80 (which has been reversing the earlier waves 1 and (i)).
Eco Data 5/12/22
[php_everywhere instance="1"]
Pound Rises on US Inflation, GDP Looms
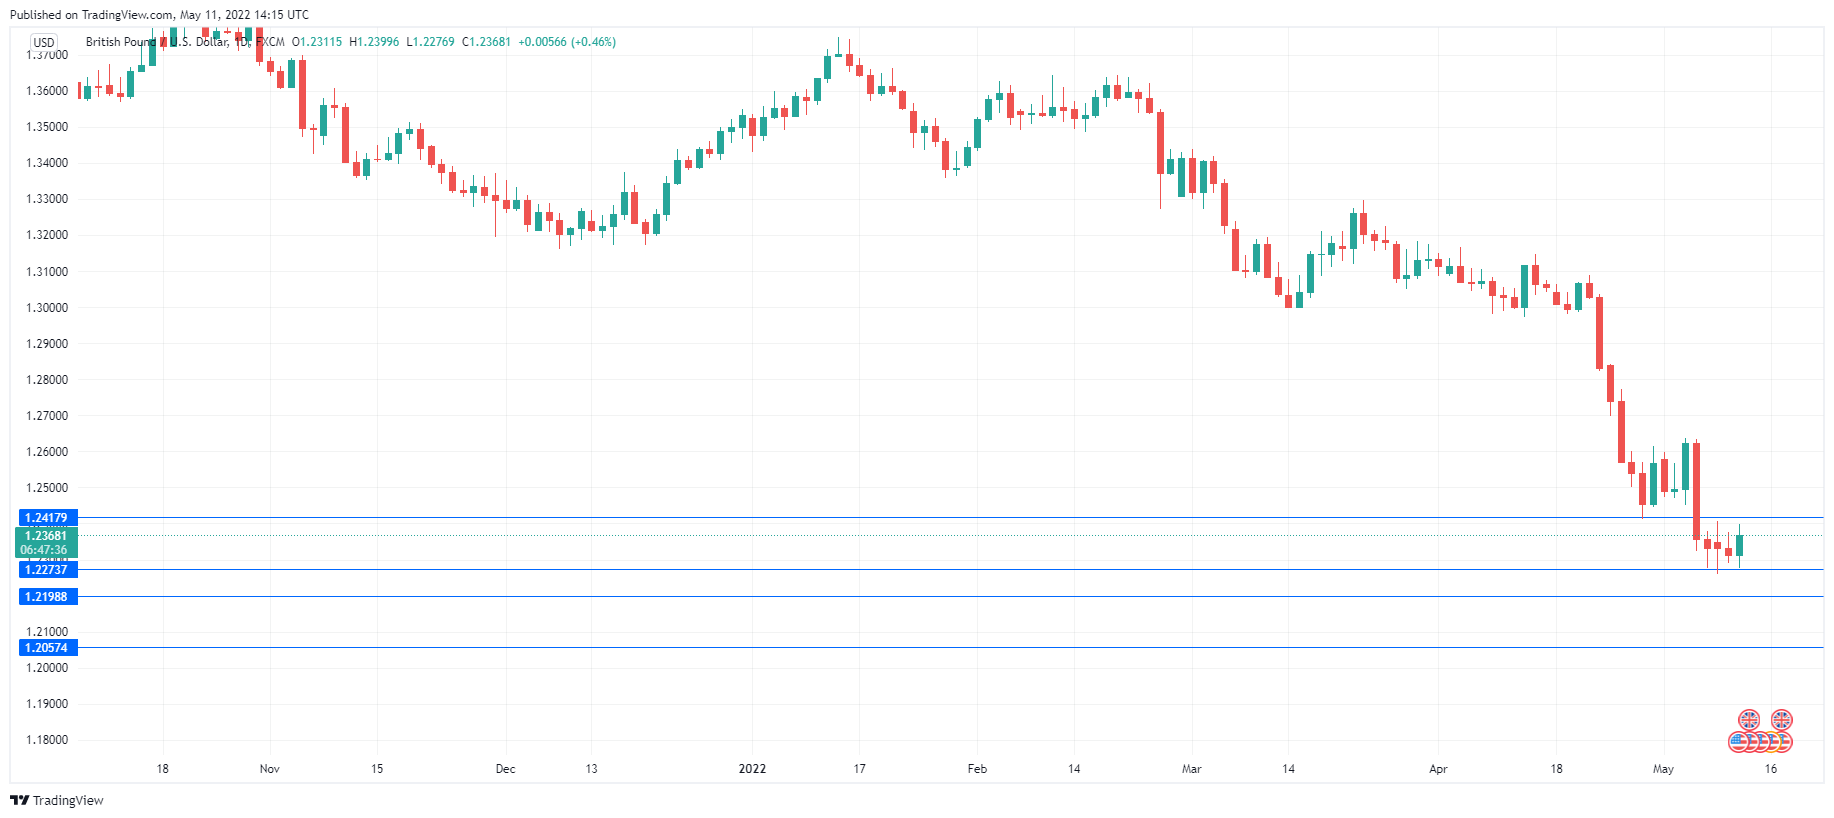
The British pound is in positive territory, as the currency tries to break a four-day losing streak. In the European session, GBP/USD is trading at 1.2355, up 0.36% on the day.
US inflation slows, but is higher than expected
US inflation dipped in April, but still came in above the forecast. Headline CPI dropped from 8.5% to 8.3%, above the estimate of 8.1%. Core CPI came in at 6.2%, down from 6.5% but above the estimate of 6.0%. The US dollar is broadly lower as a result, although the decline would have been sharper had the estimates been right on.
Today’s inflation data will no doubt result in some headlines proclaiming an “inflation peak”, but I would caution that it seems premature to declare that inflation is on its way down after just one release. Higher interest rates will do the job and curtail inflation, but it will take time. In the meantime, today’s inflation report will not change the Fed’s stance, and the CME’s FedWatch has pegged the likelihood of a 50-bps rate hike in June at 89%.
Looking forward, inflation gazing has become even trickier in the current environment. There are huge unknowns around price pressures due to the Ukraine war, as well as the extent of China’s slowdown and the impact on supply chains due to China’s uncompromising zero-Covid policy. With energy prices at very high levels, it will be difficult for headline CPI to come down.
Over in the UK, we’ll get a load of data on Thursday. The key release, Preliminary GDP for Q1, is expected to slow to 1.0%, down from 1.3% in the fourth quarter. The UK economy is showing an unhealthy mix of slower growth together with soaring inflation, which has raised concerns about stagflation. The BoE has been raising rates to curb inflation, but investors have not been impressed, as the pound has hit hard times and hit a 23-month low earlier this week.
GBP/USD Technical
- There is support at 1.2199 and 1.2056
- GBP/USD faces resistance at 1.2272 and 1.2418
Sunset Market Commentary
Markets
Another series of ECB speeches made it all but certain now: a July rate hike is coming. This was not only confirmed by usual suspects including German ECB governor Nagel. The middle/neutral camp in the ECB is also favouring the idea. Executive board member Elderson said they can “start weighing policy rate normalization in July” while French governor Villeroy expects to raise rates gradually from the summer on. Even president Lagarde caved, saying a rate hike may follow “weeks” after the end of bond buying. The July 21 meeting thus ticks all the boxes. The comments had little impact though. Markets were extremely focused on the US CPI release, and rightly so. Both headline and core inflation eased in April from their historic highs to 8.3% and 6.2% respectively. However, more easing was expected (8.1% and 6% respectively). Month-on-month, headline inflation slowed significantly to 0.3% from a commodity-driven 1.2% in March. But the core measure doubled in speed, from 0.3% to 0.6% m/m whereas only 0.4% was expected. Shelter (0.5% m/m) continues to be a major source of price pressures, along with new vehicles (1.1% m/m) and food (0.9% m/m). (General) services inflation printed at a hot 0.8%. The steep drop in inflation expectations over the past few days suggested markets were perhaps getting a bit too comfortable with the idea of prices pressures easing soon and quickly. Today’s outcome was a reminder to both US and European investors: it won’t. US bond yields immediately shot up, erasing intraday losses. Stakes for, and pressure on the Fed remain very high, resulting in a textbook bear flattener. Changes went as high to 10 bps before trimming gains as the CPI dust settled. Yields currently add 1.3 bps (30y) to 6 bps (2y). German yields rise in lockstep, adding up to 4 bps (30y). EUR/USD dipped in a kneejerk reaction to an intraday low of 1.05. But in a sign of building fatigue, the dollar rally didn’t last. The currency pair is currently back at or even higher than levels from before the release at 1.056. The trade-weighted DXY is circling around recent cycle highs at 103.68. The British pound holds steady against the euro (EUR/GBP 0.854) and the USD (GBP/USD 1.235) even with Brexit tensions resurfacing. A rebound in prices of the likes of oil (Brent +3.6%) boosts commodity currencies (AUD, NZD, NOK) today. In Central-Europe, the Czech koruna underperforms peers during CNB’s Michl’s first speech after being appointed as new head of the central bank (see below).
News Headlines
Czech president Milos Zeman officially appointed Ales Michl as the next governor to the lead the Czech National Bank. He’ll succeed Jiri Rusnok in July. Michl was already known as an ultra-dove as he opposed the aggressive rate hike cycle that brought the policy rate to 5.75% currently. Michl wants to bring inflation back to 2.0% from an expected peak of 15% in summer. He expects this process can take two years. However, as he sees current inflation as mainly due to external factors/energy prices he doesn’t consider higher rates as a solution. He will propose interest rate stability at the first meeting he will lead in summer (August 4). However, the CNB still has one meeting left at June 22 where it will decide on further rate hikes in its current composition. Zeman also still has to decide on the reappointment of two other board members who voted in favour rate hikes (Benda, Nidetzky). The Czech two year swap yield declined more than 20 bps today to 6.12%. The koruna resumed the downmove that started after first rumours on Michl’s appointment were aired last week. EUR/CZK jumps from the 25 area to 25.3.
The pace of monthly prices rises in Brazil eased in April from 1.62% M/M to 1.06.% M/M. However, this still resulted in headline inflation printing at 12.13%Y/Y, the fastest pace since 1996! Eight out of nine components rose on a monthly basis with food and beverages, transportation and health and personal care showing the biggest gains. Only housing related prices eased. The Central Bank of Brazil last week raised the policy rate further by 1.0% to 12.75%. In the minutes of the meeting the CB indicated that it already did quite some work to stem inflation (cycle started at 2.0%). However, a further rate hike of a lower magnitude probably is still needed at the June meeting. The Brazilian real, which had a good run earlier this year, today slightly eased further trading at USD/BRL 5.1475.
GBP/USD Outlook: Cable Bounces after US CPI Data as Markets Digest Results
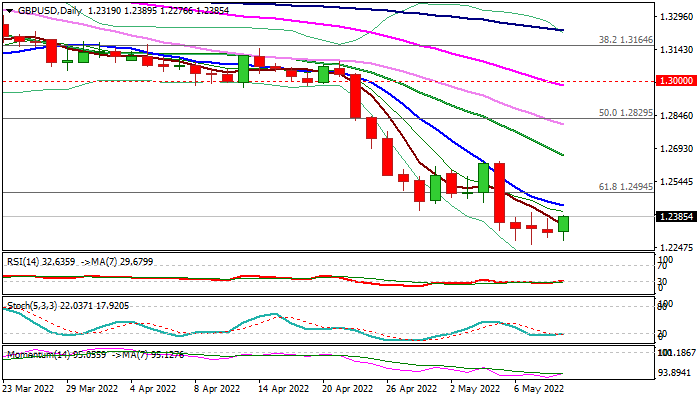
Cable fell below 1.23 handle after US CPI data came above expectations in April, but dip stayed above new 2022 low (1.2260) posted on Monday and subsequent bounce pushed the price to the mid-point of the near-term range which extends into fourth straight day.
Persisting high US inflation adds to expectations that the Fed would step up with policy tightening, bringing the possibility of 0.75% rate hike back on the table that would offer fresh support to the US currency and maintain pressure on sterling.
However, markets need to digest the data to give clearer near-term direction picture, as triple Doji on daily chart and indicators emerging from oversold territory signal that bears may take a breather for correction, attempt to counter strong bearish signal from rise in closely watched core CPI (Apr m/m 0.6% vs 0.4% f/c and Mar 0.3%) that works in favor of Fed’s more aggressive approach.
Break above near-term range top (1.2405) and daily Tenkan-sen (1.2450) would ease bearish pressure, but further rise above minimum 1.25 handle would boost initial positive signal. Failure to clear daily Tenkan-sen would keep near-term bias with bears and signal extended consolidation before bears resume.
Res: 1.2411; 1.2449; 1.2469; 1.2548.
Sup: 1.2328; 1.2300; 1.2260; 1.2200.
USD/CAD Mid-Day Outlook
Daily Pivots: (S1) 1.2976; (P) 1.3014; (R1) 1.3067; More...
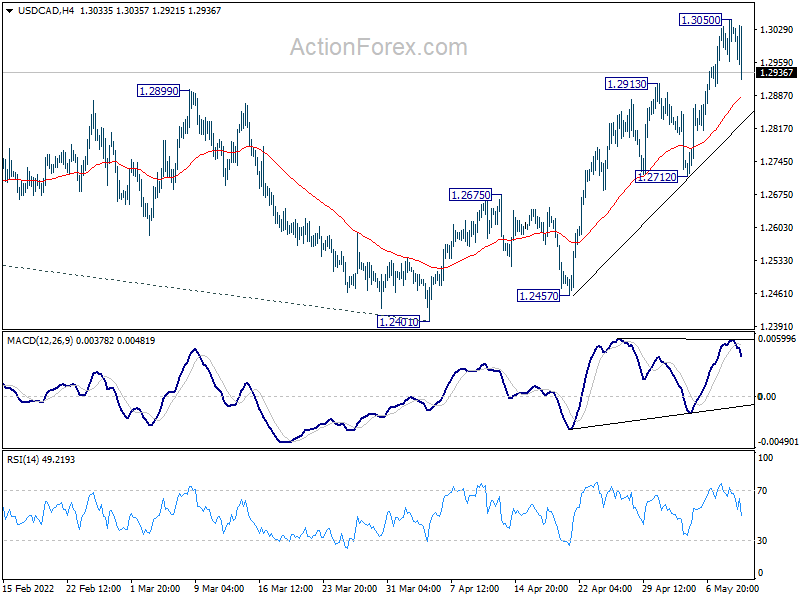
A temporary top should be formed at 1.3050 with current retreat. Intraday bias in USD/CAD is turned neutral first. But still, further rally will remain in favor as long as 1.2712 support holds. Sustained break of 1.3022 fibonacci level will carry larger bullish implications. Next target will be 100% projection of 1.2005 to 1.2947 from 1.2401 at 1.3343. However, break of 1.2712 will indicate rejection by 1.3022 fibonacci level and turn bias to the downside.
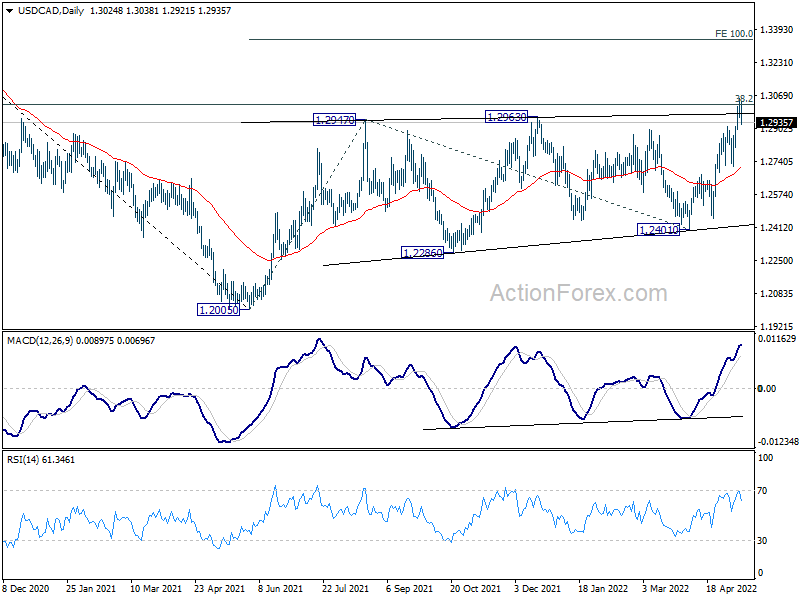
In the bigger picture, focus stays on 38.2% retracement of 1.4667 (2020 high) to 1.2005 (2021 low) at 1.3022. Sustained break there should confirm that the down trend from 1.4667 has completed after defending 1.2061 long term cluster support. Further rise would then be seen towards 61.8% retracement at 1.3650. However, rejection by 1.3022 will maintain medium term bearishness. Break of 1.2005 will resume the down trend from 1.4667 and that carries larger bearish implications too.
AUD/USD Daily Report
Daily Pivots: (S1) 0.6905; (P) 0.6946; (R1) 0.6980; More...
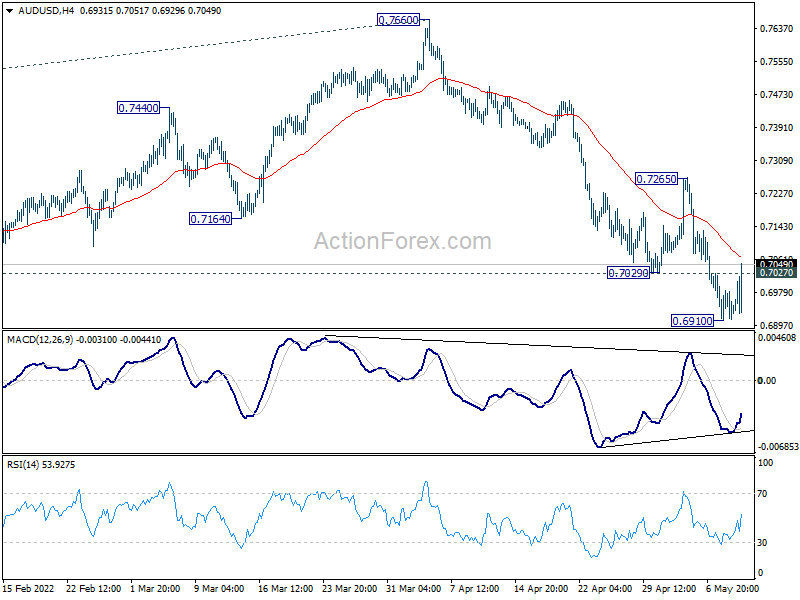
AUD/USD's break of 0.7027 minor resistance indicates temporary bottoming at 0.6910. Intraday bias is turned neutral for some consolidations first. But still, near term outlook will remain bearish as long as 0.7265 resistance holds. Break of 0.6910 will extend larger decline from 0.8006 to 0.6756 medium term fibonacci level next.
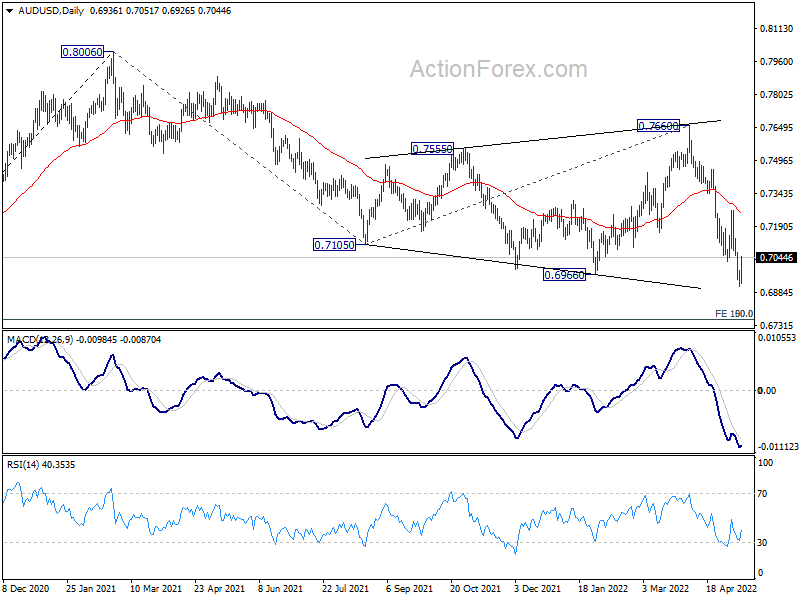
In the bigger picture, price actions from 0.8006 are seen as a corrective pattern to rise from 0.5506 (2020 low) with fall from 0.7660 as the third leg. Deeper fall should be seen to 50% retracement of 0.5506 to 0.8006 at 0.6756. This coincides with 100% projection of 0.8006 to 0.7105 from 0.7660 at 0.6760. Strong support is expected from 0.6756/60 cluster to contain downside to complete the correction. However, sustained break of 0.6756/60 would argue that AUD/USD is indeed in a medium term down trend.
US CPI Recap: Food Prices Surge by Their Most in Over 40 Years
Inflation is becoming more widespread across a broad swathe of consumer spending categories, raising the risk that it could become entrenched.
As we noted in our CPI preview report on Monday, a reading near economists’ consensus expectations of 8.1% year-over-year for price increases “would be the first meaningful decline in the annualized inflation rate since the depths of the COVID recession.”
As it turns out, inflation remains more stubborn than economists were expecting. The headline US CPI reading for April came in at 8.3% y/y, higher than expected and down only incrementally from last month’s 8.5% reading. Core CPI (excluding food and energy prices) also came in hotter than anticipated, printing at 6.2% vs. 6.0% eyed.
In terms of the individual components, much of the increase was driven by a spike in the price of food (largest 12-month increase since 1980!), which offset a big decline in the price of used cars. Put simply, inflation is becoming more widespread across a broad swathe of consumer spending categories, raising the risk that it could become entrenched.
Market reaction
So far, traders don’t believe this report will prompt the Fed to raise interest rates more aggressively through the summer, with the market still pricing in “just” a ~25% of a 75bps rate hike at one of the next two FOMC monetary policy meetings.
That said, traders in other markets are certainly taking notice of the elevated inflation reading. As we go to press, the US dollar is rallying by about 40 pips against most of its major rivals, US index futures have flipped into negative territory, and yields on US treasury bonds have spiked by 10bps across the curve.

Source: StoneX, TradingView
With this morning’s inflation report confirming that price pressures are NOT rapidly dissipating of their own accord, tightening financial conditions are likely to keep “risk on” trades (global indices, growth stocks, commodity currencies, etc) on the back foot for now.
US: Inflation Shows Some Signs of Cresting in April
Consumer price inflation decelerated in April, rising by 0.3% month-on-month (m/m) – a meaningful slowdown from March's 1.2% m/m gain. On a year-over-year (y/y) basis, inflation was up 8.3% – down 0.2 percentage points (pp) from March.
After having increased by over 30% in the last twelve months, energy prices fell by 2.7% m/m – largely a result of gasoline prices declining by 6.1% m/m. Conversely, food prices rose 0.9% m/m – the seventeenth month of consecutive increases – and are up 9.4% from year-ago levels.
Core (excludes food and energy) inflation rose 0.6% m/m, which was an acceleration from the 0.3% m/m gain in March. On a year-over-year basis, inflation ticked down 0.3 pp, rising by 6.2% y/y.
Shelter costs matched March's gain, rising 0.5% m/m with the rent index (0.6% m/m), owners' equivalent rent (0.5% m/m) and lodging away from home (1.7% m/m) all notching gains on the month. Looking across other service categories, price growth remained relatively broad-based, with transportation (3.1% m/m), medical (0.5% m/m), and recreation (0.4% m/m) services all up in April. Airfares continued to rise sharply – up a whopping 18.6% m/m.
After having declined in March, core goods prices were higher by 0.2% m/m. This was mainly a result of new vehicle prices rising by 1.1% m/m. Conversely, used vehicle prices (-0.4% m/m), apparel (-0.8% m/m) and education and communication goods (-2.6% m/m) were all lower on the month.
Key Implications
After having steadily increased over the past year, inflationary pressures are finally showing signs of cresting, as both the headline and core measures decelerated when compared to year-ago levels. Indeed, base effects are playing a favorable role, as price pressures stemming from supply chain disruptions first started to manifest in March and April of last year.
The modest pullback in April energy prices will do little to ease the pain that consumers are currently experiencing at the pump. Relative to year-ago levels, gasoline prices are up over 43%, equating to an increase of more than $1.25 per-gallon. To make matters worse, weekly data released by the Energy Information Administration has shown that gasoline prices have already turned meaningfully higher through the first part of May, with the average price of regular grade gasoline surpassing its mid-March high.
The lift in core goods prices in April was entirely due to new vehicle prices. However, the Bureau of Labor Statistics implemented a change in how they track new vehicle prices last month, replacing its own dealership survey-based data with transaction data reported by J.D. Power. The methodology may be contributing some noise to the underlying reading. If we were to abstract from this, core goods prices would have continued to decline in April.
Even though modest, the deceleration in price pressures will come as a welcome development to policymakers. Still, the FOMC has its work cut out for them over the remainder of the year, as they quickly move to swing the monetary pendulum from accommodative to outright restrictive in an effort to guide inflation back to target without causing a recession.
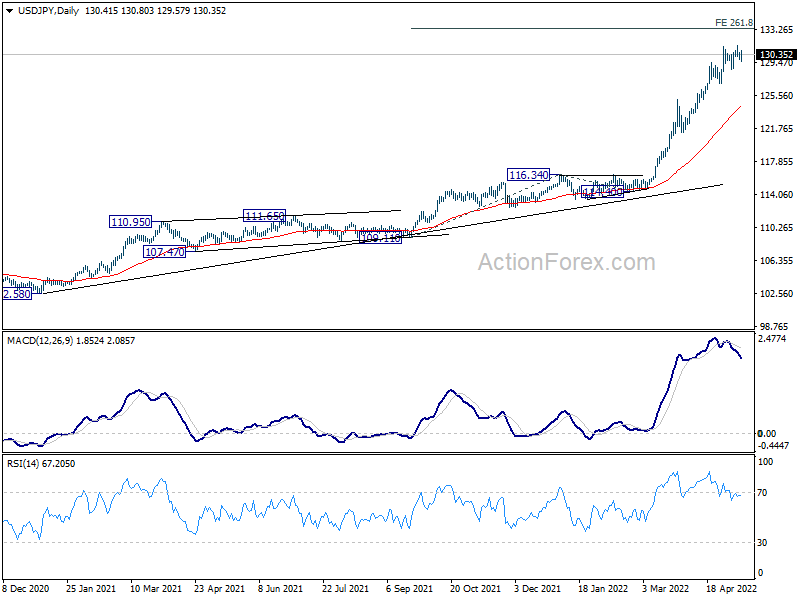
USD/JPY Mid-Day Outlook
Daily Pivots: (S1) 129.97; (P) 130.27; (R1) 130.75; More...
Intraday bias in USD/JPY remains neutral as consolidation from 131.34 is extending. Further is expected as long as 128.61 support holds. Above 131.34 will target 261.8% projection of 109.11 to 116.34 from 114.40 at 133.26. However, firm break of 128.61 will indicate short term topping, and turn bias to the downside for deeper pull back.
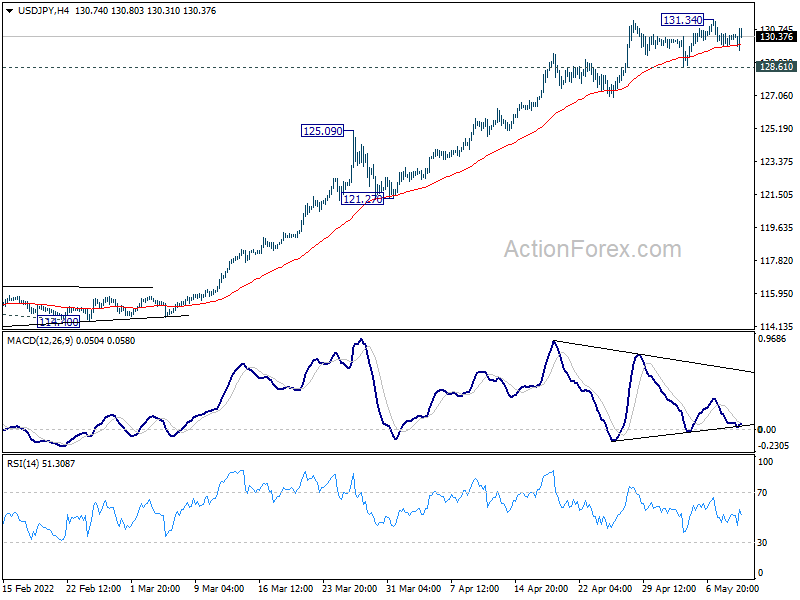
In the bigger picture, current rally is seen as part of the long term up trend form 75.56 (2011 low). Sustained trading above 61.8% projection of 75.56 (2011 low) to 125.85 (2015 high) from 98.97 at 130.04 will pave the way to 100% projection at 149.26, which is close to 147.68 (1998 high). For now, this will remain the favored case as long as 121.27 support holds.