Sample Category Title
Oil Falls Out of Uptrend
Crude oil must balance between a strengthening dollar and stock market pressure on the one hand and the problematic energy supply situation on the world markets on the other. In our opinion, this delicate equilibrium has the potential to break in the coming days, and downside risks prevail in this case.
The dollar rally squeezes capital from other assets, from developed currencies and equities to cryptocurrencies. Crude oil, meanwhile, has been trading in a roughly 20% range for the past nine weeks, although historically, it has played out with great amplitude on lower demand for risky assets and traction in the dollar.
Last week’s increase in US commercial stocks outweighed the decline in the Strategic Petroleum Reserve. This trend could continue in the near term as demand growth has slowed recently.
Although US oil producers reduced production to 11.8m BPD from 11.9m BPD last week, they continue to ramp up drilling activity, which promises more oil in the second half of the year. This desire to postpone production “for tomorrow” is easily explained by Biden’s announcement that the government will top up reserves from August.
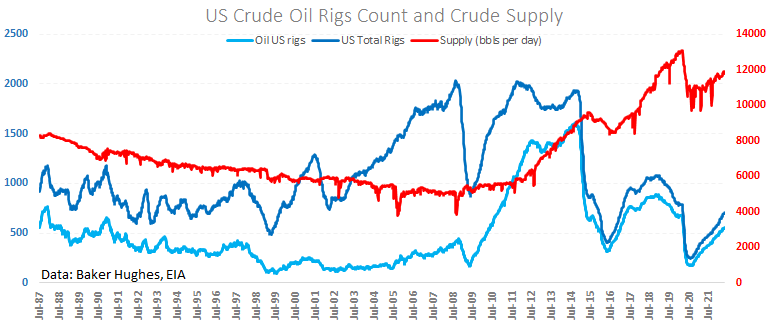
OPEC countries have also failed to keep up with the quota increases, meeting the deal at 162% of their allotted quotas and increasing the backlog of potentially permissible levels.
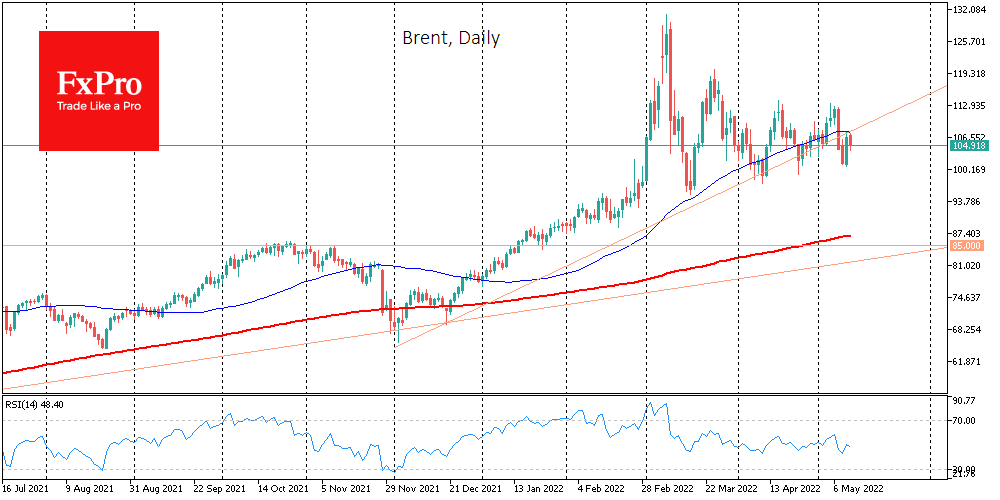
The price chart clearly shows that we are now seeing a desperate attempt to cling to former uptrend support and return to levels above the 50-day average. Locally, the bears are showing their strength by reversing the oil down from those levels on Thursday before the start of active trading in the US. This seller’s attack should largely be attributed to the dollar updating its highs against its main competitors and a full-blown risk-off in the markets.
However, having fallen out of the recent uptrend, the oil may never return to it in the foreseeable future.
USD/JPY Mid-Day Outlook
Daily Pivots: (S1) 129.35; (P) 130.08; (R1) 130.71; More...
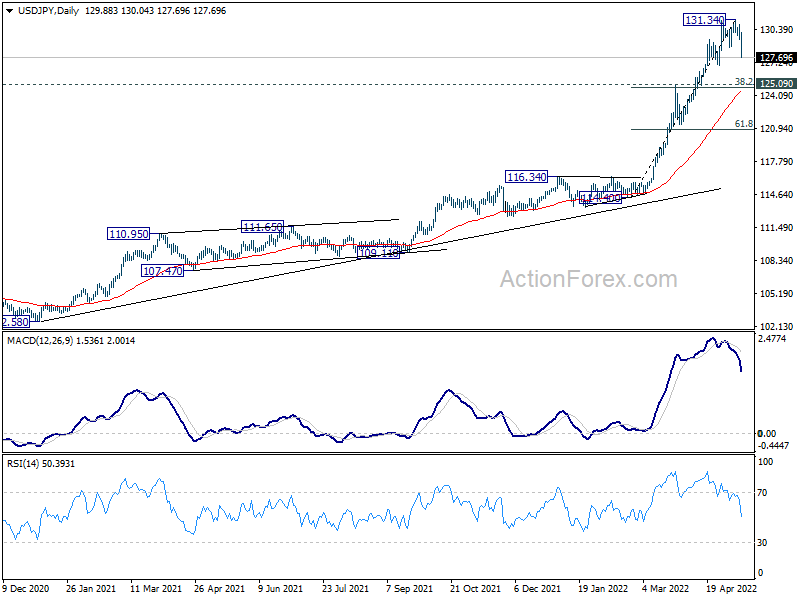
USD/JPY's break of 128.61 support confirms that a short term top is at least formed at 131.34. Intraday bias is back on the downside to 125.09 cluster support (38.2% retracement of 114.40 to 131.34 at 124.86), as correction to rise from 114.40. For now, risk will stay mildly on the downside as long as 131.34 resistance holds, in case of recovery.
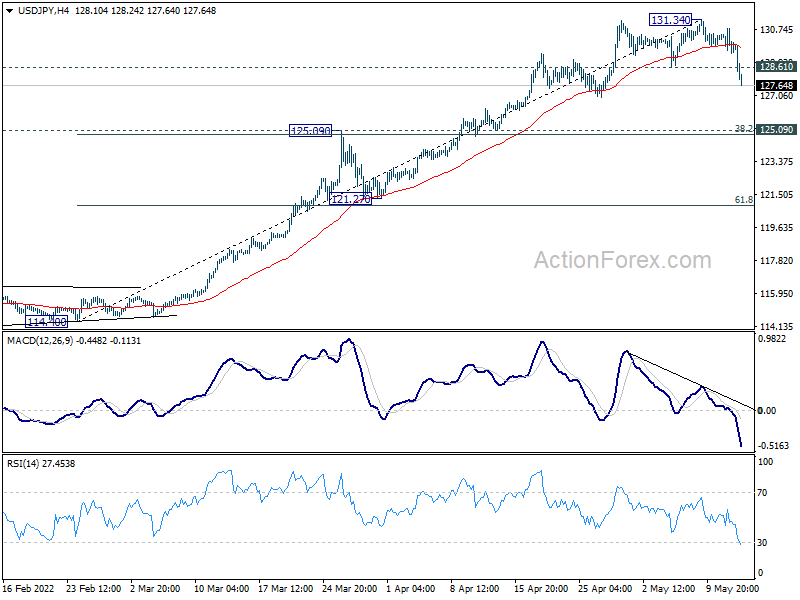
In the bigger picture, current rally is seen as part of the long term up trend form 75.56 (2011 low). Sustained trading above 61.8% projection of 75.56 (2011 low) to 125.85 (2015 high) from 98.97 at 130.04 will pave the way to 100% projection at 149.26, which is close to 147.68 (1998 high). For now, this will remain the favored case as long as 121.27 support holds.
USD/CHF Mid-Day Outlook
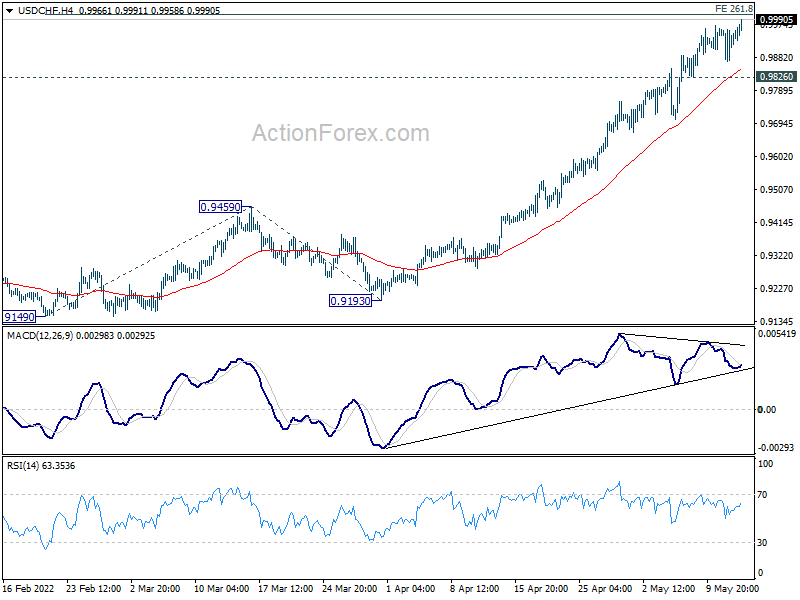
Daily Pivots: (S1) 0.9887; (P) 0.9925; (R1) 0.9979; More....
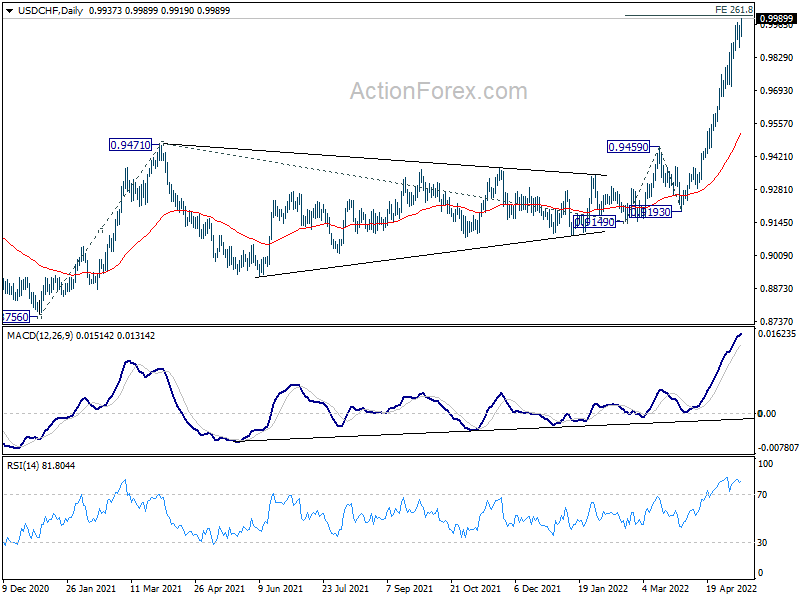
USD/CHF's rally is still in progress for 261.8% projection of 0.9149 to 0.9459 from 0.9193 at 1.0005. Considering bearish divergence condition in 4 hour MACD, upside could be limited there to bring correction. On the downside, break of 0.9826 will indicate short term topping, and turn bias to the downside for pull back. However, sustained break of 1.0005 will pave the way to next medium term projection level at 1.0306.
In the bigger picture, down trend from 1.0342 (2016 high) should have completed with three waves down to 0.8756 (2021 low) already. Rise from 0.8756 is likely a medium term up trend of its own. Next target is 161.8% projection of 0.8756 to 0.9471 from 0.9149 at 1.0306, which is close to 1.0342 (2016 high). This will remain the favored case as long as 0.9459 resistance turned support holds.
GBP/USD Mid-Day Outlook
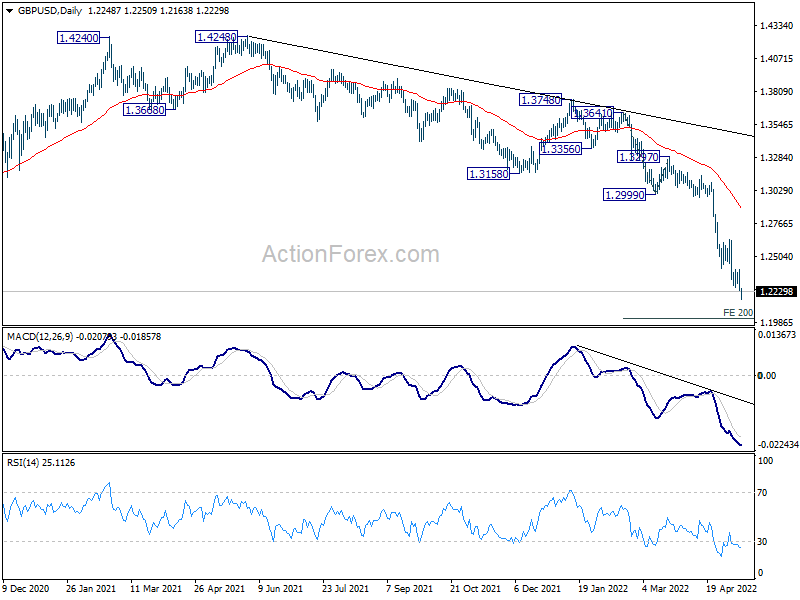
Daily Pivots: (S1) 1.2190; (P) 1.2295; (R1) 1.2352; More...
Intraday bias in GBP/USD remains on the downside at this point. Current down trend should target 200% projection of 1.3641 to 1.2999 from 1.3297 at 1.2013 next. On the upside, above 1.2399 minor resistance will turn intraday bias neutral again. But outlook will stay bearish as long as 1.2637 resistance holds.
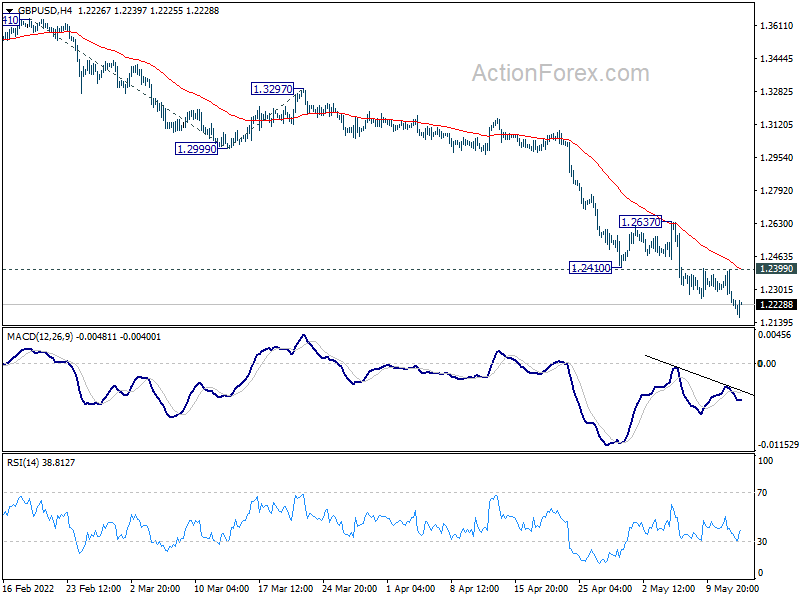
In the bigger picture, based on current momentum, fall from 1.4248 (2018 high) at least at the same degree as the rise from 1.1409 (2020 low). That is, fall from 1.4248 could be a leg inside the pattern from 1.1409, or resuming the longer term down trend. In either case, deeper decline is expected as long as 1.2999 support turned resistance holds. Next target is 1.1409 low.
EUR/USD Mid-Day Outlook
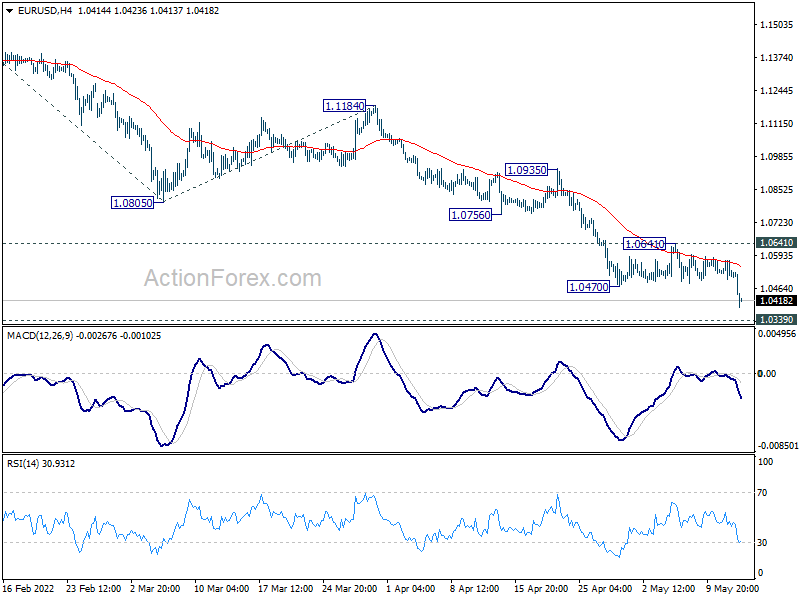
Daily Pivots: (S1) 1.0485; (P) 1.0531 (R1) 1.0560; More...
EUR/USD finally breaks through 1.0470 support today as larger down trend resumes. Intraday bias is back on the downside with focus on 1.0339 long term support. Firm break there will carry larger bearish implication and target 161.8% projection of 1.1494 to 1.0805 from 1.1184 at 1.0069. On the upside, break of 1.0641 resistance is needed to indicate short term bottoming. Otherwise, outlook will stay bearish in case of recovery.
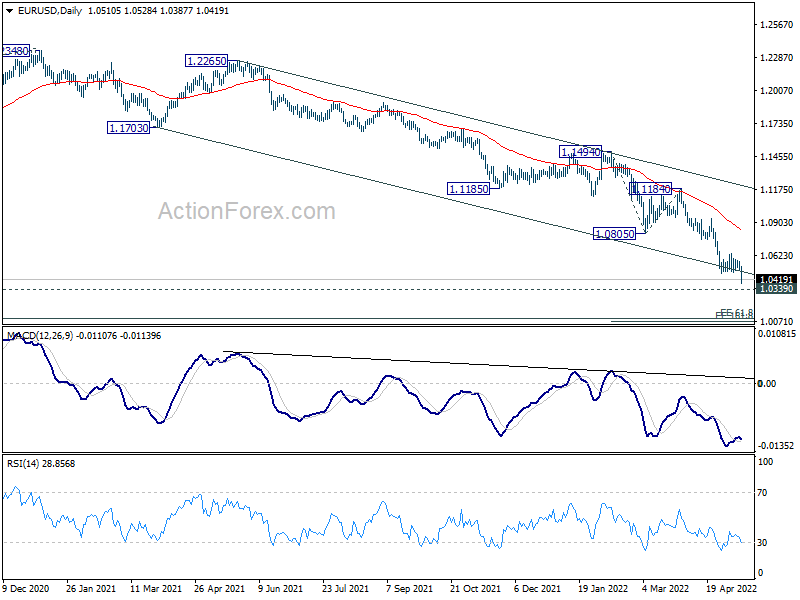
In the bigger picture, break of medium term channel support suggests downside acceleration. Current decline from 1.2348 (2021 high) is probably resuming long term down trend from 1.6039 (2008 high). Retest of 1.0339 (2017 low) low should be seen next. Decisive break there will confirm this bearish case. This will now remain the favored case as long as 1.0805 support turned resistance holds.
EUR/USD Downside Breakout, Yen in Upside Acceleration
Yen is the runaway winner today on massive safe-haven flows, which also pushed up treasury bonds. Meltdown in cryptocurrencies intensified further, as bitcoin barely holds on to 25k. Major European indexes are in deep red while US futures, in particular NASDAQ, are pointing to lower open. Benchmark treasury yields extend pull back, as US 10-year yield is back at 2.83 while Germany 10-yearly yield is back at 0.85.
Back in the currency markets, Dollar is following Yen as the second strongest. Aussie is the worst performing so far. But Euro's selloff is worth more of a mention, despite hawkish comments from ECB officials. The weakness in Euro is somewhat amplified by the selloff against Sterling and Swiss Franc.
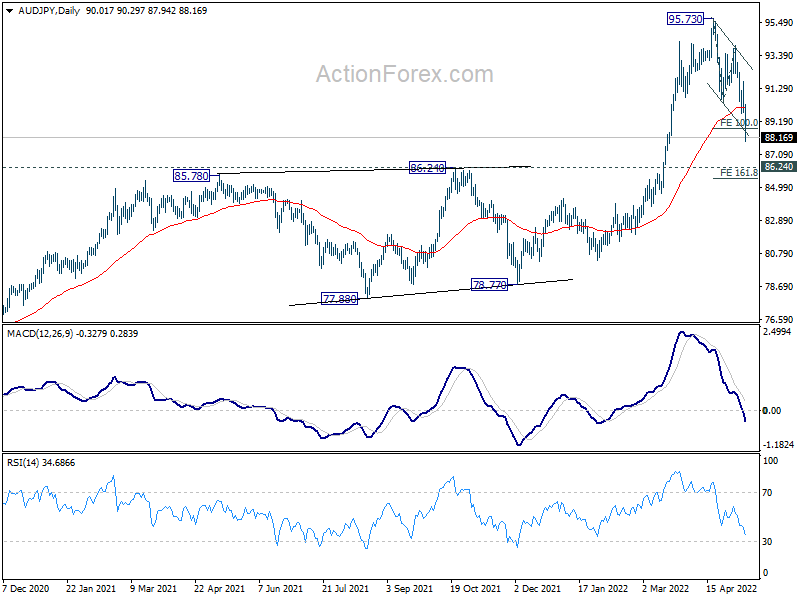
Technically, AUD/JPY's fall from 95.73 extends to as low as 87.94 so far today. The break of near term falling channel support suggests downside acceleration. The break of 100% projection of 95.73 to 90.41 from 94.00 at 88.68 also raises the chance that 95.73 is already a medium term top. Next line of defense is in 86.24 resistance turned support. Firm break there will argue that it's already correcting the whole up trend from 2020 low at 59.85 already. Such development, if happens, could be reflected in global stocks and even bond markets too.
In Europe, at the time of writing, FTSE is down -2.12%. DAX is down -2.30%. CAC is down -2.56%. Germany 10-year yield is down -0.131 at 0.860. Earlier in Asia, Nikkei dropped -1.77%. Hong Kong HSI dropped -2.24%. China Shanghai SSE dropped -0.12%. Singapore Strait Times dropped -1.89%. Japan 10-yaer JGB yield rose 0.0026 to 0.251.
US PPI up 0.5% mom, 11.0% yoy in Apr, above expectations
US PPI for final demand rose 0.5% mom in April, matched expectations. PPI final demand for goods rose 1.3% mom, for construction dropped -4.0%, while for services was unchanged. For the 12-month period, PPI rose 11.0% yoy, down from 11.2% yoy, above expectation of 10.7% yoy.
PPI less foods, energy, and trade services rose 0.6% mom. For the 12-month period, PPI for less foods, energy, and trade services rose 6.9% yoy.
US initial jobless claims rose to 203k, continuing claims dropped to 1.343m
US initial jobless claims rose 1k to 203k in the week ending May 7, above expectation of 190k. Four-week moving average of initial claims rose 4k to 193k.
Continuing claims dropped -44k to 1343k in the week ending April 30, lowest since January 3, 1970 when it was 1332k. Four-week moving average of initial claims dropped -33k to 1385k, lowest since January 31, 1970 when it was 1374k.
ECB Makhlouf: The era of negative rates is reaching its conclusion
ECB Governing Council member Gabriel Makhlouf said today, ECB has reached the point "act". And, "the balance of advantage has tilted decisively towards the need for further action, albeit not necessarily at a similar pace to that of other central banks".
"Our objective is for inflation to be at 2% over the medium term - levels are significantly above that now, and it is time for the Council to move to end net asset purchases under the asset purchase programme next month or in July," he said.
Makhlouf added, it's "realistic to expect that the first move in the ECB's interest rates will happen soon after net asset purchases end and that rates are likely to be in positive territory by early next year." But he didn't specify when the rate hike would occurs.
"The era of negative rates is reaching its conclusion," he said.
BoE Ramsden: I don't think we've gone far enough yet on bank rate
BoE Deputy Governor Governor Dave Ramsden told Bloomberg that stronger than expected job market could push inflation further higher from current 7% to 10% before year end. "Given what we know about the UK labor market, I wouldn't be surprised if it turned out to be a bit tighter," he said. "I think there are upside risks on inflation the medium term."
"Certainly on the basis of my current assessment of prospects, we're not there yet in terms of how far monetary policy has to tighten," he said. "I'm still very, very supportive of the forward guidance that there may well need to be further tightening in the coming months."
June "will be a chance to take stock -- in this extraordinary period we really are learning things everyday," he said. "I don't think we've gone far enough yet on bank rate, but I do think that what we've already done is having an impact."
UK GDP contracted -0.1% mom in Mar, up 0.8% qoq in Q1
UK GDP contracted -0.1% mom in March, worse than expectation of 0.1% mom growth. That came after no growth in February (revised down from 0.1%). For the month, services dropped -0.2%. Production dropped -0.2%. Construction grew 1.7%. Monthly GDP is still 1.2% above pre-coronavirus levels, with services 1.5% above, construction 3.7% above and production -1.6% below.
For Q1, GDP grew 0.8% qoq, below expectation of 1.0% qoq. Services rose 0.4% qoq. Production rose 1.2% qoq. Construction rose 3.8% qoq. Quarterly GDP was 0.7% above pre-coronavirus level.
Also released, manufacturing production came in at -0.2% mom, 1.9% yoy in March, versus expectation of 0.0% mom, 2.3% yoy. Industrial production was at -0.2% mom, 0.7% yoy, versus expectation of 0.1% mom, 0.4% yoy. Goods trade deficit widened to GBP -23.9B, versus expectation of GBP -18.5B.
BoJ: Necessary to continue with current powerful monetary easing
In the Summary of Opinions of the April 27-28 meeting, BoJ noted that "as Japan is a commodity importer, the rise in commodity prices leads to an outflow of income from Japan and thus exerts downward pressure on the economy." And, "it is necessary for the Bank to continue with the current powerful monetary easing and thereby firmly support the economy"
One opinion noted that "one reason for the yen's recent depreciation is that economic conditions in Japan have been different from those in the United States and Europe, and it is not appropriate that the Bank change its policy with the aim of controlling foreign exchange rates."
"With a view to clarifying the Bank's stance to date of not accepting the long-term interest rate exceeding 0.25 percent and to avoiding a situation where daily operations are unnecessarily factored in by the market, it is appropriate for the Bank to announce in advance that it will conduct fixed-rate purchase operations at 0.25 percent every business day, unless it is highly likely that no bids will be submitted."
EUR/USD Mid-Day Outlook
Daily Pivots: (S1) 1.0485; (P) 1.0531 (R1) 1.0560; More...
EUR/USD finally breaks through 1.0470 support today as larger down trend resumes. Intraday bias is back on the downside with focus on 1.0339 long term support. Firm break there will carry larger bearish implication and target 161.8% projection of 1.1494 to 1.0805 from 1.1184 at 1.0069. On the upside, break of 1.0641 resistance is needed to indicate short term bottoming. Otherwise, outlook will stay bearish in case of recovery.
In the bigger picture, break of medium term channel support suggests downside acceleration. Current decline from 1.2348 (2021 high) is probably resuming long term down trend from 1.6039 (2008 high). Retest of 1.0339 (2017 low) low should be seen next. Decisive break there will confirm this bearish case. This will now remain the favored case as long as 1.0805 support turned resistance holds.
Economic Indicators Update
| GMT | Ccy | Events | Actual | Forecast | Previous | Revised |
|---|---|---|---|---|---|---|
| 23:01 | GBP | RICS Housing Price Balance Apr | 80% | 71% | 74% | |
| 23:50 | JPY | Bank Lending Y/Y Apr | 0.90% | 0.40% | 0.50% | |
| 23:50 | JPY | BoJ Summary of Opinions | ||||
| 23:50 | JPY | Current Account (JPY) Mar | 1.56T | 0.63T | 0.52T | |
| 01:00 | AUD | Consumer Inflation Expectations May | 5.00% | 5.20% | ||
| 03:00 | NZD | RBNZ Inflation Expectations Q/Q Q2 | 3.29% | 3.27% | ||
| 05:00 | JPY | Eco Watchers Survey: Current Apr | 51.3 | 47.8 | ||
| 06:00 | GBP | GDP M/M Mar | -0.10% | 0.10% | 0.10% | 0.00% |
| 06:00 | GBP | GDP Q/Q Q1 P | 0.80% | 1.00% | 1.30% | |
| 06:00 | GBP | Manufacturing Production M/M Mar | -0.20% | 0.00% | -0.40% | -0.60% |
| 06:00 | GBP | Manufacturing Production Y/Y Mar | 1.90% | 2.30% | 3.60% | 3.50% |
| 06:00 | GBP | Industrial Production M/M Mar | -0.20% | 0.10% | -0.60% | -0.30% |
| 06:00 | GBP | Industrial Production Y/Y Mar | 0.70% | 0.40% | 1.60% | 2.10% |
| 06:00 | GBP | Index of Services 3M/3M Mar | 0.40% | 0.90% | 0.80% | |
| 06:00 | GBP | Goods Trade Balance (GBP) Mar | -23.9B | -18.5B | -20.6B | |
| 06:30 | CHF | Producer and Import Prices M/M Apr | 1.30% | 0.90% | 0.80% | |
| 06:30 | CHF | Producer and Import Prices Y/Y Apr | 6.70% | 5.80% | 6.10% | |
| 11:31 | GBP | NIESR GDP Estimate (3M) Apr | 0.30% | 1.00% | 0.80% | |
| 12:30 | USD | PPI M/M Apr | 0.50% | 0.50% | 1.40% | 1.60% |
| 12:30 | USD | PPI Y/Y Apr | 11.00% | 10.70% | 11.20% | |
| 12:30 | USD | PPI Core M/M Apr | 0.40% | 0.60% | 1.00% | 1.20% |
| 12:30 | USD | PPI Core Y/Y Apr | 8.80% | 8.90% | 9.20% | |
| 12:30 | USD | Initial Jobless Claims (May 6) | 203K | 190K | 200K | 202K |
| 14:30 | USD | Natural Gas Storage | 82B | 77B |
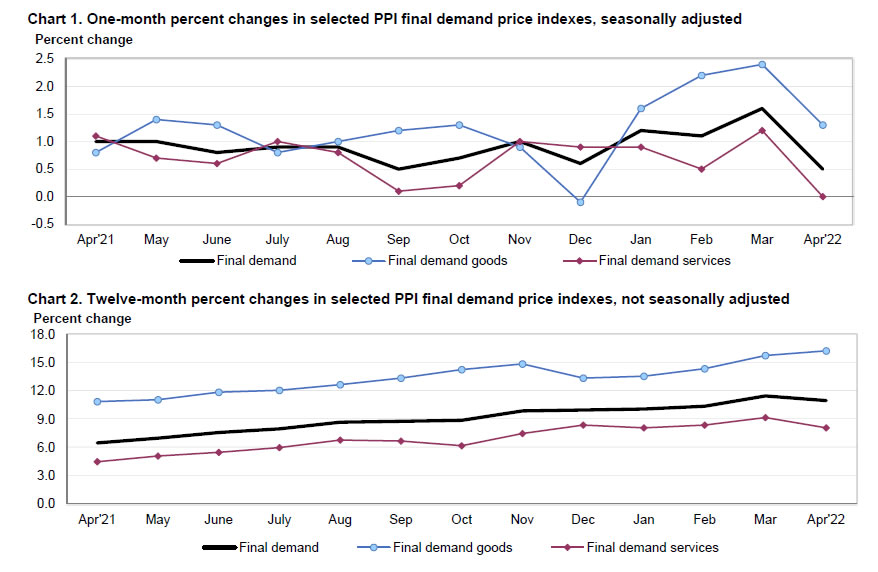
US PPI up 0.5% mom, 11.0% yoy in Apr, above expectations
US PPI for final demand rose 0.5% mom in April, matched expectations. PPI final demand for goods rose 1.3% mom, for construction dropped -4.0%, while for services was unchanged. For the 12-month period, PPI rose 11.0% yoy, down from 11.2% yoy, above expectation of 10.7% yoy.
PPI less foods, energy, and trade services rose 0.6% mom. For the 12-month period, PPI for less foods, energy, and trade services rose 6.9% yoy.
US initial jobless claims rose to 203k, continuing claims dropped to 1.343m
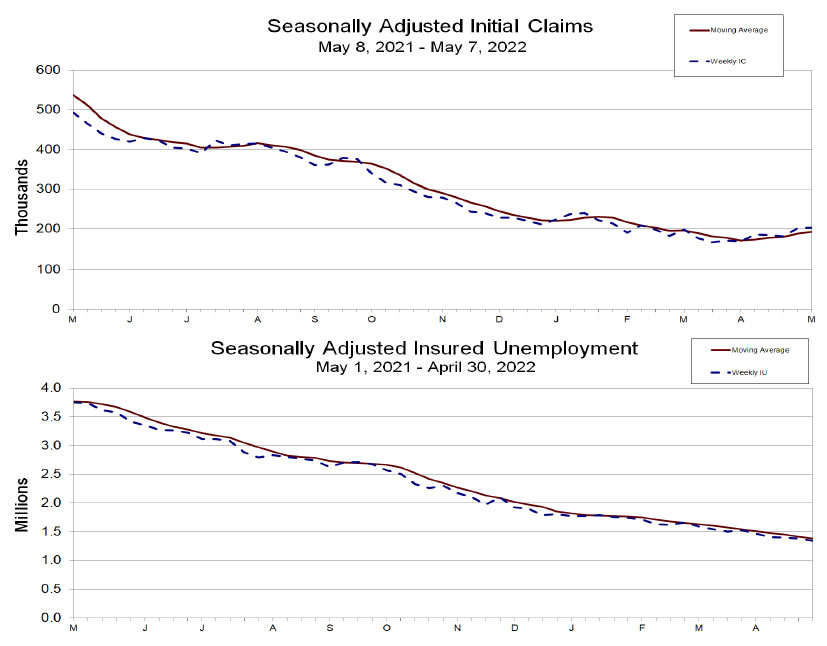
US initial jobless claims rose 1k to 203k in the week ending May 7, above expectation of 190k. Four-week moving average of initial claims rose 4k to 193k.
Continuing claims dropped -44k to 1343k in the week ending April 30, lowest since January 3, 1970 when it was 1332k. Four-week moving average of initial claims dropped -33k to 1385k, lowest since January 31, 1970 when it was 1374k.
ECB Makhlouf: The era of negative rates is reaching its conclusion
ECB Governing Council member Gabriel Makhlouf said today, ECB has reached the point "act". And, "the balance of advantage has tilted decisively towards the need for further action, albeit not necessarily at a similar pace to that of other central banks".
"Our objective is for inflation to be at 2% over the medium term - levels are significantly above that now, and it is time for the Council to move to end net asset purchases under the asset purchase programme next month or in July," he said.
Makhlouf added, it's "realistic to expect that the first move in the ECB's interest rates will happen soon after net asset purchases end and that rates are likely to be in positive territory by early next year." But he didn't specify when the rate hike would occurs.
"The era of negative rates is reaching its conclusion," he said.
NZDUSD Selling The Rallies At The Blue Box Area
In this technical blog we’re going to take a quick look at the Elliott Wave charts of NZDUSD forex pair. As our members know, the pair shows bearish sequences in the cycle from the February 2021 peak. The pair has made 3 waves bounce recently, that has reached our selling zone and gave us good trading opportunities. In the further text we are going to explain the Elliott Wave Forecast and the trading strategy.
NZDUSD H1 Elliott Wave Analysis 05.11.2022
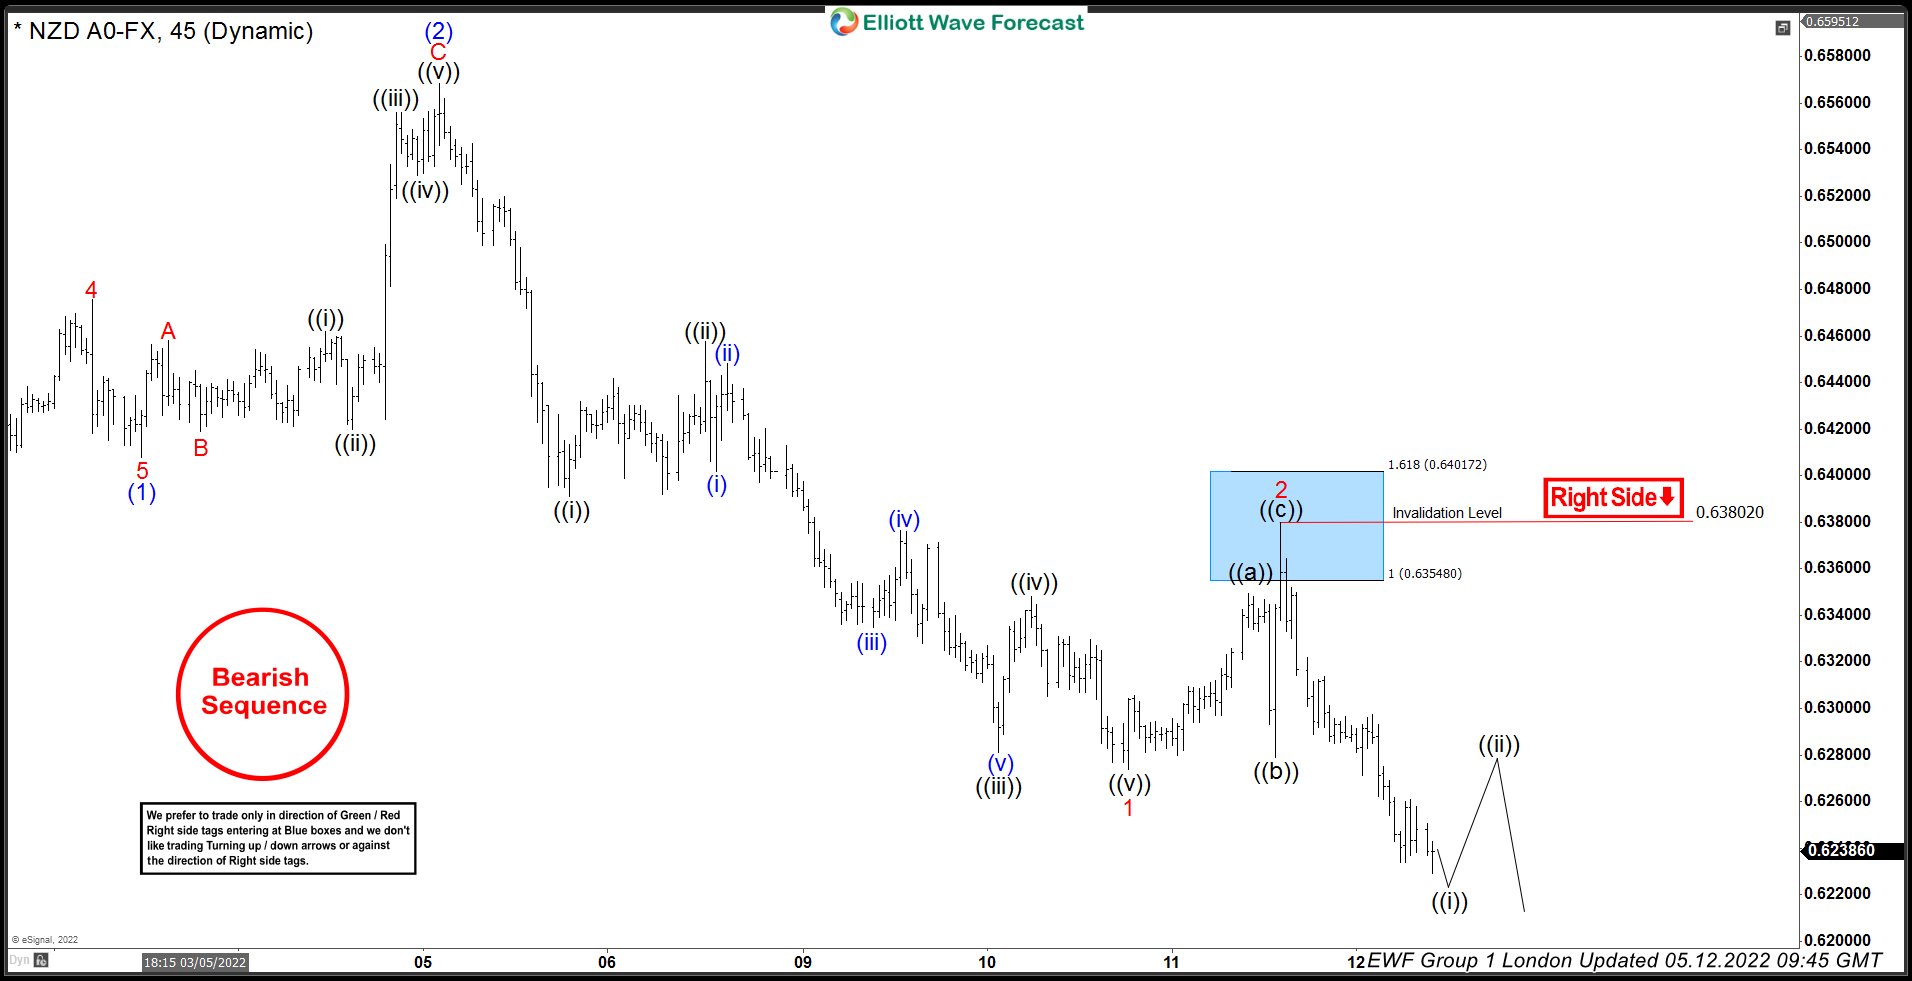
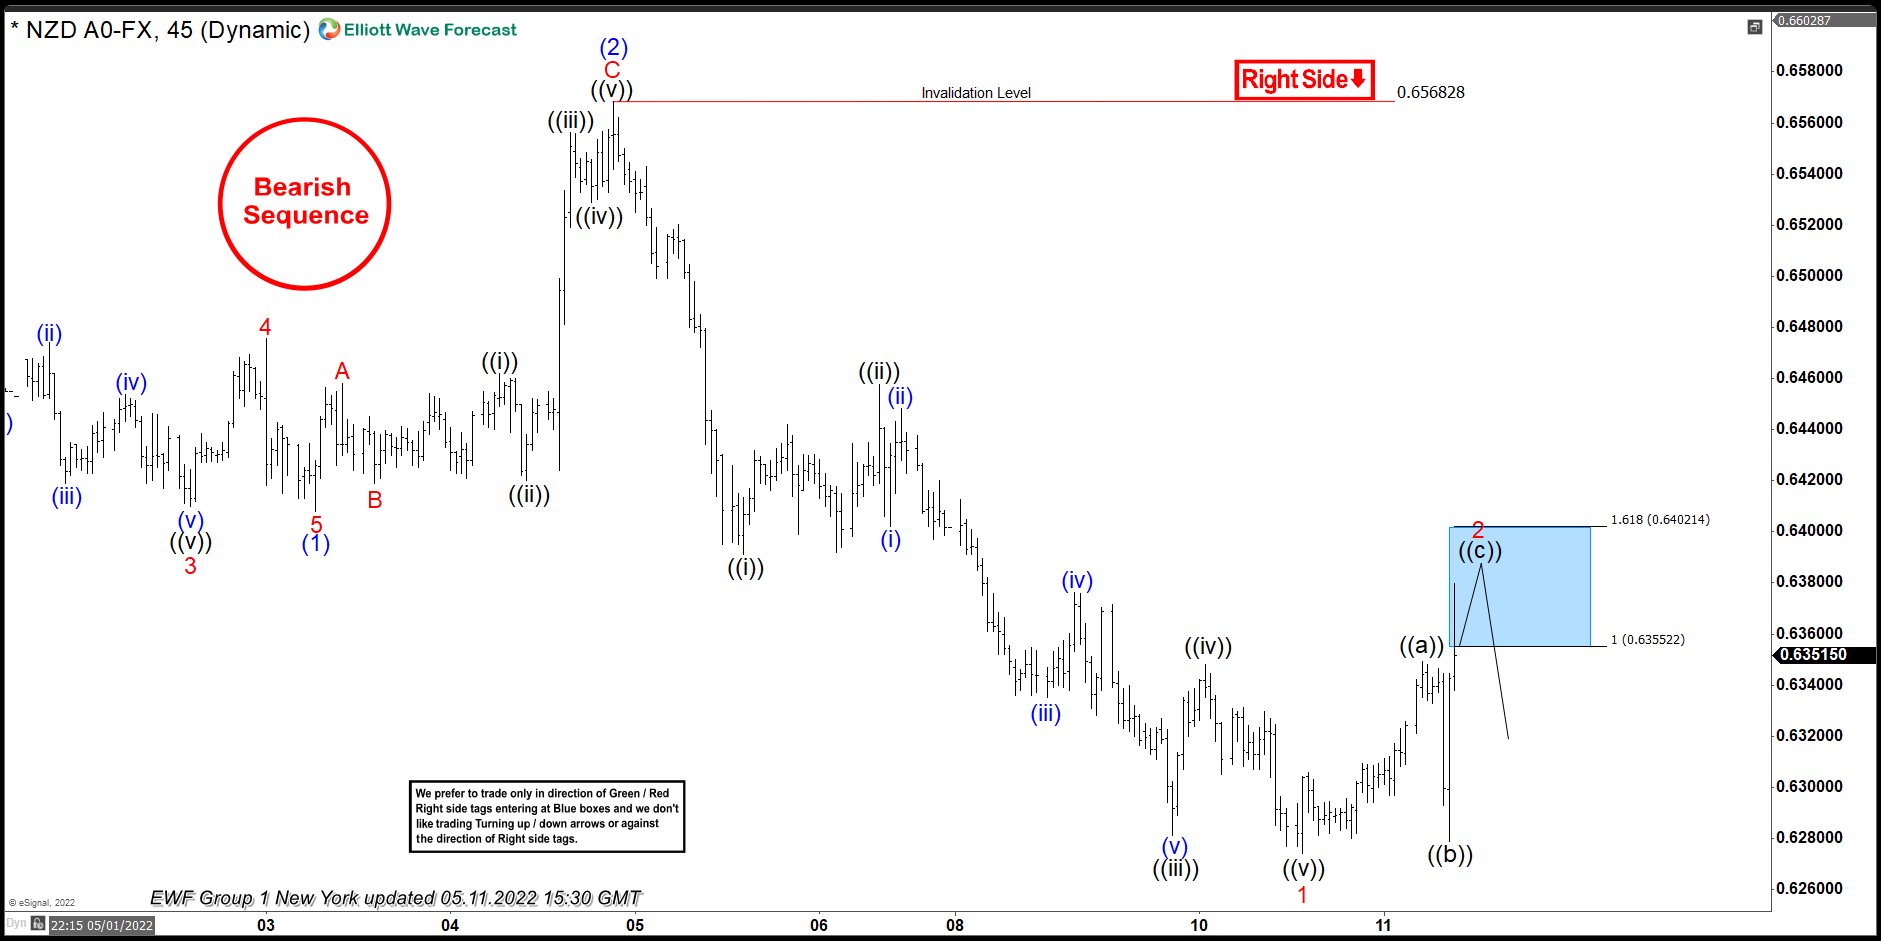
NZDUSD is correcting the cycle from the 0.65682 peak. Recovery has already reached blue box at 0.63552-0.64021 area to complete 2 red recovery. We recommended members to avoid buying the pair while we’re favoring the short side from the blue box. Strategy is selling the pair at the marked zone. Invalidation for the trade would be break above 1.618 fibs extension: 0.64021. As the main trend is bearish we expect sellers to appear at the blue box for 3 waves pull back at least. Once pull back reaches 50 Fibs against the ((b)) black low, we will make short position risk free ( put SL at BE) and take partial profits.
NZDUSD H1 Elliott Wave Analysis 05.12.2022
The pair found sellers at the blue box area: 0.63552-0.64021 and made turn lower from there. As a result , members who took short trades made positions risk free ( Put SL at BE) and took partial profits. We got a break toward new lows which makes the pair bearish against the 0.63802 peak in first degree. At this stage we see wave 2 red completed at the 0.6380 high. While mentioned pivot holds, the pair can keep finding intraday sellers in 3,7,11 swings for a further extension down.
Keep in mind market is dynamic and presented view could have changed in the mean time. You can check most recent charts in the membership area of the site. Best instruments to trade are those having incomplete bullish or bearish swings sequences.We put them in Sequence Report and best among them are shown in the Live Trading Room.