Sample Category Title
The Dust Settles
Thursday has been another hectic trading session, the European stocks opened significantly lower, but losses melted throughout the day, and the Euro Stoxx recorded less than 1% drop at the close. The FTSE index fell faster than its most European peers, as energy and commodity stocks took a toll on the back of the rising fear that an eventual economic recession could eat into their profits in the coming quarters.
BP lost 4.70% yesterday, and near 8% this week, but energy stocks remain comfortably on a positive trend to claim fresh post-pandemic highs, as crude oil is back on track for more gains on the rising tensions between Russia and Europe.
While the Europeans are going around their own sanctions against Russia by opening accounts with Gazprom bank to pay the Russian gas in exchange of rubles (!!), the latest news suggest that Russia is now cutting the German gas as a retaliation to its sanctions.
Of course, the Europeans have been quite bad in this poker game - they showed too openly how scared they were to lose the Russian gas that now, Russia is gaining the upper hand.
European gas futures gained another 13% yesterday, and the pressure on energy prices remain clearly tilted to the upside. Although the fear of recession tends to cause some selloff, the price pullbacks are still seen, by some, as opportunity to strengthen the long positions, and help oil companies outperform.
In this sense, the Saudi Aramco has surpassed Apple in terms of market capitalization this week, to become the world’s most valuable company. The latter is very symbolic, in fact, as it symbolizes the revenge of the energy companies which have been shattered during the pandemic months, against the tech companies that have greatly benefited from the lockdown measures.
European and US futures are in the positive this morning, but the wind could change direction very fast these days. And the rising market volatility is more of a sign of potential further losses than sustainable gains.
Looking for signs of USD correction
In the FX space, yesterday was again marked by the strength of the US dollar. The dollar index extended gains to a fresh almost-20-year high. The EURUSD tanked to 1.0350 level, then rebounded to test the 1.04 this morning. Traders are increasingly positioning for the pair to advance toward the parity sooner than previously predicted.
Cable fell to 1.2165 on the back of a broadly strong US dollar, as well. The dollar-lira on the other remains under a decent positive pressure, and the dollar’s current strength is costing big to the Turkish central bank who puts a lot of weight behind the lira, in an effort to keep it steady against a relentlessly strengthening greenback.
The dollar index is up by 10% since the beginning of the year, and 17% since last May, and many investors know that the actual rally in the US dollar won’t last; it will soon be time for a correction. Of course, the hawkish Federal Reserve (Fed) expectations, the war in Ukraine, and the selloff across all asset classes boosted appetite in the greenback. Yet, as soon as investors have enough confidence to return to the market, the dollar will likely give back a part of its current strength. In this sense, I guess it’s just a matter of time we see the strong dollar ease. The question is, will we see the euro hit parity, and sterling reach the 1.20 level before the trend reverses?
Dust settles
The dust seems to be settling in cryptocurrencies. Terra and Luna are now worth almost nothing and probably won’t regain the investors’ confidence, and Tether, another stable coin had a mini crash to 0.95, BUT it recovered fast before things got serious, and Bitcoin returned past the $30K, which is a sign that the confidence in the broader sector may have not been damaged as much as we first feared. This being said, the crypto investors will certainly be pickier in selecting their holdings from now on, as the Terra incident comes as a warning that the cryptocurrencies can crash as fast as they emerge.
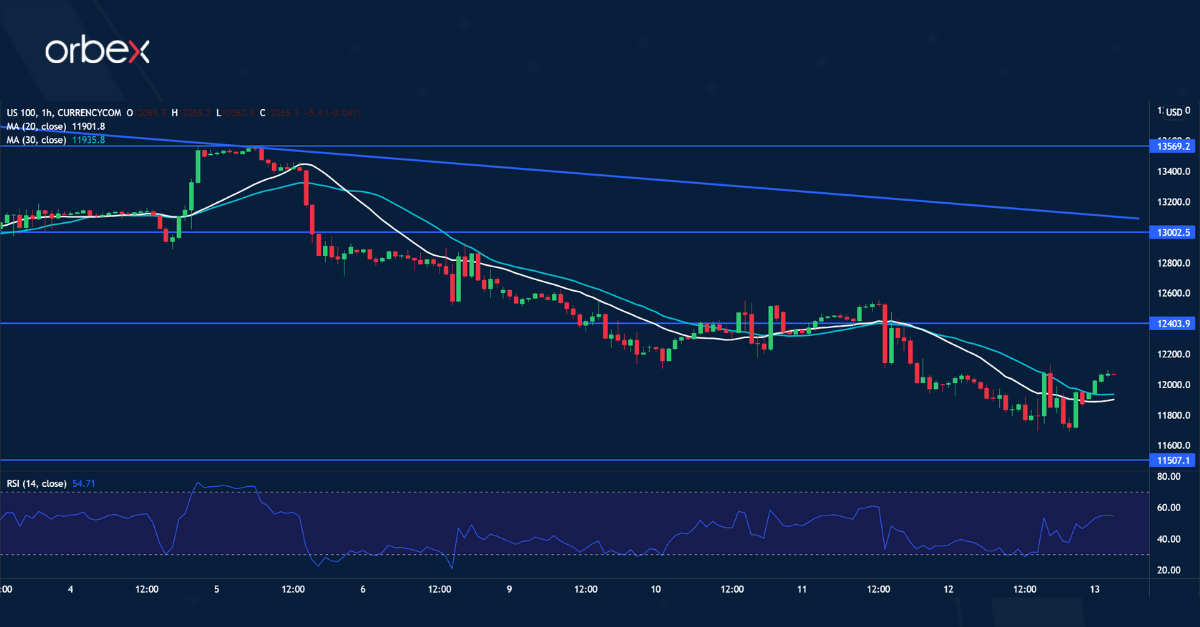
Nasdaq 100 May See Limited Bounce
The Nasdaq 100 struggles to find bottom as investors continue to flee risk assets. The index sees no sign of stabilisation yet as it approaches 11500. The price action has been capped by a falling trend line from last April. An oversold RSI may prompt sellers to take profit and possibly trigger a mean reversion trade to the upper band (13000) of the line. A break above 12400 may attract enough buying interest to make this happen, but the rebound could be limited unless the bulls succeed in pushing higher.
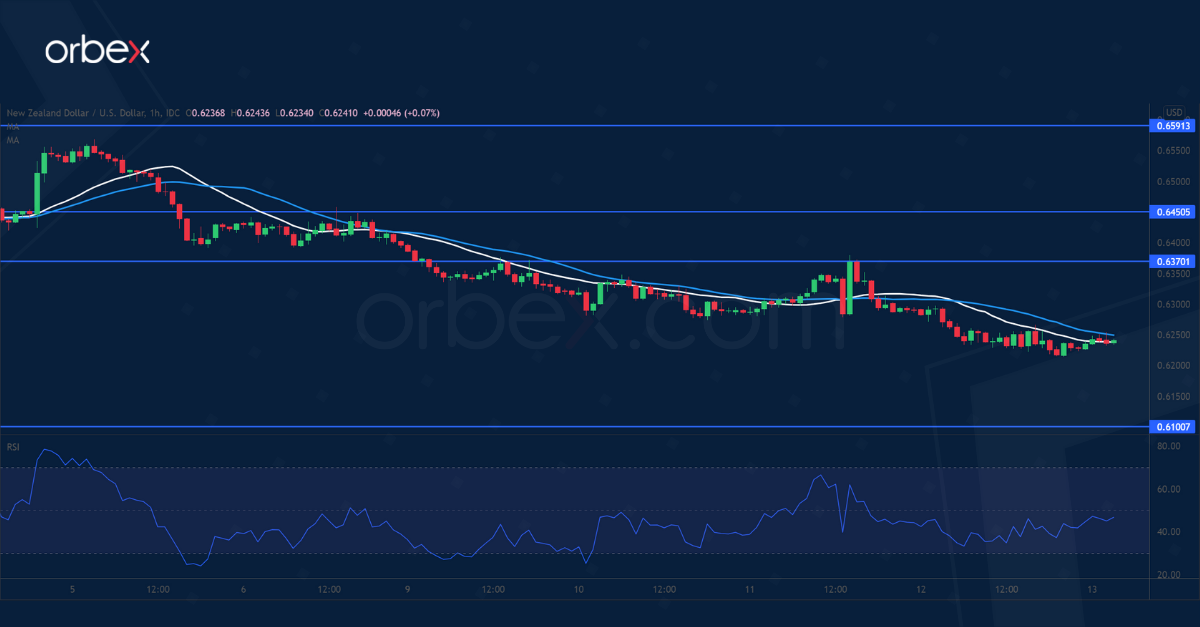
NZD/USD Grinds Lower
The New Zealand dollar tumbles as traders continue to pile into safe haven assets. The sell-off accelerated after the pair sank below June 2020’s lows near 0.6400. Downbeat sentiment may attract more trend followers after a faded rebound. 0.6100 near a two-year low would be the next target. 0.6370 is a fresh resistance and the bears may sell into strength at the next bounce. The support-turned-resistance at 0.6450 sits next to the 20-day moving average and is a major level to clear before a reversal could materialise.
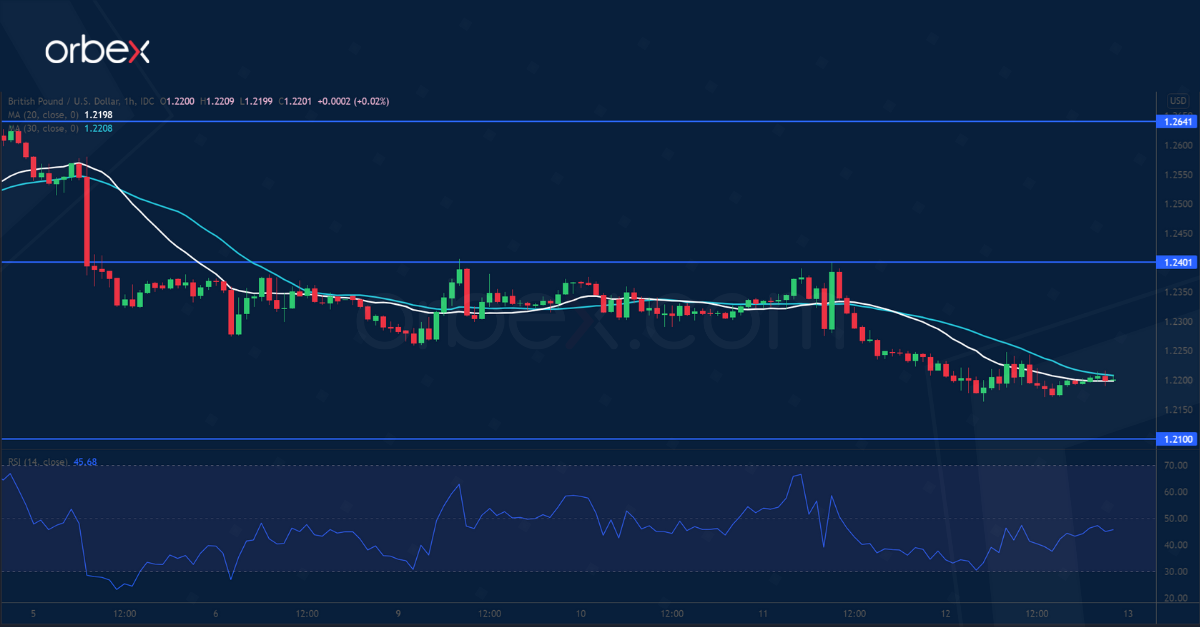
GBP/USD to Reach 2-Year Lows
The pound remained under pressure after a slowdown in the UK’s GDP growth in Q1. A break below the lower range (1.2260) of a brief consolidation signalled a bearish continuation. Sterling is heading towards its two-year low at 1.2100. Short-covering could be expected and in conjunction with dip-buying could drive the price up momentarily. 1.2400 is the first resistance and the bulls need to lift the recent high at 1.2640 before they could regain control. Otherwise, the psychological level of 1.2000 would be the next stop.
EUR/USD Daily Outlook
Daily Pivots: (S1) 1.0313; (P) 1.0421 (R1) 1.0488; More...
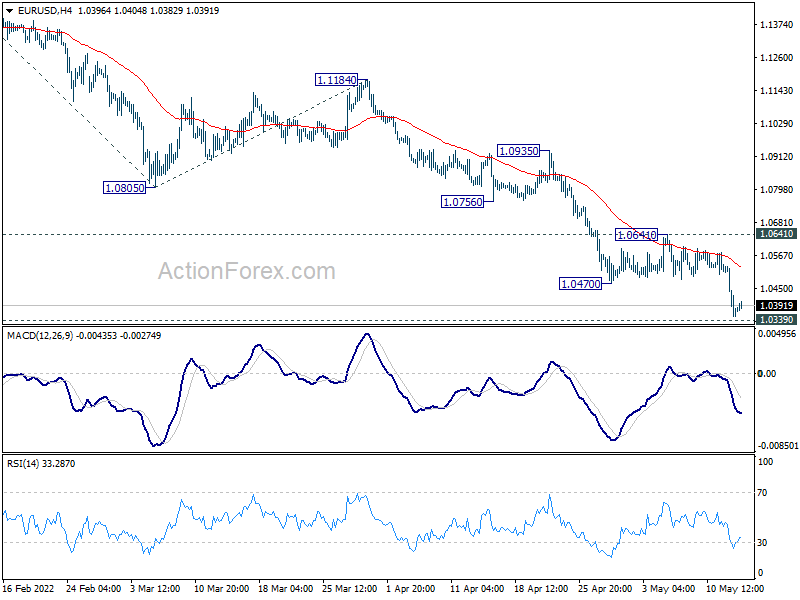
Intraday bias in EUR/USD stays on the downside for the moment. Decisive break of 1.0339 long term support will carry larger bearish implication and target 161.8% projection of 1.1494 to 1.0805 from 1.1184 at 1.0069. On the upside, break of 1.0641 resistance is needed to indicate short term bottoming. Otherwise, outlook will stay bearish in case of recovery.
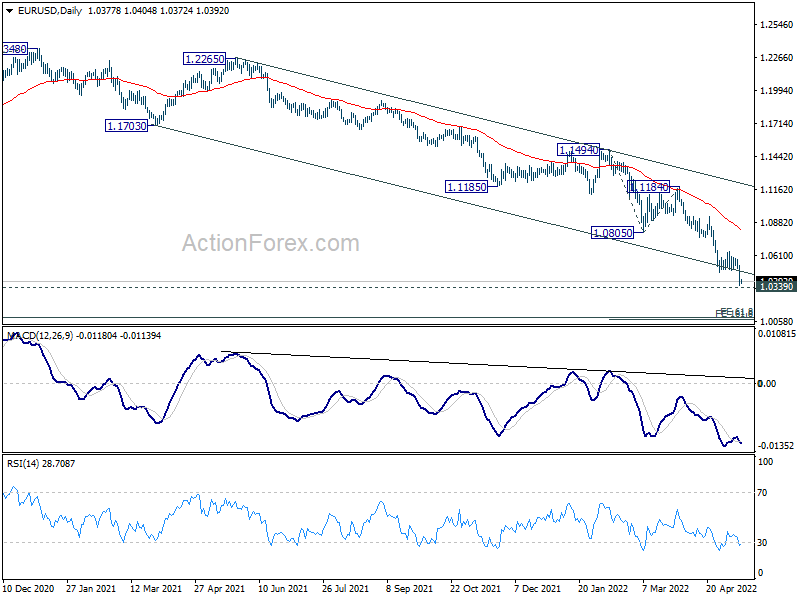
In the bigger picture, break of medium term channel support suggests downside acceleration. Current decline from 1.2348 (2021 high) is probably resuming long term down trend from 1.6039 (2008 high). Retest of 1.0339 (2017 low) low should be seen next. Decisive break there will confirm this bearish case. This will now remain the favored case as long as 1.0805 support turned resistance holds.
GBP/USD Daily Outlook
Daily Pivots: (S1) 1.2158; (P) 1.2207; (R1) 1.2248; More...
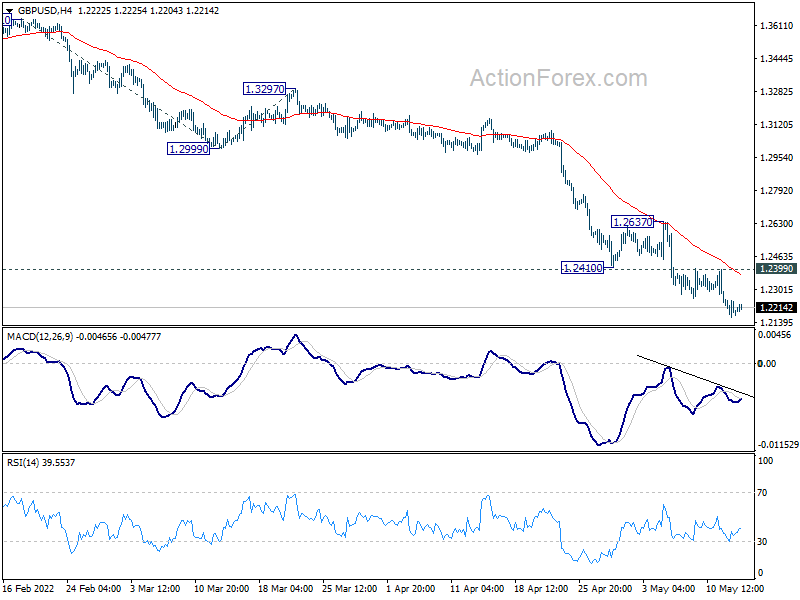
GBP/USD's decline is still in progress and intraday bias stays on the downside. Current down trend should target 200% projection of 1.3641 to 1.2999 from 1.3297 at 1.2013 next. On the upside, above 1.2399 minor resistance will turn intraday bias neutral again. But outlook will stay bearish as long as 1.2637 resistance holds.
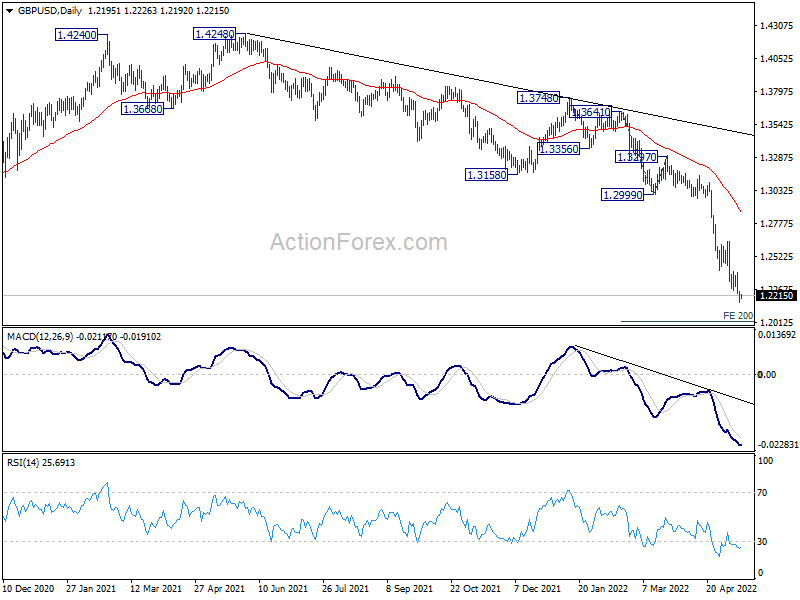
In the bigger picture, based on current momentum, fall from 1.4248 (2018 high) at least at the same degree as the rise from 1.1409 (2020 low). That is, fall from 1.4248 could be a leg inside the pattern from 1.1409, or resuming the longer term down trend. In either case, deeper decline is expected as long as 1.2999 support turned resistance holds. Next target is 1.1409 low.
USD/CHF Daily Outlook
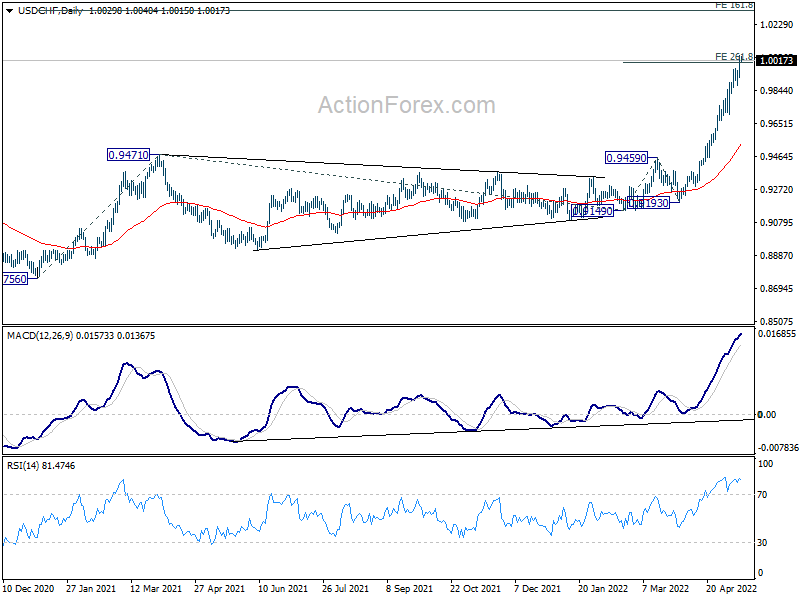
Daily Pivots: (S1) 0.9956; (P) 1.0003; (R1) 1.0076; More....
USD/CHF's rise continues today and there is no sign of topping after breaking 261.8% projection of 0.9149 to 0.9459 from 0.9193 at 1.0005. Intraday bias stays on the upside and further rally would be seen to next medium term projection level at 1.0306. On the downside, considering bearish divergence condition in 4 hour MACD, break of 0.9871 support will indicate short term topping, and turn bias to the downside for pull back.
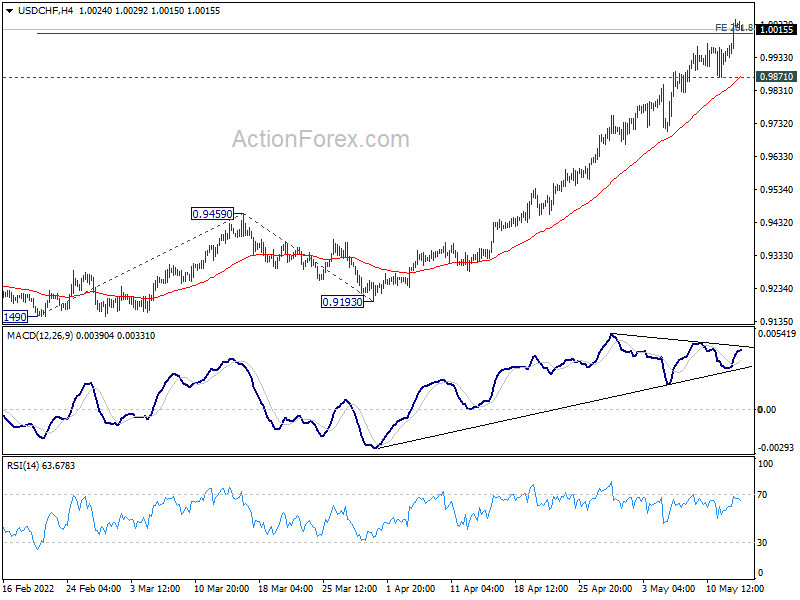
In the bigger picture, down trend from 1.0342 (2016 high) should have completed with three waves down to 0.8756 (2021 low) already. Rise from 0.8756 is likely a medium term up trend of its own. Next target is 161.8% projection of 0.8756 to 0.9471 from 0.9149 at 1.0306, which is close to 1.0342 (2016 high). This will remain the favored case as long as 0.9459 resistance turned support holds.
USD/JPY Daily Outlook
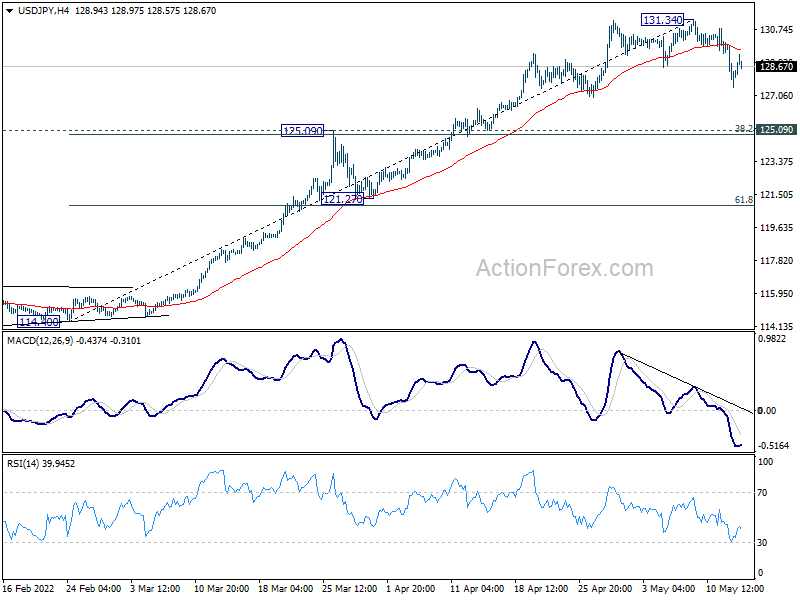
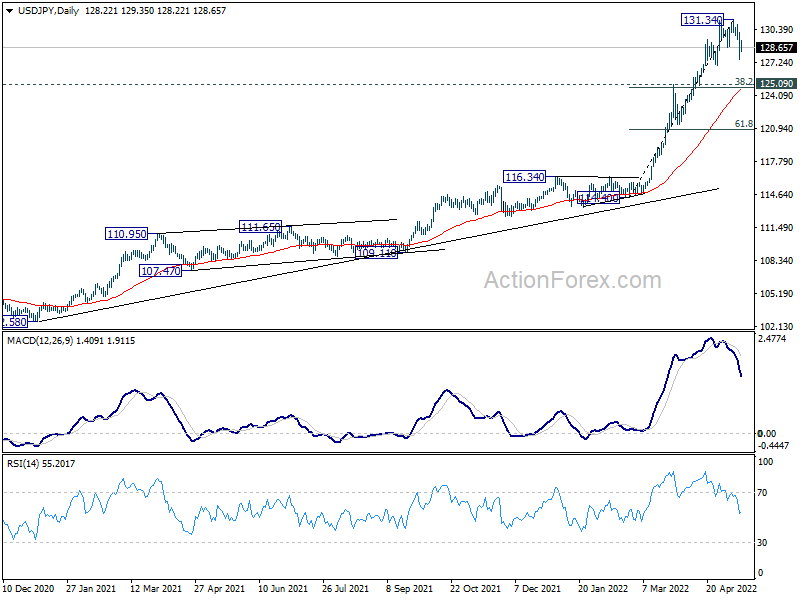
Daily Pivots: (S1) 127.21; (P) 128.64; (R1) 129.75; More...
Intraday bias in USD/JPY remains mildly on the downside at this point. Correction from 131.34 short term top would extend lower to 125.09 cluster support (38.2% retracement of 114.40 to 131.34 at 124.86), as correction to rise from 114.40. For now, risk will stay mildly on the downside as long as 131.34 resistance holds, in case of recovery.
In the bigger picture, current rally is seen as part of the long term up trend form 75.56 (2011 low). Sustained trading above 61.8% projection of 75.56 (2011 low) to 125.85 (2015 high) from 98.97 at 130.04 will pave the way to 100% projection at 149.26, which is close to 147.68 (1998 high). For now, this will remain the favored case as long as 121.27 support holds.
USD/CAD Daily Outlook
Daily Pivots: (S1) 1.2990; (P) 1.3033; (R1) 1.3090; More...
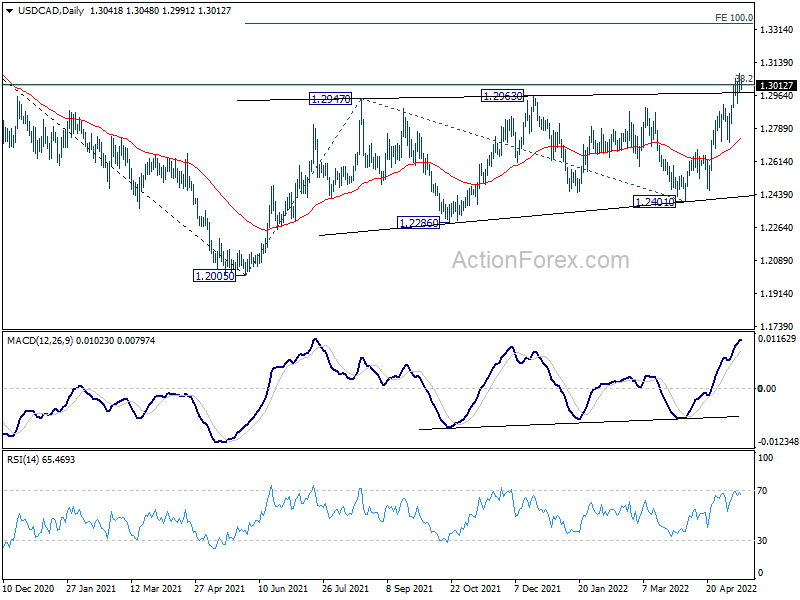
USD/CAD's rally resumed after brief consolidations and intraday bias is back on the upside. Sustained break of 1.3022 fibonacci level will carry larger bullish implications. Next target will be 100% projection of 1.2005 to 1.2947 from 1.2401 at 1.3343. On the downside, break of 1.2919 minor support will turn bias back to the downside for 1.2712 support instead.
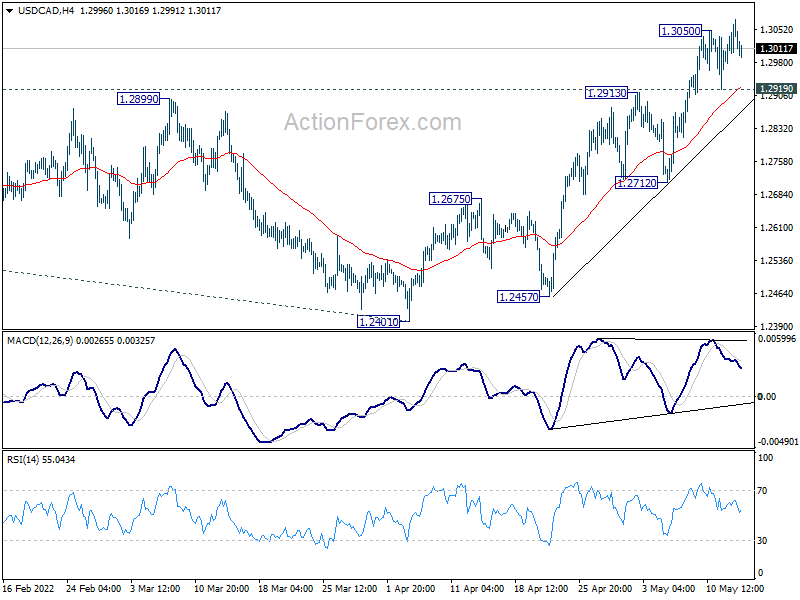
In the bigger picture, focus stays on 38.2% retracement of 1.4667 (2020 high) to 1.2005 (2021 low) at 1.3022. Sustained break there should confirm that the down trend from 1.4667 has completed after defending 1.2061 long term cluster support. Further rise would then be seen towards 61.8% retracement at 1.3650. However, rejection by 1.3022 will maintain medium term bearishness. Break of 1.2005 will resume the down trend from 1.4667 and that carries larger bearish implications too.
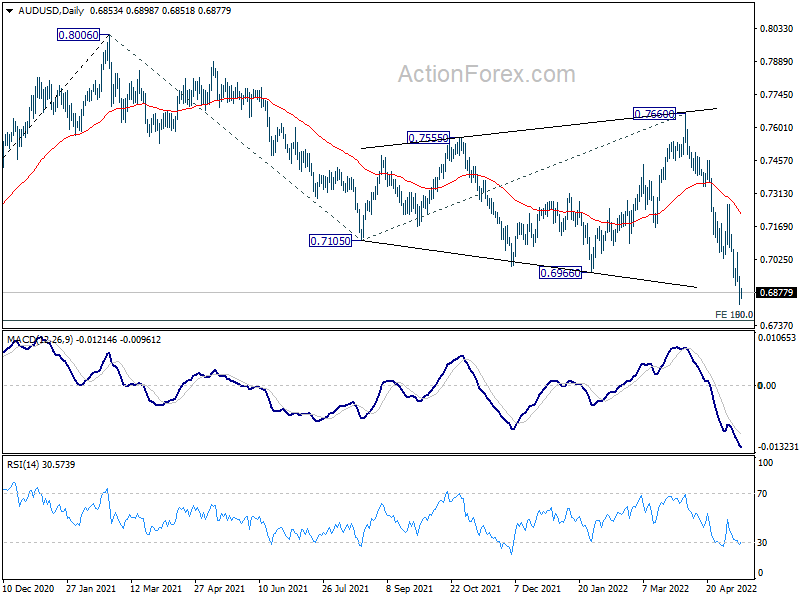
AUD/USD Daily Report
Daily Pivots: (S1) 0.6804; (P) 0.6879; (R1) 0.6928; More...
Intraday bias in AUD/USD stays on the downside for the moment. Current fall is part of the decline from 0.8006 and should target 0.6756 medium term fibonacci level next. On the upside, break of 0.7029 support turned resistance will turn intraday bias neutral again first. But outlook will remain bearish as long as 0.7265 resistance holds.
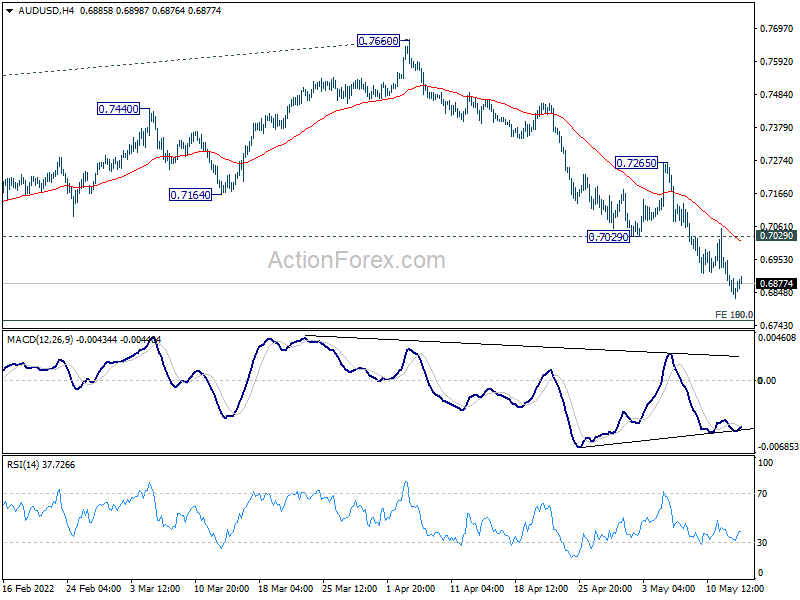
In the bigger picture, price actions from 0.8006 are seen as a corrective pattern to rise from 0.5506 (2020 low) with fall from 0.7660 as the third leg. Deeper fall should be seen to 50% retracement of 0.5506 to 0.8006 at 0.6756. This coincides with 100% projection of 0.8006 to 0.7105 from 0.7660 at 0.6760. Strong support is expected from 0.6756/60 cluster to contain downside to complete the correction. However, sustained break of 0.6756/60 would argue that AUD/USD is indeed in a medium term down trend.