

Sample Category Title
Has the Crypto Market Hit Bottom?
Bitcoin added 0.6% on Thursday, ending the day around $28.6K, a modest gain but a significant intraday win. Bitcoin managed to find support near $25K on Thursday morning, reversing a multi-day decline. Since the start of the day on Friday, the rate has moved back above $30.5K (+6.9%). This could be both the start of an extended buying wave and a trap for the bulls.
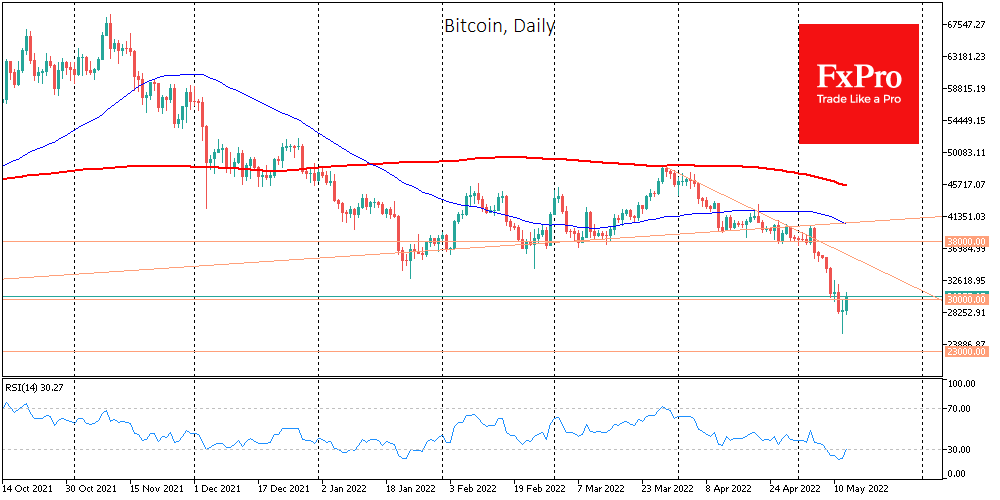
After serious oversold previous days, altcoins rose at a double-digit pace in the last 24 hours. Ethereum is adding 16%, once again above $2K. The top 10 other leading altcoins are soaring from 25% (Solana) to 41.4% (Cardano).
Total crypto market capitalisation, according to CoinMarketCap, jumped 14% overnight to $1.32 trillion. The bitcoin dominance index lost 0.3 percentage points to 44.4% due to weaker altcoins.
The cryptocurrency fear and greed index was down 2 points to 10 by Friday and remains in “extreme fear”, but it largely ignores the optimism of recent hours. Thus, the indicator’s current low levels might also attract “buy when you are scared” buyers.
Do Kwon, head of Terraform Labs, presented a recovery plan for the UST stablecoin. Against this backdrop, the cryptocurrency LUNA lost nearly 100% of its value. The Terra blockchain has halted. According to media reports, Do Kwon was previously behind Basis Cash – another failed stablecoin blockchain project.
The USDT stablecoin price tested the $0.94 level on Thursday amid market turbulence. Paolo Ardoino, technical director of issuer Tether, said the company has enough reserves to buy back all assets at a 1:1 ratio to the US dollar.
Tron founder Justin Sun saw signs of an imminent attack on the USDD algorithmic stack coin launched on the Tron network in May. Sun announced a $2 billion allocation from the TRON DAP Reserve organisation to prevent such a scenario.
USDCAD Climbs Beyond 1.30 Mark, Logs 17½-Month High
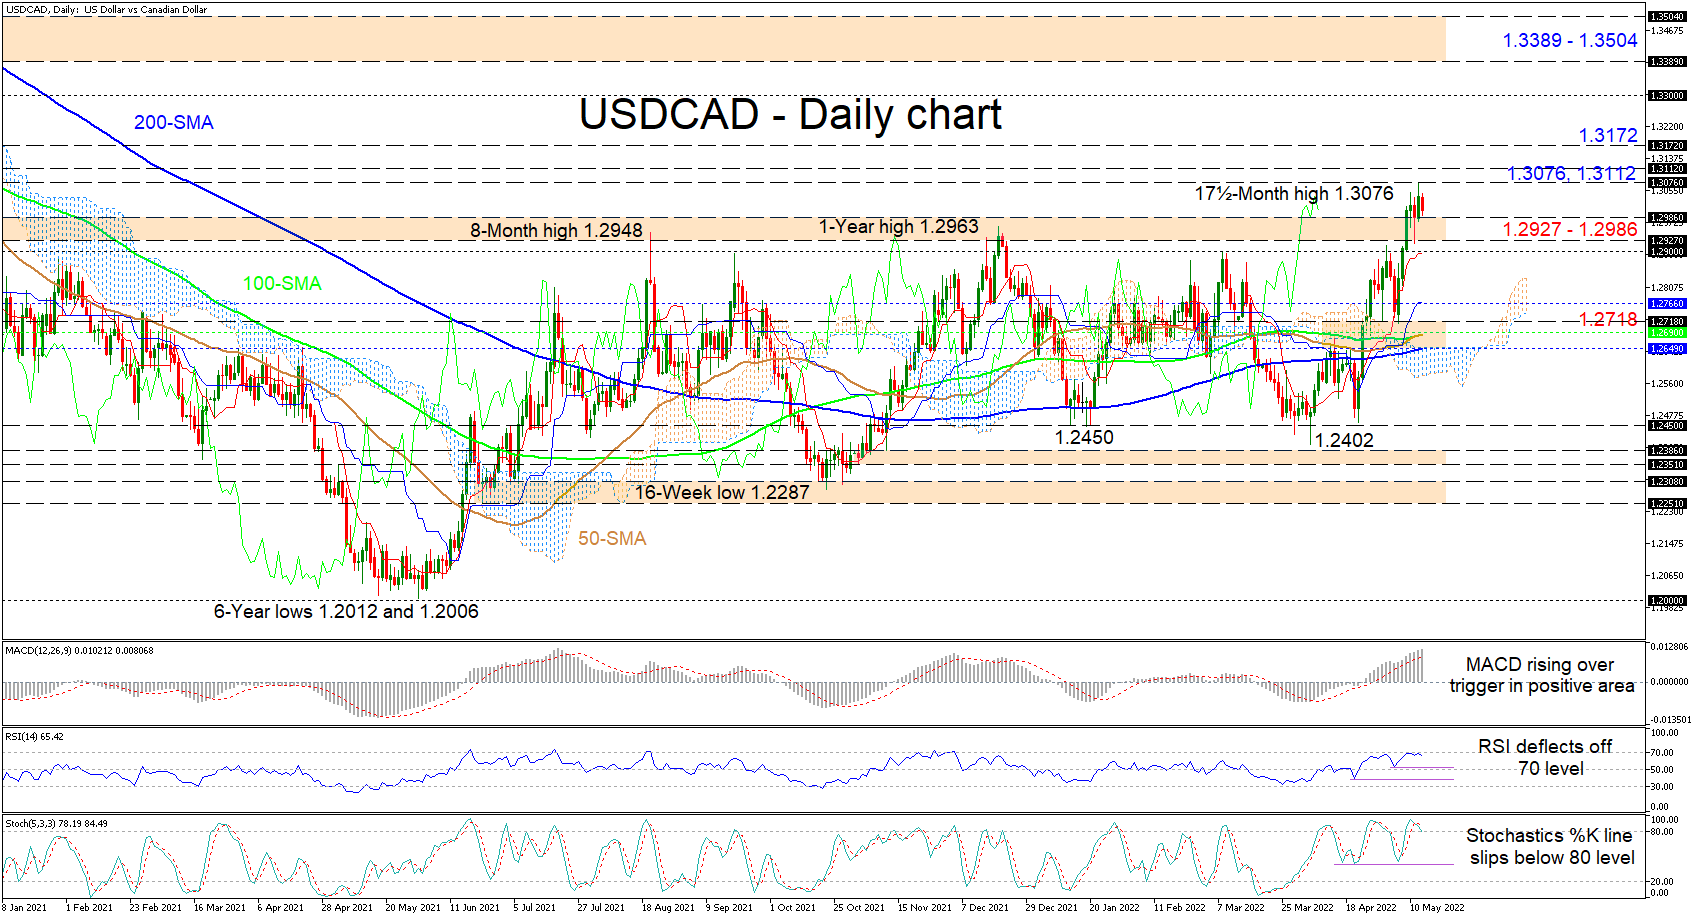
USDCAD’s fresh advances have breached the broader 1.2927-1.2986 resistance barrier that extends back to early November of 2020. The longer-term 100- and 200-day simple moving averages (SMAs) are discreetly sponsoring the upside, while the rising 50-day SMA is endorsing the recent pick up in positive impetus.
The Ichimoku lines are indicating a pause in upward drive, while the short-term oscillators are advertising conflicting messages in directional momentum. The MACD is implying that bullish forces are strengthening, meanwhile the dipping RSI and the stochastic oscillator are both hinting that buying interest has softened as the pair overstepped the 1.2927-1.2986 key resistance border.
In order to boost gains, the current dwindled positive forces would need to create a foothold off the 1.2927-1.2986 zone, which may result in buyers encountering initial resistance around the near one-and-a-half-year high of 1.3076 and the 1.3112 barrier. Another jump higher - violating the 1.3172 mid-November 2020 high - could encourage buyers to target the high around the 1.3300 handle before they challenge the 1.3389-1.3504 resistance section, which started to take shape around mid-June 2020.
Alternatively, if the ebbing in positive drive escalades and the price retreats, the 1.2927-1.2986 zone may provide some downside friction ahead of the fresh low and the 1.2900 hurdle, where the red Tenkan-sen line also happens to reside. If selling interest intensifies further, the bears could then dive for the blue Kijun-sen line at 1.2766 prior to taking a crack at a fortified support region from the 1.2718 inside swing low until the Ichimoku cloud’s upper band at 1.2649, coupled with the 200-day SMA.
Summarizing, USDCAD has overcome the critical 1.2927-1.2986 ceiling that has curbed advances since early November 2020, which is a positive for additional advances to unfold. However, if the price fails to remain north of this border, the pair could sink back into a more neutral price structure.
GBP/JPY Daily Outlook
Daily Pivots: (S1) 154.98; (P) 157.14; (R1) 158.68; More...
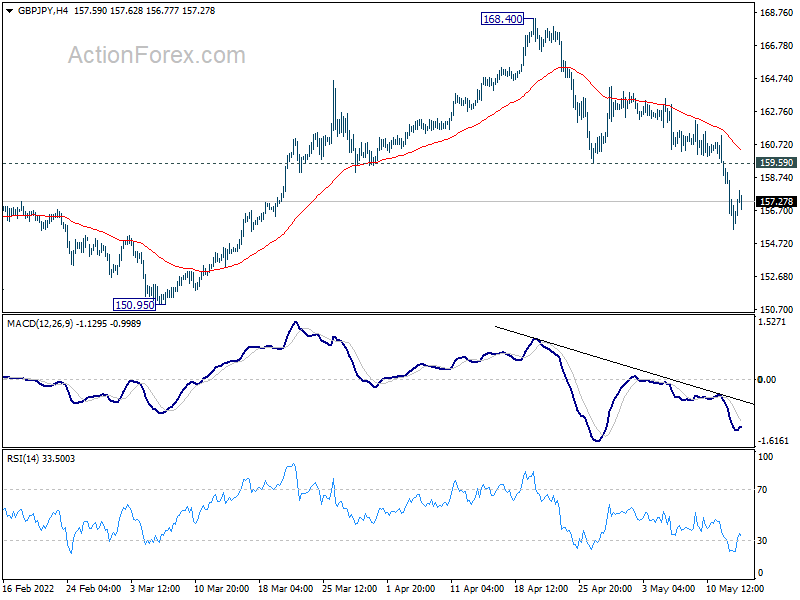
Intraday bias in GBP/JPY remains mildly on the downside for the moment. Current fall from 168.40 would target 150.95 key structural support next. For now, risk will stay on the downside as long as 159.59 support turned resistance holds in case of recovery. Nevertheless, firm break of 159.59 will turn bias back to the upside for stronger rebound.
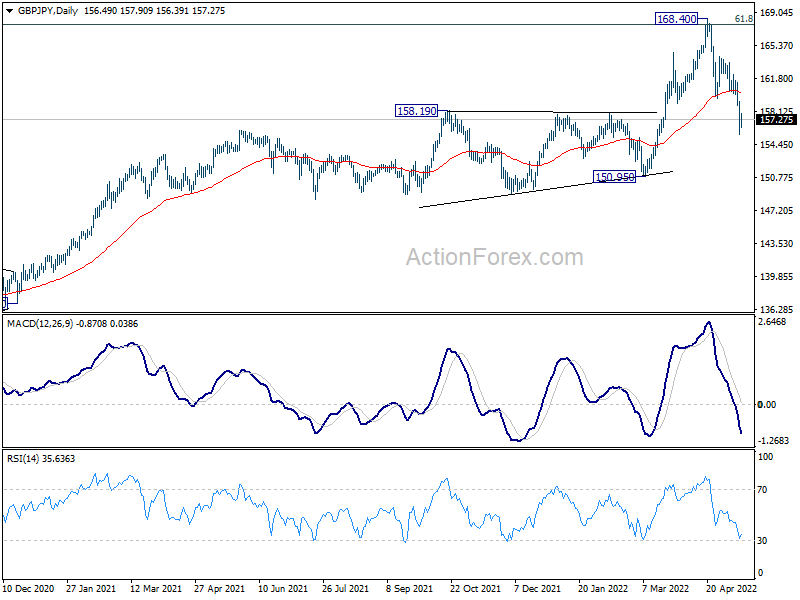
In the bigger picture, up trend from 123.94 (2020 low) is still in progress. Sustained break of 61.8% retracement of 195.86 (2015 high) to 122.75 (2016 low) at 167.93 will be a long term bullish signal, and could pave the way back to 195.86 high. This will now remain the favored case as long as 150.95 support holds, even in case of deep pull back. However, firm break of 150.95 will indicate rejection by 167.93, and bearish trend reversal.
EUR/JPY Daily Outlook
Daily Pivots: (S1) 131.66; (P) 134.20; (R1) 135.75; More....
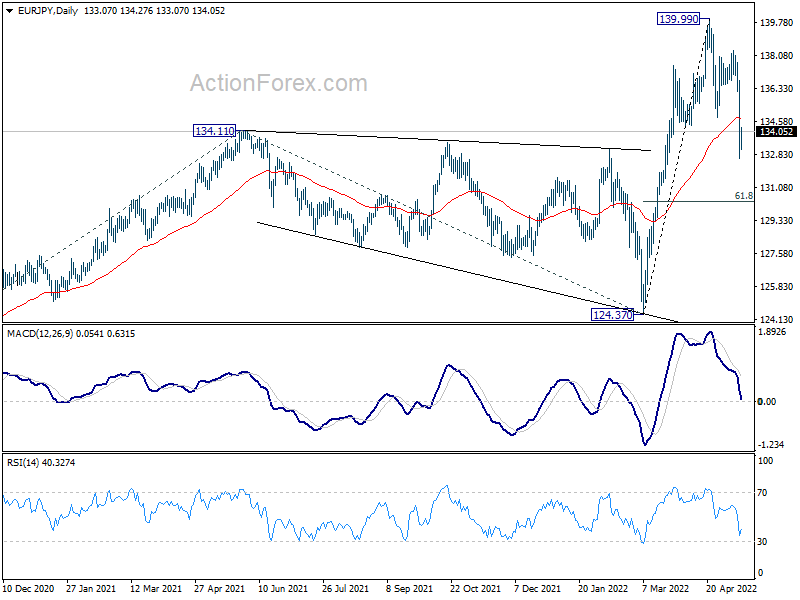
Intraday bias in EUR/JPY stays mildly on the downside. Fall from 139.99 could extend further to 61.8% retracement of 124.37 to 139.99 at 130.33. For now, risk will stay on the downside as long as 138.33 resistance holds, in case of recovery.
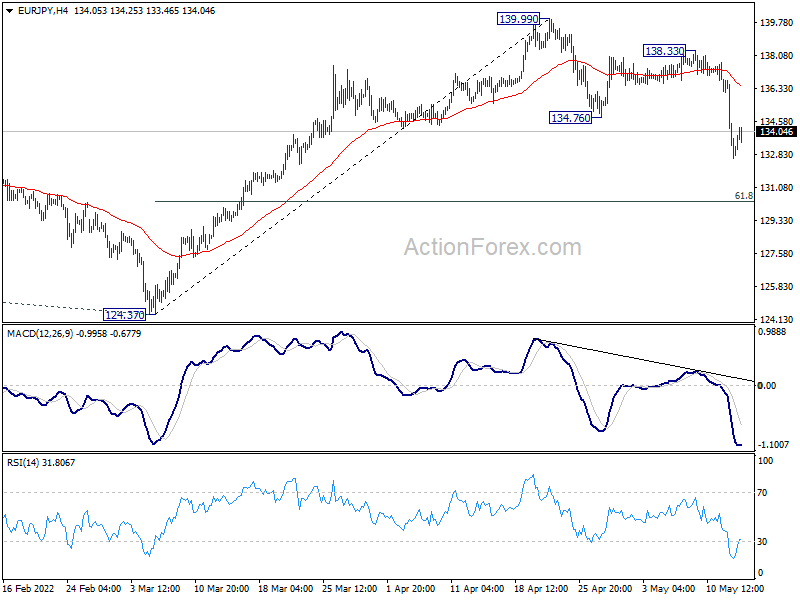
In the bigger picture, up trend from 114.42 (2020 low) is in progress. Such rise is seen as the third leg of the pattern from 109.30 (2016 low). Next target will be 100% projection of 114.42 to 134.11 from 124.37 at 144.06. In any case, outlook will now remain bullish as long as 124.37 support holds, in case of deep pull back.
EUR/GBP Daily Outlook
Daily Pivots: (S1) 0.8463; (P) 0.8541; (R1) 0.8589; More...
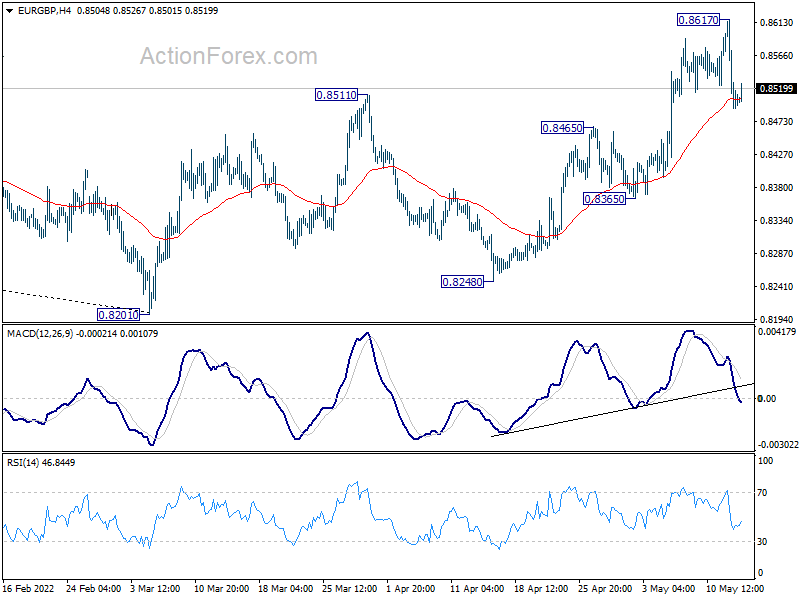
Intraday bias in EUR/GBP stays mildly on the downside for pull back to 0.8465 support turned resistance. But overall, rise from 0.8201 is still in favor to continue as long as 0.8365 support holds. Break of 0.8617 will resume such rise to 0.8697 medium term fibonacci level.
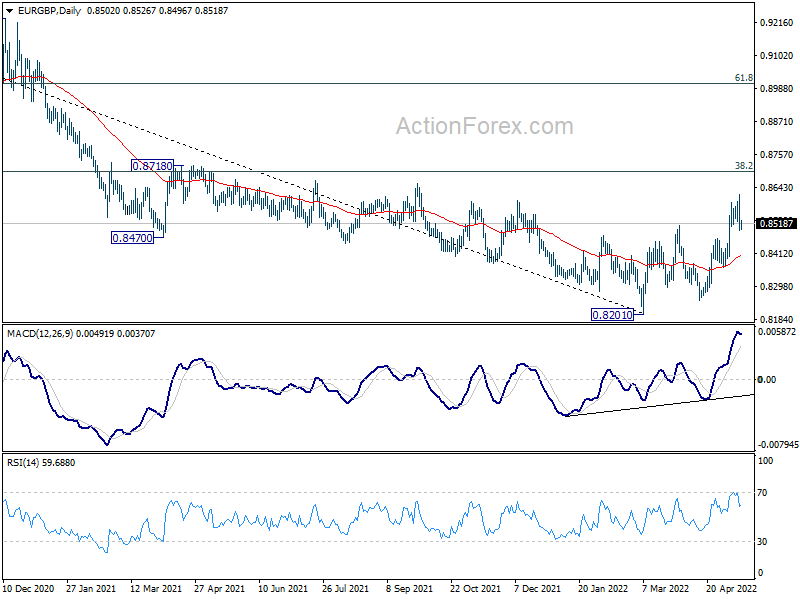
In the bigger picture, a medium term bottom could be in place at 0.8201, on bullish convergence condition in daily and weekly MACD. Rise from there could either be a correction to the down trend from 0.9499 (2020 high), or a medium term up trend itself. In either case, further rise should be seen to 38.2% retracement of 0.9499 to 0.8201 at 0.8697. Sustained break there will target 61.8% retracement at 0.9003.
EUR/AUD Daily Outlook
Daily Pivots: (S1) 1.5061; (P) 1.5170; (R1) 1.5253; More...
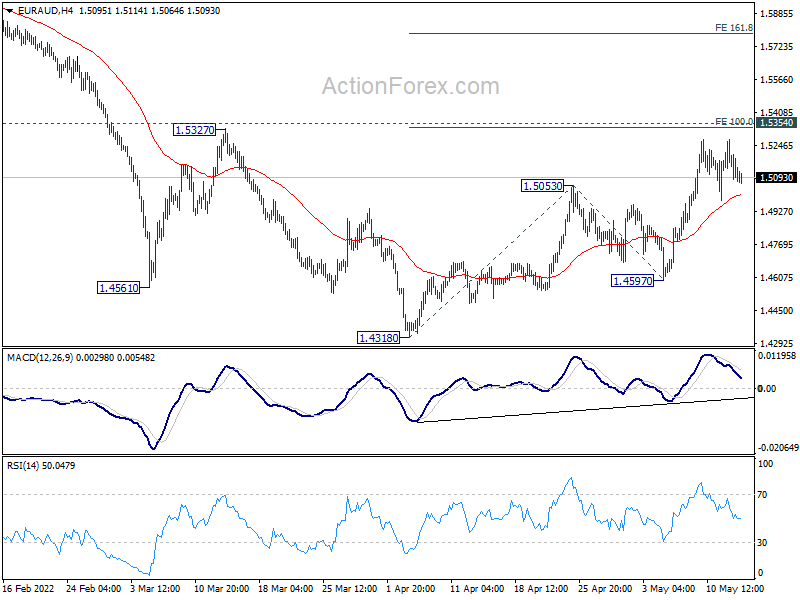
Intraday bias in EUR/AUD remains neutral for the moment, with focus on 1.5354 cluster resistance (100% projection of 1.4318 to 1.5053 from 1.4597 at 1.5332. Rejection by this level will maintain medium term bearishness for another fall through 1.4138 low at a later stage. But firm break of 1.5332/54 will argue that the larger trend is reversing. Next target is 161.8% projection at 1.5786 first.
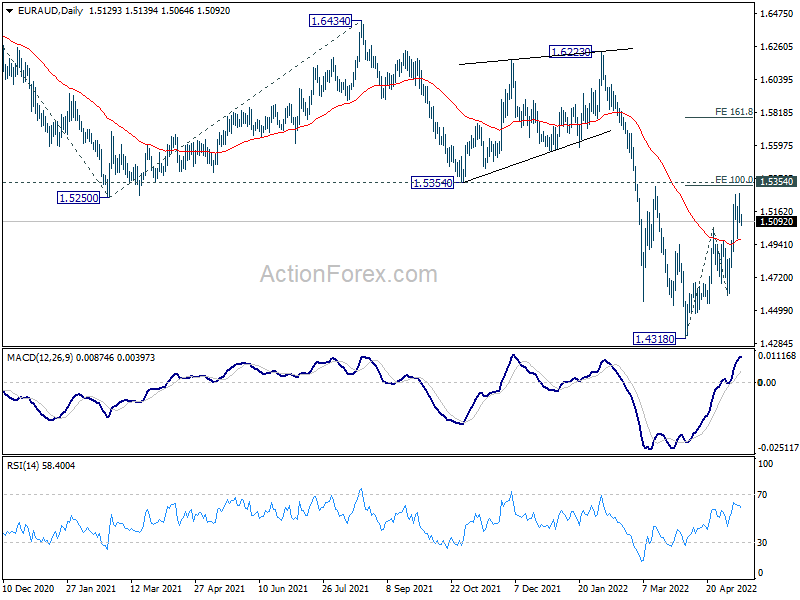
In the bigger picture, as long as 1.5354 support turned resistance holds, larger down trend form 1.9799 (2020 high) is still expected to continue. On resumption, next target is 61.8% projection of 1.9799 to 1.5250 from 1.6434 at 1.3623, which is close to 1.3624 long term support (2017 low). However, firm break of 1.5354 will indicate medium term bottoming and bring stronger rally back to 1.6434 key resistance.
EUR/CHF Daily Outlook
Daily Pivots: (S1) 1.0358; (P) 1.0418; (R1) 1.0472; More....
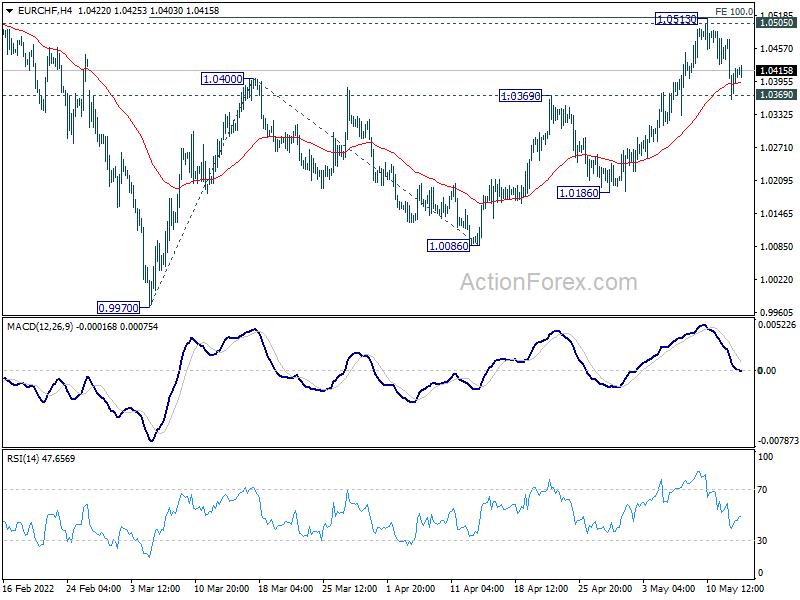
EUR/CHF recovered after drawing support from 1.0369 resistance turned support. Intraday bias remains neutral first and further rise could still be seen. On the upside sustained break of 1.0505 long term resistance will carry larger bullish implications. Next target is 161.8% projection at 1.0782. However, decisive break of 1.0369 will indicate rejection by 1.0505 and turn bias back to the downside for 1.0186 support.
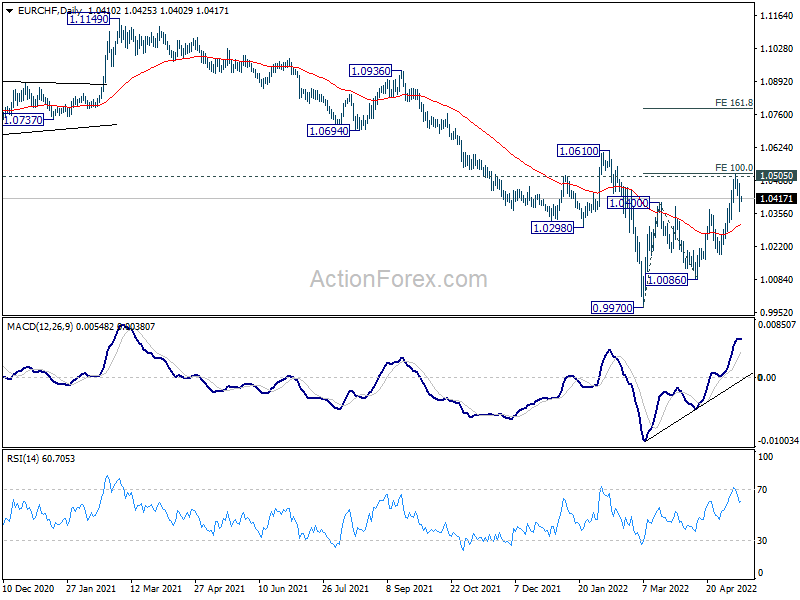
In the bigger picture, as long as 1.0505 support turned resistance (2020 low) holds, long term down trend from 1.2004 (2018 high) is expected to continue. Next target is 100% projection of 1.2004 to 1.0505 to 1.1149 at 0.9650. However, firm break of 1.0505 will suggest medium term bottoming, and bring stronger rebound towards 1.1149 structural resistance.
GBPJPY Constrained after Brutal Sell-Off
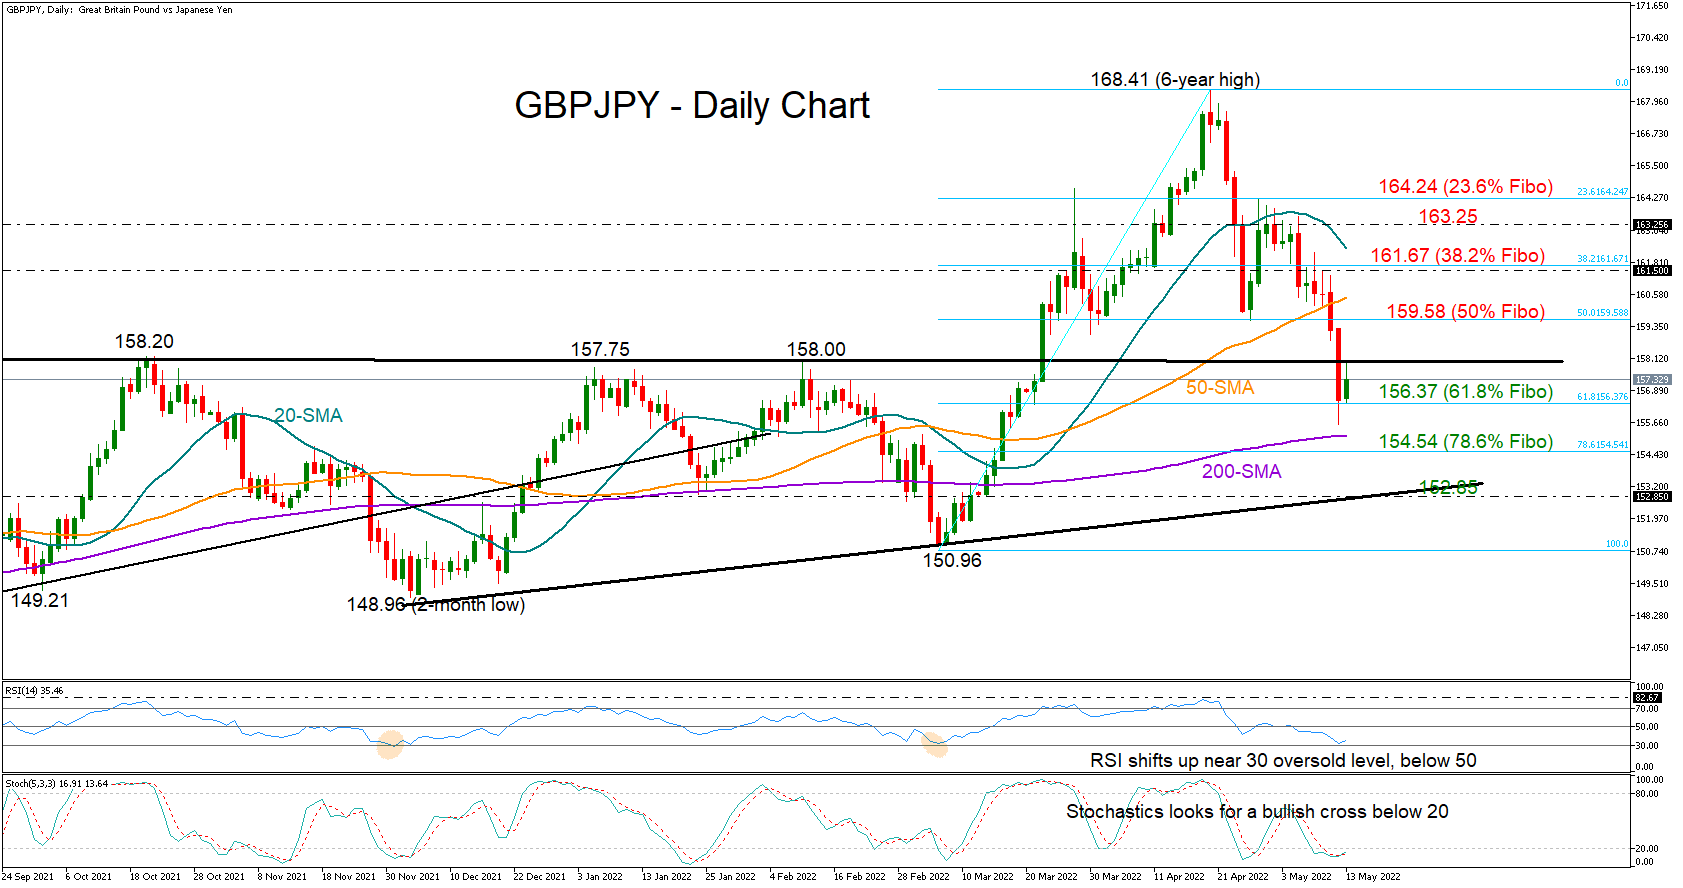
GBPJPY is trying to heal its wounds after Thursday’s brutal sell-off cut 1.6% of its value and neutralized its long-term outlook back below the key 158.00 former resistance area.
The RSI is looking for a rebound, repeating the sequence previously formed around its 30 oversold mark, while the Stochastics are also setting a bullish cross near April’s lows and below 20, raising optimism that the soft bounce off the two-month low of 155.58 may see a continuation.
That said, as long as the aforementioned indicators remain in bearish territory, negative risks will remain intact, keeping the focus on the downside and particularly on the 61.8% Fibonacci retracement of the latest upleg, which is currently buffering selling tendencies at 156.37. If that base cracks, the 200-day simple moving average (SMA) and the 78.6% Fibonacci of 154.54 could prevent an extension towards the tentative supportive trendline at 152.64.
Moving to the upside, the bulls will need to reclaim the 158.00 mark to gain fresh momentum. If that turns out to be the case, immediate resistance may develop around the 50% Fibonacci of 159.58. Another step higher could test the 38.2% Fibonacci of 161.67, where the constraining 20-day SMA is converging, before all eyes turn to the 163.25 - 164.24 zone.
Summarizing, GBPJPY is currently congested between the 158.00 resistance and the support of 156.37. Any move out of this range could direct the market accordingly.
Daily Technical Analysis
EUR/USD
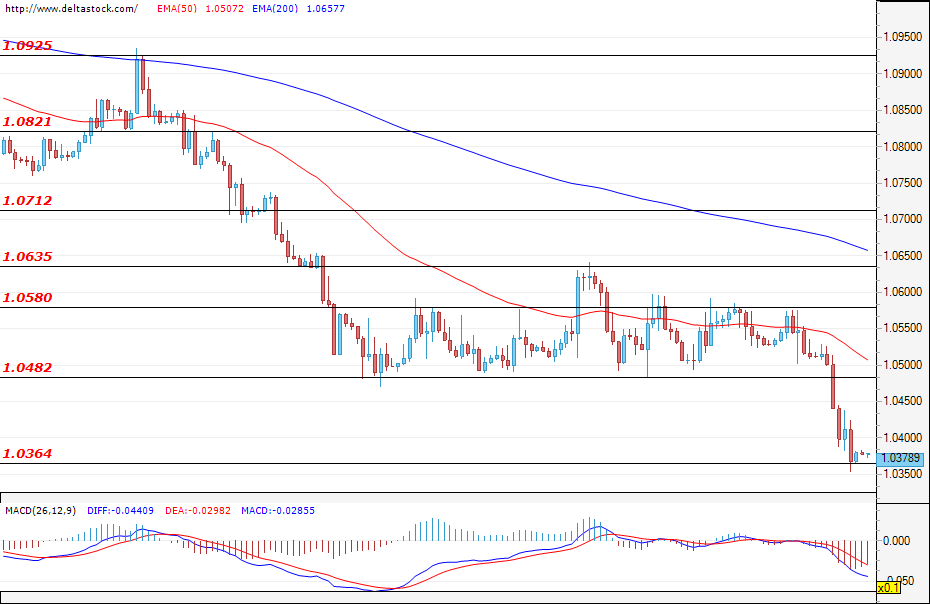
After the breach of the support at 1.0482 yesterday, the European common currency lost quite a bit of ground against the dollar and the pair tested the lower level of support at 1.0364. During the early hours of today`s trading, the pair is hovering above the mentioned zone, but if the bearish attack continues, then a successful breach of the level at 1.0364 could easily lead to new losses and strengthen the negative expectations for the future path of the EUR/USD. If the bulls enter the market, then their first target would be the zone at 1.0482, which is now acting as resistance, followed by the level at 1.0580.
USD/JPY
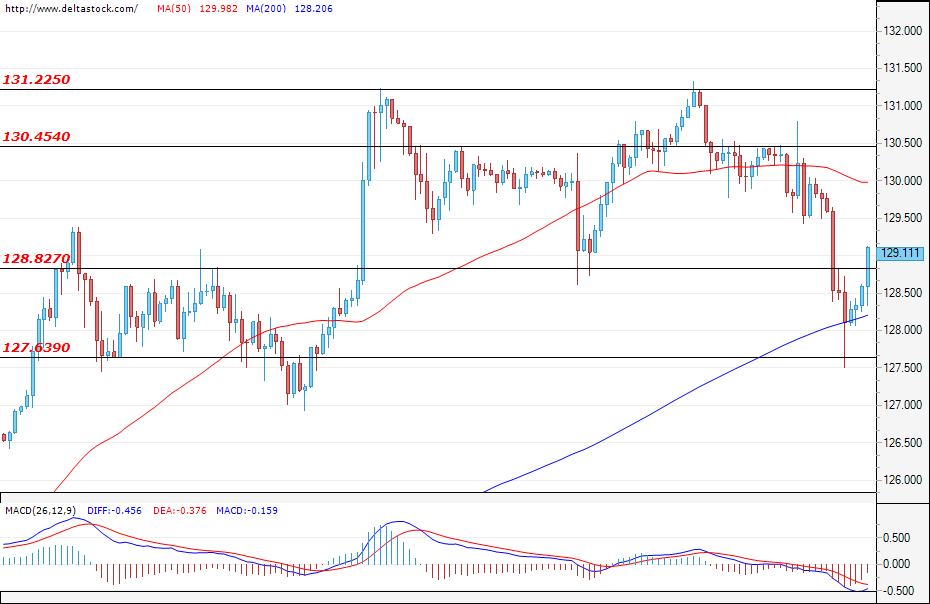
The depreciation of the dollar against the yen was limited to the support zone at 127.63 where the bulls re-entered the market. At the time of writing the analysis, the Ninja is confirming the breach of the resistance zone at 128.82, and if this proves to be the case, then an attack on the next target at 130.45 would be the most probable scenario. A successful violation here could easily continue the recovery towards the high at 131.22. If the bears take control, their first support can be found at the zone at 128.82. Only a breach of the lower target at 127.63, however, could lead to a change in the current sentiment of the market participants.
GBP/USD
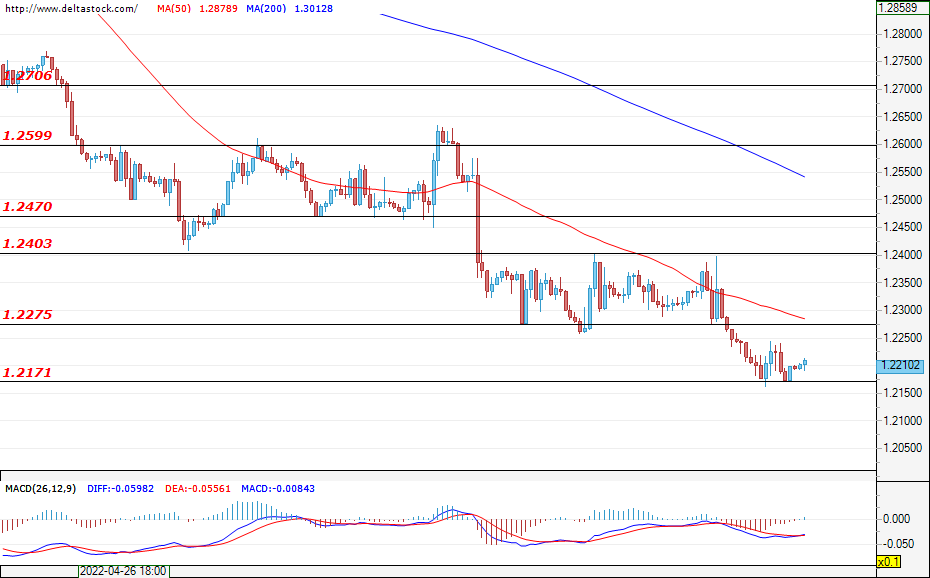
The British pound continued to lose ground against the U.S. dollar, and during the early hours of today`s trading, the Cable is consolidating above the important support coming from the higher time frames – the zone at 1.2171. A breach for the bears could continue the depreciation of the sterling against the greenback and could easily head the price towards the levels from May 2020 at around 1.2120. If the bearish momentum fades, then the bulls could lead the pair for a test of the zone at 1.2275, followed by the upper target at 1.2403.
EUGERMANY40
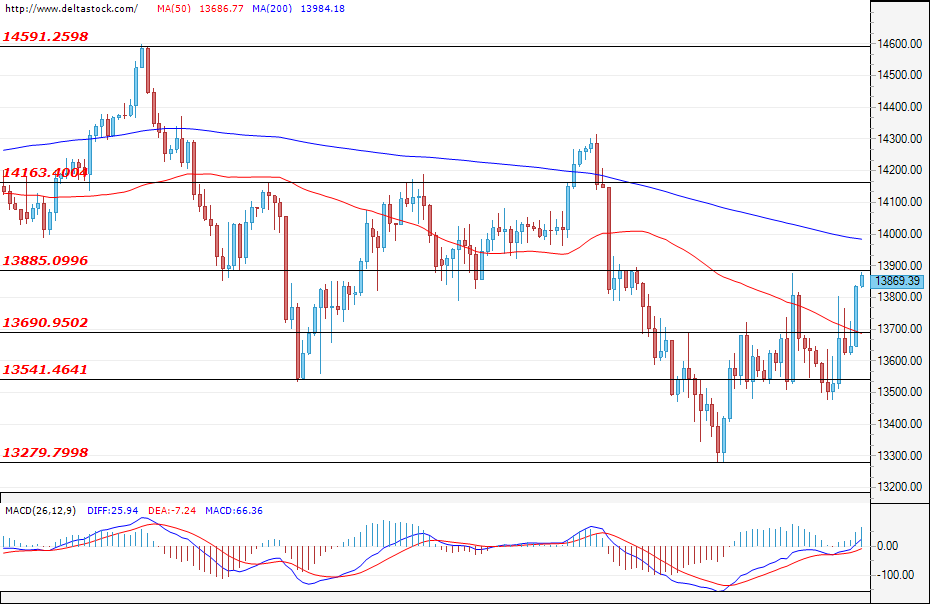
The German index regained some of its recent losses, and at the time of writing, it is headed for a test of the important resistance zone at 13885. A successful violation for the bulls could easily continue the recovery towards the next level at 14163, where a breach could strengthen the positive expectations for the future path of the index. If the mentioned zone at 13885 withholds the bullish attack, however, then the bears could attempt to violate the first support at 13690, followed by the lower target at 13541.
US30
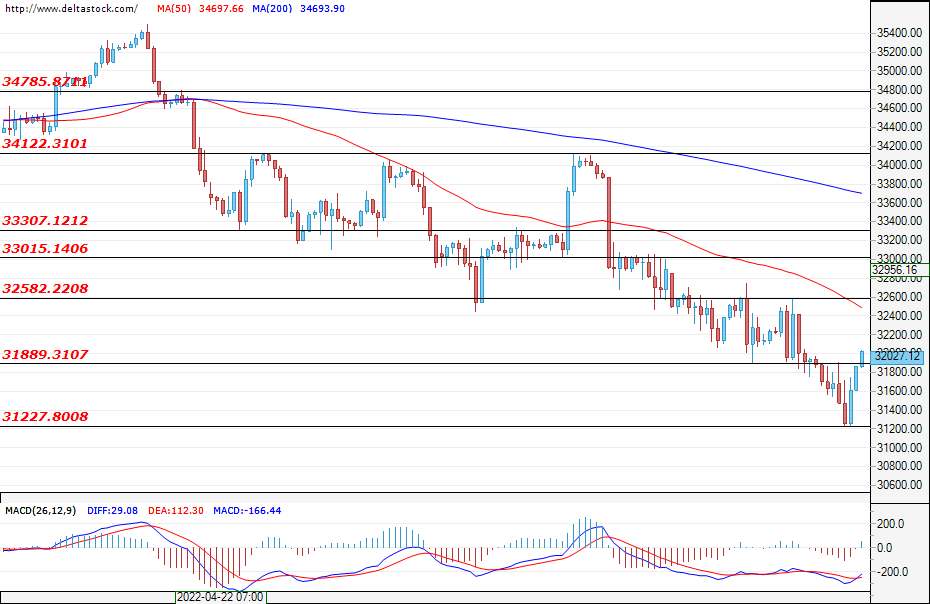
Just like the other indices around the world, the US30 appreciated, and during the early hours of today`s trading, the price is holding positions above the zone at 31889. If the bulls continue to prevail, then a test of the upper target at 32582 is a highly probable scenario. Only a violation of the resistance at 33015, however, followed by a breach of the zone at 33307, could strengthen the positive expectations and could lead to a more sustained rally and an attack on the major resistance at 34122. If the bears re-enter the market, then a new successful attempt at breaching the support at 31227 could define the current move as corrective and could deepen the decline towards the zone from January 2021 at around 31000.
Note the Improved Sentiment During Asian Dealings But It’s Unconvincing
Markets
The fall-out from yesterday’s risk-off session was most apparent on core bond yields and the euro. The former declined 3 (30y) to 7.8 (2y) bps in the US. Bunds outperformed strongly, shedding more than 14 bps in the middle segment of the curve.
There was a striking difference though: the US decline was driven by inflation expectations whereas real yields were at work in Europe/Germany. This hammered the common currency vs an almighty dollar.
EUR/USD fell almost 2 big figures intraday. The close at 1.038 brings the 2017 low of 1.0341 awfully close. DXY finally took out the 104 barrier (104.85). It thus already surpassed the parallel 2017 high to finish at the strongest level in almost two decades.
The Japanese yen was the only one able to stand up against USD supremacy. USD/JPY eased to 128.34. Against the euro, well … EUR/JPY lost 3.5 big figures in the biggest one-day slide since 2016. The pair closed at 133.22.
Even sterling eked out gains vs the euro. EUR/GBP rose above 0.86 following slightly weaker-than-expected UK Q1 GDP numbers but that move quickly reversed. The couple finished in the low 0.85 area.
On other markets, European equities cut their losses to just 1% while WS ended mixed. Oil prices recovered from early weakness to end flat (Brent $107.45/b). The likes of wheat soared 6% in a sudden surge during US dealings. Stocks in the Asian region lick their wounds after some rough days. Gains mount to 2% (Japan, Hong Kong) and more. Equity futures indicate a 1% open in the green for Europe and the US. Core bonds take a breather after an immense surge. US yields add 2.4-3.3 bps. The Japanese yen is this morning’s biggest loser, followed by the USD. U. of Michigan consumer confidence for April is due in the US today. A retreat from 65.2 to 64 is expected. Lingering inflation worries keep confidence near levels last seen in 2011. Overall sentiment will remain the key driver for markets though.
We note the improved sentiment during Asian dealings but it’s unconvincing. Equity upticks lately are more an opportunity to sell rather than the start of a turnaround. We would also warn against reading too much in the <4 bps increase in US yields this morning. This week brought growth uncertainty to the fore and it may prove a sticky trading theme.
It is too soon to call off the core bond yield consolidation/correction. As things currently stand, the weekly US 10y yield will end with a bearish engulfer. EUR/USD remains in dire straits. A weekly close below 1.04 spells trouble and paves the way for a return to 1.0341. The technical stars for DXY are aligned for a return to 109.14 (76.4% recovery of the 2001-2008 decline) after pushing through 104 yesterday.
News Headlines
The Bank of Mexico yesterday as expected raised its policy rate by from 6.50% to 7.0%. The Bank kept a hawkish tone, indicating more forceful measures to achieve the inflation target. One of the five board members already voted for the policy rate to be raised by 75 bps. Core and headline inflation in Mexico in April reached 7.22% and 7.68% respectively, with headline inflation reaching the highest level since 2001. In its inflation forecast, the Bank raised the path for both core and headline inflation through 2022 and 2023, but still expects (core) inflation to return to the 3.0% target in 2024. The next meeting of the Bank of Mexico is scheduled for June 23. In a first reaction, the gains in the peso were modest. This morning, the peso gains modestly to trade near USD/MXN 20.20. Inflation in India in April accelerated faster than expected from 6.95% to 7.79 Y/Y%. Price rises in April were broad based. Costs for fuel and light rose 3.11% M/M and 10.80% Y/Y. Food prices, which are about half of the basket, jumped 1.56% M/M and 8.38% Y/Y. The Indian rupee trading near record low levels (against the dollar) worsens inflationary pressures. The Reserve bank of India raised its policy rate from 4.0% to 4.40 at an unscheduled meeting on May 4. The RBI recently also intervened in the currency market to try to slow the decline of the rupee. The next policy meeting of the RBI is scheduled at 8 June. The RBI’s upper tolerance band for inflation is 6.0%. Trading at USD/INR 77.40, the rupee still holds near record low levels.