Sample Category Title
More Woes ahead for Euro?
The euro is down slightly on Monday, as EUR/USD trades at the key 1.0800 line in North America. With German and French markets closed for Easter Monday, it’s likely to be a quiet day for the euro.
Euro struggling at 2-year low
The euro continues to lose ground, and last week EUR/USD tested a multi-decade support line at 1.0800. If the euro closes below this level, it would be a significantly bearish signal, with 1.06 the next major support level. April has been rough for the euro, which has lost 2.34%. There is plenty not to like about the euro right now, with the Ukraine war casting its shadow on Western Europe and last week’s ECB meeting which disappointed investors.
At the meeting, the central bank essentially gave the market more of the same, maintaining monetary policy and confirming its plan to wind up bond purchases in the third quarter. ECB President Lagarde didn’t provide any hints about hiking rates and moving towards normalisation. What investors see is an ECB that is hesitant to provide any guidance, perhaps wanting to wait for additional economic data. In response, the markets lowered the likelihood of a July rate to 50% and sent the euro lower.
With the Fed in a hawkish mood and the markets expecting a super-size rate hike of 0.50% in May, US Treasury yields are moving higher. Earlier today, the 10-year yield hit 2.87% earlier on Monday, a 3-year high. A further widening of the Euro/US rate differential will push the euro even lower.
The Fed is scrambling to fend off spiralling inflation, which hit 8.5% in March, a 40-year high. With investors looking for clues about how tight the Fed plans to go, comments from senior Fed officials will be carefully scrutinized and could be market-movers. Later today, Fed President James Bullard, one of the most hawkish FOMC members who favours aggressive action from the central bank, will deliver public remarks, and the markets will be all ears.
EUR/USD Technical
- 1.0836 is a weak resistance line. Above there is resistance at 1.0913
- There is support at 1.0738 and 1.0661
US Gas Overbought
Gas prices on the NYMEX are adding for the 11th trading session of the last 12, renewing their highs since October 2008.
US gas exchange prices have risen by a third since the beginning of the month and more than doubled since the beginning of the year in response to a surge in demand in Europe and rising oil prices. Companies in Europe and Asia are set to cut their purchases of Russian energy as fast as possible, pushing prices up.
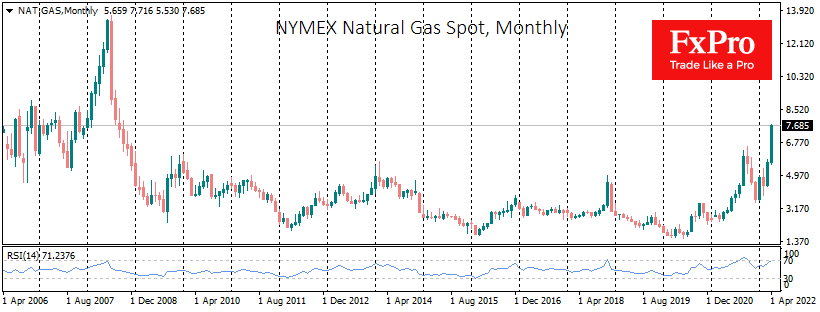
While the fundamentals are tilting toward later growth, technical analysis increasingly points to overbought conditions, so the likelihood of an imminent correction.
In the monthly candlestick chart, the RSI is entering overbought territory (>70), which it has done only six times in the past 20 years. In all cases, prices declined sharply in the following month, or we even saw a fundamental long-term reversal. Thus, it is likely that we could see a bear attack by the end of this month.
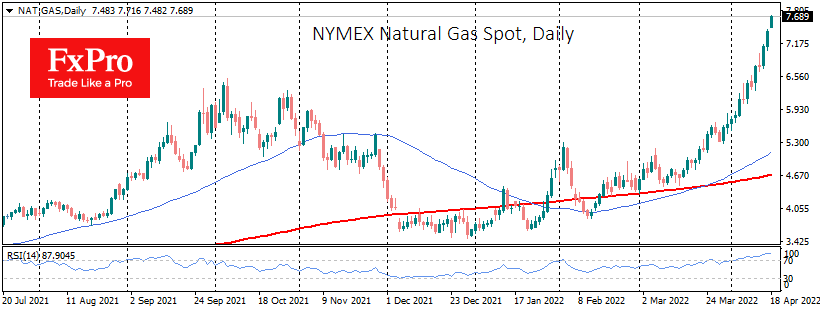
On the daily charts, the RSI has risen to 88. The last time it was higher was in 2018 briefly, which was also near price peaks.
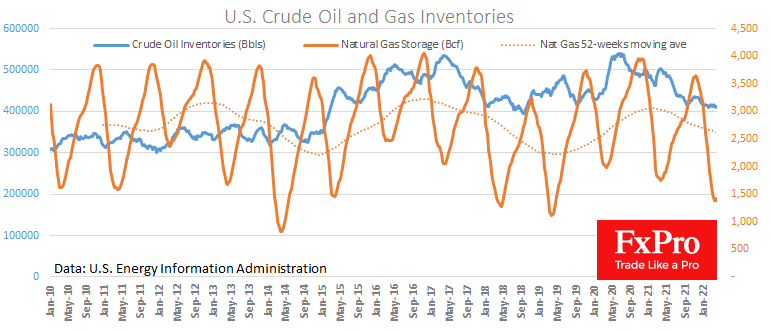
The price frenzy was also fuelled by news of falling oil and gas stocks. However, seasonality is strong in gas, and inventories reach their lowest just in the first days of April. We saw a rise last week, marking the first signs of a trend reversal.
However, in the longer term, the current gas price situation lays the foundations for a new gas renaissance in the USA, and it should lead to a recovery in production rather than a price hike.
EURUSD – Greenback Remains at 2-Year Highs
EUR/USD is still looking rather weak. On Monday 18 April, the major currency pair is trading at 1.0799, but investors aren’t too active due to the Easter holidays in the Catholic countries.
Last Thursday, EUR/USD dropped to its 2-year lows at 1.0757 amid global risk aversion. Another factor that failed the European Currency is the ECB’s unreadiness to tighten its monetary policy. In contrast to other global central banks, the ECB is obviously losing due to its unwillingness to fight the boosting CPI using available monetary tools.
At the same time, market players are preparing for the US Fed May meeting where the regulator is expected to raise the benchmark interest rate by at least 50 basis points as a response to the inflation upsurge.
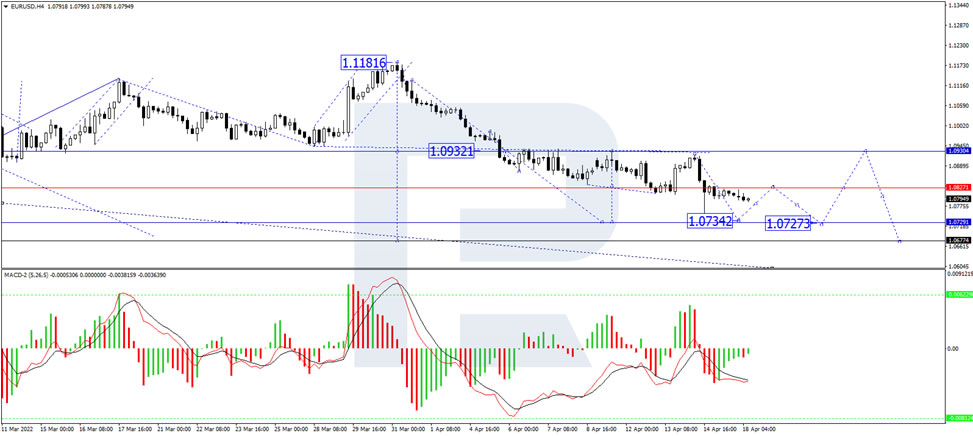
In the H4 chart, EUR/USD continues to fall towards 1.0735. Later, the market may correct to test 1.0828 from below and then form one more descending wave with the target at 1.0727. From the technical point of view, this scenario is confirmed by MACD Oscillator: its signal line is moving below 0 and may continue falling to update the lows.
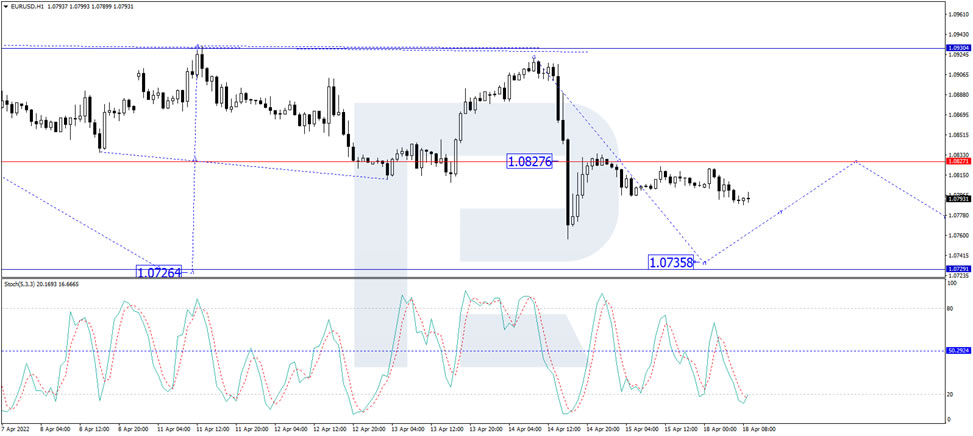
As we can see in the H1 chart, after completing the correction at 1.0828, EUR/USD is expected to resume falling towards 1.0736 and then start a new correction to return to 1.0828. Later, the market may resume trading downwards with the short-term target at 1.0727. From the technical point of view, this idea is confirmed by the Stochastic Oscillator: after reaching 20, its signal line may resume moving towards 50 and then start a new decline to return to 20.
US 500 Index Extends its Retreat Below 50-SMA
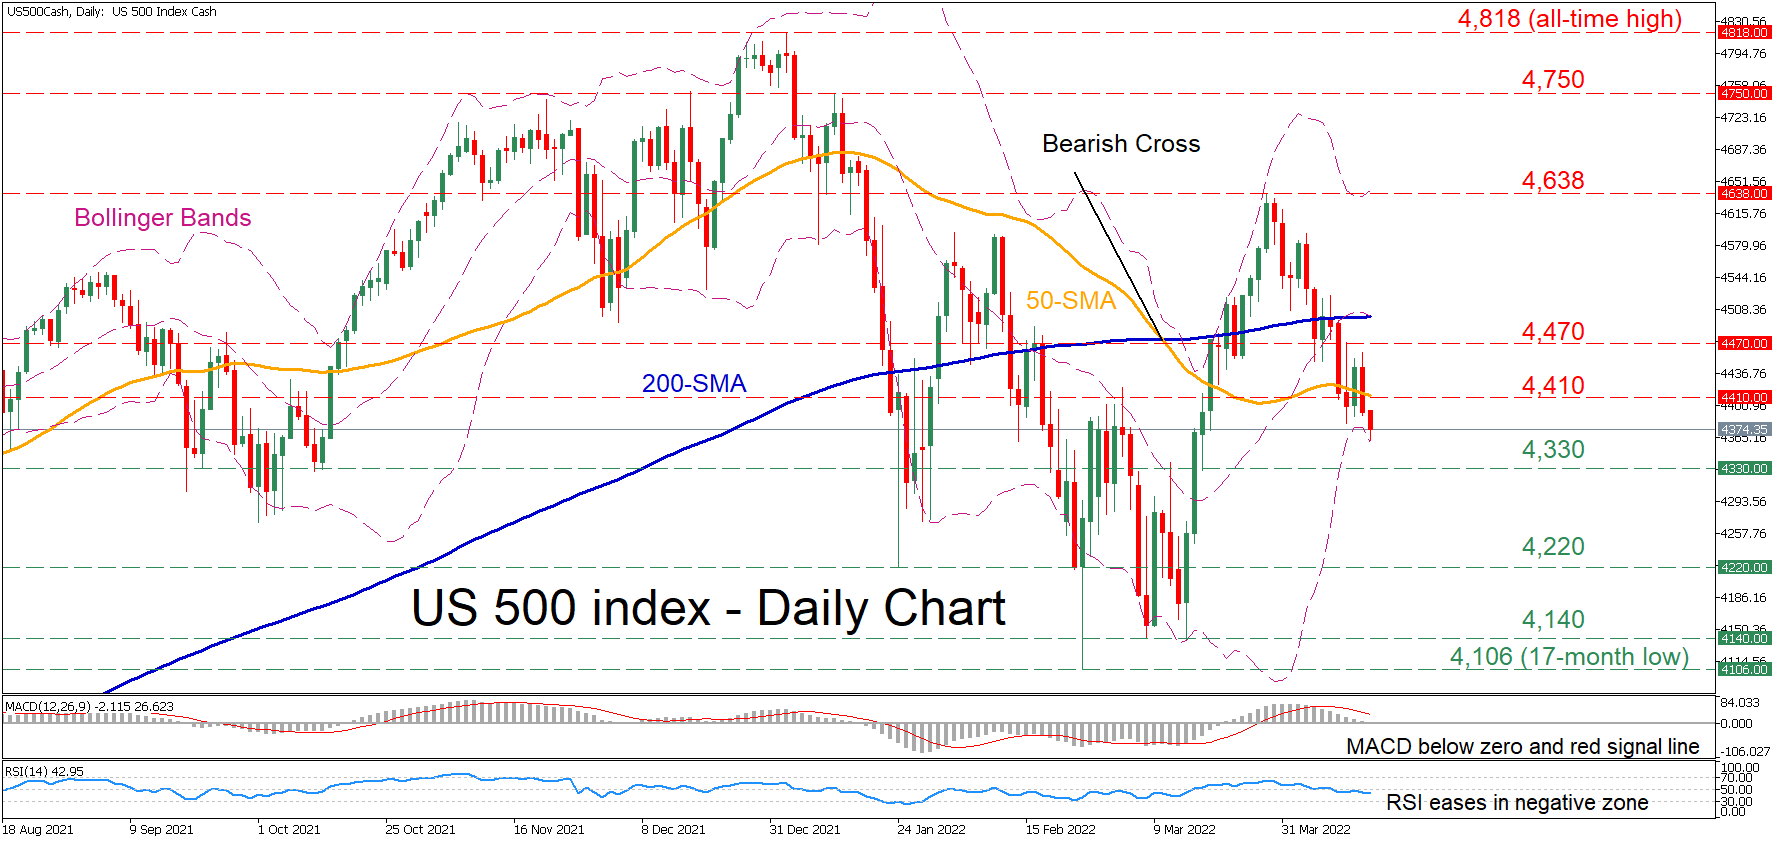
The US 500 stock index (cash) has been inching lower after peaking at 4,638 in mid-March, generating a clear structure of lower highs and lower lows. Although the price decline has currently paused at the lower Bollinger band, the technical picture seems to be deteriorating for the index.
The momentum indicators suggest that selling interest has intensified. The MACD histogram has dipped below both zero and its red signal line, while the RSI is hovering beneath its 50-neutral threshold.
In the negative scenario, bearish actions could send the price to test the 4,330 barrier. Further downside moves could then cease at the January low of 4,220 before the price descends towards the 4,140 region, which rejected price declines twice in March. A violation of the latter could pave the way for the 17-month low of 4,106.
Alternatively, should buyers re-emerge and regain the upper hand, the 50-day simple moving average (SMA), currently at 4,410, could be the initial resistance point for the index. If the price crosses above this region, the bulls may target the 4,470 obstacle before the March high of 4,638 appears on the radar. Conquering this barricade, the spotlight could turn to the 4,750 hurdle.
Overall, the resumption of the US 500 index’s recent decline appears to be the most likely scenario as near-term risks are tilted to the downside. For the bearish tone to alter, the price needs to jump above the 4,638 ceiling.
Australian Dollar at 4-Week Low
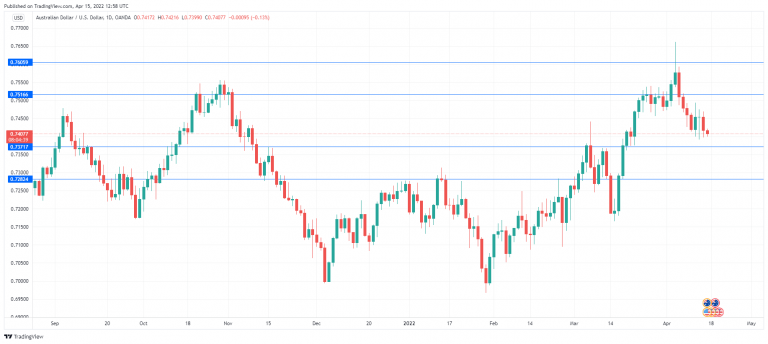
The Australian dollar remains under pressure, as AUD/USD is in negative territory at the start of the week, trading at 0.7367 in Europe. The currency has eked out just one winning daily session in the past eight and is trading at 4-week lows.
Fed, China weighing on Aussie
The Australian dollar can’t seem to buy a break, as the currency fell on Friday and is down today, even with Australian markets closed for Easter Friday and Monday. The main drivers behind the Aussie’s slide are the Fed’s hawkish stance and growth concerns over China.
The Federal Reserve started its rate-tightening cycle with a 0.25% hike in March but there are growing expectations that the Fed will implement one or more oversize hikes of 0.50% in order to contain red-hot inflation. For the May meeting, CME’s FedWatch has pegged the probability of a 0.50% rate increase at 91%. This has powered US Treasury yields higher, with the 10-year yield rising to 2.87% earlier on Monday, a 3-year high. The US dollar has followed suit, putting more pressure on the Australian currency.
In China, GDP for Q1 rose 4.8%, beating the consensus of 4.50%. Still, this is much slower growth than we’re used to seeing from the Asian giant. The economy has been dampened by the battered property sector, and harsh Covid regulations. Chinese regulators have promised relief for the property market, but with developers continuing to miss their bond payments, we’re unlikely to see much improvement.
China’s zero-policy for Covid has made the headlines due to the hardships residents are encountering in Shanghai, but in truth there are hundreds of millions of people in full or partial lockdown. The resulting downturn in economic activity could well have a global effect, with the disruption to supply chains. China is Australia’s largest trading partner, and the Australian dollar is sensitive to economic developments in China.
AUD/USD Technical
- AUD/USD faces resistance at 0.7427 and 0.7462
- There is weak support at 0.7359. Close by, there is support at 0.7324
Robust Renminbi Despite Falling Stocks & Rising Dollar
The Easter holiday in Europe and a lack of scheduled publications in the US ensure a quiet trading session this Monday. Only a batch of data from China provides some volatility.
Chinese stocks were under moderate pressure on Monday, and the Chinese renminbi has changed little since the start of the day. Investors are concerned that the People’s Bank of China did not ease its monetary policy on Friday or Monday, as many expected. In addition, retail activity is declining – a worrying signal of the impact of lockdowns.
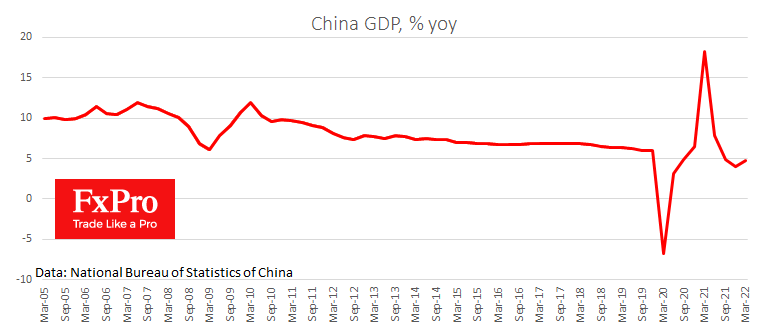
According to the released statistics package, the economy added 1.3% in the first quarter and is 4.8% higher than a year ago. This data is noticeably better than forecasts which expected 0.6% and 4.2%, respectively.
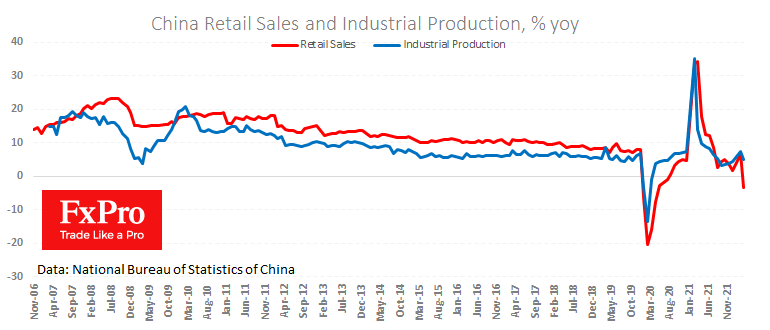
Industrial production added 5% in March compared to the same month a year earlier, better than the 4.0% expected. However, the 3.5% y/y drop in retail sales in response to last month’s tight lockdowns caught our attention more. To a large extent, they persisted or even intensified in some regions in the first half of April.
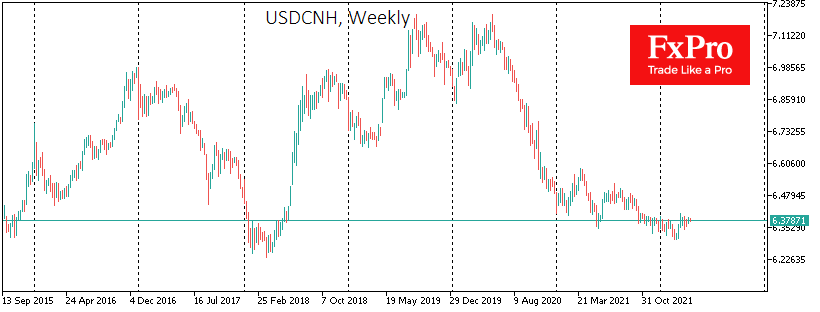
At the same time, the resilience of the Chinese renminbi cannot be overlooked. In no small measure, its ability to withstand a strengthening dollar is due to its tighter monetary policy. China seems to be paying more attention to the dynamics of the currency and economic indicators, disregarding the stock market’s weakness.
Key equity indices – China A50, Hang Seng, China H-shar – are now below pre-pandemic levels, in stark contrast to the 8.5% rise in the Chinese yuan against the dollar near the bottom of the last six and a half years. The ability of the renminbi to withstand a rising dollar environment is a demonstration of the strength of the Chinese currency.
Should the dollar trend reverse and retreat from its highs, we could see a serious yuan rally from the current 6.38 with a potential renewal of the 2018 USDCNH lows at 6.25 or even 2015 when the pair traded below 6.20.
Bitcoin’s Breaking Support
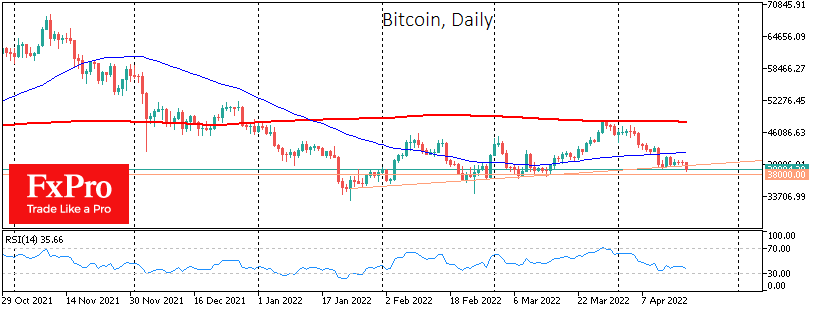
Bitcoin declined by 5.7%, ending the week at around $40,300. Ethereum lost 6.6%, while other leading altcoins in the top 10 fell from 2.9% (Binance Coin) to 17% (Terra). The exception was XRP (+0.8%).
Monday began with a further 3.3% drawdown in bitcoin to $38.9K, which had fallen below its support line since January. The signal for a break of the mild upward trend would be a consolidation below the $38K levels. If the bulls capitulate, the first cryptocurrency could be pushed into the $32-35K range without much resistance. A consolidation scenario below $30K would require an absolute disaster in the financial markets. We have seen steady and impressive demand from long-term buyers as we have fallen into this area.
The total capitalisation of the crypto market, according to CoinMarketCap, fell by 7.3% over the week to $1.81 trillion. The Bitcoin Dominance Index fell by 0.5% to 40.75% over the same period.
The cryptocurrency fear and greed index lost 4 points to 24 by Monday, returning to “extreme fear” territory after two days of consolidation in “fear”.
Bitcoin declined for the second week in a row under negative stock market performance. Last week’s noticeable decline in BTC occurred on Monday amid a significant drawdown in US stock indices.
Executives of the world’s largest crypto exchanges told CNBC that they have recently noticed signs of a “crypto thaw” regarding governments’ changing attitude towards cryptocurrencies.
Portugal’s central bank has granted the country’s first crypto-asset license to a bank. Bison Bank became the first bank in Portugal to offer large customers cryptocurrency storage and trading services.
Cardano founder Hoskinson suggested that Musk join forces to create a decentralised social network if Twitter does not come under the Tesla founder’s control. Vlad Tenev, Robinhood’s CEO, said DOGE would become the most used cryptocurrency for Internet payments. However, to do so, developers must improve transaction processing speed.
Fed Tightening Fears Boost US Dollar
US dollar soars on Fed tightening nervousness, weak euro
The euro and yen have tumbled since Thursday, and US bond yields have noticeably firmed once again as Fed rate hike fears increase the closer we get to May’s FOMC. That has combined to punish the dollar index substantially higher, rising 0.50% to 100.33 on Thursday. The dollar index rose slightly on Friday and has gained 0.20% to 100.70 in Asia today. Resistance at 100.90 is within sight, and a move through 101.00 would signal more gains targeting the 2020 pandemic-panic highs at 103.00. Support is between 99.40 and 99.55.
The ECB policy decision, where it signalled little to no intention of increasing the pace of tightening or removing QE earlier, saw EUR/USD sold heavily on Thursday. EUR/USD traded between 1.0750 and 1.0900 before finally finishing 0.60% lower at 1.0830. The single currency eased slightly on Friday before moving 0.20% lower to 1.0785 in Asia today. The euro is now facing a serious test of the multi-decade support line at 1.0800. A daily close will increase bearish nerves, and a weekly close below it will be a powerful bearish signal. Initial targets are 1.0600 and 1.0300 and potentially a fall through 1.0000. Rallies in and around 1.0950 should find plenty of sellers. Ukraine and energy fears and a dovish ECB make a sustainable rally in the euro challenging now. Only a sudden narrowing of the US/Core-Europe rate differential will likely change the outlook.
Sterling is holding above 1.3000 for now at 1.3030, as markets price in hikes by the BOE in May, and heavy EUR/GBP selling supports GBP/USD. Rallies have been limited to the 1.3150 regions, though, and the risk remains skewed towards a comprehensive failure of 1.3000, which should target 1.2700 initially. The Australian and New Zealand dollars have both suffered heavy losses over the past few sessions, as risk aversion increases, and with both central banks perceived as being too slow to move on inflation. AUD/USD had fallen to 0.7360 and has support at 0.7300. NZD/USD has broken its uptrend line at 0.6815 last week, retreating to 0.6730 today. As risks of a hard landing increase, NZD/USD remains the more vulnerable. Failure of 0.6815 now could see NZD/USD fall all the way back to 0.6500 in the weeks ahead, with 0.50% priced into the next RBNZ meeting.
The widening US/Japan yield gap has seen USD/JPY soar over the past two sessions, reaching 126.65 this morning, taking out previous resistance at 125.80, which becomes initial support, followed by 125.00. Expect the official rhetoric from Tokyo to move up a notch this week now, although any dips are probably ones to buy. USD/JPY is now entirely at the mercy of the rate differential, and unless that reverses sharply, USD/JPY should target 128.00 eventually.
Asian currencies are weaker today, following the sharp move higher by US yields on Thursday, China’s economic nerves, and higher oil prices. USD/KRW has risen 0.45% to 1233.75 today, with USD/TWD climbing 0.35% and USD/JPY rising by 0.15%. Both USD/CNY and USD/CNH are also approaching one-year trendline resistance levels at 6.3770 and 6.3950 respectively. Daily closes above would signal another leg of yuan weakness. As I have said ad nauseam previously, the slow pace of Asian monetary normalisation will present challenges to Asian FX as US rates keep moving higher. A slowing China will add to those concerns meaning we are likely to see Asia FX rates move lower over the coming quarter.
China GDP Beat Reveals Cracks
With most of Europe, as well as Hong Kong, Australia, and New Zealand on holiday today, the focus of the day has been on this morning’s tier-1 data releases from China. China GDP YoY for Q1 beat expectations, rising by 4.80% (4.50% exp), and rising 1.30% QoQ (0.60% exp). Industrial Production in March fell to 5.0% YoY from 7.50% in February while Retail Sales had a big miss, slumping to -3.50% YoY (-1.60% exp.) in March from 6.70% in February. Meanwhile, Unemployment in March rose to 5.80% from 5.50% previously, and Capacity Utilisation fell to 75.80% from 77.40% previously.
Overall, the data suggest that China started the year well, but as the quarter has moved on the headwinds have gotten stronger. A slowing property market, sweeping Covid restrictions, the Ukraine invasion pushing up base commodity and energy prices, and a central bank still intent on deleveraging sectors of the economy, have all combined to weigh on China’s growth. About the only thing missing is a meaningful rise in inflation, which is some small sliver of comfort.
It is little surprise, therefore, that mainland equities are heading south today once again, despite China’s PBOC cutting the RRR by 0.25% on Friday, allowing banks to lend more, with agricultural banks’ RRR being trimmed by 0.50%. Markets were disappointed that the 1-year MTF was not also cut on Friday and China’s have your cake and eat it approach seems to be facing more challenges by the day. China will have a second bite of the cherry on Wednesday, when it announces its latest 1 and 5-year Loan Prime Rate decisions.
Virus restrictions across China appear to be heading the wrong way, even as Hong Kong cases plummet. Markets are already seeing the impact on production and trade from the Shanghai lockdowns, and if these start spreading, the picture for China dims considerably, even without the downstream impact from the Russian invasion of Ukraine. China’s official 5.50% GDP target becomes more challenging by the day as consumer sentiment plummets, production costs rise and Covid policies threaten to wreak havoc with production and logistics. Eventually, this will weigh on other Asian markets as well.
Singapore’s Non-Oil Exports (NODX) fell to 7.70% YoY in March and fell by 2.30%, MoM. Admittedly, it is a volatile data series, but the growth of both electronic and non-electronic exports slowed. Not all of this can be attributed to China of course, but the timing is unfortunate as the MAS has just tightened monetary policy aggressively. The Malaysia and Indonesia trade balances later today will make interesting reading, especially if exports to China ease.
With US and European markets closed on Friday, making Thursday the technical end of the week, we had a choppy session. Firstly, markets did not like a continuation by the ECB, of the glacial pace of a move towards tightening. One can hardly blame them given the events on Europe’s Eastern border, but markets punished the euro, which has slumped to multi-decade support around 1.0800.
In the US, markets took fright at inflation and an impending 0.50% hike by the FOMC in early May. US yields shot higher, and equities slumped once again. Admittedly, part of the equity move could be related to investors reducing risk over the long weekend, an eminently sensible idea. However, US index futures on the big three have headed directly south this morning as well, along with Asian stock markets. Ominously, futures on US 10-year bonds have fallen heavily as well, indicating yields will open higher in the US this afternoon.
That has been great for the US dollar, which rallied strongly on Thursday, and booked gains on Friday and today as well. Substantial falls by the Japanese yen and the euro have led the way, highlighting that the impact of interest rate differentials appears to be accelerating. Both the BOJ and ECB have signalled that interest rates are going nowhere in a hurry. One wonders when the same forces will start to materially impact the yuan and low yield currencies around Asia.
The week is relatively light on the data front globally, certainly for heavyweight data prints. US Housing Starts tomorrow and Markit PMIs on Friday are the highlights. In Europe, we get Eurozone Industrial Production on Wednesday and Markit and Eurozone PMIs for the bloc on Friday. I would suggest all the European data has downside risk. In Asia, apart from trade balances and China’s LPRs, we see India release March WPIs for food, manufacturing, and inflation. Upside prints will increase the noise around the pace of the RBI’s move to a tightening bias and will probably be a headwind for the Sensex.
Japan releases Industrial Production tomorrow, and the trade balance on Wednesday, both of which have downside risks. It releases inflation on Friday, but I haven’t looked at that for 20 years and nor should you. We already know the answer. Apart from being another reason to be long USD/JPY, the main volatility this week from Japan will come from officials speaking about the yen and “watching markets closely” as the yen continues to be crushed by the US Dollar.
On the geopolitical front, the brave defenders of Mariupol have given the Russians a one-fingered salute regarding their kind offer to surrender, although they appear to be on their last legs and the city will not be Russia’s Stalingrad. Realistically, we are not likely to get another way of Ukraine risk aversion sweeping markets until Russia finishes reconstituting and resupplying its forces and commences its offensive in eastern Ukraine.
EURUSD Pokes at 2-Year Base, Bias Remains Bearish
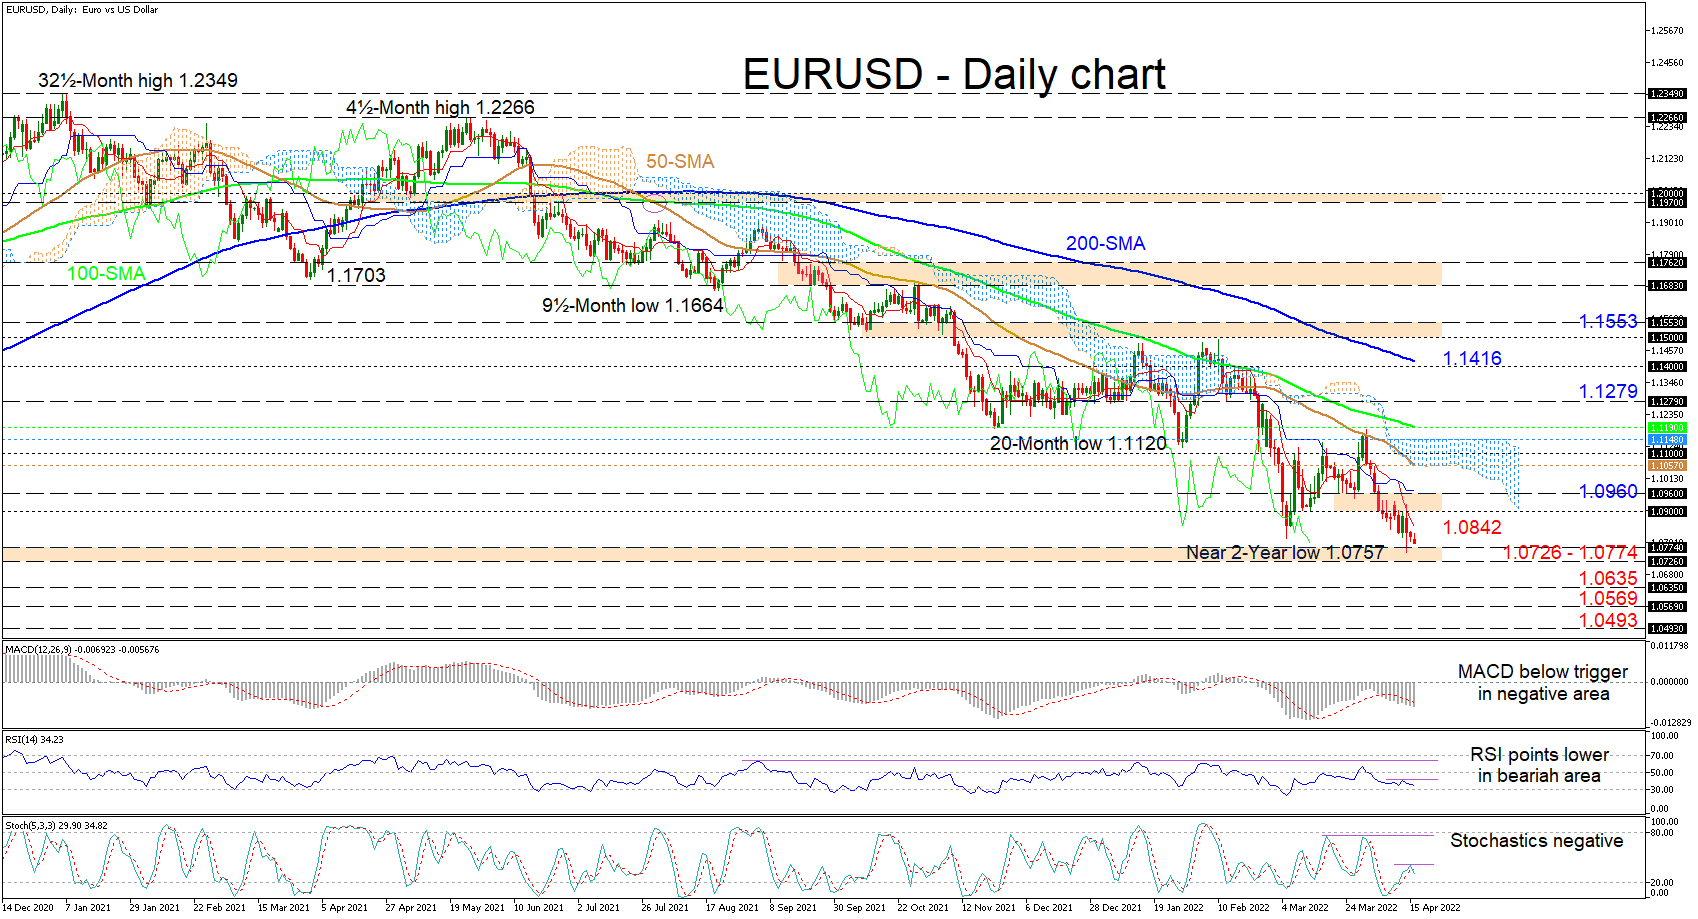
EURUSD is taunting the 1.0726-1.0774 key support border after recently taking a fresh jab at it. The descending simple moving averages (SMAs) are defending the near 11-month downtrend from the 1.2266 high.
Furthermore, the Ichimoku lines are indicating a pause in downward forces, while the short-term oscillators are suggesting a commanding negative bearing in the pair. The MACD has remained beneath its red trigger line, while the RSI is sliding towards the 30 oversold mark, both sponsoring more negative momentum in the pair. Additionally, the renewed negative charge in the stochastic oscillator, is hinting that sellers are sustaining downward pressure in the pair.
In the negative scenario, downward friction could commence from the critical 1.0726-1.0774 support foundation that extends back to the lows over the early part of April until mid-May 2020 period. If this crucial barricade fails to suppress negative tendencies from gathering speed, the March 2020 low of 1.0635 could draw traders’ attention. From here, unsuccessful attempts from buyers to find their feet at this 35-month trough could steer the pair to test the April 2017 low of 1.0569 ahead of the February 2017 trough of 1.0493.
However, if the price bounces off the 1.0726-1.0774 floor, upside constraints could originate at the red Tenkan-sen line at 1.0842 ahead of the 1.0900-1.0960 resistance barrier, which is capped by the blue Kijun-sen line. Recouping more of the previously lost ground, the pair may then encounter a tough resistance region between the falling 50-day SMA at 1.1057 until the Ichimoku cloud’s upper band at 1.1148. In the event profound buying pressures endure above the cloud and push over the nearby 100-day SMA at 1.1190, the bulls could then seek out the 1.1279 barrier before eyeing the 200-day SMA, which is nearing the 1.1400 price vicinity.
Summarizing, EURUSD is sustaining a bearish bias below the SMAs and the 1.1184 high. A dive in the price below the 1.0726-1.0774 base could significantly hurt positive prospects in the pair. That said, for a clearer optimistic outlook to return, the price would need to pilot beyond the 1.1500-1.1553 obstacle.