

Sample Category Title
Gold Price Moved into a Short-Term Positive Zone above $1.965
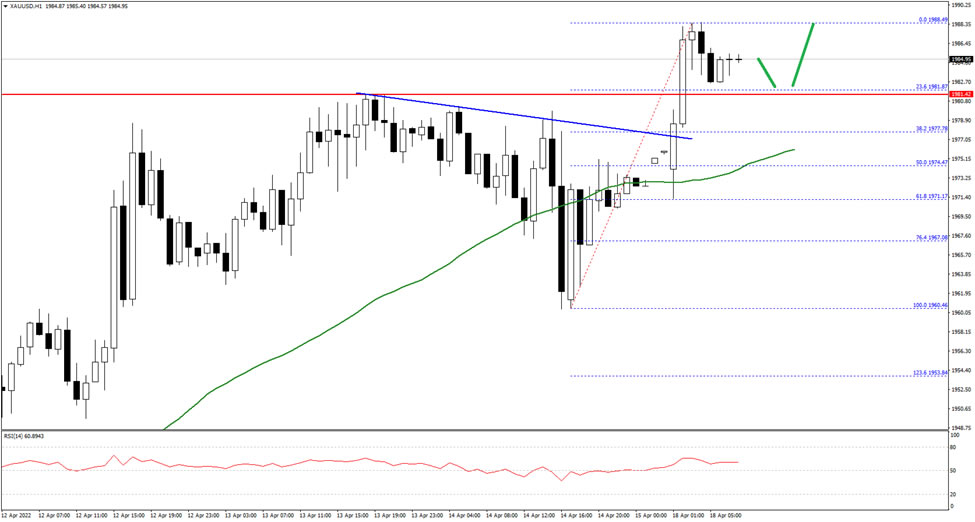
Gold price started a fresh increase from the $1,950 pivot level against the US Dollar. The price broke the $1,965 resistance zone to move into a short-term bullish zone.
There was a move above a key bearish trend line with resistance near $1,975 on the hourly chart. The price even climbed above the $1,980 and settled above the 50 hourly simple moving average. It is now trading near the $1,985 level and consolidating gains.
An immediate resistance is near the $1,988 level. The next main resistance could be near the $2,000 level, above which the price could start another steady increase. In the stated case, it could rise towards $2,025.
If not, the price could decline below $1,980 on FXOpen. The next major support is near the $1,965 level, below which the price might decline towards the $1,950 support level in the near term.
Gold heads for 2,000 as bullish bias grows
Gold brought the 2,000 number back into scope after halting Friday’s setback near the former resistance of 1,959.
The RSI and the MACD are currently heading northwards, endorsing the bullish appetite in the market. Of course, the Stochastics have already entered the overbought zone, suggesting that room for improvement is probably narrowing, though as long as they trend northwards, upside price movements are more likely than downside ones. The 20-day simple moving average (SMA) has recently avoided a bearish intersection with the 50-day SMA, sending bullish vibes as well.
Stretching beyond the crucial 2,000 level, which is also the 23.6% Fibonacci retracement of the 1,780 – 2,070 upleg, the bulls may push for a close above the all-time high of 2,079 from August 2020. If their efforts prove successful, traders may immediately target the 2,100 psychological mark, where any violation could activate fresh buying orders, likely up to the 161.8% Fibonacci retracement of the latest downfall at 2,183.
If the bulls run out of fuel around 2,000, the precious metal will probably pivot southwards to seek support near 1,959 again. Failure to bounce here this time could confirm a bearish extension towards the 50% Fibonacci of 1,924 and the 50-day SMA, while a break below 1,915 could stage a more aggressive sell-off towards the 1,890 – 1,870 zone. The latter would also downgrade the bullish outlook to neutral.
In brief, the yellow metal is expected to haunt more gains in the short term. A decisive close above 2,000 could boost the price towards the previous record high of 2,079. Otherwise, some consolidation may develop between 2,000 and 1,959.

Daily Technical Analysis
EUR/USD
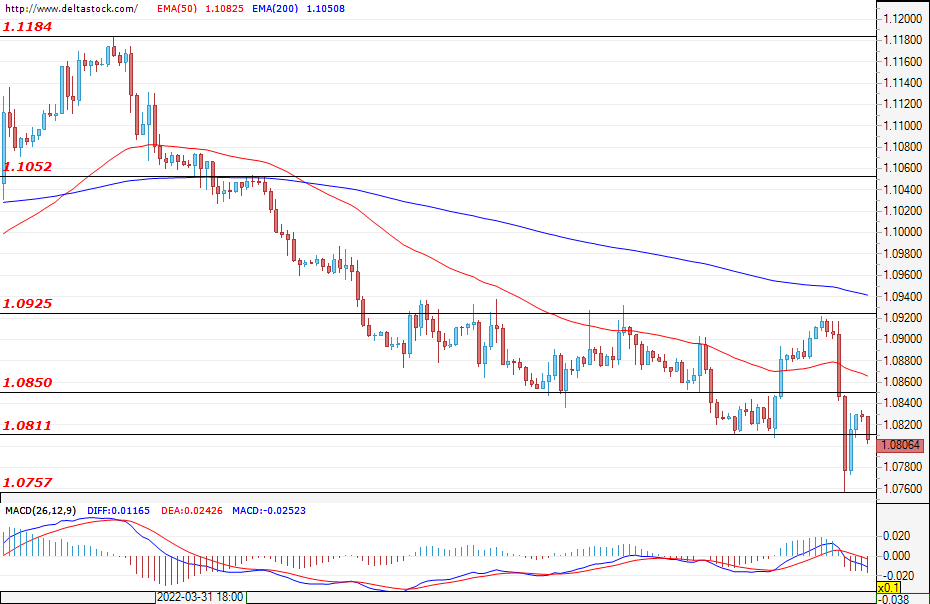
The single European currency continued its weekly trend and fell sharply against the U.S. dollar on the last trading day last week. The reason for the strong bearish attack was the decision to keep the key interest rate in Europe at 0.00%, which was taken as a response to the 7.5% inflation growth in the region as per the ECB’s data. On the day of the announcement, the session started positively, once more reaching levels at around 1.0925, but soon after the euro hit a low of 1.0757. The rocky session ended with a slight increase back towards 1.0834. This week will begin slowly – with an official holiday (Easter) in a number of European countries – and without much macroeconomic data. If the pressure continues, then a decline towards levels below 1.0757 is more likely, as is a deepening towards the bottom at around 1.0640. However, if the bulls find support in the coming days, then we could witness another test of the resistance at around 1.0925.
USD/JPY
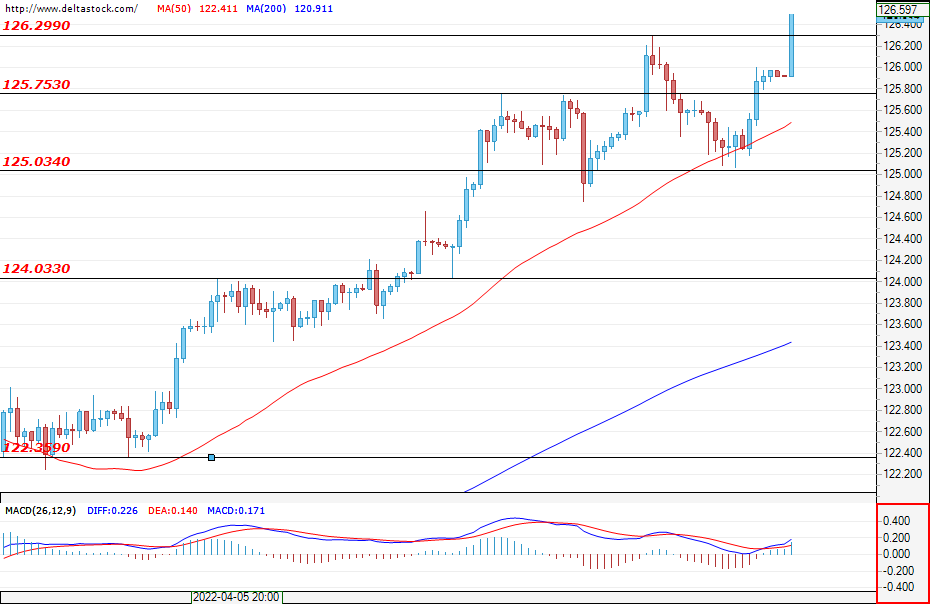
The yen session started with a slight correction towards 125.03, but soon after we saw another acceleration of the uptrend thanks to the strengthened U.S. dollar. The movements conquered the peak at 126.00, where the price stayed right up to the closing bell. Тhe market sentiment for reaching higher prices remains unchanged and so the Ninja may reach levels of 129.00 this week. That being said, corrections should not be ruled out and the supports at around 125.03 should be monitored. The Fed leader's remarks on Thursday will be important for traders as they could affect the dollar’s movements..
GBP/USD
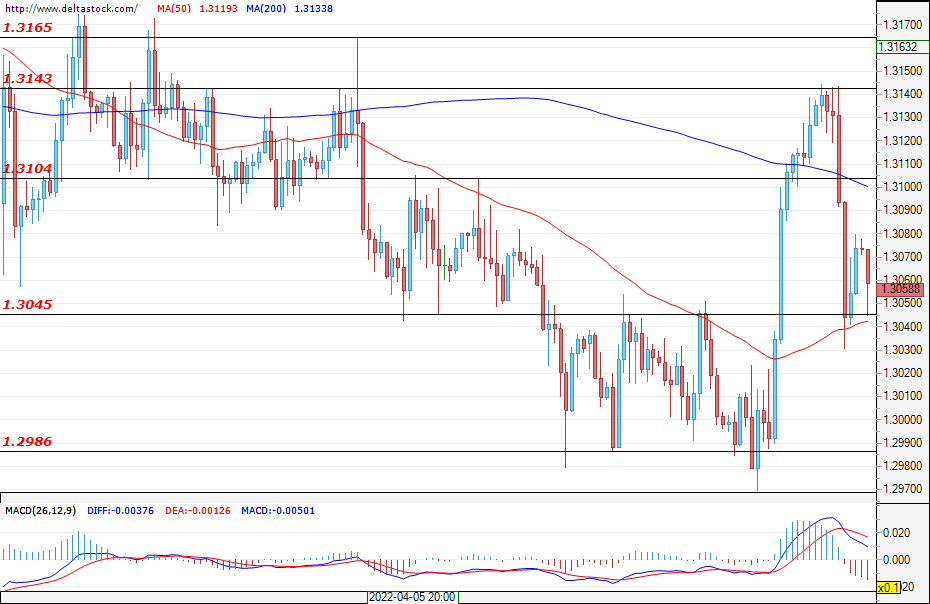
The trading session in the sterling also started positively, climbing towards 1.3143 – a move still driven by the positive CPI data for the UK that came out on Wednesday. However, the downward trend did not wait and the immense strength of the dollar yanked the pound towards the bottom of 1.3032. The day ended with a slight recovery and the market closed at around 1.3080. The beginning of the week is shaping up to be calm, with no significant market data available due to the Easter holidays, so the first more notable movements are likely to be spurred by the statements of BoE gov. Andrew Bailey, scheduled for Thursday and Friday. Downward movements are more likely and we could see a return towards 1.2986 and a possible deepening towards 1.2850. However, if instead the dollar weakens and the bulls gain momentum, then the Cable may bounce back up at least towards the level of 1.3165.
EUGERMANY40
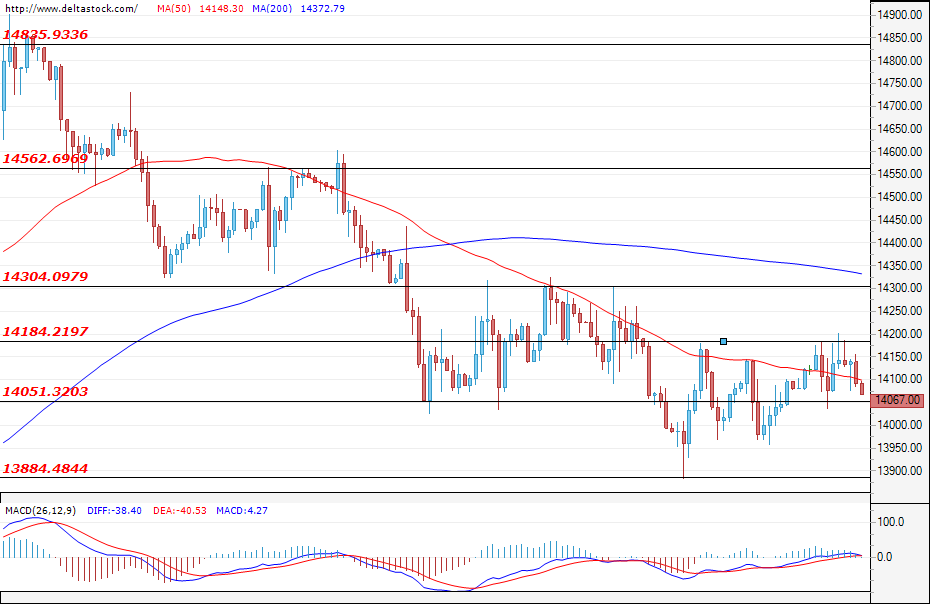
On the last day of the week, the German index paused its decline and managed to score slight gains, supported by the movements in the euro on the same day. The bulls had the opportunity to attack, and with the news that the interest rates in Europe will remain at zero, the index managed to rise towards 14200. The EUGERMANY40, however, failed to hold onto its gains, and at the end of the session closed at around 14050. The downward trend is a more likely scenario and so we can expect for the index to reach levels at around 13884 and to further deepen towards 13580, but if last week’s daily rise continues, then we could again see it reaching the resistance at around 14560. This week,f traders will focus on managers’ data on the German Manufacturing PMI on Friday.
US30
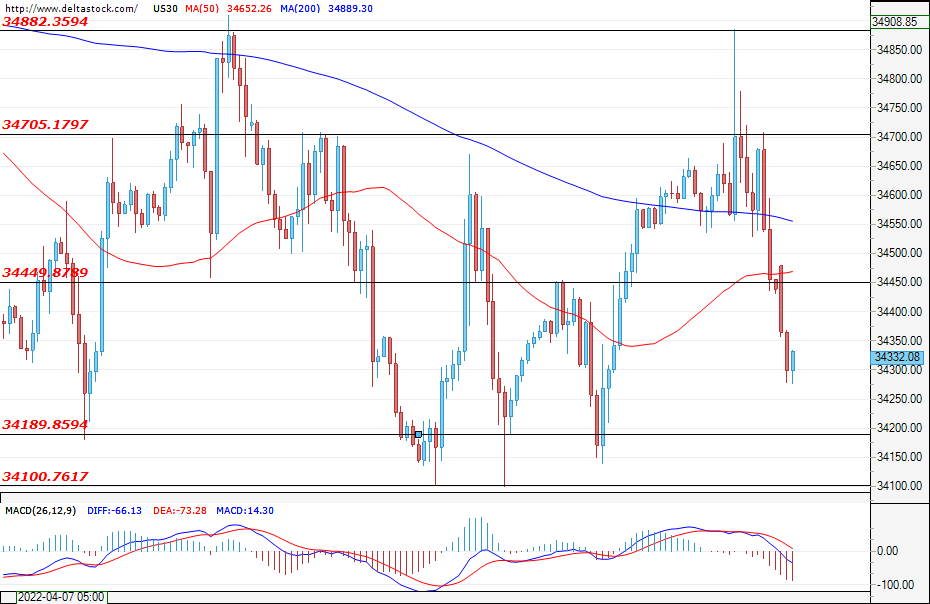
The blue-chip index started the day with a slow rise, which quickly accelerated around the opening of New York stock exchange and reached a peak at 34882. However, the downward trend did not stall, and following the breach of 34705, the index reached the bottom at around 34445, at which point the session ended. Jerome Powell’s speeches will be closely monitored this week as they can provide clues about the speed at which the U.S. interest rates will be increased. A decline towards the support at about 34100 is a likely scenario and it could even deepen further towards 33800. However, if the index once more returns to its previous range-bound trading, then we could see a rebound back towards 34700.
Investors’ Eyes on the Yield Curve
Following a shortened trading week in which equities declined, commodity prices shot higher, and US 10-year Treasury yields hit a new three-year high, US equity futures are pointing to further selling pressure this morning.
Recession fears led the US 2-year/10-year yield curve to invert earlier this month for the first time since 2019. However, this inversion did not last long. The short end of the curve or 2-year Treasury yields hovered near 2.5% indicating that the Fed will raise rates by 200 to 225 basis points by year-end; meanwhile, 10-year yields are a few basis points away from 3%.
No one has an answer as to when and how a recession will hit. But the probability of one occurring is on the rise. Inflation in the world’s largest economy is running at a four-decade high, the Fed is scrambling to tighten policy and likely to start raising rates in 50 basis points increments, China’s zero-Covid policy is creating further supply chain shocks, and of course there is a war in Ukraine that is showing no signs of ending soon.
While Fed officials remain confident that tightening policy will not crash the economy, many believe the pace of tightening and balance sheet runoff are the ingredients for a hard landing. We will get to know who’s right over next 12 to 18 months.
What we know now is that the rise in US Treasury yields is harming risk and we can see it in most asset classes including tech stocks, consumer cyclicals, and even digital currencies and NFTs. Such tough times may bring long term opportunities as valuations come down to earth, however we’re still far away from cheap valuations when it comes to growth stocks.
Sector that tends to outperform the market in such times are the defensive ones. Utilities, consumer staples, and healthcare are the three main defensive sectors and that why they all posted gains this month. So, if an investor is in the recession camp, these are the sectors that they are likely to be overweight in.
The earnings season kicks into a higher gear this week with results from American Express, Bank of America, Bank of New York Mellon, IBM, Johnson & Johnson, Netflix, and Tesla. Investors need to see strong beats and positive guidance to keep taking risk as US 10-year yields approach 3%.
CAD/JPY Rises Along the Trendline
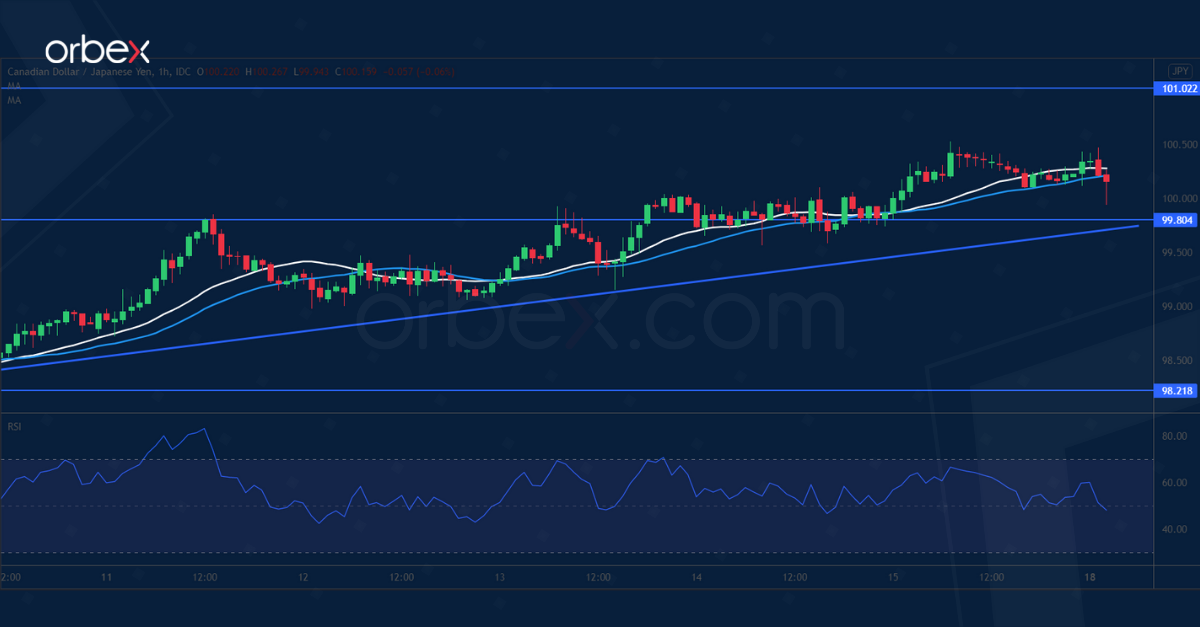
The Canadian dollar rallies thanks to the Bank of Canada’s hawkish stance. A break above last month’s high and the psychological level of 100.00 has put the pair back on track after a 2-week long consolidation.
Sentiment remains overwhelmingly bullish as the bears hesitate to jump in. The loonie is climbing along a rising trendline and 101.00 from June 2015 high is the next resistance.
A pullback is likely to find support from trend followers. 99.80 coincides with the trendline, making it a congestion area.
EUR/GBP Breaks Below Daily Support
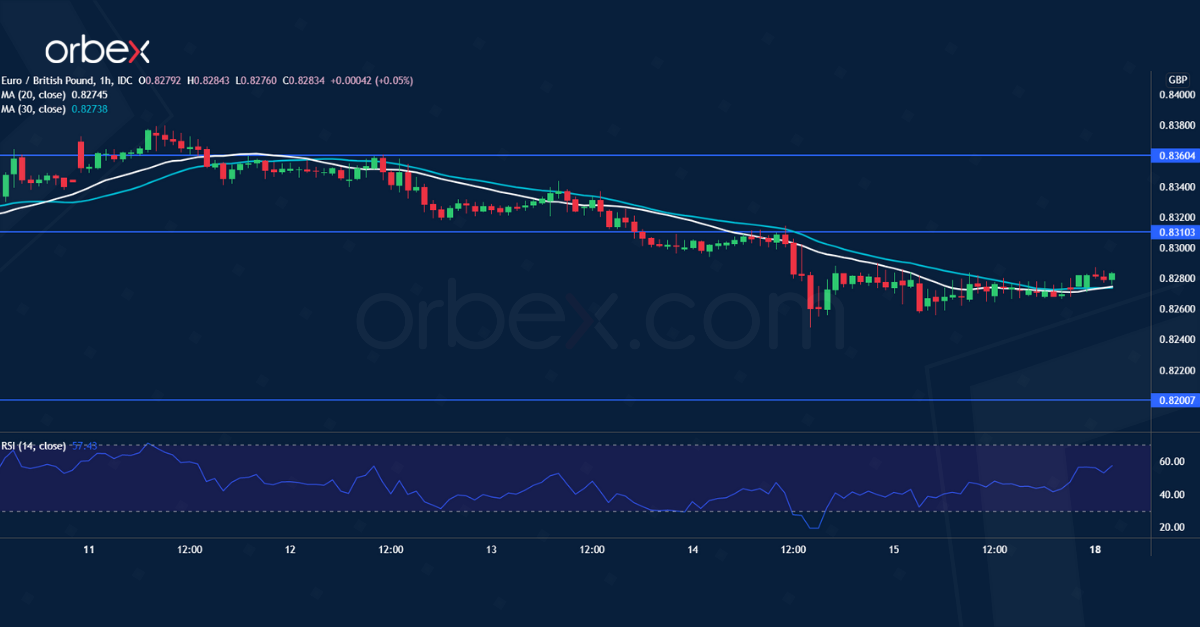
The ECB’s patience regarding its monetary policy continues to weigh on the single currency. The latest drop below the daily support (0.8300) is an invalidation of the recent rebound and could further depress the euro.
While trapped bulls seek to bail out, there could be stiff selling pressure near 0.8310, which has turned into resistance. An oversold RSI may cause a brief rally but the bears may see it as an opportunity to push lower.
March’s lows near 0.8200 would be the next target when momentum comes around.
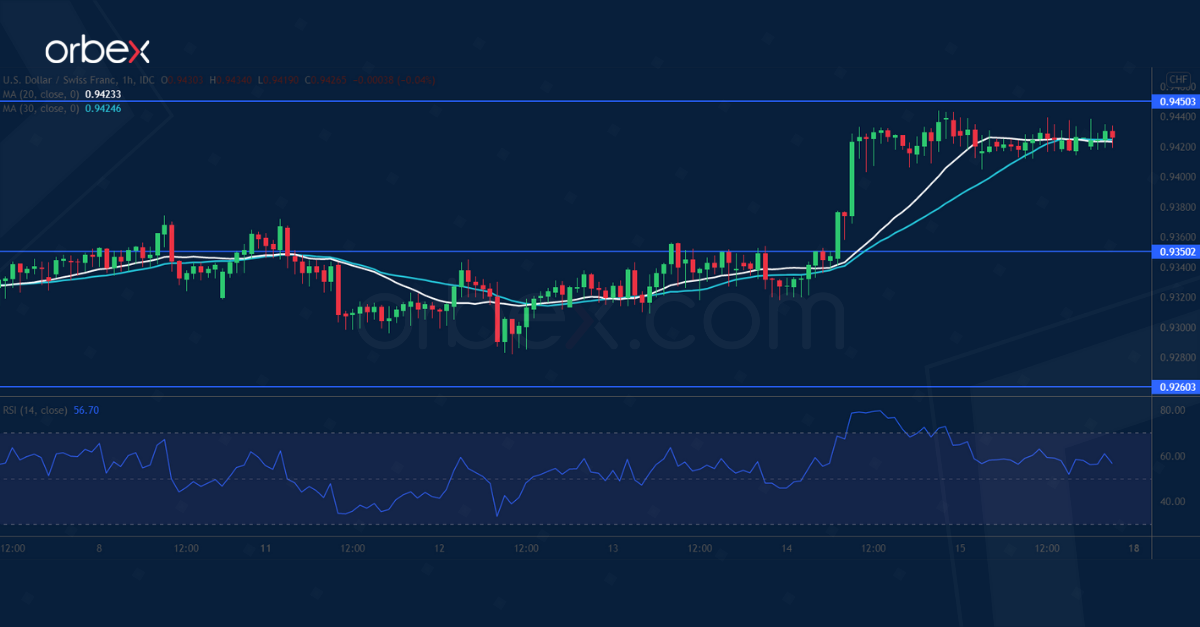
USD/CHF Tests Daily Resistance
The US dollar edged higher as Treasury yields touched a 3-year high. A surge above the supply zone around 0.9370 is a strong sign that the bulls have regained control of the direction.
The daily resistance at 0.9450 is the sellers’ last stronghold, a breakout could end the year-long consolidation and extend the reversal to 0.9600.
The RSI’s overbought condition may cause a limited pullback as intraday traders unwind their positions. 0.9350 from the former supply zone is now a fresh support to gauge buyers’ commitment.
Technical Outlook and Review
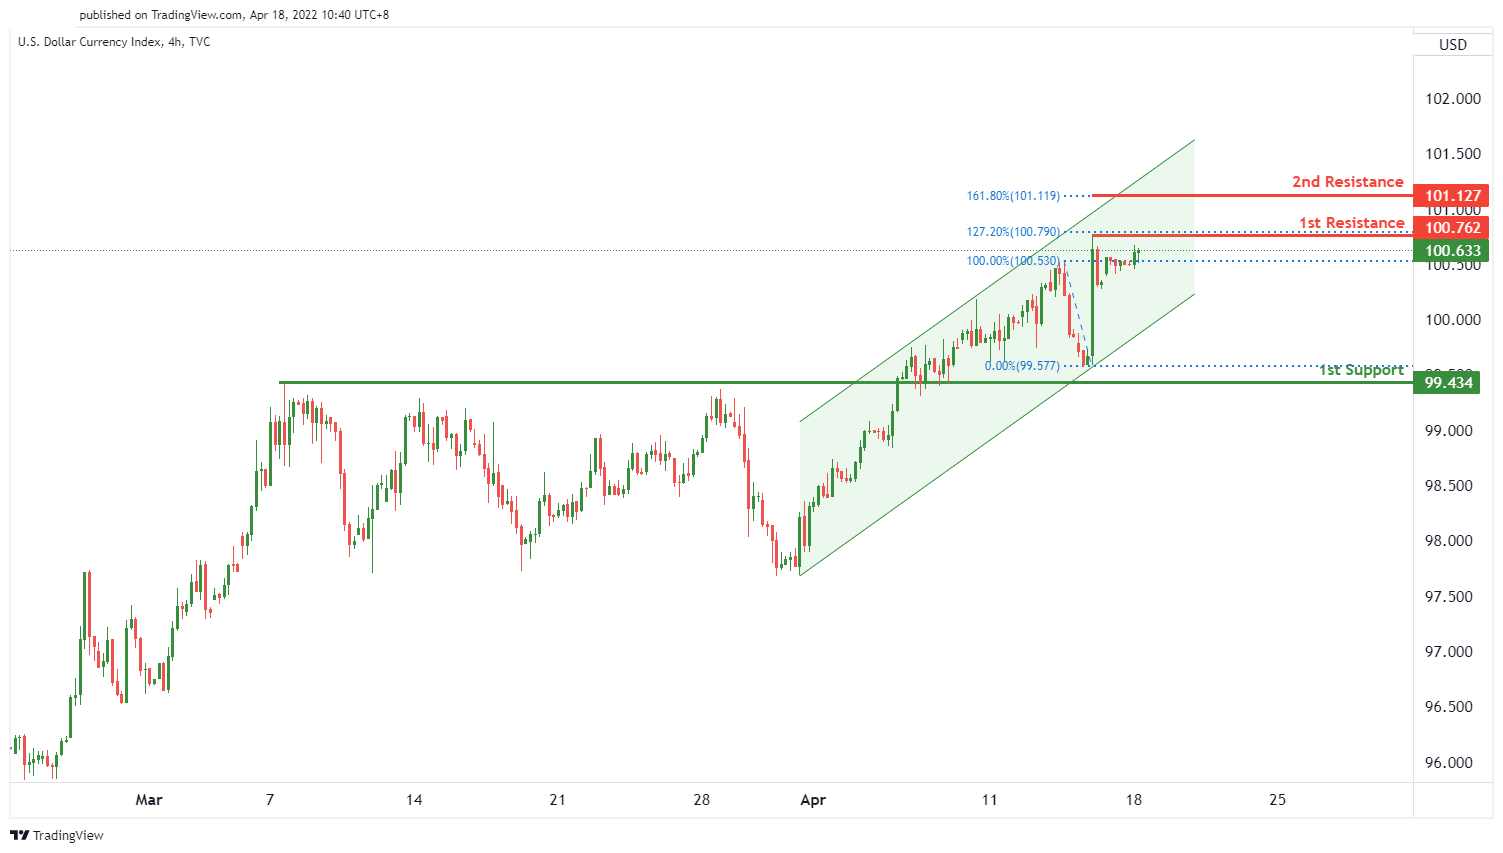
DXY:
Price is near key pivot level. We see a potential for bearish reversal from 1st resistance level of 100.762 in line with 127.2% Fibonacci extension towards the 1st support level of 99.434 along with a graphical pullback support. Alternatively, price might continue to rise to 2nd resistance level of 101.127 in line with 161.8% Fibonacci extension.
Areas of consideration:
- H4 time frame, 1st resistance at 100.762
- H4 time frame, 2nd resistance at 101.127
- H4 time frame, 1st support at 99.434
XAU/USD (GOLD):
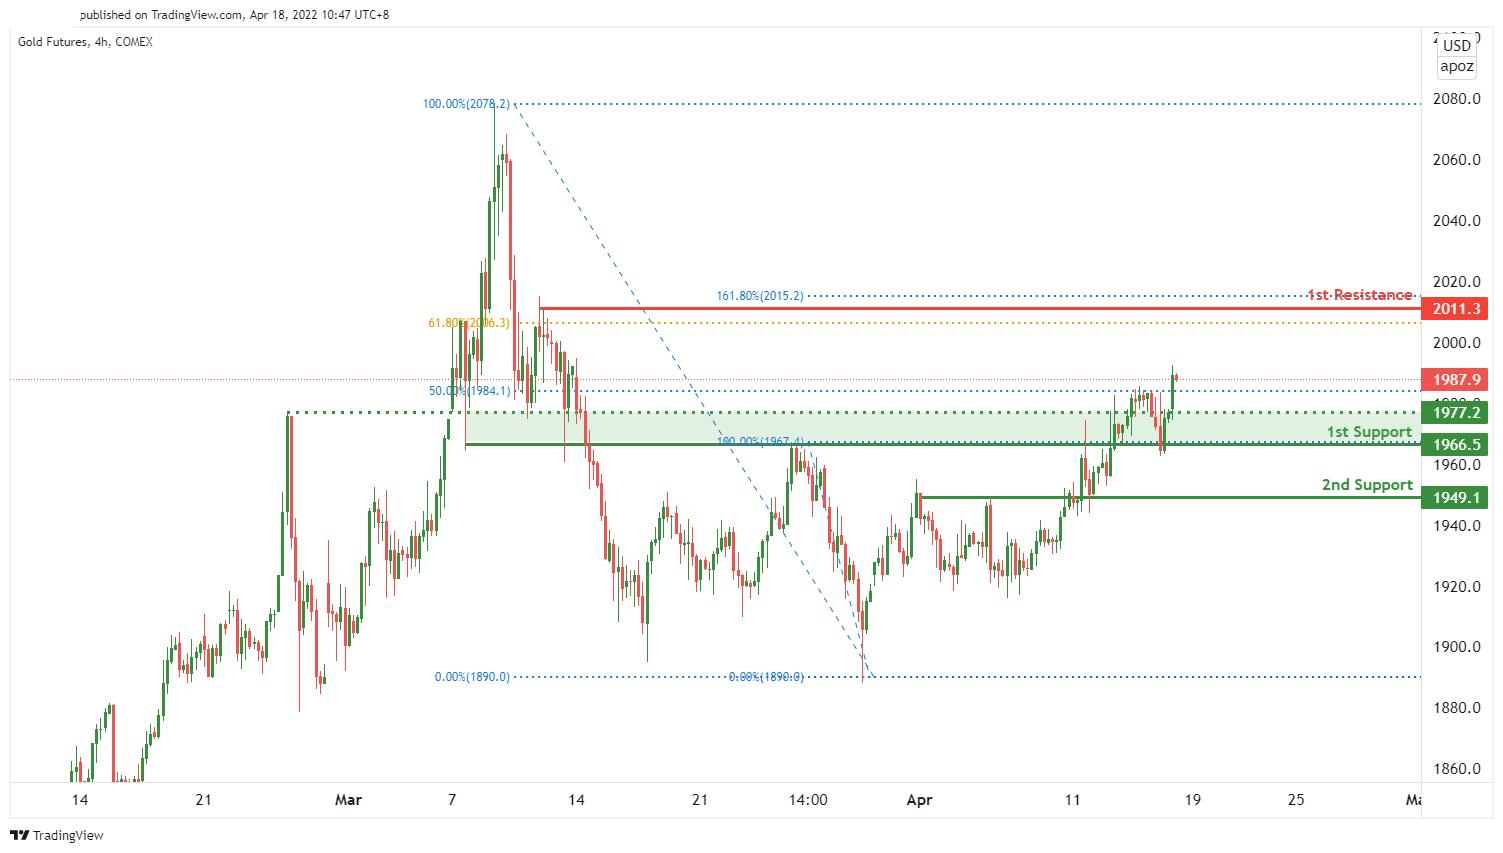
We expect price to be on a bullish continuation from 1st support level of 1966.5 in line with graphical pullback support towards the 1st resistance level of 2011.3 in line with 161.8% Fibonacci extension and 61.8% Fibonacci retracement. Alternatively, price might break through the key support level and drop to the 2nd support level of 1949.1 in line with graphical pullback support
Areas of consideration:
- H4 time frame, 1st Resistance at 2011.3
- H4 time frame, 1st Support at 1966.5
- H4 time frame, 2nd Support at 1949.1
GBP/USD:
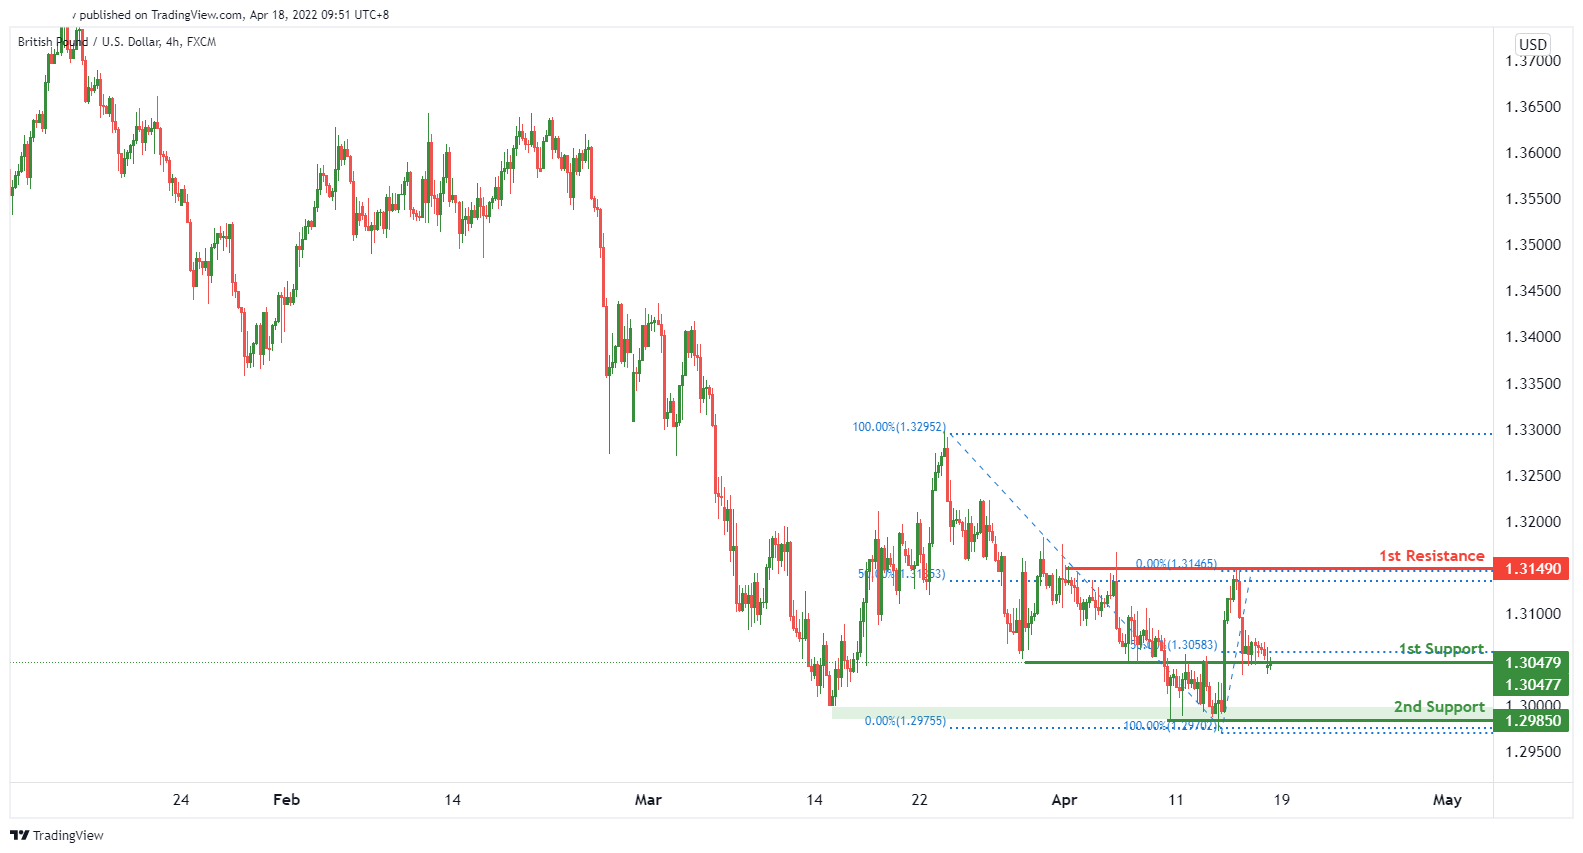
On the H4 timeframe, we expect to see a potential for bullish bounce from 1st support level of 1.30477 in line with and 50% retracement towards the 1st resistance level of 1.31490 in line with 50% Fibonacci retracement.
Areas of consideration:
- H4 1st resistance at 1.31490
- H4 1st support at 1.30477
USD/CHF:
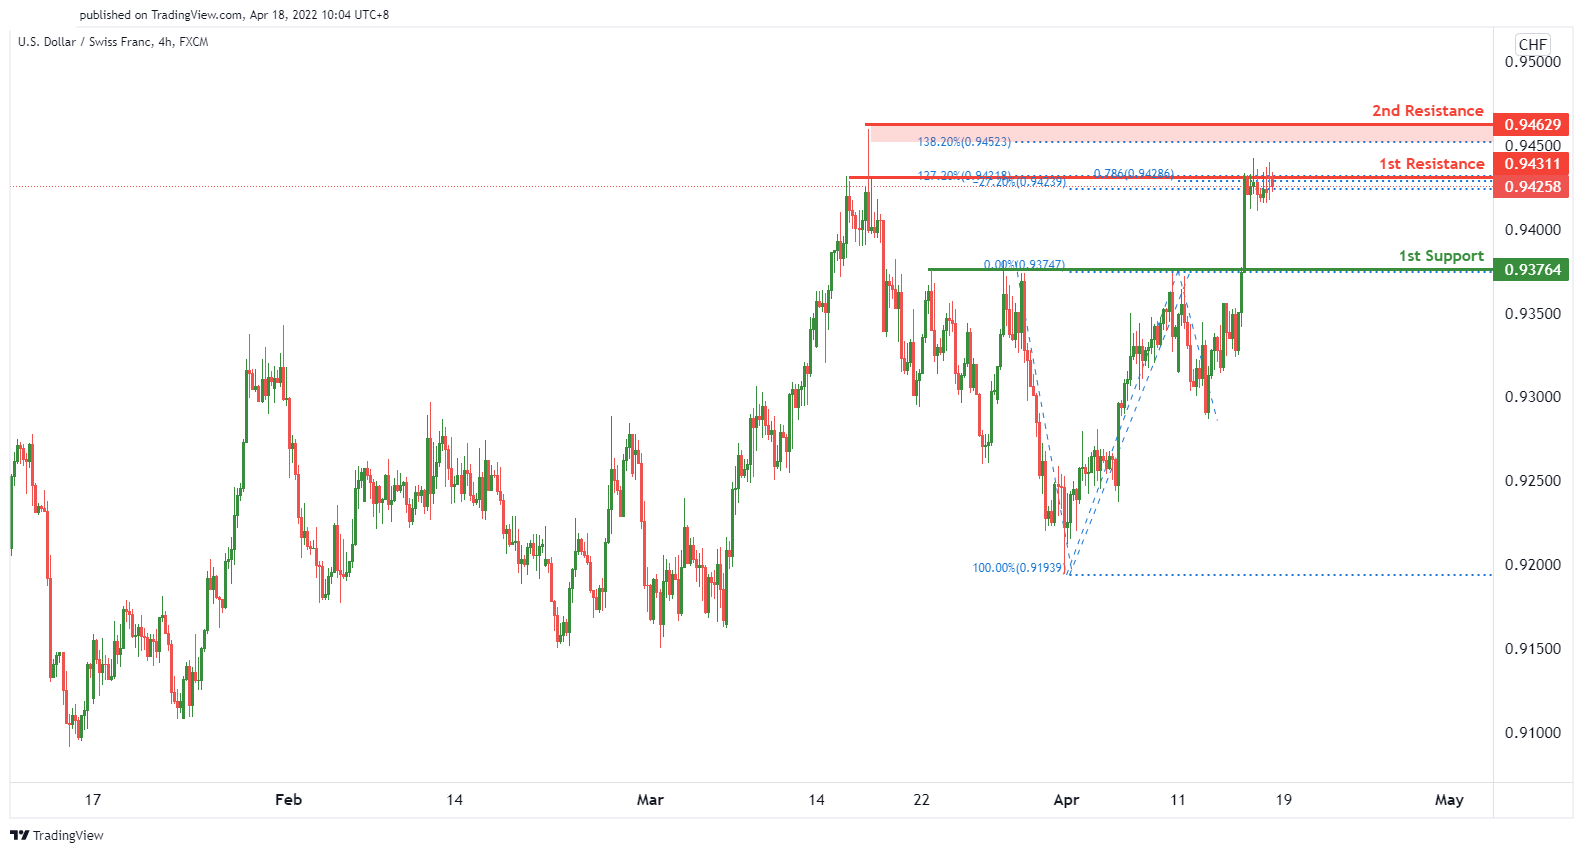
On the H4, we see the potential for bearish reversal from our 1st resistance at 0.94311 in line with 78.6% FIbonacci projection, 127.2% Fibonacci extension and -27.2% Fibonacci expansion towards our 1st support at 0.93764 which is in line with a graphical pullback support. Alternatively, price might break through the key resistance level and head towards the 2nd resistance level of 0.94629 which lines up with 138.2% Fibonacci extension.
Areas of consideration
- 1st support level at 0.93764
- 1st resistance level at 0.94311
- 2nd resistance level at 0.94629
EUR/USD :
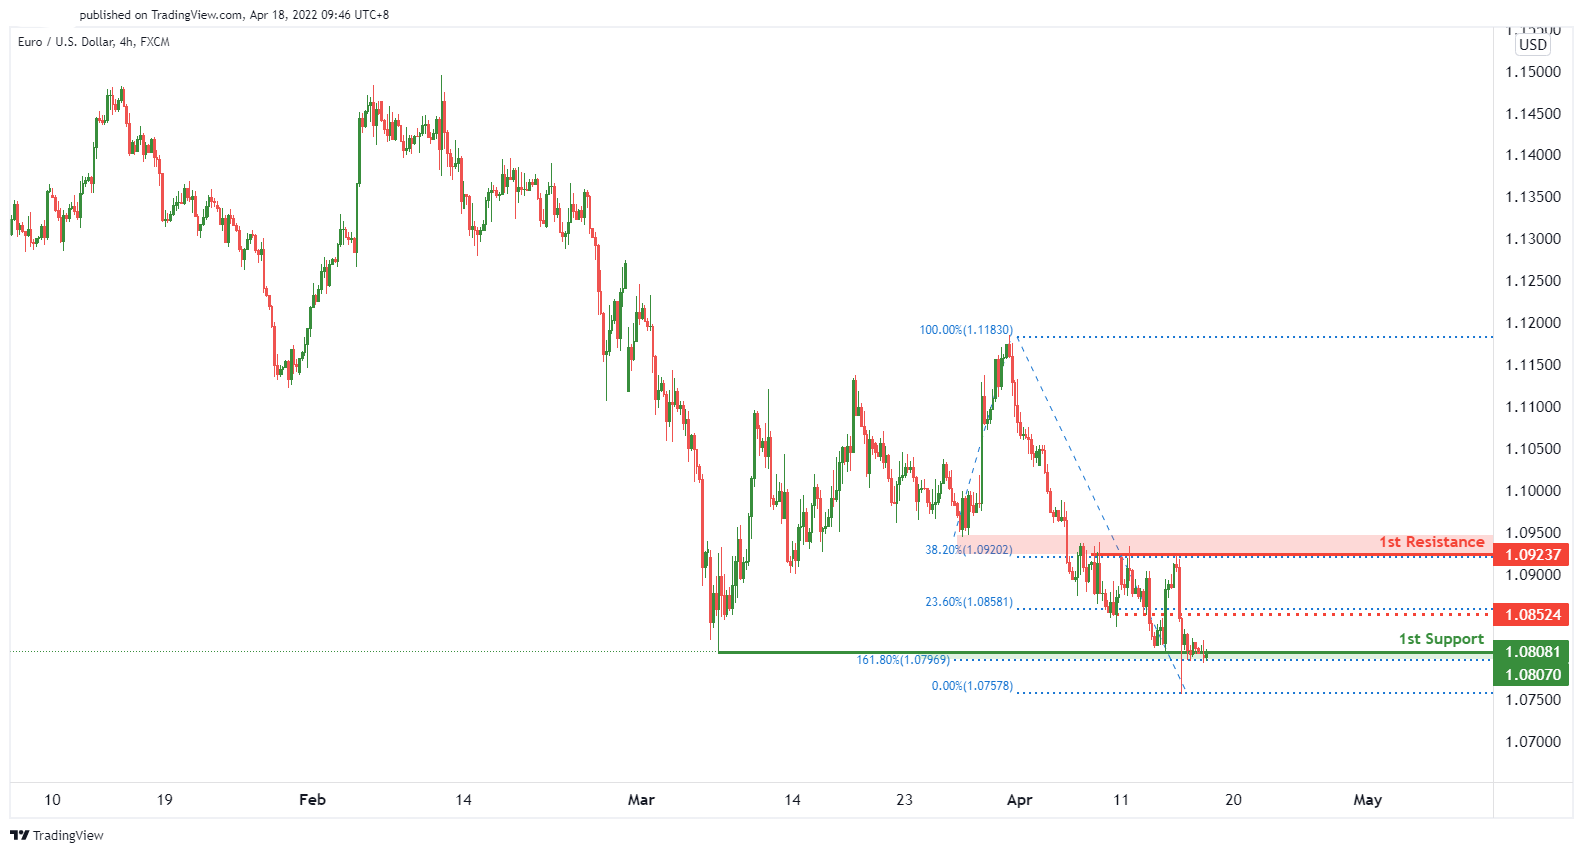
On the H4 timeframe, price is near a key pivot. We see the potential for a bullish bounce from our 1st support level of 1.08070 in line with 161.8% Fibonacci extension towards our 1st resistance level of 1.09237 in line with 38.2% Fibonacci retracement.
Areas of consideration :
- H4 1st resistance at 1.09237
- H4 1st support at 1.08070
USD/JPY:
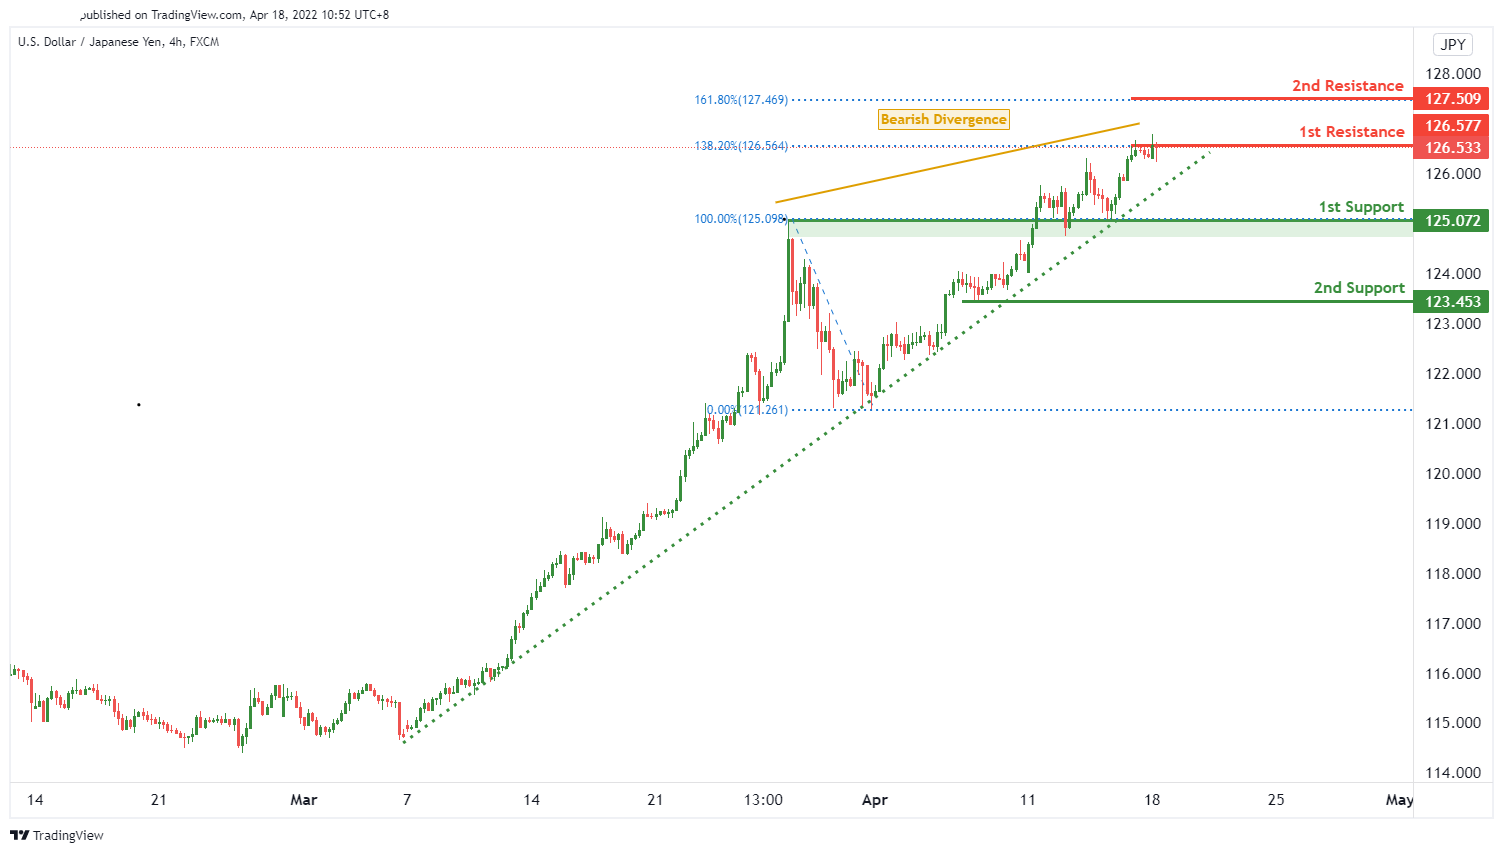
We expect price to have a bearish reversal from 1st resistance level of 126.577 in line with 138.2% fibonacci extension towards the 1st support level of 125.072 in line with graphical pullback support. Alternatively, price could continue to rise to 2nd resistance of 127.509 in line with 161.8% Fibonacci extension.
Areas of consideration:
- H4 time frame, 1st resistance at 126.577
- H4 time frame, 2nd resistance at 127.509
- H4 time frame, 1st support at 125.072
- H4 time frame, 2nd support at 123.453
AUD/USD:
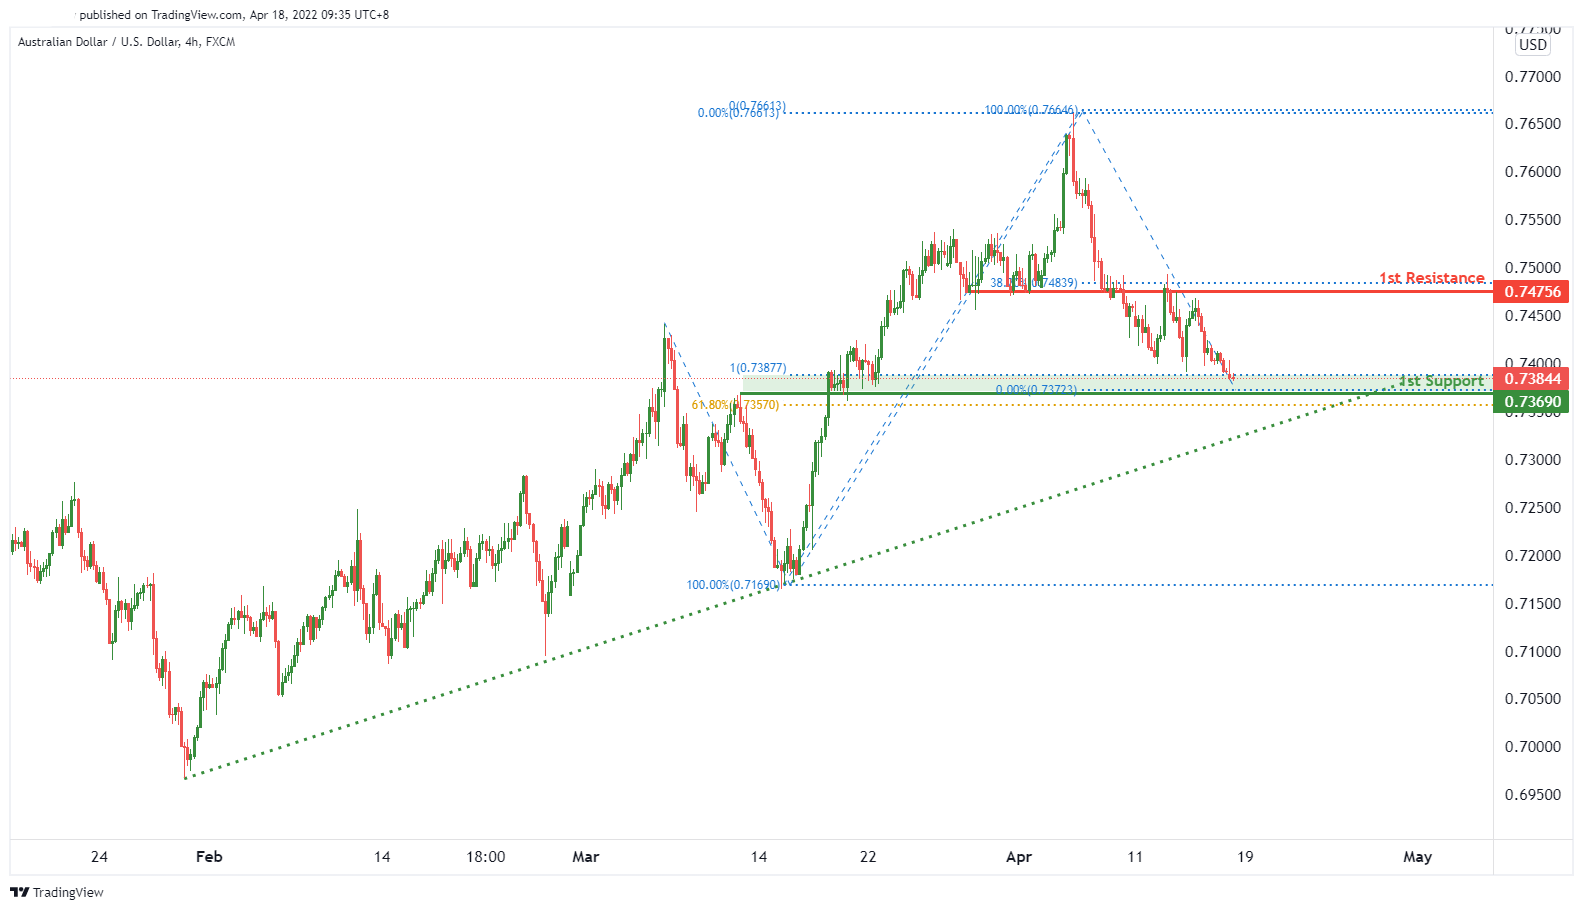
On the H4 timeframe, we see the potential for a bullish bounce from our 1st support level at 0.73690 in line with 61.8% Fibonacci retracement and 100% Fibonacci projection towards our 1st resistance level at 0.74756 in line with 38.2% Fibonacci retracement.
Areas of consideration
- H4 1st resistance at 0.74756
- H4 1st support at 0.73690
NZD/USD:
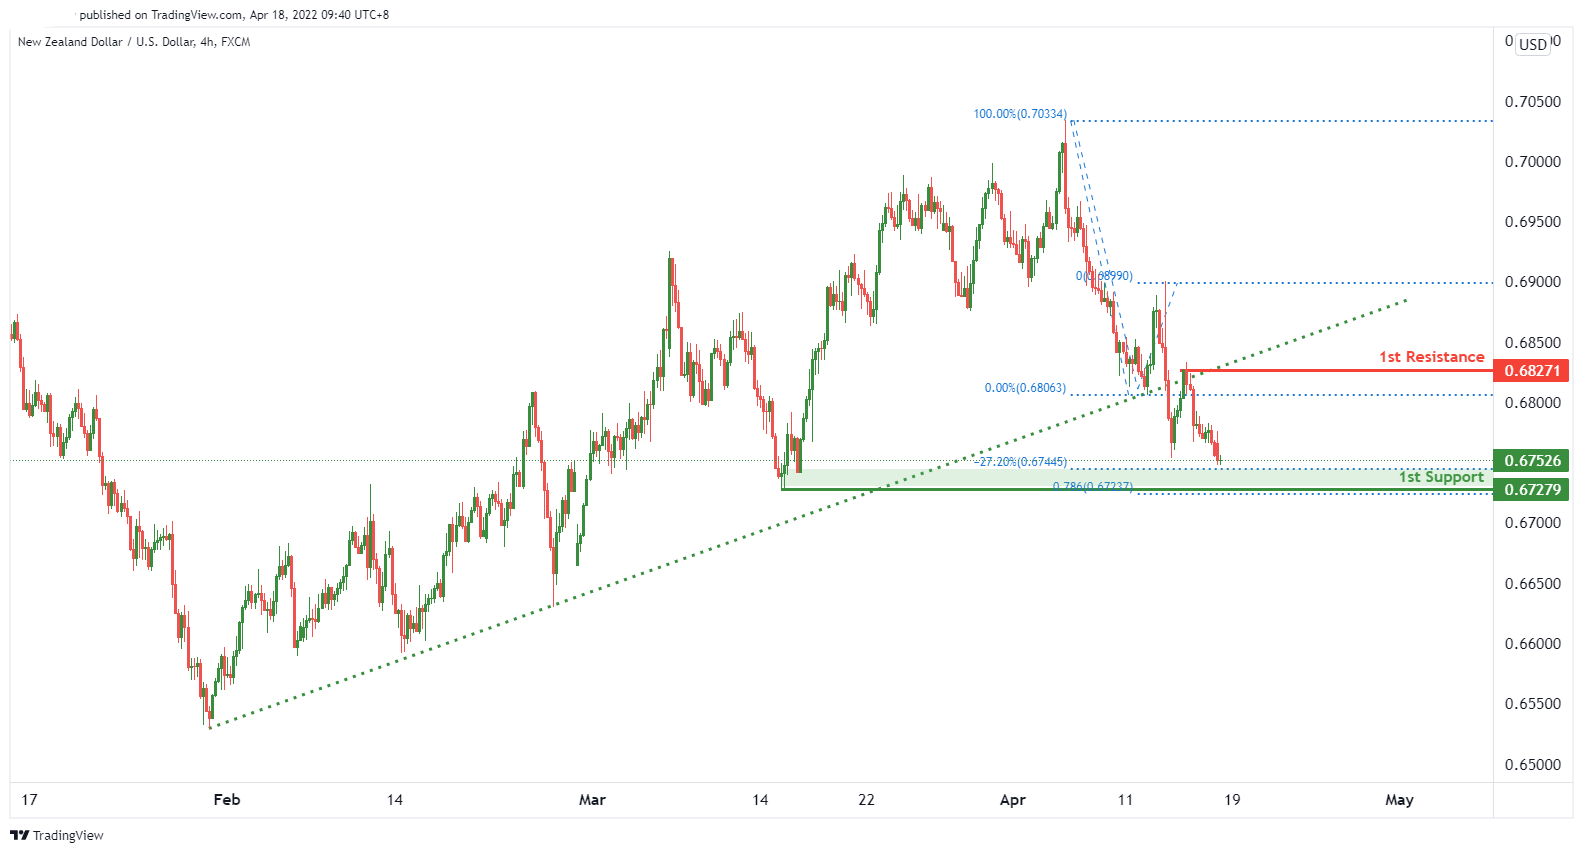
On the H4, we expect to see a potential for a bullish continuation from our 1st support of 0.67279 in line with 78.6% Fibonacci projection and -27.2% Fibonacci expansion towards our 1st resistance level at 0.68271 in line with graphical swing high resistance.
Areas of consideration:
- H4 time frame, 1st support at 0.67279
- H4 time frame, 1st resistance at 0.68271
USD/CAD:
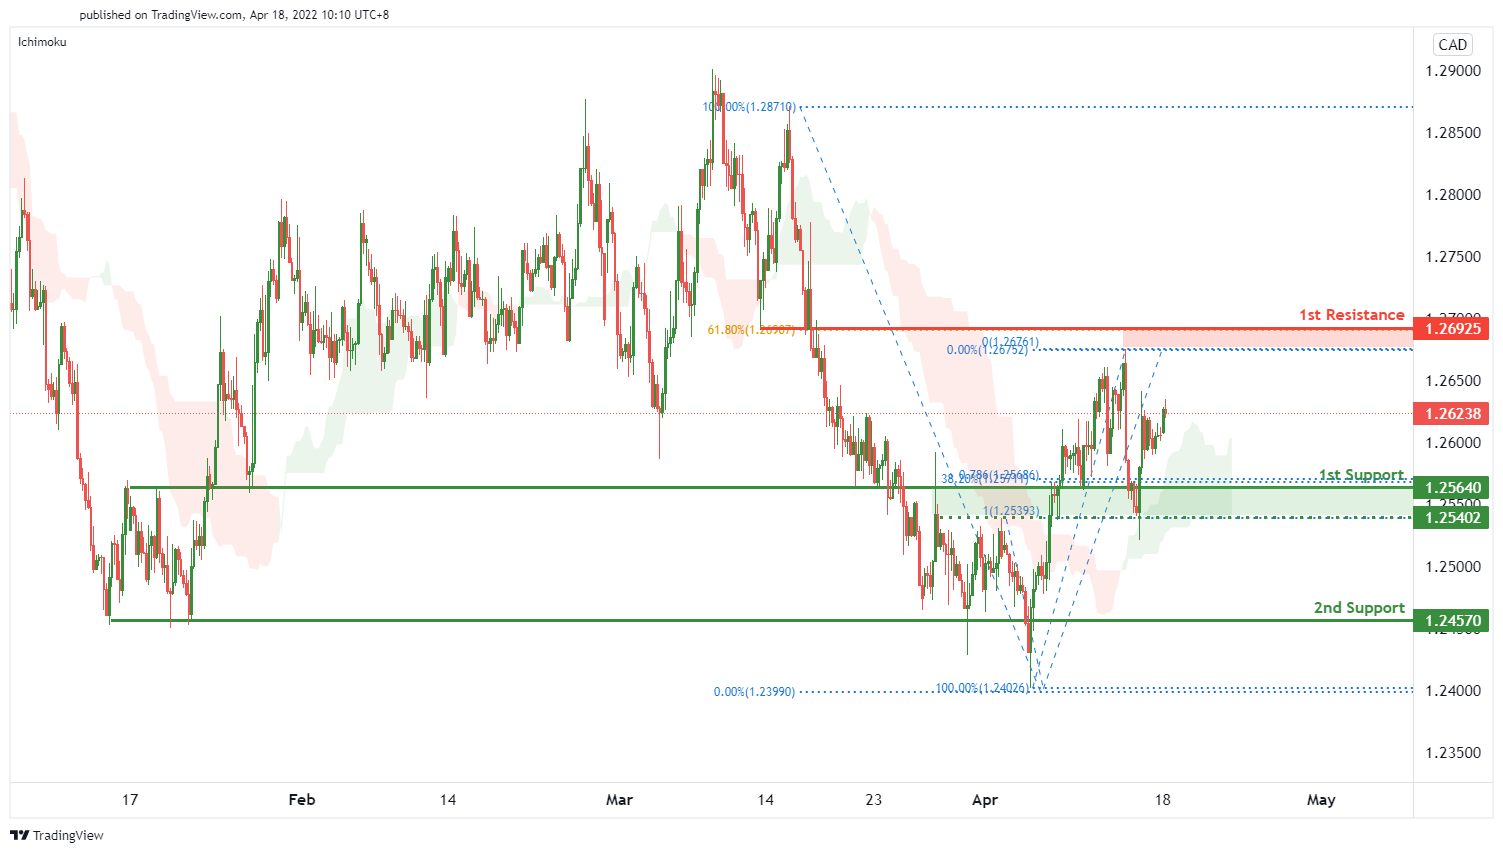
We expect price to be on a bullish continuation from 1st support level of 1.25640 in line with 38.2% Fibonacci retracement and 78.6% Fibonacci projection towards the 1st resistance of 1.26925 in line with 61.8% Fibonacci projection. Our bullish bias is further supported by price trading above ichimoku cloud.
Areas of consideration:
- H4 time frame, 1st resistance at 1.26925
- H4 time frame, 1st support at 1.25640
- H4 time frame, 2nd support at 1.24570
OIL:
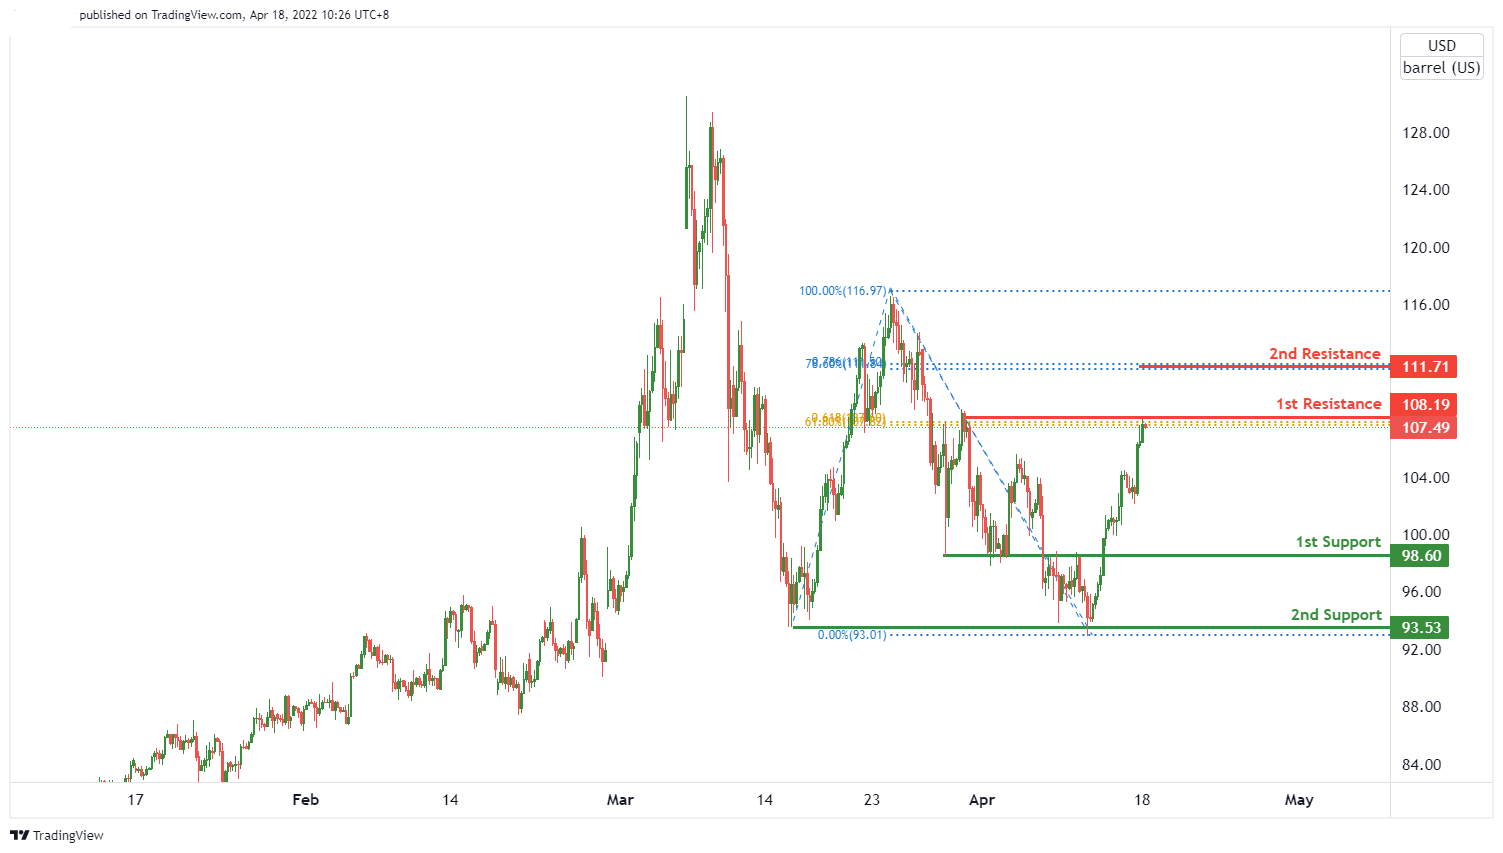
Price is near to the key pivot level. We are expecting oil price to go for a bearish reversal from 1st resistance level of 108.19 in line with 61.8% Fibonacci retracement and 61.8% Fibonacci projection towards the 1st support level of 98.6% lines up with graphical bullback support.
Areas of consideration:
- H4 time frame, 1st resistance of 108.19
- H4 time frame, 2nd resistance of 111.71
- H4 time frame, 1st support of 98.60
- H4 time frame, 2nd support at 93.53
Dow Jones Industrial Average:
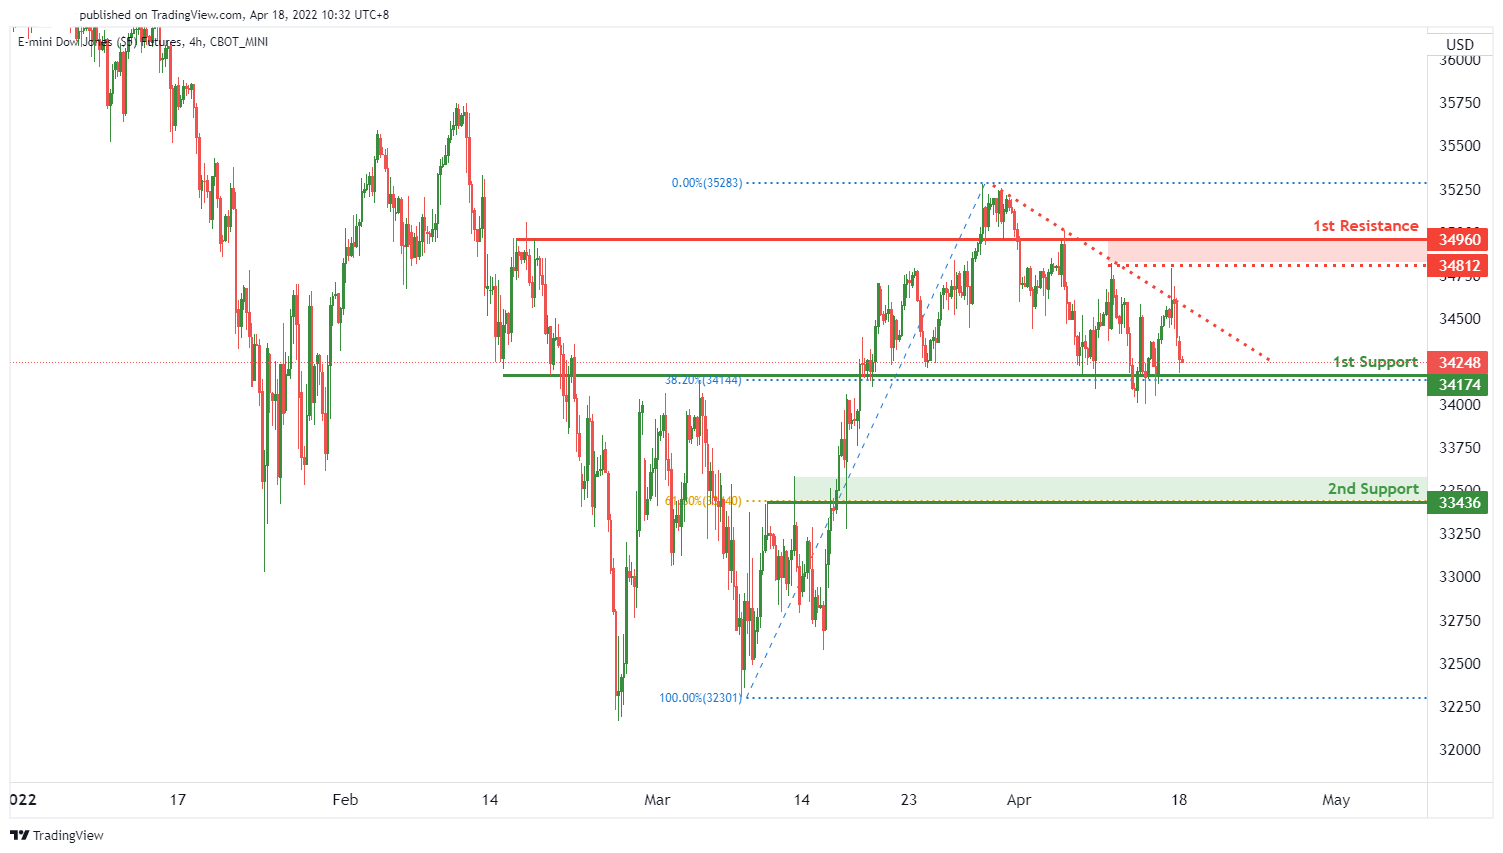
Price is near to the pivot level. We can see a potential for a bullish bounce from 1st support level of 34174 lines up with 38.2% fibonacci retracement, along with a pullback support towards the 1st resistance level of 34960 lines up with previous graphical swing high resistance.
Areas of consideration :
- H4 time frame, 1st resistance at 34960
- H4 time frame, 1st support at 34174
- H4 time frame, 2nd support at 33436
EUR/USD At Risk of More Downsides Below 1.0750
Key Highlights
- EUR/USD extended decline below the 1.0820 support.
- A key bearish trend line is forming with resistance near 1.0915 on the 4-hours chart.
- GBP/USD could accelerate lower if it settles below 1.3000.
- USD/JPY traded to a new multi-year high above 126.00.
EUR/USD Technical Analysis
The Euro started a major decline from well above the 1.0850 level against the US Dollar. EUR/USD declined below the 1.0800 support level to move into a bearish zone.
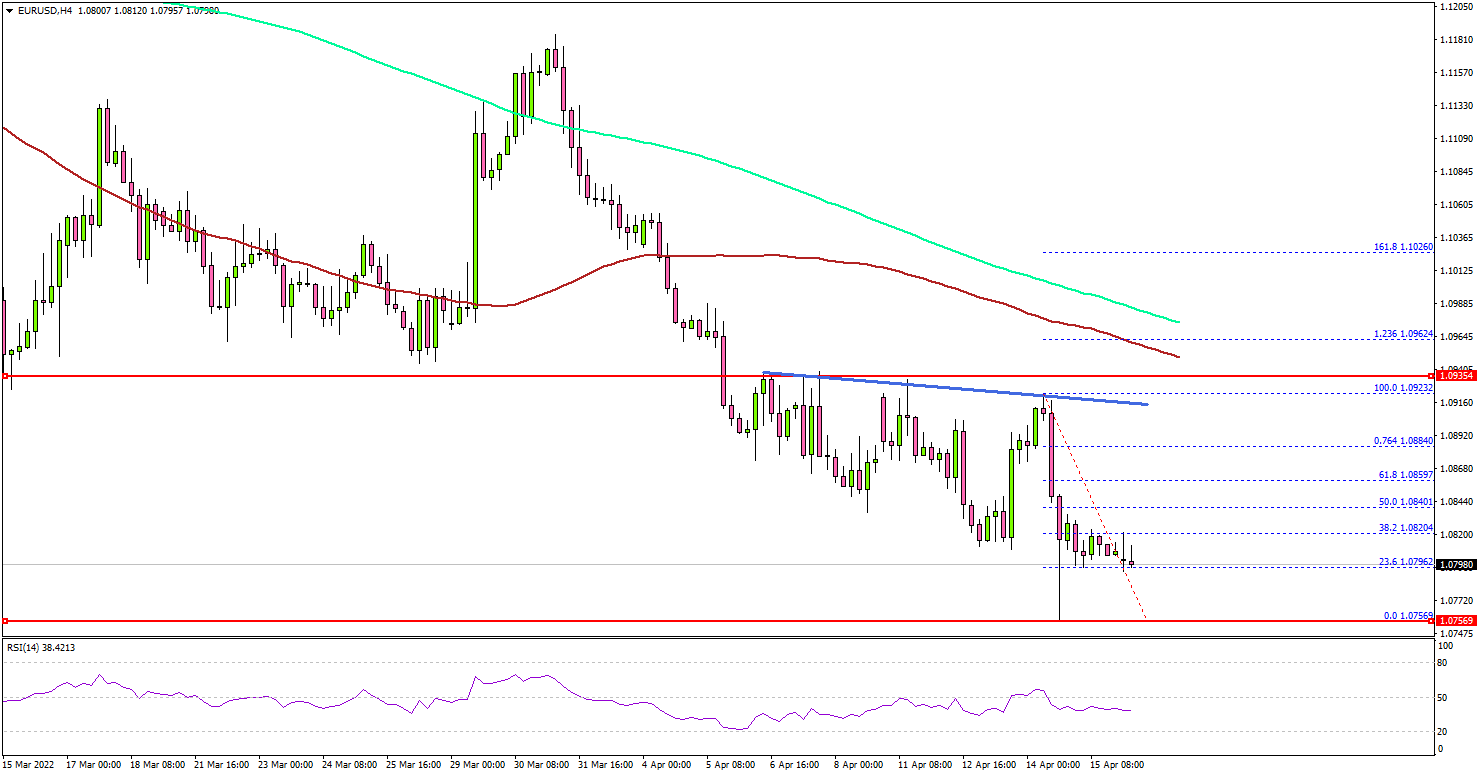
Looking at the 4-hours chart, the pair attempted a recovery wave from the 1.0756 low. However, it stayed below the 1.0850 pivot level, the 200 simple moving average (green, 4-hours), and the 100 simple moving average (red, 4-hours).
It is now consolidating near the 1.0800 level. An initial support on the downside is near the 1.0780 level. The next major support is near the 1.0750 level. A downside break below the 1.0750 support level might accelerate losses.
The next major support is near the 1.0680 level. If there is an upside correction, the pair might face resistance near the 1.0840 level.
The next major resistance is near the 1.0860 level, above which it could rise towards the 1.0900. There is also a key bearish trend line forming with resistance near 1.0915 on the same chart. A clear move above the trend line could push EUR/USD towards the 1.0950 resistance.
Looking at GBP/USD, the pair failed to recover above the 1.3150 resistance zone and started a fresh decline towards the 1.3000 level.
Economic Releases
- NAHB Housing Price Index for April 2022 - Forecast 77, versus 79 previous.
Forex and Cryptocurrencies Forecast
EUR/USD: Fed's Apples and ECB's Oranges
The dollar continues to strengthen, while the EUR/USD pair moves down. A week's low was recorded at 1.0757 after the ECB meeting on Thursday, April 14. After correction, the final chord, sounded at around 1.0808.
We named three reasons for the growth of the US currency in the previous forecast. The first is the difference between the monetary policies of the Fed and the ECB. Now, the probability of further tightening the position of the US Central bank has increased even more against the background of the latest data on inflation in the United States: the consumer price index has exceeded the forty-year high and reached 8.5%. Such an acceleration of inflation may force the regulator to act more vigorously and to revise its plans to raise the key rate and reduce the balance sheet in May.
New York Fed President John Williams, who is also vice chairman of the FOMC (Federal Open Market Committee), said in an interview with Bloomberg that it makes sense for the Fed to bring interest rates to a neutral level as soon as possible, which, not stimulating, it does not hinder economic growth, and is in the range from 2% to 2.5%. Therefore, a 0.5% increase in federal borrowing costs at the May FOMC meeting looks quite realistic.
In contrast to the Fed's hawks, their European counterparts remain extremely dovish. The ECB left the interest rate unchanged at 0% at its meeting on April 14, which, in fact, was expected. Moreover, the Bank's representatives have already said earlier that the growth in the cost of lending in the context of continuing economic uncertainty could do more harm than good.
The head of the regulator, Christine Lagarde, confirmed at a press conference that followed the meeting that the ECB is moving more slowly than the Fed, and that the Eurozone will be hit harder by the military actions in Ukraine. The American and European economies, according to Ms. Lagarde, are as incomparable as apples and oranges. Such a fruity allegory made a strong impression on the market, as a result of which the EUR/USD pair collapsed to the zone of two-year lows.
Indeed, the current economic situation in the euro area does not inspire optimism and, according to many experts, will continue to worsen in the future. The German economic sentiment index published last week fell to a new multi-month low: minus 41.0 (minus 39.3 a month earlier). The index of current economic conditions of this locomotive of the European economy also fell to minus 30.8 in April (minus 21.4 in March). Against this background, the German GDP growth forecast for 2022 was lowered from 4.5% to 2.7%.
The situation may become even more complicated, as the President of the European Commission Ursula von der Leyen and the head of EU diplomacy Josep Borrell announced their intention to include restrictions on the export of hydrocarbons from Russia in the next package of anti-Russian sanctions. Thus, the risk of stagflation in Europe remains at a fairly high level.
We mentioned another reason for the pressure on the euro - the presidential elections in France in the previous review. Their first round took place on Sunday April 10. So far, the incumbent President Emmanuel Macron is leading with 27.84% of the vote. Marine Le Pen, head of the far-right National Rally Party, gained 23.15%. The gap is not very large and there is still a possibility that the opposition may win in the second round on April 24. Its leader Marine Le Pen is a Eurosceptic. Please note that she called for almost the exit of the country from the Eurozone back in 2017. And if this lady comes to power, the EUR/USD pair, according to a number of analysts, may fall to the level of 1.0500, or even lower.
There is another factor pushing the pair south, which is the deterioration of global risk appetite. The S&P500 stock index has been falling for the third week in a row, while demand for safe-haven assets such as the dollar and US Treasuries, on the contrary, is growing.
At the moment, 50% of analysts vote for further strengthening of the dollar. The opposite opinion is shared by 40% and the remaining 10% of experts have taken a neutral position. All trend indicators and oscillators on D1 are colored red, although 15% of the latter give signals that the pair is oversold.
The nearest support is located at the level of 1.0800. The nearest target for EUR/USD bears will be April 14 low at 1.0757. And if they manage to break through this support, they will then aim for the 2020 low of 1.0635 and the 2016 low of 1.0325. The bulls will try to lift the pair above the 1.1000 level and, if possible, reach the 1.1050 zone. But to do this, they first need to overcome the 1.0840 and 1.0900-1.0930 resistances.
The upcoming week's calendar includes speeches by Fed and ECB heads Jerome Powell and Christine Lagarde on Thursday April 21. Data on unemployment and manufacturing activity in the US will also be published on this day. As for the indicators of business activity in Germany and the Eurozone as a whole, they will become known on Friday, April 22.
GBP/USD: Battle for 1.3000
In the previous forecast, most experts (65%) supported the correction of the GBP/USD pair to the north and were absolutely right. It seemed at the beginning of the week that the victory was on the side of the bears: they managed to overcome the support in the 1.3000 zone and lower the pair to 1.2972.
Recall that 1.3000 is a key support/resistance level as it is not only the March 15 low, but also the 2021-2022 low. The bulls managed to seize the initiative on Wednesday, April 13, break through this resistance, reach the height of 1.3147 and complete the week also above it, at around 1.3060.
The pound was supported by a possible tactical victory of the Bank of England over the FRS in the fight for raising interest rates. Inflation in the UK increased from 6.2% to 7.0%. The Bank of England predicted that it would peak in April, accelerating to 7.2%. However, a number of banks did not agree with the regulator's opinion, believing that inflation will not stop at this point, reaching 9.0% in April, and then its growth will continue. Therefore, the Bank of England will have to do something about it. And this "something" is, of course, another increase in interest rates. It was this prospect that pushed the British currency to growth.
We can expect the battle for 1.3000 to continue next week. If the victory is on the side of the bears, they will try to update the April 13 low of 1.2972 and open the way to the November 2020 lows around 1.2850, and then to the September 2020 lows in the zone 1.2700. The nearest support is 1.3050. 30% of analysts vote for the victory of the bears, while the majority (70%) side with the bulls. The resistance levels are 1.3100, 1.3150 and the zone 1.3190-1.3215, then 1.3270-1.3325 and 1.3400. Among the indicators on D1, the advantage of the reds is evident. Among the oscillators, 75% are colored in this color, another 15% are green and 10% are neutral gray. Trend indicators have 100% on the red side.
Among the events concerning the economy of the United Kingdom, we can highlight the speeches of the Governor of the Bank of England Andrew Bailey on April 21 and 22. Data on business activity in the manufacturing and services sectors of the UK will also be published on Friday, April 22.
USD/JPY: Do We Expect New Anti-records from the Yen?
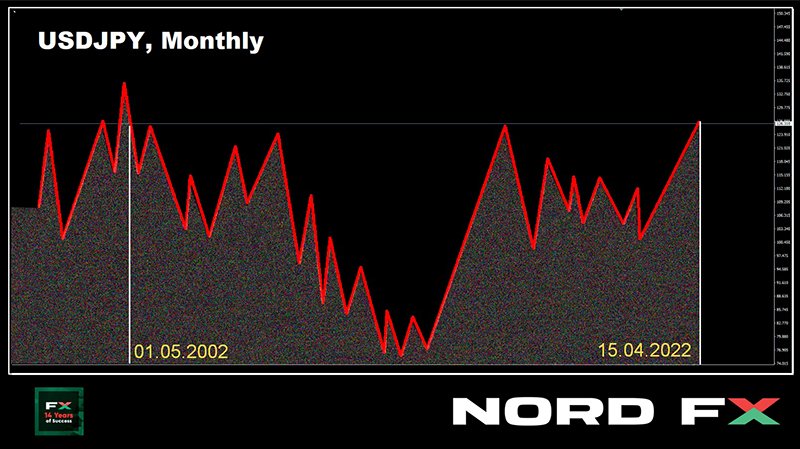
It seems that nothing can stop the fall of the yen and the growth of the USD/JPY pair. The Japanese currency sets an anti-record after an anti-record, and the pair recorded another high at 126.67. The last time it climbed so high was on May 01, 2002, that is, 20 years ago.
We noted in the last review that the majority of Japanese people are against the weak yen. However, despite this, the Bank of Japan still refuses to raise the key rate and reduce monetary easing. The regulator believes that maintaining economic activity is much more important than fighting inflation. And this divergence with the US Federal Reserve's monetary policy is pushing the USD/JPY further north.
The pair closed the week's trading session at 126.37. 45% of analysts vote for maintaining the uptrend next week. A little more, 55%, remembering a powerful correction to the south after a similar rally in the last week of March, expect something similar now. It should be noted here that when switching to the forecast for may-June, the number of supporters of the dollar strengthening increases to 80%. We have already cited Rabobank strategists who believe that a quick USD/JPY jump above 125.00 will seriously increase the likelihood that the Japanese regulator will revise its quantitative easing (QE) program. And this jump took place last week.
There is complete unanimity among the indicators on D1: 100% of trend indicators and 100% of oscillators look up, although 35% of the latter are in the overbought zone. Without a doubt, the main support in the coming days will be the levels of 126.00 and 125.00. Then, taking into account the high volatility of the pair, we can single out the zones 123.65-124.05, 122.35-123.00 and 120.60-121.30. As for the plans of the bulls, they will try to update the high of April 15, and rise above 127.00. An attempt to designate their subsequent goals, focusing on the levels of 20 years ago, will rather look like fortune telling.
There are no expected releases of any important statistics on the state of the Japanese economy this week.
CRYPTOCURRENCIES: April 12: Space Flight Day. But not for bitcoin.
It is impossible to call the first half of April successful for the crypto market. And if bitcoin was still trying to jump over the 200-day SMA two weeks ago, on April 04, then the bulls completely capitulated and a local low was recorded at $39.210 on April 12. It is noteworthy that Cosmonautics Day is celebrated on this day: Yuri Gagarin went into space and circled the planet Earth on April 12, 1961, for the first time in the world. The BTC/USD pair did not make a breakthrough to the stars. Rather, we observed a fall from orbit.
As of this writing, on the evening of Friday, April 15, the pair is trading around $40,440. The total market capitalization has slightly decreased and is still below the important psychological level of $2 trillion, at the level of $1.880 trillion. The Crypto Fear & Greed Index did not stay in the previous orbit either: it fell from 37 to 22 points and returned to the Extreme Fear zone.
We wrote earlier that bitcoin has become a part of the global economy and now demonstrates a strong correlation with stock indices. Therefore, its quotes chart is largely congruent, first of all, with the S&P500 chart. So, as of March 2022, according to Arcana Research, the correlation coefficient between BTC and S&P500 was 0.497. The main cryptocurrency falls and rises after the stock market. And that, in turn, falls or rises depending on the actions of the US Federal Reserve. There is no longer any question of bitcoin's independence.
As we have already mentioned, there has recently been a clear trend towards the accumulation of digital gold. The volumes of accumulation began to exceed emission many times over. According to Glassnode, the rate of outflow of coins from centralized platforms has increased to 96,200 BTC per month, which is extremely rare in historical retrospect. In addition to the "whales", the so-called "shrimps" (addresses with a balance of less than 1 BTC) also contributed to the accumulation. So why doesn't hodle sentiment lead to higher prices?
The answer is simple: no new investors. The old ones either go into the state of long-term holders of coins, or get rid of them. Approximately $439 million worth of crypto positions were liquidated on April 12 alone, according to Coinglass. At the same time, more than 88% of closed orders accounted for long positions. Bitcoin futures contracts for $160 million were also closed. But there is no strong inflow of new investments into the crypto sector.
Investors have lost their appetite for risk since the end of March, the DXY dollar index and US 10-year bond yields reach new highs on a regular basis. Due to rising inflation, which reached 8.5% in the US in March, the markets are waiting for the US Central Bank to raise interest rates again at the May meeting, and not by 0.25%, but immediately by 0.5%. This is the reason why interest from high-risk assets flows to more conservative instruments.
According to Bloomberg analysts, the value of the flagship cryptocurrency may soon fall to $26,000. The experts emphasized that if the technical analysis pattern called "bear flag" works, then such a scenario will be inevitable. In their opinion, the BTC rate is now on its way to testing a key support level around $37,500. If it does not hold above this mark, the market is in for a disaster.
Analyst Jeffrey Halley's forecast sounds slightly more optimistic. He believes that the flagship cryptocurrency continues to trade within the established range, the lower limit of which is at $36,500. If BTC falls even more, it can lead to serious losses for traders and investors. However, if the price of bitcoin soars in the near future above the upper limit of the range of $47,500, this will be a prerequisite for reaching a new record high.
There are also influencers who are not worried or upset by the current market situation at all. These include Michael Saylor, CEO of Microstrategy, a company known for its investments in bitcoin, and Cathie Wood, head of investment company Arch Invest, who still believe in bitcoin and look forward to its growth.
Saylor and Wood spoke at the Bitcoin 2022 conference in Miami and concluded that the Fed's monetary policy will continue to be inflationary, pushing prices up. In such a situation, according to Cathie Wood, bitcoin, as a means of hedging, has great potential for growth and its price could reach a record $1 million per coin. "It takes quite a bit of effort to do this," the head of Arch Invest said. "We don't need much. All we need is for 2.5% of all assets to be converted to bitcoin."
Well-known writer and investor Robert Kiyosaki has a similar opinion, he believes that the US dollar and other markets are on the verge of collapse due to rising food, oil and energy prices, as well as widespread inflation. The author of the bestselling book Rich Dad Poor Dad assured that what is happening in the world of finance is a sign of a coming crisis, and this process will simply destroy half the US population. He noted that cryptocurrencies in this situation are a good tool to reduce risks, but not all people resort to using this asset class. Kiyosaki emphasized that now 40% of Americans do not even have $1,000 in their savings. The inflation rate is rising, and this figure will soon exceed 50%. Then, according to the investor, a revolution will begin.
Morningstar analysts posted a report claiming that cryptocurrencies are no match for the stock and bond markets in terms of returns. At the same time, they note that bitcoin "is still too risky to be compared to gold." The authors of the report argue that, despite the prospect of significant profits that the cryptocurrency market can offer its participants, one must be very careful with it. "Every breathtaking rally has led to an equally brutal crash at the end," Morningstar notes.
It is difficult to argue that speculation or investment in digital assets is quite risky. But there are certain things in this business, as in any other, that allow you to get additional benefits. It is about them that we regularly talk about in our crypto life hacks section. This time it's about heat energy and a man named Jonathan Yuan who has kids who love to swim in the pool. However, they almost did not do this because the water was too cold.
Yuan himself is actively involved in mining and drew attention to the fact that his equipment generates too much heat. He purchased a heat exchanger and used it to install a system for heating water. According to him, thanks to this invention, the temperature in the pool can be maintained at about 32° C, and the crypto farm receives a water cooling system. Jonathan Yuan notes that almost everything can be heated according to this principle: living premises, garages and so on. It is assumed that the heating temperature can reach a maximum threshold of 60°C.
There are nuances here, however. When the inventor pushed his ASIC miners to the limit, the temperature in the pool rose above 43°C. His children did not like it either and they stopped swimming again. So, the ancient Greek "father" of medicine, Hippocrates, was right, saying "good things in small doses"