
Sample Category Title
AUD/USD Daily Report
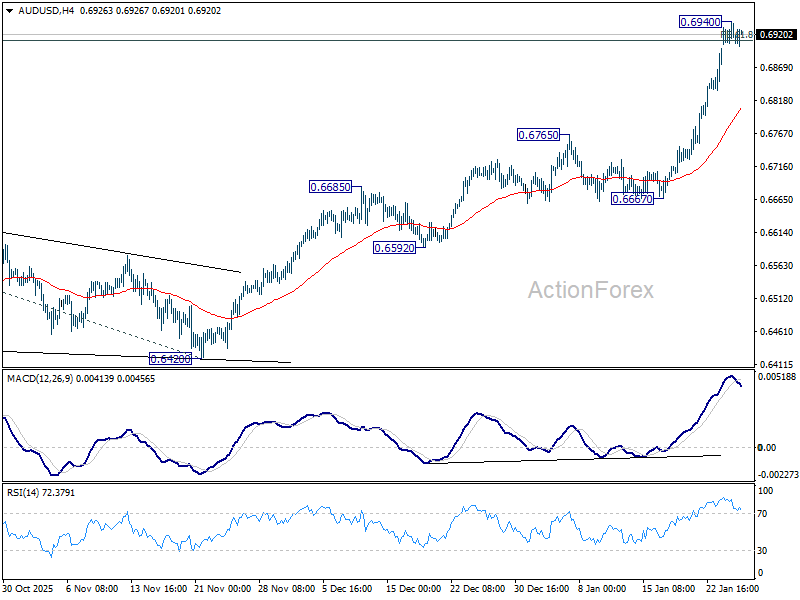
Daily Pivots: (S1) 0.6902; (P) 0.6922; (R1) 0.6937; More...
Intraday bias in AUD/USD is turned neutral first with 4H MACD crossed below signal line, and some consolidations could be seen. But further rise is expected as long as 55 4H EMA (now at 0.6802) holds. ON the upside, sustained trading above 61.8% projection of 0.5913 to 0.6706 from 0.6420 at 0.6910 will pave the way to 100% projection at 0.7213.
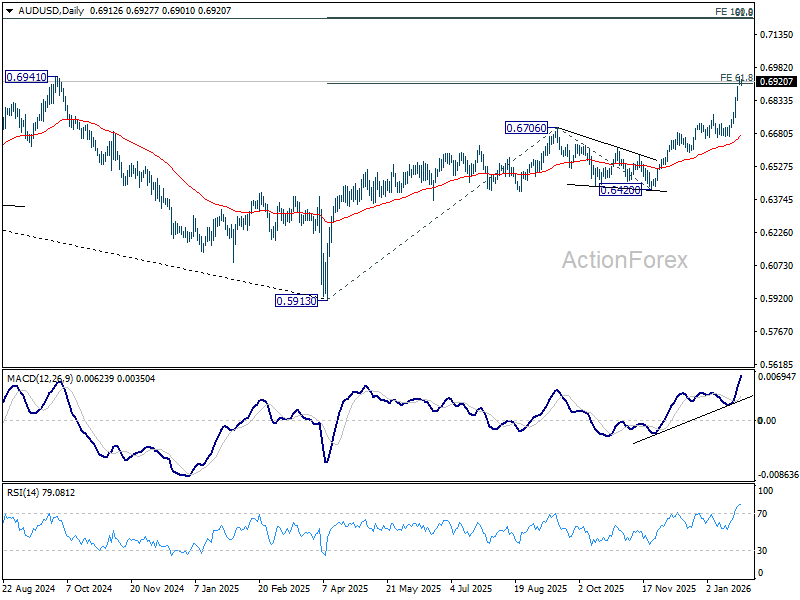
In the bigger picture, current development argues that rise from 0.5913 (2024 low) is reversing whole down trend from 0.8006 (2021 high). Further rally should be seen to 61.8% retracement of 0.8006 to 0.5913 at 0.7206. This will remain the favored case as long as 0.6420 support holds, even in case of deep pullback.
USD/CAD Daily Outlook
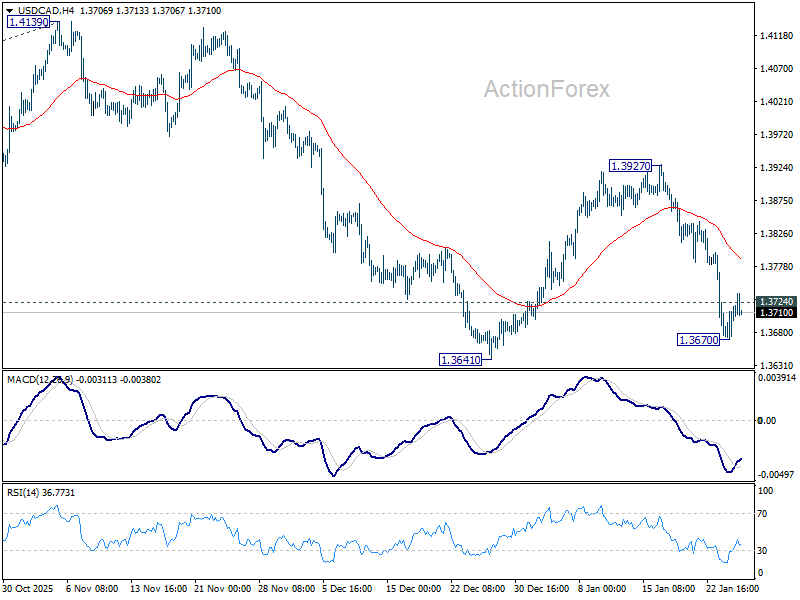
Daily Pivots: (S1) 1.3682; (P) 1.3701; (R1) 1.3730; More...
Intraday bias in USD/CAD is turned neutral with current recovery, and some consolidations would be seen above 1.3670 temporary low. Risk will stay on the downside as long as 55 4H EMA (now at 1.3788) holds. Below 1.3670 will bring retest of 1.3641 support. Firm break there will will resume the decline from 1.4139 and target a retest on 1.3538 low.
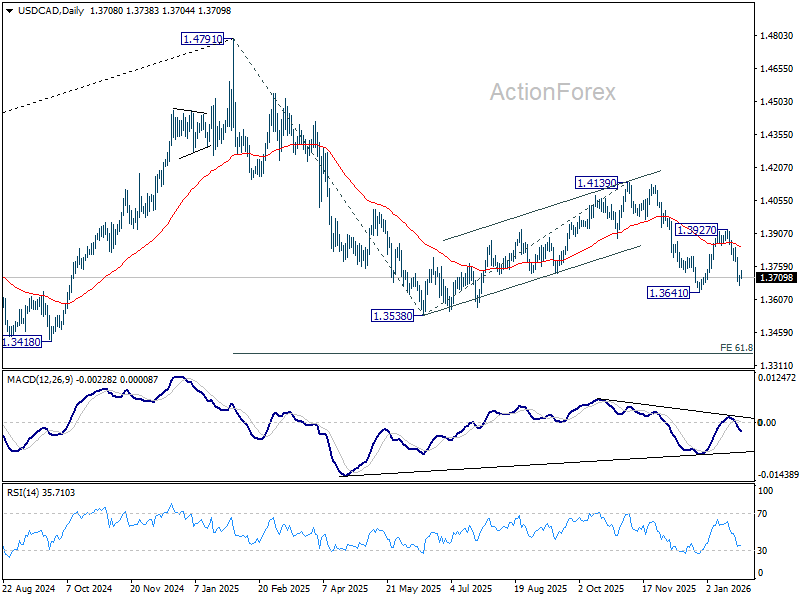
In the bigger picture, price actions from 1.4791 are seen as a corrective pattern to the whole up trend from 1.2005 (2021 low). Deeper fall could be seen as the pattern extends, and break of 1.3538 will target 61.8% retracement of 1.2005 to 1.4791 at 1.3069. For now, medium term outlook will be neutral until there are signs that the correction has completed, or that a bearish trend reversal is confirmed.
AUD/CAD rises to 0.95, waits on Ausssie CPI verdict for next surge
Aussie has steadied after last week’s strong advance, entering consolidation as markets brace for Q4 inflation data that could prove pivotal for RBA's policy in the near term. With expectations firmly skewed toward a firm print, traders appear to wait for confirmation before extending long positions.
Consensus forecasts point to a renewed pickup in inflation. Headline CPI is expected to rise to 3.6%, while trimmed mean CPI is forecast at 3.2%, pushing both measures further above the RBA’s target band. The upcoming release is likely to reinforce concerns that inflation pressures remain sticky. That would make it harder for the RBA to justify an extended pause, particularly with labor market conditions showing renewed strength.
Market opinion remains divided on timing. Some see scope for a 25bp hike as early as next week, while others argue the RBA may prefer to wait another quarter to avoid premature action. Ultimately, the decision will hinge on the size and composition of the inflation print, alongside the bank’s assessment of broader economic conditions.
Technically, AUD/CAD edged higher this week and remains on upward acceleration mode as seen in D MACD. With current momentum, AUD/CAD should be on track to 161.8% projection of 0.l8902 to 0.9225 from 0.9055 at 0.9578, or even further to 200% projection at 0.9701. Outlook wil stay bullish as long as 0.9344 resistance turned support holds, in case of retreat.
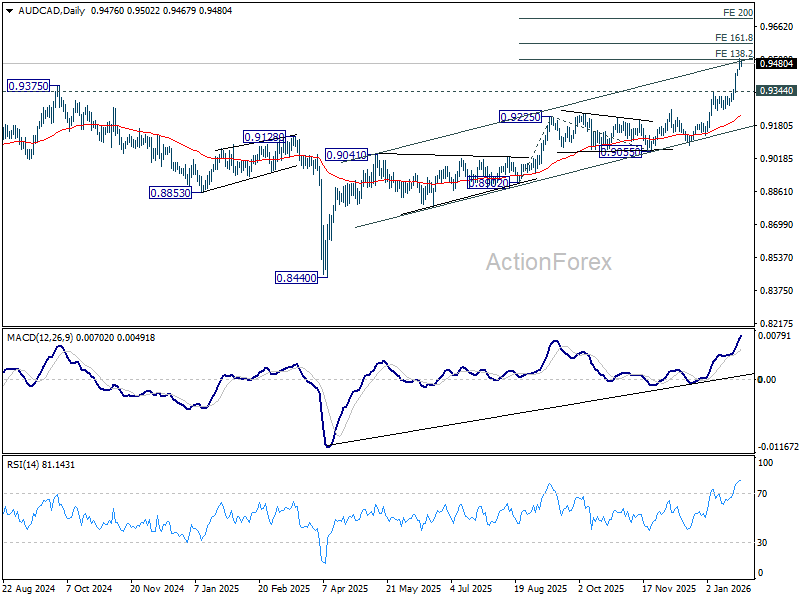
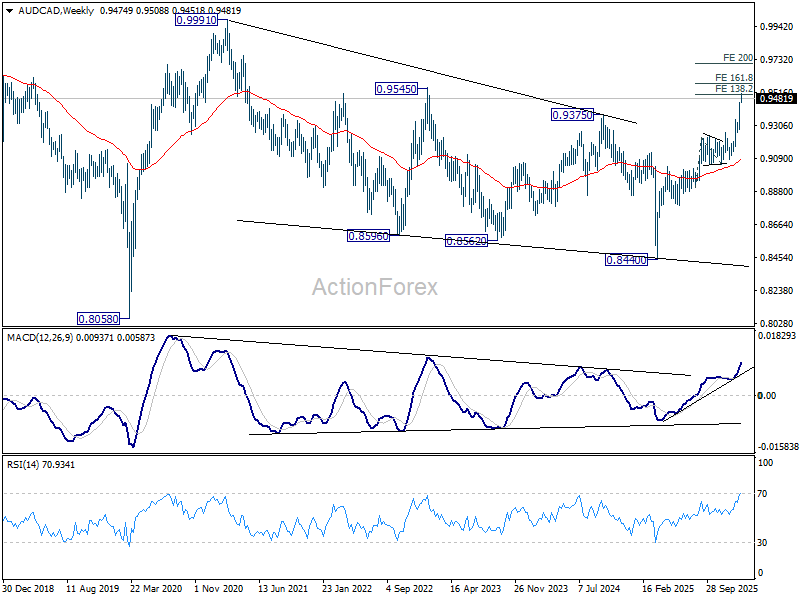
In the bigger picture, last week's strong break of 0.9375 key resistance (2024 high) should confirm that whole down trend from 0.9991 (2020 high) has completed as a correction to 0.8440 (2025 low). There is prospect for the current up trend to extend in the medium term to have a test on 0.9991 at least.
How far and how fast AUD/CAD extends will ultimately depend two factors: The pace and extent of RBA tightening; and the depth of deterioration in Canada–US trade relations.
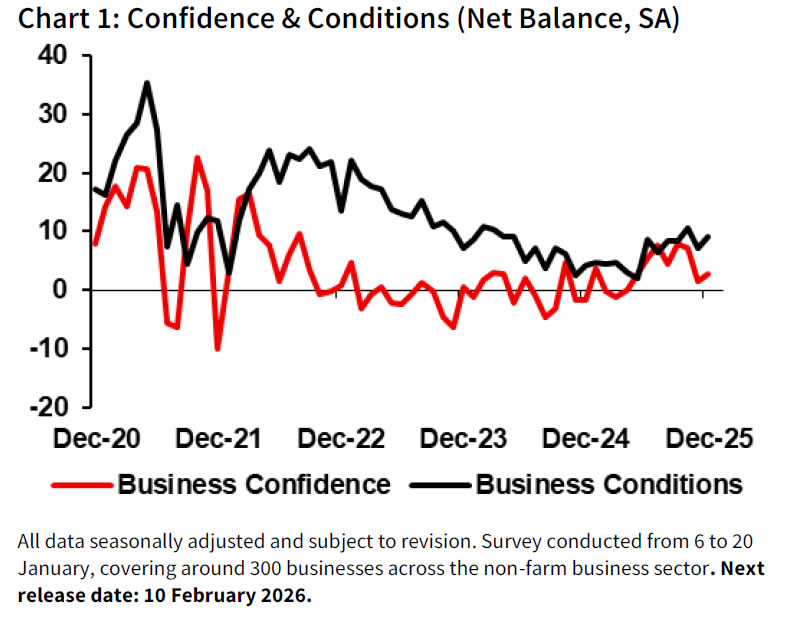
Australia NAB business survey reinforces solid backdrop for RBA
Australia’s NAB business survey showed a modest but broad-based improvement in December, pointing to resilient momentum into year-end. Business Confidence edged up from 2 to 3, while Business Conditions rose from 7 to 9.
The details underline that improvement. Trading conditions climbed from 13 to 16, while profitability rose from 4 to 7. Employment conditions were unchanged at 4, suggesting hiring demand remains steady rather than accelerating. Capacity utilisation eased slightly to 83.2%, down from its recent peak but still well above its long-run average.
Cost pressures also edged higher, with purchase costs rising from 1.3% to 1.4% in quarterly equivalent terms, labor costs from 1.5% to 1.8%, and product prices from 0.6% to 0.9%, even as retail price growth slowed to 0.4% from 0.8% in November.
Overall, the survey suggests the economy ended the year on a firm footing, with most indicators sitting modestly above late-Q3 levels. Meanwhile, NAB noted that for the RBA, the small pullback in capacity utilization is unlikely to materially ease concerns that the economy remains close to capacity.
Trump Threaten to Raise South Korean Tariffs
Markets
Just the idea of a potential coordinated JPY intervention by the US and Japan sufficed for yen bears to back off. For now, we have to add, because we wouldn’t be surprised if the market will at some point test authorities’ resolve to actually step in. USD/JPY’s two-day slide ended at 154.18 yesterday after having traded as low as 153.31, below the 100 dMA. The currency pair is slightly recovering to 154.53 this morning as the dust is settling. The stronger JPY was much less visible in EUR/JPY: 183.17 compared to the 184.06 record high on Friday. Broader dollar weakness with spillovers from USD/JPY were visible elsewhere: in new record highs for the likes of gold, silver & platinum as well as in other FX pairs. EUR/USD which for the first time since September attempted to take out 1.19. That failed but the eventual 1.1880 closing level was the highest in more than four years nevertheless. GBP/USD rose to 1.368 compared to 1.34 mid last week. The trade-weighted dollar index kept the 97 barrier, a five-month low, afloat. Stocks struggled for direction in Europe while eking out some small gains in the US. Core bonds grabbed some kneejerk haven flows with Bunds outperforming Treasuries. Bund yields fell 2.6-3.9 bps in a bull flattener. US rates eased between 0.4 (2-yr) and 2.6 bps (20-yr). Gas prices grabbed some headlines too by shooting higher to a seven month high (storm Chandra) before paring gains again.
It’s unlikely we’ve seen the last in the JPY sage but for the time being it may move a bit to the background. We’ll have to see how market dynamics play out, for the US dollar in particular, with the economic calendar now slowly heating up in the US. The weekly ADP job creation numbers and Conference Board consumer confidence is up for release, along with some (second-tier) housing data and Richmond business confidence. They serve as a minor distraction from tomorrow’s FOMC policy meeting. The latter is at risk of being its thunder stolen by US President Trump announcing the new Fed chair shortly beforehand. European news centers around the free trade deal struck between the EU and India after nearly two decades of negotiations. The “mother of all deals”, dixit EC president von der Leyen, follows the Mercosur deal (still subject to EU Parliamentary approval) and cannot be decoupled from the changing global order and the move towards diversification – in this case away from the US and China - is central. Trump’s renewed tariff threat vs South Korea (see below), real or not is irrelevant, serves as case in point.
News and views
US President Trump threatened to raise South Korean tariffs on all goods covered by reciprocal tariffs along with cars, lumber and pharmaceutical goods from 15% to 25%. He blames the Asian country for slowplaying the trade deal both nations reached last year. Part of that deal included annual South Korean investments in the US. A bill to set up a $350bn investment fund is currently stalled in South Korean parliament. Concerns over the currency impact are one of the reasons for the delay given that KRW is trading near lowest levels against USD since 2009. The South Korean National Assembly so far also didn’t ratify both countries’ over trade agreement which is more of a Memorandum of Understanding and factsheet rather than a formal treaty. The Kospi initially shed 1.5% on the news, but managed to turn those early losses into 2.5% (!) gains. An all-time high for SK Hynix (+8%) on reports that the company is the sole supplier of advanced memory for Microsoft’s new AI chip helped enabling the turnaround.
UK shop price inflation rose by a strong 0.4% M/M in January, lifting annual growth from 0.7% to 1.5%, the fastest pace since February 2024. Details showed non-food prices rising by 0.1% M/M and 0.3% Y/Y (from -0.6%), while food price inflation accelerated by 1.1% M/M to 3.9% Y/Y (from 3.3%). The British Retail Consortium said that shop price inflation jumped due to high business energy costs and the hike to national insurance continuing to feed through to prices. Meat, fish and fruit were particularly affected, also reflecting weak supply and stronger demand, while non-food categories, including furniture, flooring, and health and beauty, all saw inflation rise.
To the Moon
The week started on a rather calm note across US and European equity markets. This is the first Monday since the start of the year that we can say this: equities opened quietly.
The rally in gold and silver stole the spotlight, as gold surged past the $5’000 per ounce level yesterday, and silver above $100. Both gave back gains during the session, but are once again strongly bid in Asian trading.
Part of the move is clearly speculative — there is no doubt about that. Gold’s volatility index spiked to its highest level since 2020, suggesting that a sizeable downside correction is more likely than not in the foreseeable future. But the fundamentals that pushed precious metals to these levels remain very much alive: exploding US debt and a potentially inappropriately dovish Federal Reserve (Fed) policy are making the US dollar increasingly vulnerable to inflation — in other words, to value deterioration. At the same time, US-induced trade and geopolitical tensions threaten the US dollar’s appeal as a reserve currency. Gold has overtaken US Treasuries in global central banks’ FX reserves. Hence, the long-term outlook for gold remains constructive. Historical data suggests that the rally could extend toward $6’500 per ounce.
As for silver, the parabolic rise clearly calls for a sharp correction — there is little doubt about that. Some, however, prefer to look at the chart on a logarithmic scale, arguing that relative value gains matter more than nominal ones. From that perspective, silver’s move — while impressive — remains broadly in line with historical trends. That suggests that once a pullback has run its course, the rally has little reason to stop, especially as the US dollar continues to lose its fundamental appeal.
Turning to the US dollar, it remains under pressure. The Fed starts its two-day policy meeting today. It is not expected to move on rates. Powell is unlikely to say much more than “we are watching the data and it tells us to wait before cutting further.” This lack of action is expected to trigger renewed fury from the White House. We could even hear the announcement of who might take over the Fed in the coming months. The issue is that the Fed still retains credibility under Jerome Powell, precisely because he has resisted political pressure. The day he is gone, that credibility could come into question — and a loss of faith in the Fed would likely be another tailwind for precious metals.
January is almost over, and amid all the focus on geopolitics and Black Swan risks, we nearly forgot to mark the anniversary of DeepSeek’s chatbot, which first emerged in January last year. Around this time last year, the arrival of the Chinese rival revived fears that advanced AI chatbots could be built using earlier-generation Nvidia chips — potentially making them cheaper while remaining highly efficient. US AI stocks dipped on those concerns, while a Chinese AI rally kicked off.
A year later, appetite for US AI exposure has not been materially dented by Chinese competition. Companies that sold off on the initial DeepSeek headlines — such as Nvidia, Alphabet and Microsoft — rebounded quickly and resumed their rally. Meanwhile, DeepSeek marked the beginning of a broader Chinese AI revival. The Hang Seng Index has rallied roughly 78% through 2025, recovering around two thirds of the losses suffered during the 2018–2022 meltdown.
Appetite for global tech — and AI-related stocks — remains strong, but questions arise. China may not yet have fully explored its upside potential. In the US, meanwhile, the rally is increasingly questioned amid concerns over overspending, leverage and the circular nature of AI-related deals.
The circularity of those deals — in simple terms, companies like Nvidia investing in their own customers so they can, in turn, buy Nvidia’s products — appears to irritate investors more than it worries Nvidia itself. On the contrary, Nvidia announced an additional $2 billion investment in CoreWeave to accelerate build-out and AI adoption. CoreWeave initially rallied around 10% at the open before giving back gains, while Nvidia slipped 0.64%, underscoring investor discomfort with circular funding structures. What investors want to see is money flowing into the AI ecosystem from outside — meaning from end users, enterprises and third-party businesses.
I remain confident that AI will ultimately deliver that external demand. The concern is timing: the speed of adoption may not match the speed of investment. By the time demand accelerates, some infrastructure risks becoming obsolete — implying that part of today’s capex could end up wasted. That is what investors will be watching closely in upcoming earnings: whether they stay invested, or cash out.
Returning to Nvidia, the stock also slipped after Microsoft unveiled its second-generation AI chip, which could reduce reliance on Nvidia’s hardware. That is negative for Nvidia, as hyperscalers such as Google, Meta and Amazon are pursuing similar strategies and together account for around half of Nvidia’s customer base. Nvidia, however, is not standing still. In the context of the CoreWeave deal, it announced to offer standalone CPU chips under the Vera brand, targeting a market long dominated by Intel and AMD.
Hence, things are not getting easier for Intel. After plunging 17% following earnings and a warning over manufacturing challenges, the stock fell another 5.7% yesterday on concerns that Nvidia is entering the CPU space. As per Nvidia, while this expansion could open a new revenue stream for Nvidia, competition will be fierce — and margin pressure is likely to follow.
South Korea Acts Swiftly after Trump Tariff Threat
In focus today
- In the US, Conference Board's January consumer confidence survey will be released in the afternoon. University of Michigan's flash survey suggested earlier that consumers have been feeling slightly more optimistic at the beginning of the new year.
- In Hungary, we expect the central bank to keep the policy rate unchanged at 6.50% at today's meeting.
Economic and market news
What happened over night
In South Korea, the ruling Democratic Party announced plans to pass a special act on the US trade deal by the end of February, following President Trump's threat to impose higher tariffs on South Korean exports. In a post on Truth Social, Trump stated that tariffs on South Korean autos, pharmaceuticals, lumber, and 'reciprocal' tariffs would rise to 25% from 15%, blaming the delay in the South Korean legislature's approval of the agreement. Shares of Hyundai and Kia initially dropped sharply but later recovered some of the losses.
What happened yesterday
In Germany, the IFO indicator was slightly disappointing in January. The current situation assessment rose modestly to 85.7 (cons: 86.0, prior: 85.6) while expectations edged lower to 89.5 (cons: 90.3, prior: 89.7). This contrasts with Friday's PMI data, which exceeded forecasts, with the composite index improving to 52.5. Based on a combination of these indicators, we estimate that the German economy maintained its growth momentum of 0.2% q/q from Q4 2025 in January. We expect an acceleration in growth as various tax cuts, increased subsidies, and the rollout of the infrastructure package, effective from 1 January, begin to support economic activity.
In commodities, gold prices reached record highs, surpassing USD 5,100/oz, while silver approached near all-time highs, signalling a strong shift toward safe-haven assets. This trend reflects heightened investor caution amid ongoing geopolitical tensions, a weaker US dollar, and increasing uncertainty around policy direction in major economies, amplified by President Trump's disruptive policy moves at the start of 2026.
In geopolitics, the deployment of a US aircraft carrier strike group closer to Iran signals increased military readiness and heightens the risk of further escalation in the Middle East.
Equities: Global equities were moderately higher on Monday, driven by the US. European markets started the day lower but rose when US markets opened. S&P 500 up 0.5% and Stoxx 600 0.2%. While the start of the year was all about the S&P495, the last trading sessions have seen renewed preference for US big tech. This continued yesterday, with communication and tech among the best performing sectors. Global large caps even beat small caps - for the first time this year, in fact. Positioning ahead of tech earnings starting Wednesday could be one trigger for the recent shift. Another could be the dollar weakening, which continued to slide -0.6%, resulting in preference towards the export-oriented US large caps that gain advantage from FX.
FI and FX: After an initial surge in volatility to start the week, the FX market calmed down a bit yesterday afternoon. EUR/USD briefly tested the waters above 1.19 before settling at high-1.18's. USD/JPY remains under scrutiny and scandies lost some ground as EUR/NOK and EUR/SEK both rose 5-6 figures each. European yields traded lower yesterday, whereas in the US the curve bull-flattened slightly. Trump's latest threats to raise tariffs on South Korea has seemingly only had a limited market impact thus far, and equities remain in green in Asia.
Chart Alert: Nasdaq 100 Bullish Breakout (Finally) from a 7-Week Range
Key takeaways
- Nasdaq 100 breaks higher after weeks of lagging: After underperforming US peers due to sector rotation away from mega-cap tech, the Nasdaq 100 has finally broken out of a 7-week consolidation range, signalling a bullish catch-up phase may be underway.
- Mega-cap earnings are the near-term catalyst: With Microsoft, Meta, Tesla, and Apple reporting Q4 earnings this week, results could jolt the index out of its slumber and validate the recent upside breakout.
- Technical and breadth signals now support the bullish bias: RSI has broken out of a descending trendline, price has cleared key resistance, and market breadth has improved meaningfully, with a growing share of Nasdaq 100 stocks trading above their 20-day and 50-day moving averages.
The mega-cap technology-heavy Nasdaq 00 has lagged its US peers and other major global benchmark stock indices, as it only recorded a meagre year-to-date gain of 1.8% as of Monday, 26 January 2026, underperforming the Dow Jones Industrial Average (+2.8%), and small-cap Russell 2000 (+7.2%), while slightly higher versus the S&P 500 (+1.5%) (see Fig. 1).
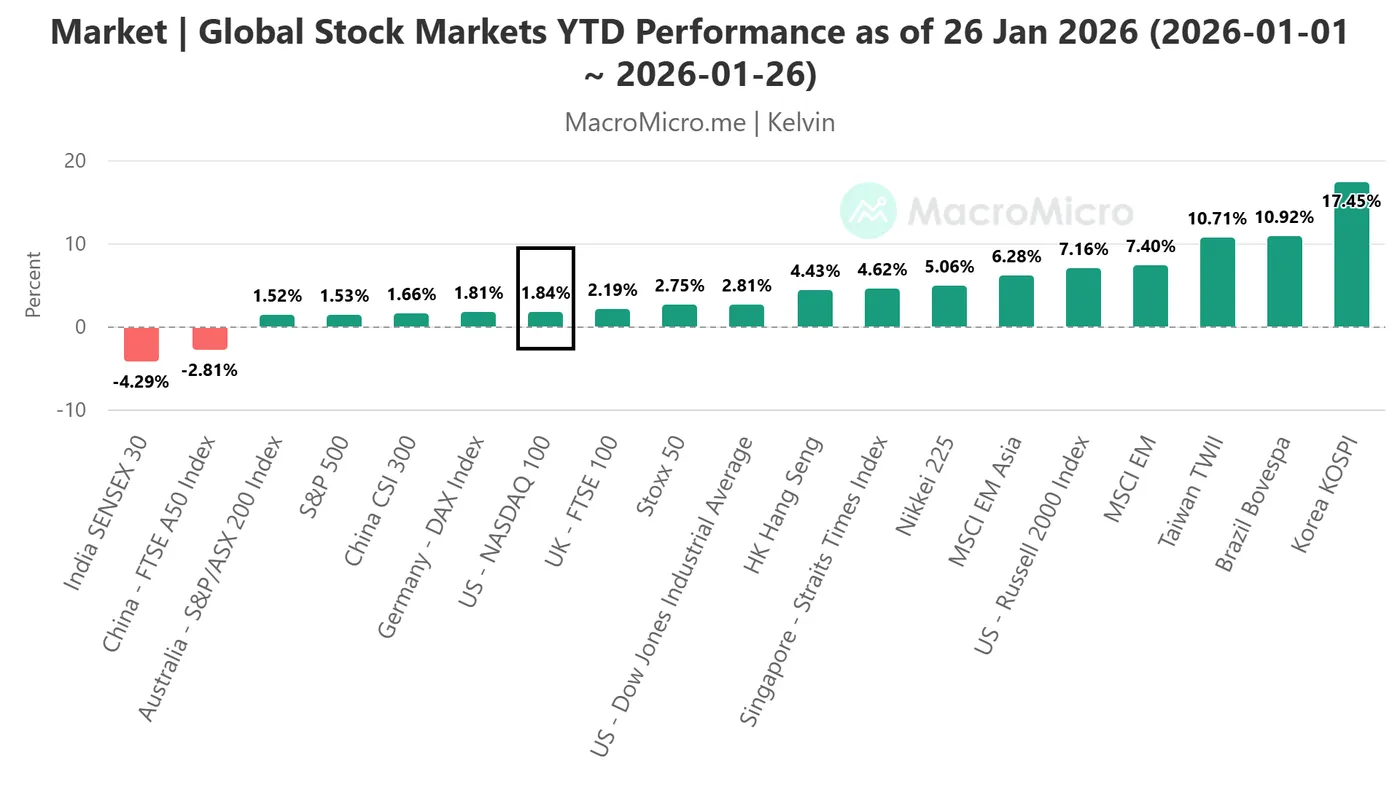
Fig. 1: YTD performance of US & global major stock indices as of 26 Jan 2026 (Source: MacroMicro)
The current underperformance of the Nasdaq 100 within the US stock market has been attributed to a sector rotation towards industrials, energy, and basic materials due to geopolitics and the current US White House administration’s expansionary/aggressive foreign policy.
Mega-tech earnings may jolt the Nasdaq 100 up from its slumber
A big earnings week for US mega-cap technology stocks as four of the so-called “Magnificent Seven” will report their respective Q4 2025 earnings results this week.
Microsoft, Meta Platforms, and Tesla will report their earnings results on Wednesday, 28 January, after the close of the US session, followed by Apple on Thursday, 29 January, also after the close of the US session.
Interestingly, technical factors are now indicating that the current laggard Nasdaq 100 is likely to stage a bullish catch-up.
Let’s reveal the relevant charts and the Nasdaq 100 short-term (1-3 days) trajectory
Short-term trend bias (1 to 3 days): Evolving into a bullish trend
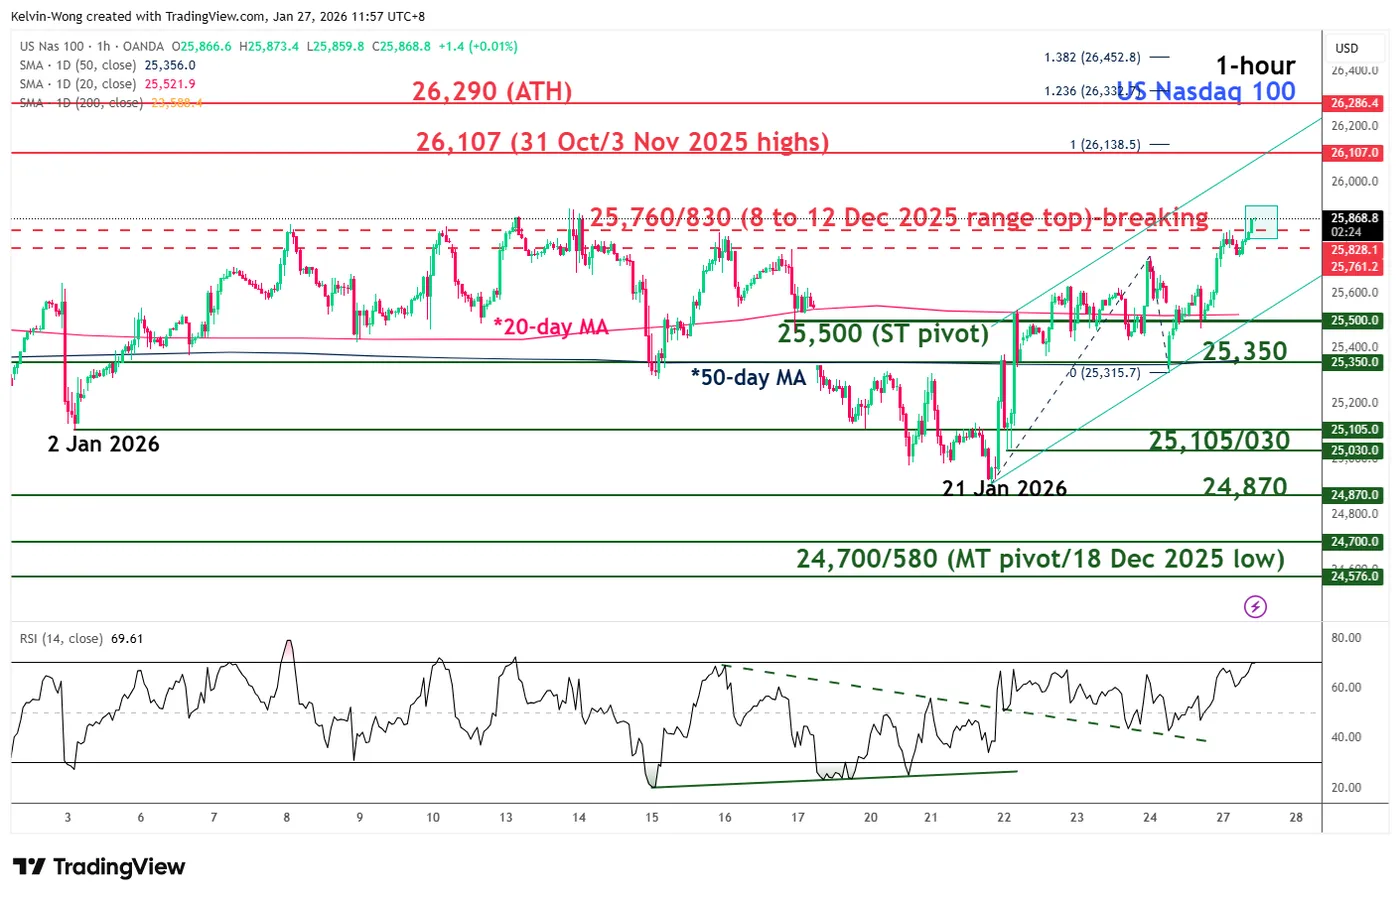
Fig. 2: US Nasdaq 100 CFD index minor trend as of 27 Jan 2026 (Source: TradingView)
After a choppy price configuration from 15 January to 21 January 2026, the US Nasdaq 100 CFD Index (a proxy for the Nasdaq 100 E-mini futures) has now evolved into a minor bullish trend, with an intraday bullish breakout above the 7-week range resistance zone at 25,760/25,830.
Watch the 25,500 short-term pivotal support (also the 20-day moving average) to maintain the bullish tone, with the next intermediate resistance coming in at 26,107, followed by the current all-time area of 26,290 in the first step.
On the flip side, a break with an hourly close below 25,500 invalidates the bullish scenario to see another round of choppy minor corrective decline sequence to expose the next intermediate support at 25,350 (also the 50-day moving average). Below it sees further potential weakness towards 25,105/25,030 support next.
Key elements to support the bullish bias
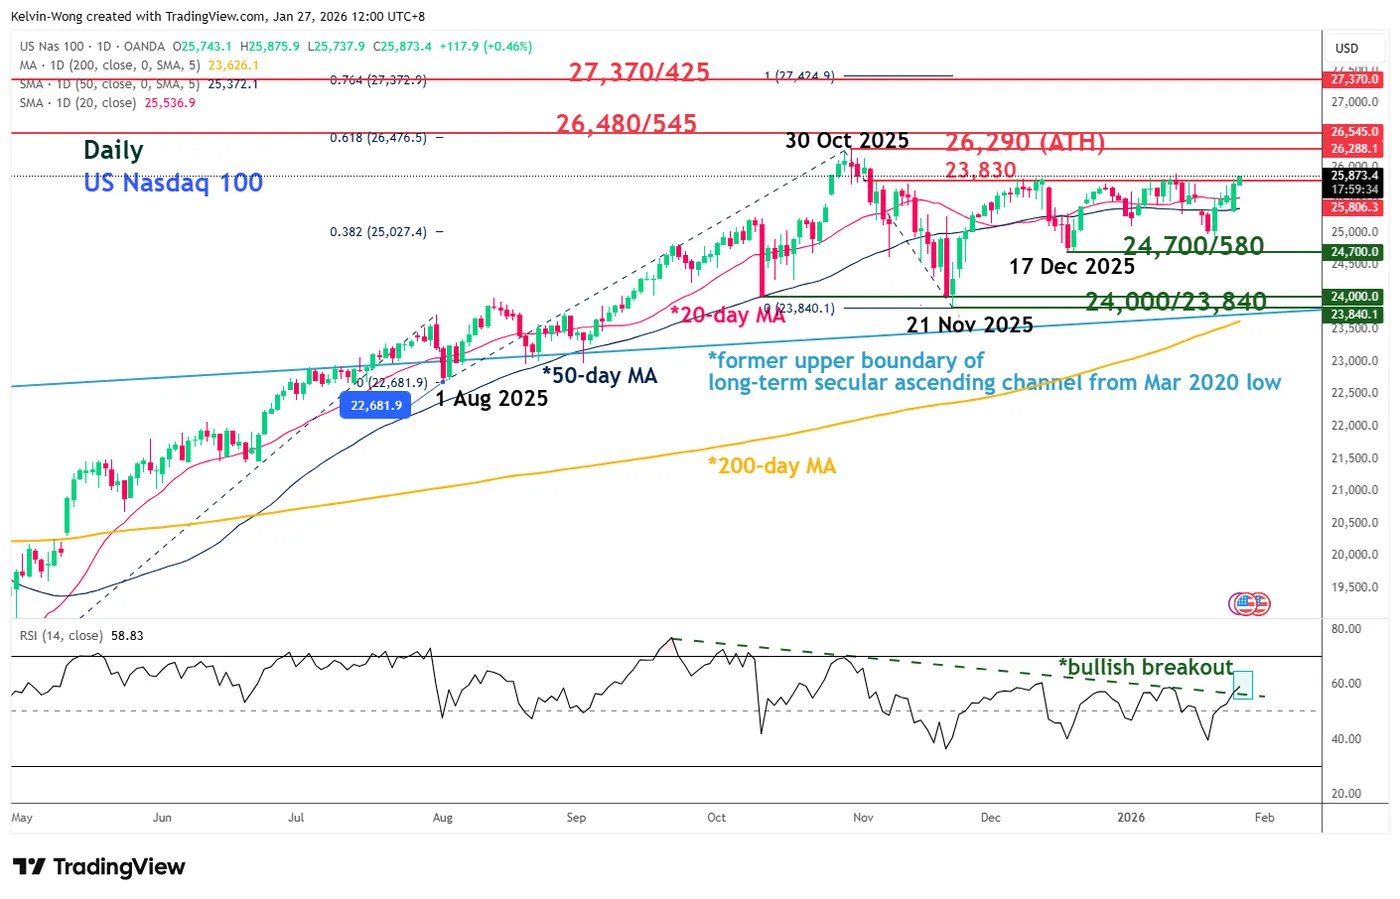
Fig. 3: US Nasdaq 100 CFD index medium-term trend as of 8 Jan 2026 (Source: TradingView)
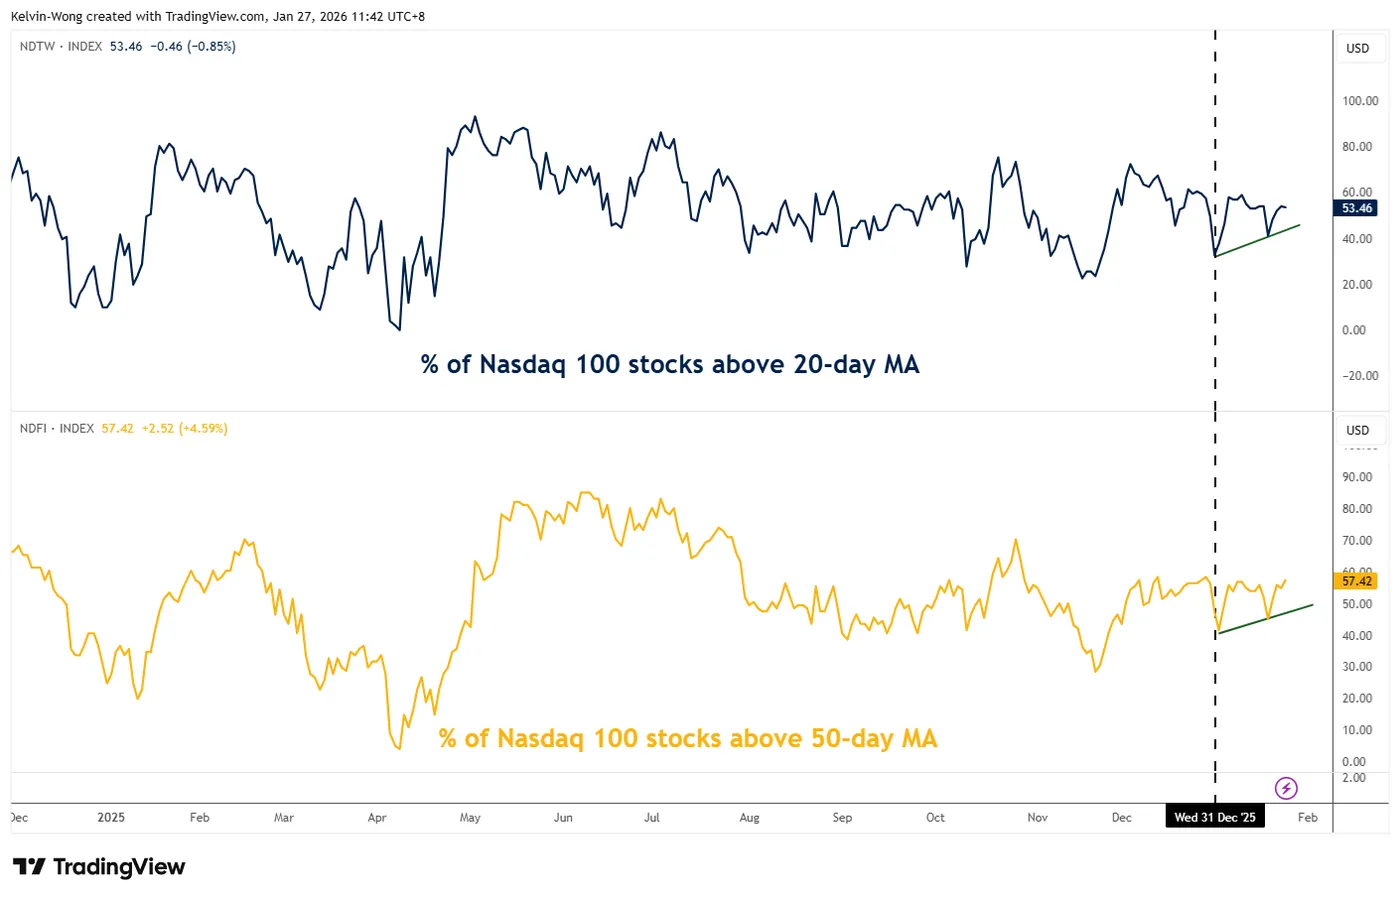
Fig. 4: % of Nasdaq 100 component stocks above 20-day MA & 50-day MA as of 26 Jan 2026 (Source: TradingView)
- The daily RSI momentum indicator of the US Nasdaq 100 CFD index has staged a bullish breakout above a key parallel descending trendline, which increases the odds of a price action bullish breakout from the 7-week range resistance of 23,830 (Fig. 3).
- Market breadth has improved considerably. Over the past month, the percentage of Nasdaq 100 component stocks that are trading above their respective 20-day moving averages has increased significantly from 33% on 31 December 2025 to 53% as of Monday, 26 January 2026. Similarly, the percentage of Nasdaq 100 component stocks that are trading above their respective 50-day moving averages jumped by 10 percentage points to 57% over the same period (Fig. 4).
US Dollar Index (DXY) on pace to break 97.00 – Why is the Dollar falling ahead of the FOMC?
The Dollar has taken quite a significant hit after its strong start to 2026.
This is precisely what happens when technicals align with changing fundamentals. As noted in our pre-Greenland chaos Analysis, the Dollar Index was already showing signs of imminent technical weakness.
So when Donald Trump decided not only to launch an investigation into Jerome Powell but also to threaten his historic allies, what was seen as a slow, progressive dedollarization quickly became a catastrophe for the US Dollar.
Some European funds are selling their Dollar-denominated debt assets in concern over new, aggressive policies from the current administration and, by actively seeking alternatives, reducing dollar demand – this is leading, in part, to the current decline.
Combined with a seasonal tendency for the US Dollar to drop ahead of interest rate decisions during cutting cycles, the weekly drop is getting extreme – fewer participants can absorb sudden outflows ahead of FOMC Meetings for risk-management reasons, amplifying such moves.
This dedollarization explains the ongoing run in Gold (which just hit $5,000 today) and other metals – The Debasement Trade for those unfamiliar with the trending financial term.
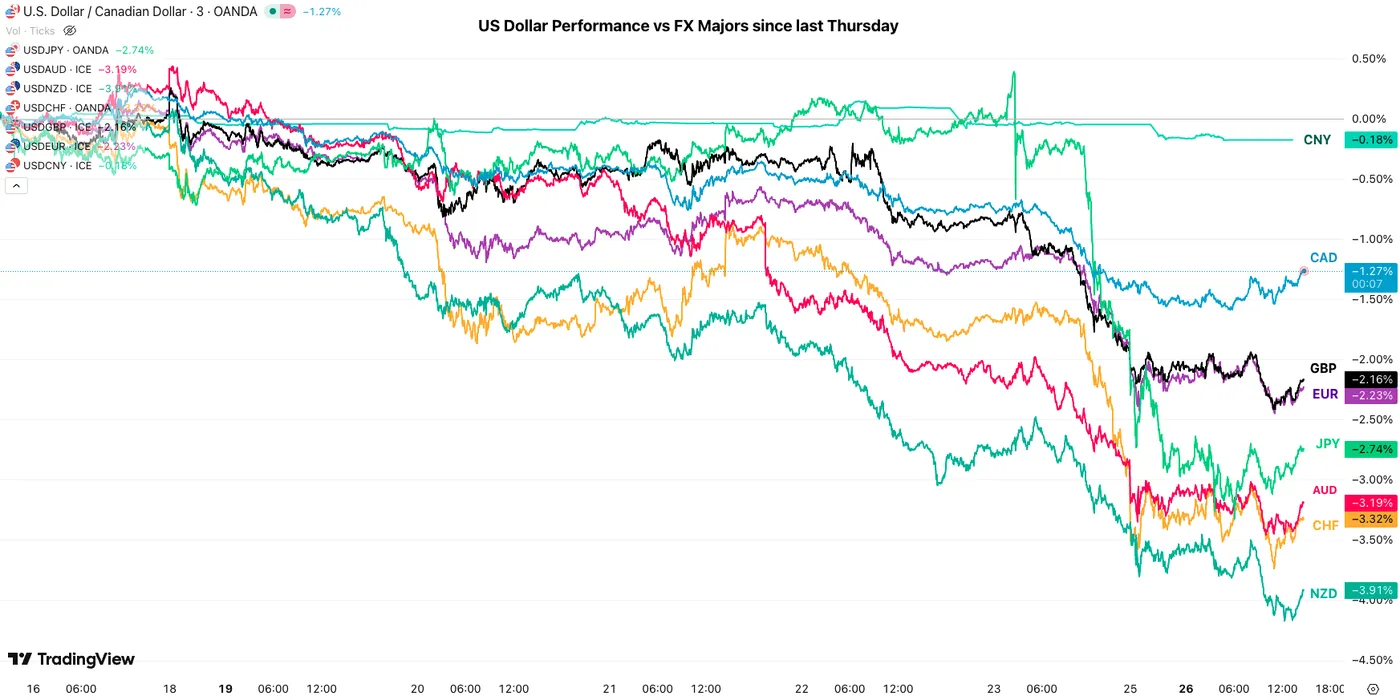
US Dollar Performance against other FX Majors since last Thursday – Source: TradingView
Looking back at the September cut, for example, the Dollar Index had reached 2025 yearly lows, a fast-paced selloff just two days ahead of the Rate Decision.
The current situation shows similar conditions, despite no rate cuts anticipated – What interests traders is whether the selloff will continue after the FOMC.
For additional foundational context, I strongly encourage you to explore our FOMC Preview.
With the Fed Funds rate expected to be kept unchanged, investors and institutions will be listening closely to Powell's speech.
A bit less than two rate cuts are currently priced for 2026. With labor conditions seemingly worsening only slightly and inflation remaining closer to 3% than 2% (despite some improvements), the Fed Chair doesn't have many reasons to turn dovish, but the current pricing is still reasonable.
Essentially, the more resilient US economy supports the Dollar and could lead to sudden inflows back into the Greenback after the meeting.
The difference maker will be found in unpredictable events:
- The nomination of the next Fed Chair could have a significant influence on the Dollar demand (particularly if Rick Rieder gets selected)
- If Trump moves to intervene in Iran, the Dollar should appreciate suddenly in pro-dollar risk-averse Market conditions – Kind of similar to what happened after Venezuela.
- If Trump actually pushes his intense rhetoric further with allies, however, the Dollar outflows will be severe – you would see the results in the Dollar Index flashing below 2025 lows.
- The FOMC event itself could support the USD but would depend on Powell's tone regarding his 2026 outlook.
While we're here, let's see what the charts say in our multi-timeframe analysis of the US Dollar Index (DXY) to see if there is still much left in the ongoing down move.
Dollar Index (DXY) Multi-Timeframe Analysis
Daily Chart
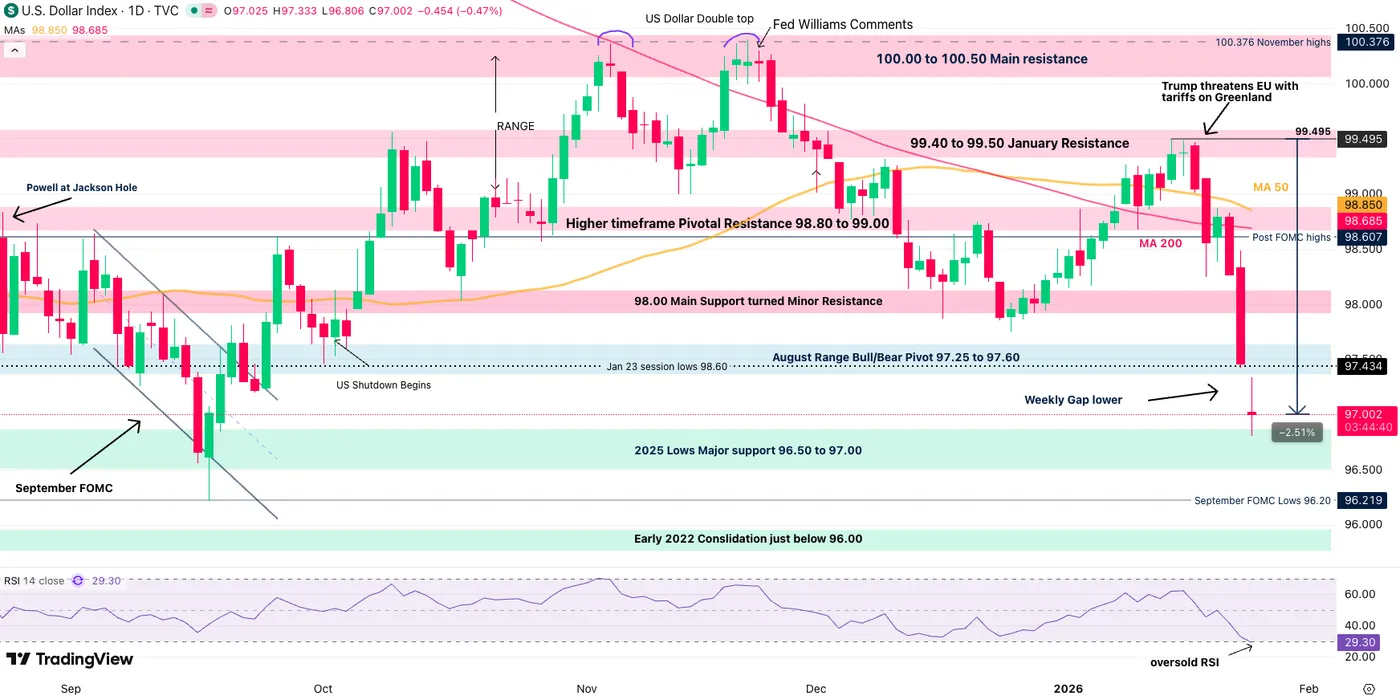
Dollar Index (DXY) Daily Chart. January 26, 2026 – Source: TradingView
The Technical picture changed suddenly over the past week.
Bulls were taking the Index back towards the 99.50 level but with some short-timeframe resistances, bear divergences combined with Trump actually pushing the Greenland theme, the fused technicals and fundamentals had an immediate effect on the DXY, down 2.50% until today.
Last week led to a huge gap lower today, with the pre-FOMC position closing effect pushing the Index to test the 96.50 to 97.00 Support.
Whether it holds or breaks in the next 1.5 sessions doesn't matter much; the most important will be to see if the Dollar remains above or below after the FOMC.
- Closing above 97.00 should lead to a slow but consistent rebound back towards 99.00
- Below however opens the door to test the 2025 lows
- These scenarios are not considering any black swan events.
4H Chart and Technical Levels
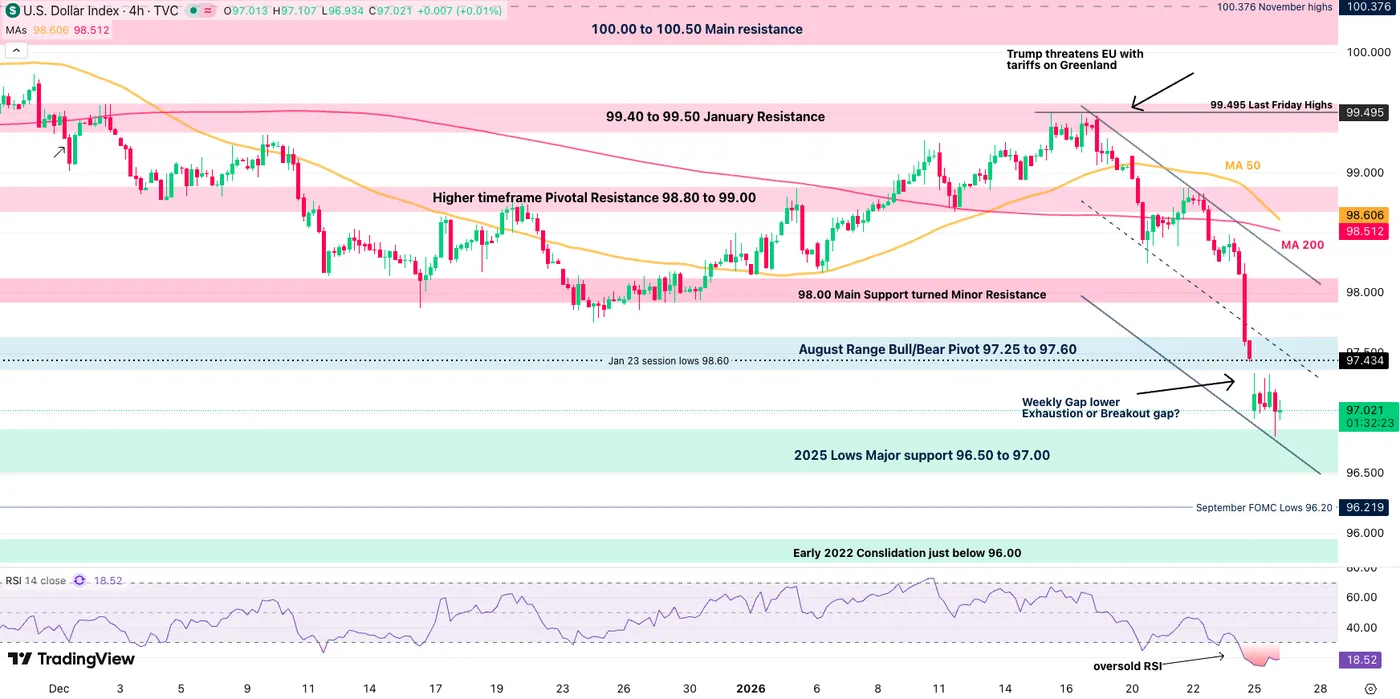
Dollar Index (DXY) 4H Chart. January 26, 2026 – Source: TradingView
Looking closer, the question remains whether the gap is an exhaustion/low volume gap (implying that an extreme is reached) or whether this is an actual runaway gap (meaning further downside).
To help tilt the scales, it is essential to track the path of least resistance.
With the 4H RSI in extreme oversold territory and a key support coming into effect, a rebound makes sense. The question is when.
Keep in mind that the buying could still not be so sudden as traders remain on the sidelines ahead of the key risk-events coming – Think of how such views could be expressed in different FX pairs.
Levels to place on your DXY charts:
Resistance Levels
- August Range Bull/Bear Pivot 97.25 to 97.60
- 98.00 Main Support turned Minor Resistance
- Higher timeframe Pivotal Resistance 98.80 to 99.00
- 99.40 to 99.50 January Resistance (last Friday levels)
- 100.376 November highs
Support Levels
- 2025 Lows Major support 96.50 to 97.00
- Session lows 96.80
- September FOMC Lows 96.20
- Early 2022 Consolidation just below 96.00
- 95.00 Main psychologic support
1H Chart
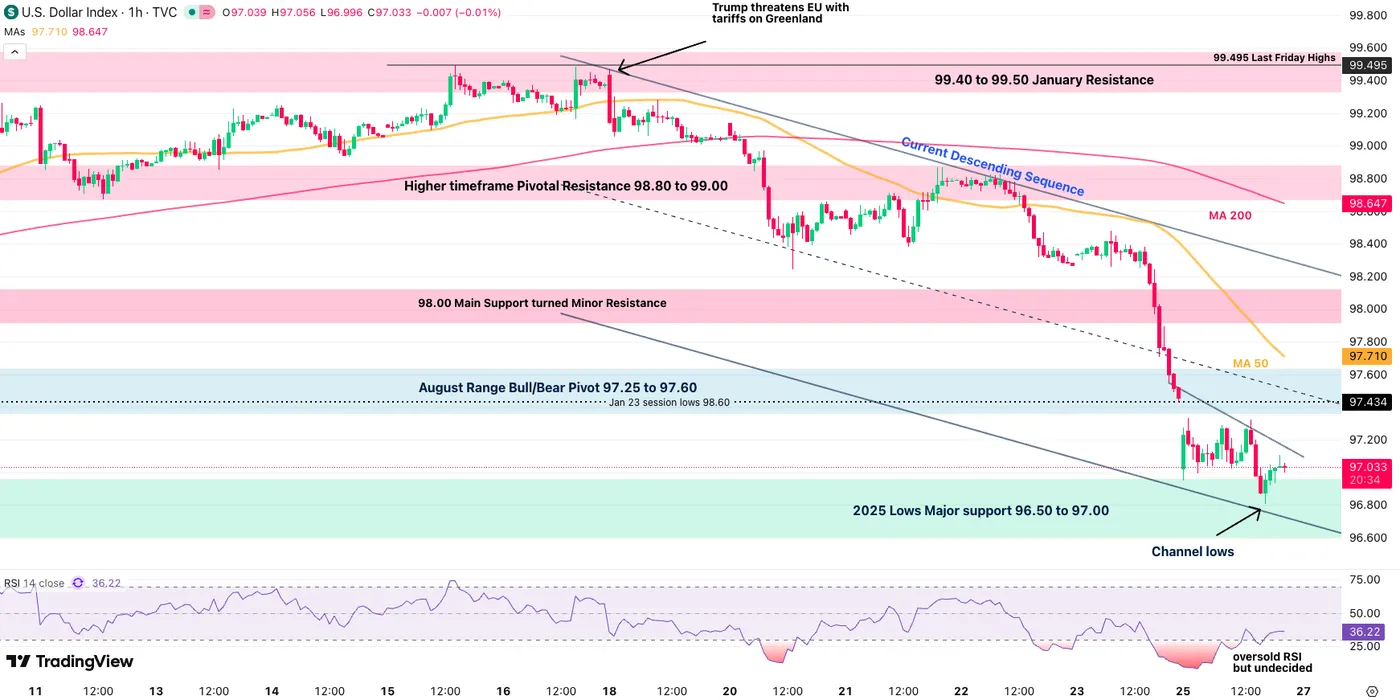
Dollar Index (DXY) 1H Chart. January 26, 2026 – Source: TradingView
Looking closer, one things looks clear – The downside is stalling after a brutal descent.
But a slowdown in a downtrend doesn't imply an imminent rebound, buyers will first have to show up.
With the selloff stalling at the descending channel lows, imminent downside keeps a lower probability setup.
Hence from here, a consolidation range until the FOMC between 96.80 and 97.30 is highly probable.
After the FOMC however, the rest will be to see if bulls show up for an upside breakout (to a least test the upper bound of the channel ~98.20).
In case they don't, the selloff may continue.
Safe Trades!
GBP/USD Rally Takes Breather, Upside Still In Play
Key Highlights
- GBP/USD gained bullish momentum for a move toward 1.3700.
- Bitcoin dipped below $88,000 and $87,000 before it found some support.
- USD/JPY nosedived below the key support at 155.50.
- Gold extended its surge to a new record high above $5,100.
GBP/USD Technical Analysis
The British Pound remained stable above 1.3450 against the US Dollar. GBP/USD started a strong increase above 1.3500 and 1.3550.
Looking at the 4-hour chart, the pair cleared many such as a bearish trend line, the 200 simple moving average (green, 4-hour), and the 100 simple moving average (red, 4-hour). The bulls even pumped the pair above 1.3620.
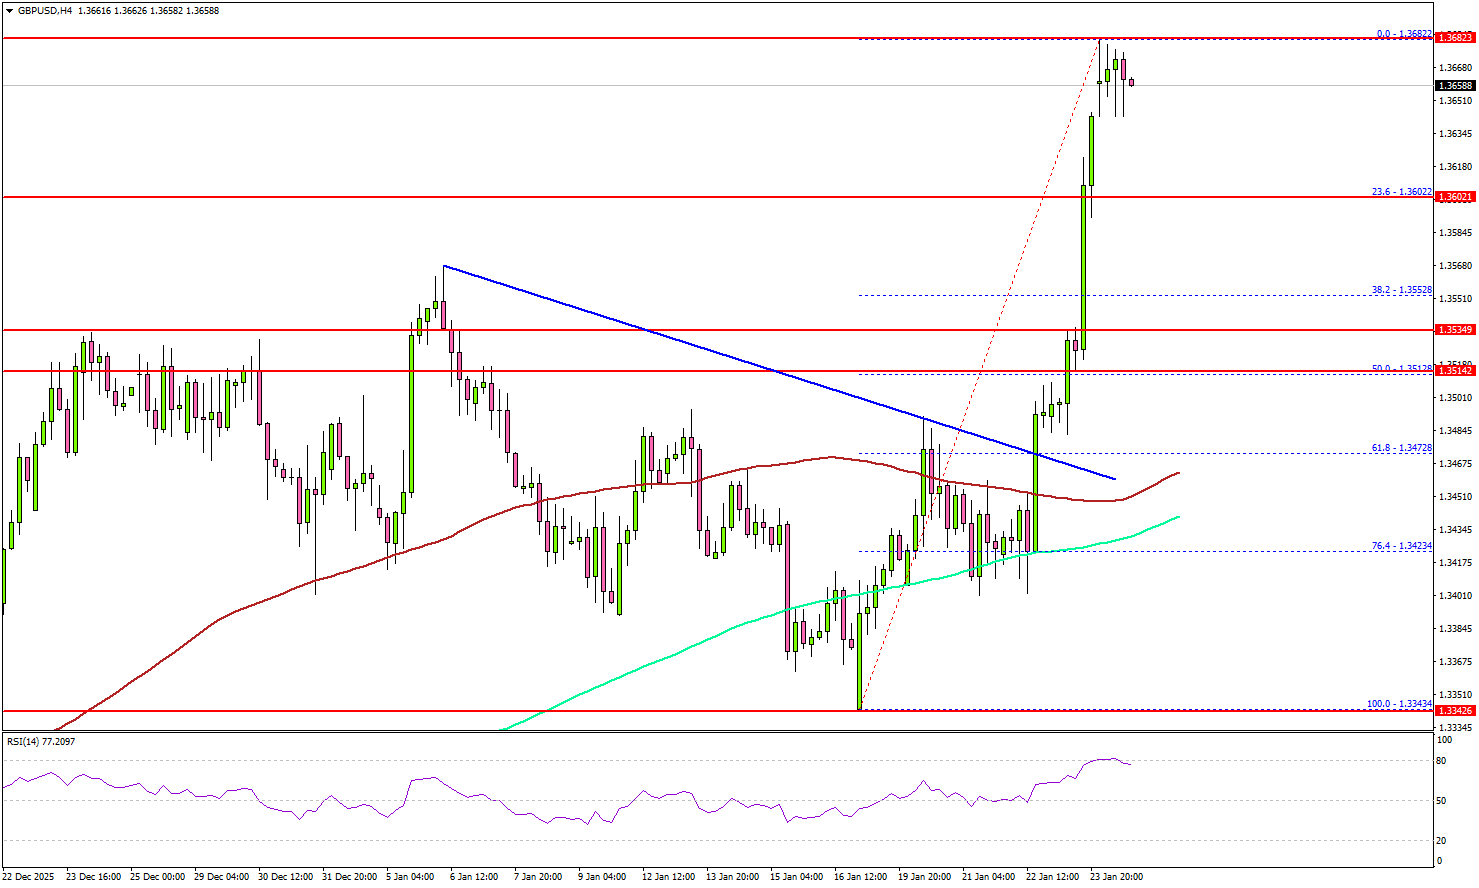
A high was formed at 1.3682, and the pair is now consolidating gains. Immediate resistance sits near 1.3680. The first key hurdle could be 1.3720. A close above 1.3720 could open the doors for a move toward 1.3800. Any more gains could set the pace for a steady increase toward 1.3880.
If there is no move above 1.3720, there could be a pullback. On the downside, immediate support is near the 1.3600 level. The first major area for the bulls might be near 1.3550.
The main support sits at 1.3520 and 1.3500, below which the pair could accelerate lower. The next support could be 1.3460 and the 100 simple moving average (red, 4-hour). Any more losses might call for a test of 1.3400.
Looking at Gold, the bulls remained in action and were able to pump the price to a new milestone record high above $5,100.
Upcoming Key Economic Events:
- US Housing Price Index for Nov 2025 (MoM) - Forecast +0.3%, versus +0.4% previous.
- ECB's Nagel speech.
- ECB's President Lagarde speech.